Barbadian vs Immigrants from Zimbabwe Single Mother Poverty
COMPARE
Barbadian
Immigrants from Zimbabwe
Single Mother Poverty
Single Mother Poverty Comparison
Barbadians
Immigrants from Zimbabwe
30.7%
SINGLE MOTHER POVERTY
1.3/ 100
METRIC RATING
245th/ 347
METRIC RANK
28.1%
SINGLE MOTHER POVERTY
95.5/ 100
METRIC RATING
108th/ 347
METRIC RANK
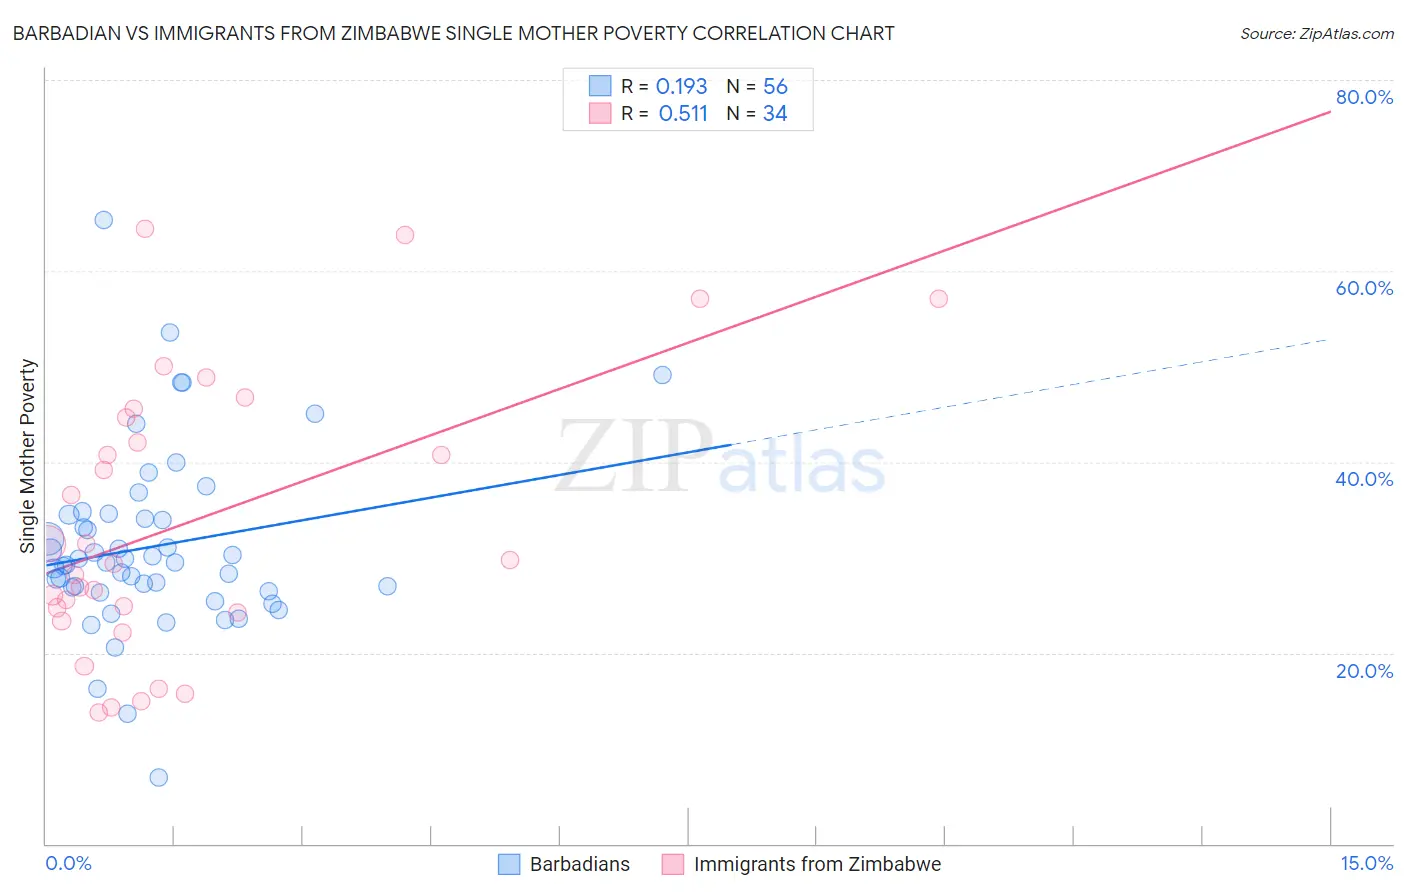
Barbadian vs Immigrants from Zimbabwe Single Mother Poverty Correlation Chart
The statistical analysis conducted on geographies consisting of 140,210,705 people shows a poor positive correlation between the proportion of Barbadians and poverty level among single mothers in the United States with a correlation coefficient (R) of 0.193 and weighted average of 30.7%. Similarly, the statistical analysis conducted on geographies consisting of 116,684,460 people shows a substantial positive correlation between the proportion of Immigrants from Zimbabwe and poverty level among single mothers in the United States with a correlation coefficient (R) of 0.511 and weighted average of 28.1%, a difference of 9.1%.
Single Mother Poverty Correlation Summary
| Measurement | Barbadian | Immigrants from Zimbabwe |
| Minimum | 6.9% | 13.8% |
| Maximum | 65.3% | 64.4% |
| Range | 58.4% | 50.6% |
| Mean | 31.1% | 33.7% |
| Median | 29.4% | 29.5% |
| Interquartile 25% (IQ1) | 26.6% | 24.3% |
| Interquartile 75% (IQ3) | 34.3% | 44.7% |
| Interquartile Range (IQR) | 7.6% | 20.4% |
| Standard Deviation (Sample) | 9.6% | 14.4% |
| Standard Deviation (Population) | 9.5% | 14.2% |
Similar Demographics by Single Mother Poverty
Demographics Similar to Barbadians by Single Mother Poverty
In terms of single mother poverty, the demographic groups most similar to Barbadians are French (30.7%, a difference of 0.010%), Bermudan (30.6%, a difference of 0.23%), Immigrants from Burma/Myanmar (30.6%, a difference of 0.31%), Immigrants from Laos (30.6%, a difference of 0.33%), and Salvadoran (30.6%, a difference of 0.38%).
| Demographics | Rating | Rank | Single Mother Poverty |
| Slovaks | 2.8 /100 | #238 | Tragic 30.4% |
| Immigrants | Portugal | 2.1 /100 | #239 | Tragic 30.5% |
| Salvadorans | 1.8 /100 | #240 | Tragic 30.6% |
| Immigrants | Laos | 1.8 /100 | #241 | Tragic 30.6% |
| Immigrants | Burma/Myanmar | 1.7 /100 | #242 | Tragic 30.6% |
| Bermudans | 1.6 /100 | #243 | Tragic 30.6% |
| French | 1.3 /100 | #244 | Tragic 30.7% |
| Barbadians | 1.3 /100 | #245 | Tragic 30.7% |
| Ecuadorians | 0.9 /100 | #246 | Tragic 30.8% |
| West Indians | 0.9 /100 | #247 | Tragic 30.8% |
| French Canadians | 0.9 /100 | #248 | Tragic 30.8% |
| Cape Verdeans | 0.8 /100 | #249 | Tragic 30.8% |
| Vietnamese | 0.7 /100 | #250 | Tragic 30.9% |
| Tlingit-Haida | 0.6 /100 | #251 | Tragic 30.9% |
| Alaska Natives | 0.6 /100 | #252 | Tragic 30.9% |
Demographics Similar to Immigrants from Zimbabwe by Single Mother Poverty
In terms of single mother poverty, the demographic groups most similar to Immigrants from Zimbabwe are Immigrants from Venezuela (28.1%, a difference of 0.080%), Immigrants from Armenia (28.1%, a difference of 0.090%), Croatian (28.2%, a difference of 0.21%), Venezuelan (28.2%, a difference of 0.26%), and Immigrants from Kazakhstan (28.2%, a difference of 0.28%).
| Demographics | Rating | Rank | Single Mother Poverty |
| Pakistanis | 96.9 /100 | #101 | Exceptional 28.0% |
| Immigrants | Croatia | 96.7 /100 | #102 | Exceptional 28.0% |
| Immigrants | Northern Africa | 96.6 /100 | #103 | Exceptional 28.0% |
| Italians | 96.6 /100 | #104 | Exceptional 28.0% |
| Israelis | 96.5 /100 | #105 | Exceptional 28.0% |
| Ukrainians | 96.4 /100 | #106 | Exceptional 28.0% |
| Immigrants | Venezuela | 95.8 /100 | #107 | Exceptional 28.1% |
| Immigrants | Zimbabwe | 95.5 /100 | #108 | Exceptional 28.1% |
| Immigrants | Armenia | 95.2 /100 | #109 | Exceptional 28.1% |
| Croatians | 94.8 /100 | #110 | Exceptional 28.2% |
| Venezuelans | 94.5 /100 | #111 | Exceptional 28.2% |
| Immigrants | Kazakhstan | 94.5 /100 | #112 | Exceptional 28.2% |
| Immigrants | South Africa | 93.2 /100 | #113 | Exceptional 28.3% |
| Immigrants | Western Asia | 92.7 /100 | #114 | Exceptional 28.3% |
| Immigrants | Kuwait | 92.7 /100 | #115 | Exceptional 28.3% |