Barbadian vs Hungarian Single Mother Poverty
COMPARE
Barbadian
Hungarian
Single Mother Poverty
Single Mother Poverty Comparison
Barbadians
Hungarians
30.7%
SINGLE MOTHER POVERTY
1.3/ 100
METRIC RATING
245th/ 347
METRIC RANK
29.9%
SINGLE MOTHER POVERTY
10.3/ 100
METRIC RATING
218th/ 347
METRIC RANK
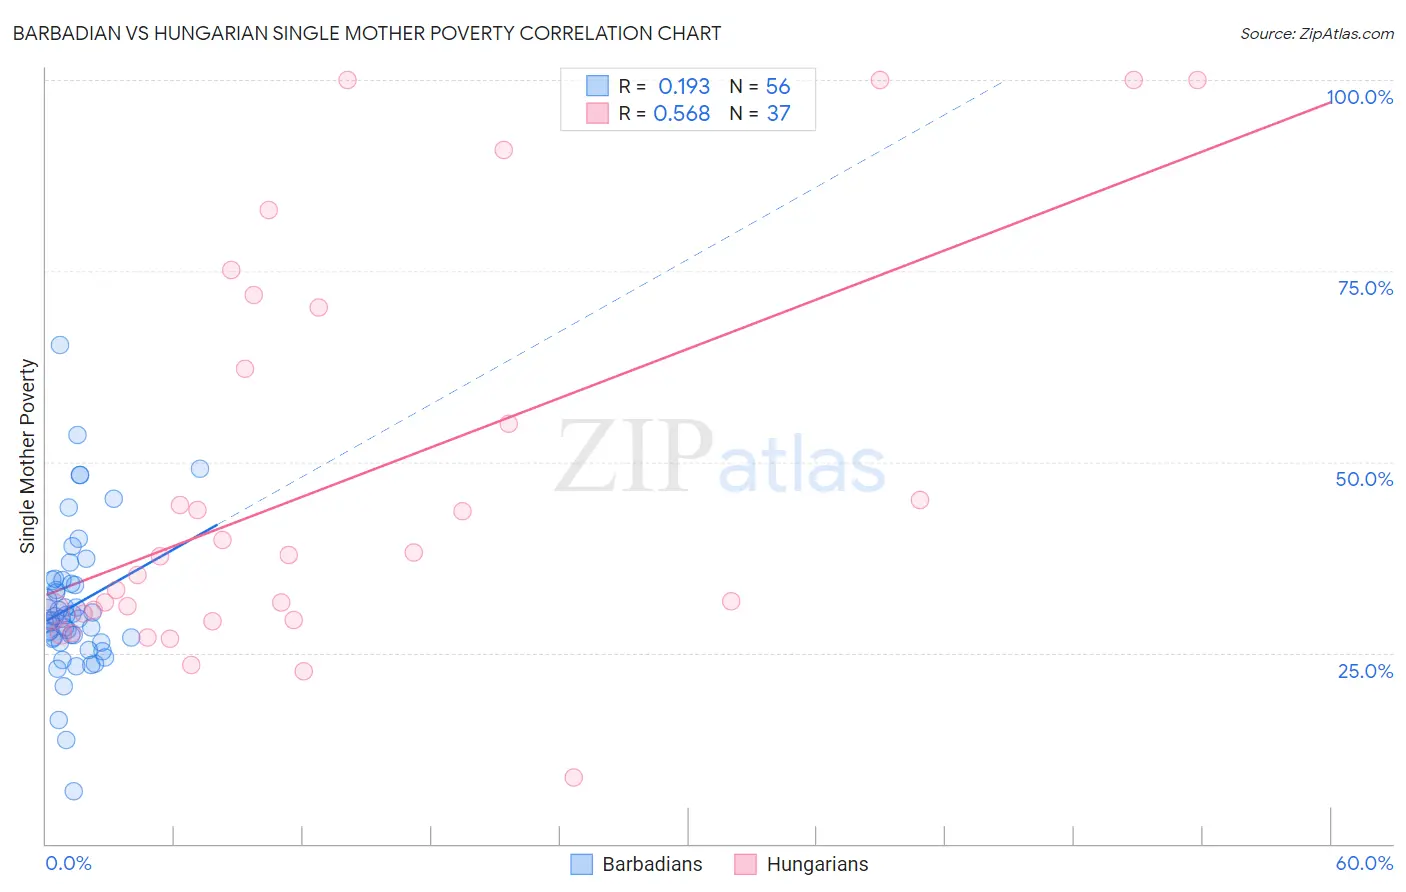
Barbadian vs Hungarian Single Mother Poverty Correlation Chart
The statistical analysis conducted on geographies consisting of 140,210,705 people shows a poor positive correlation between the proportion of Barbadians and poverty level among single mothers in the United States with a correlation coefficient (R) of 0.193 and weighted average of 30.7%. Similarly, the statistical analysis conducted on geographies consisting of 467,495,531 people shows a substantial positive correlation between the proportion of Hungarians and poverty level among single mothers in the United States with a correlation coefficient (R) of 0.568 and weighted average of 29.9%, a difference of 2.5%.
Single Mother Poverty Correlation Summary
| Measurement | Barbadian | Hungarian |
| Minimum | 6.9% | 8.6% |
| Maximum | 65.3% | 100.0% |
| Range | 58.4% | 91.4% |
| Mean | 31.1% | 47.2% |
| Median | 29.4% | 37.6% |
| Interquartile 25% (IQ1) | 26.6% | 29.7% |
| Interquartile 75% (IQ3) | 34.3% | 66.3% |
| Interquartile Range (IQR) | 7.6% | 36.6% |
| Standard Deviation (Sample) | 9.6% | 25.8% |
| Standard Deviation (Population) | 9.5% | 25.5% |
Similar Demographics by Single Mother Poverty
Demographics Similar to Barbadians by Single Mother Poverty
In terms of single mother poverty, the demographic groups most similar to Barbadians are French (30.7%, a difference of 0.010%), Bermudan (30.6%, a difference of 0.23%), Immigrants from Burma/Myanmar (30.6%, a difference of 0.31%), Immigrants from Laos (30.6%, a difference of 0.33%), and Salvadoran (30.6%, a difference of 0.38%).
| Demographics | Rating | Rank | Single Mother Poverty |
| Slovaks | 2.8 /100 | #238 | Tragic 30.4% |
| Immigrants | Portugal | 2.1 /100 | #239 | Tragic 30.5% |
| Salvadorans | 1.8 /100 | #240 | Tragic 30.6% |
| Immigrants | Laos | 1.8 /100 | #241 | Tragic 30.6% |
| Immigrants | Burma/Myanmar | 1.7 /100 | #242 | Tragic 30.6% |
| Bermudans | 1.6 /100 | #243 | Tragic 30.6% |
| French | 1.3 /100 | #244 | Tragic 30.7% |
| Barbadians | 1.3 /100 | #245 | Tragic 30.7% |
| Ecuadorians | 0.9 /100 | #246 | Tragic 30.8% |
| West Indians | 0.9 /100 | #247 | Tragic 30.8% |
| French Canadians | 0.9 /100 | #248 | Tragic 30.8% |
| Cape Verdeans | 0.8 /100 | #249 | Tragic 30.8% |
| Vietnamese | 0.7 /100 | #250 | Tragic 30.9% |
| Tlingit-Haida | 0.6 /100 | #251 | Tragic 30.9% |
| Alaska Natives | 0.6 /100 | #252 | Tragic 30.9% |
Demographics Similar to Hungarians by Single Mother Poverty
In terms of single mother poverty, the demographic groups most similar to Hungarians are Immigrants from Ghana (29.9%, a difference of 0.12%), Immigrants from Western Africa (29.9%, a difference of 0.14%), Finnish (30.0%, a difference of 0.14%), Liberian (29.9%, a difference of 0.16%), and Jamaican (29.9%, a difference of 0.16%).
| Demographics | Rating | Rank | Single Mother Poverty |
| Guyanese | 12.8 /100 | #211 | Poor 29.8% |
| Nicaraguans | 12.4 /100 | #212 | Poor 29.8% |
| Immigrants | Thailand | 12.0 /100 | #213 | Poor 29.9% |
| Liberians | 11.7 /100 | #214 | Poor 29.9% |
| Jamaicans | 11.7 /100 | #215 | Poor 29.9% |
| Immigrants | Western Africa | 11.5 /100 | #216 | Poor 29.9% |
| Immigrants | Ghana | 11.3 /100 | #217 | Poor 29.9% |
| Hungarians | 10.3 /100 | #218 | Poor 29.9% |
| Finns | 9.3 /100 | #219 | Tragic 30.0% |
| Germans | 8.8 /100 | #220 | Tragic 30.0% |
| Immigrants | Eritrea | 7.7 /100 | #221 | Tragic 30.0% |
| Sudanese | 7.6 /100 | #222 | Tragic 30.0% |
| Immigrants | Cuba | 6.9 /100 | #223 | Tragic 30.1% |
| Immigrants | Sudan | 6.5 /100 | #224 | Tragic 30.1% |
| Spanish | 6.3 /100 | #225 | Tragic 30.1% |