Australian vs Immigrants from Guatemala Female Poverty
COMPARE
Australian
Immigrants from Guatemala
Female Poverty
Female Poverty Comparison
Australians
Immigrants from Guatemala
12.5%
FEMALE POVERTY
95.2/ 100
METRIC RATING
97th/ 347
METRIC RANK
17.0%
FEMALE POVERTY
0.0/ 100
METRIC RATING
311th/ 347
METRIC RANK
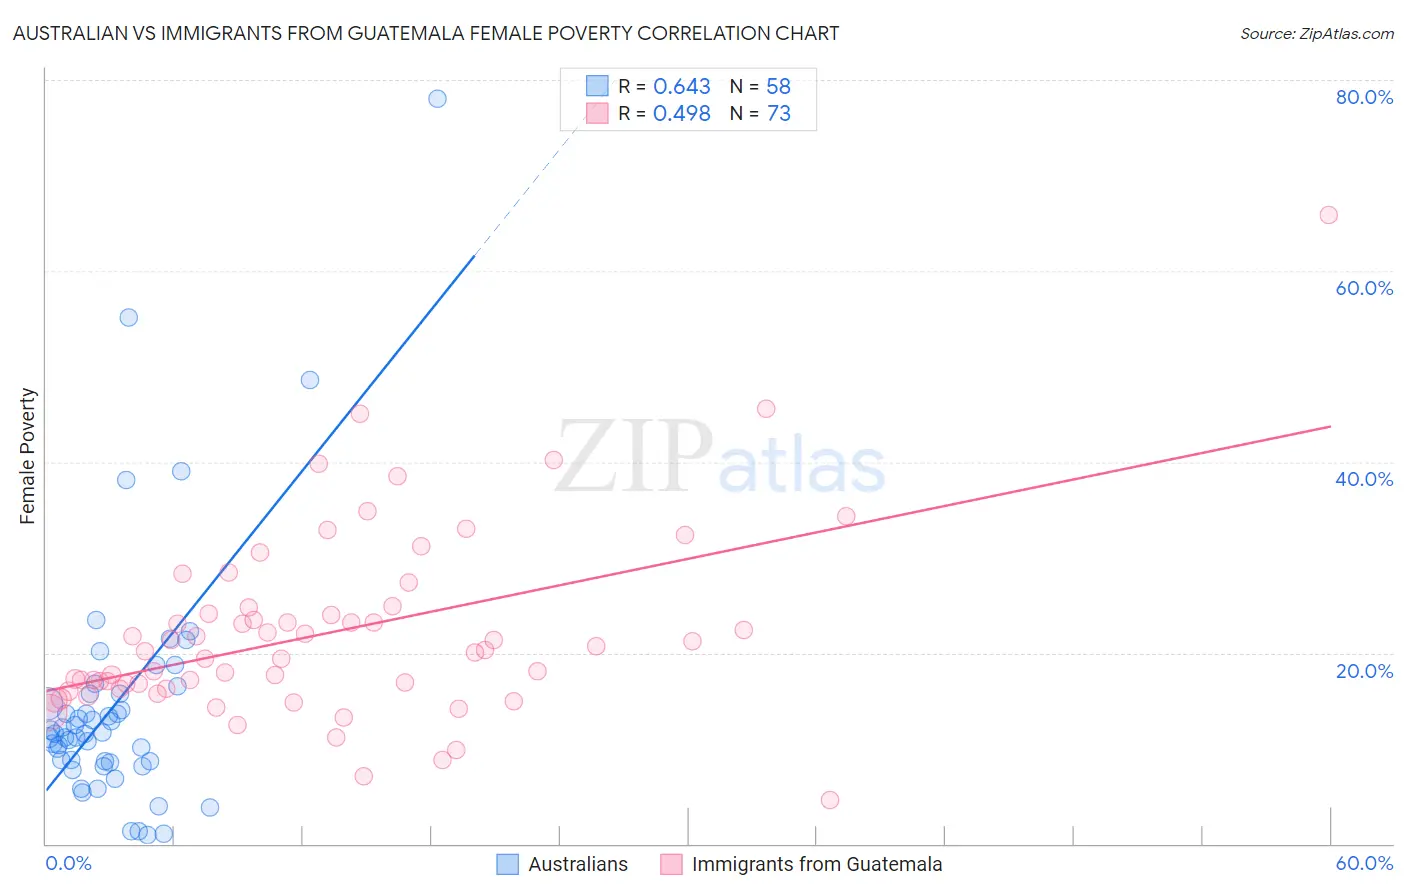
Australian vs Immigrants from Guatemala Female Poverty Correlation Chart
The statistical analysis conducted on geographies consisting of 223,990,985 people shows a significant positive correlation between the proportion of Australians and poverty level among females in the United States with a correlation coefficient (R) of 0.643 and weighted average of 12.5%. Similarly, the statistical analysis conducted on geographies consisting of 377,104,369 people shows a moderate positive correlation between the proportion of Immigrants from Guatemala and poverty level among females in the United States with a correlation coefficient (R) of 0.498 and weighted average of 17.0%, a difference of 36.3%.
Female Poverty Correlation Summary
| Measurement | Australian | Immigrants from Guatemala |
| Minimum | 0.92% | 4.6% |
| Maximum | 78.1% | 65.8% |
| Range | 77.2% | 61.2% |
| Mean | 14.9% | 22.1% |
| Median | 11.6% | 20.2% |
| Interquartile 25% (IQ1) | 8.6% | 16.3% |
| Interquartile 75% (IQ3) | 15.8% | 24.4% |
| Interquartile Range (IQR) | 7.1% | 8.2% |
| Standard Deviation (Sample) | 13.3% | 9.8% |
| Standard Deviation (Population) | 13.2% | 9.7% |
Similar Demographics by Female Poverty
Demographics Similar to Australians by Female Poverty
In terms of female poverty, the demographic groups most similar to Australians are Native Hawaiian (12.5%, a difference of 0.020%), British (12.5%, a difference of 0.030%), Romanian (12.5%, a difference of 0.050%), Immigrants from South Africa (12.5%, a difference of 0.10%), and Immigrants from Indonesia (12.5%, a difference of 0.14%).
| Demographics | Rating | Rank | Female Poverty |
| Immigrants | Denmark | 95.8 /100 | #90 | Exceptional 12.4% |
| Belgians | 95.8 /100 | #91 | Exceptional 12.4% |
| Czechoslovakians | 95.7 /100 | #92 | Exceptional 12.4% |
| Immigrants | Egypt | 95.5 /100 | #93 | Exceptional 12.5% |
| Immigrants | Indonesia | 95.4 /100 | #94 | Exceptional 12.5% |
| Immigrants | South Africa | 95.4 /100 | #95 | Exceptional 12.5% |
| British | 95.2 /100 | #96 | Exceptional 12.5% |
| Australians | 95.2 /100 | #97 | Exceptional 12.5% |
| Native Hawaiians | 95.1 /100 | #98 | Exceptional 12.5% |
| Romanians | 95.1 /100 | #99 | Exceptional 12.5% |
| Immigrants | Latvia | 94.8 /100 | #100 | Exceptional 12.5% |
| Tlingit-Haida | 94.8 /100 | #101 | Exceptional 12.5% |
| Immigrants | China | 94.5 /100 | #102 | Exceptional 12.5% |
| Slavs | 94.5 /100 | #103 | Exceptional 12.5% |
| Palestinians | 94.3 /100 | #104 | Exceptional 12.5% |
Demographics Similar to Immigrants from Guatemala by Female Poverty
In terms of female poverty, the demographic groups most similar to Immigrants from Guatemala are Creek (17.0%, a difference of 0.0%), Immigrants from Somalia (17.0%, a difference of 0.090%), British West Indian (17.0%, a difference of 0.17%), Immigrants from Mexico (17.0%, a difference of 0.24%), and Dutch West Indian (17.1%, a difference of 0.42%).
| Demographics | Rating | Rank | Female Poverty |
| Immigrants | Central America | 0.0 /100 | #304 | Tragic 16.8% |
| Immigrants | Grenada | 0.0 /100 | #305 | Tragic 16.8% |
| Immigrants | Caribbean | 0.0 /100 | #306 | Tragic 16.9% |
| Seminole | 0.0 /100 | #307 | Tragic 16.9% |
| Africans | 0.0 /100 | #308 | Tragic 16.9% |
| Immigrants | Mexico | 0.0 /100 | #309 | Tragic 17.0% |
| Creek | 0.0 /100 | #310 | Tragic 17.0% |
| Immigrants | Guatemala | 0.0 /100 | #311 | Tragic 17.0% |
| Immigrants | Somalia | 0.0 /100 | #312 | Tragic 17.0% |
| British West Indians | 0.0 /100 | #313 | Tragic 17.0% |
| Dutch West Indians | 0.0 /100 | #314 | Tragic 17.1% |
| U.S. Virgin Islanders | 0.0 /100 | #315 | Tragic 17.3% |
| Hondurans | 0.0 /100 | #316 | Tragic 17.4% |
| Immigrants | Congo | 0.0 /100 | #317 | Tragic 17.4% |
| Ute | 0.0 /100 | #318 | Tragic 17.5% |