Icelander vs Immigrants from Guatemala Female Poverty
COMPARE
Icelander
Immigrants from Guatemala
Female Poverty
Female Poverty Comparison
Icelanders
Immigrants from Guatemala
13.0%
FEMALE POVERTY
81.1/ 100
METRIC RATING
141st/ 347
METRIC RANK
17.0%
FEMALE POVERTY
0.0/ 100
METRIC RATING
311th/ 347
METRIC RANK
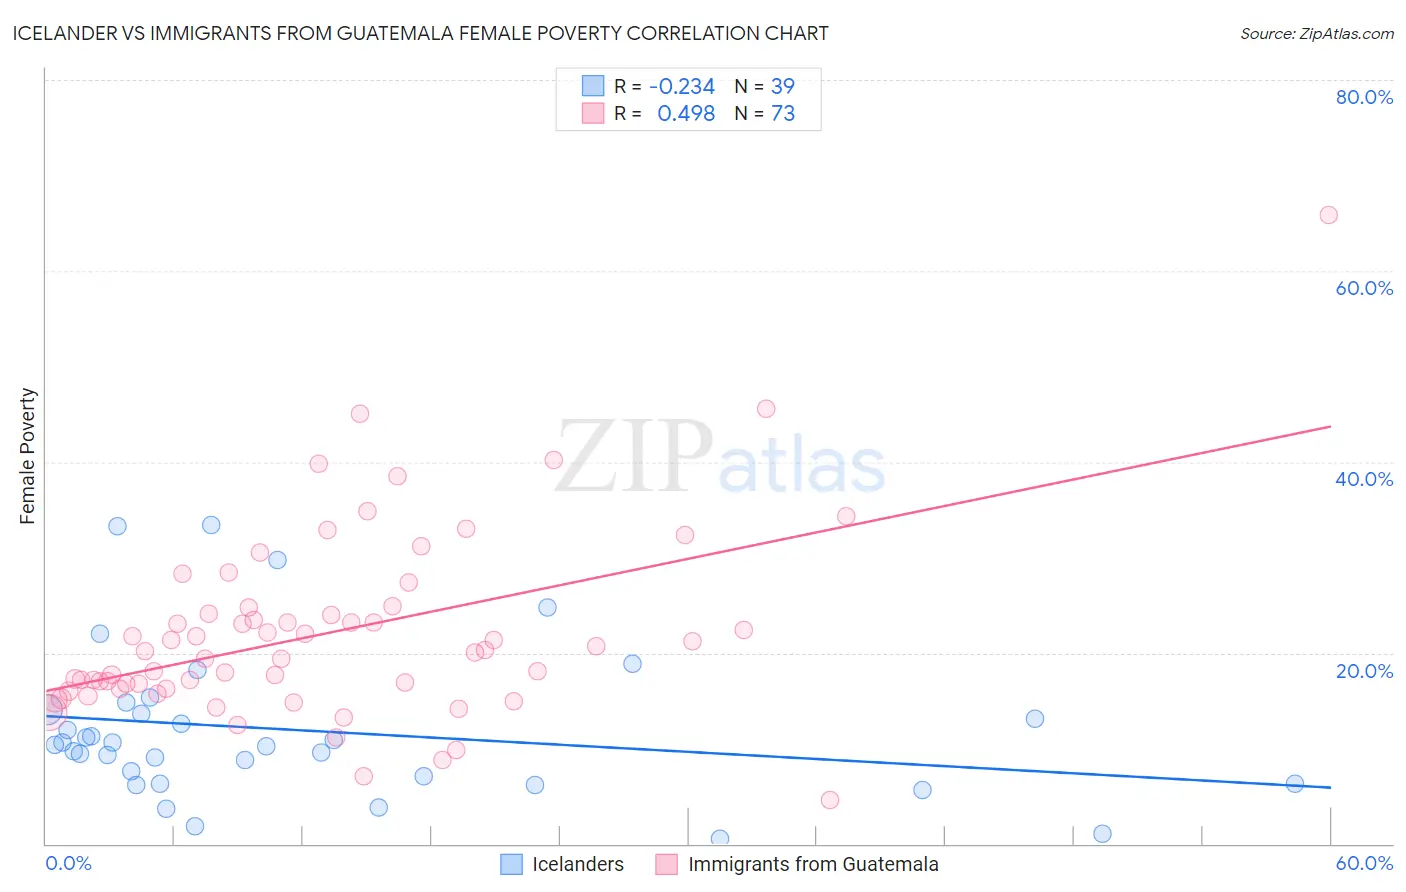
Icelander vs Immigrants from Guatemala Female Poverty Correlation Chart
The statistical analysis conducted on geographies consisting of 159,608,280 people shows a weak negative correlation between the proportion of Icelanders and poverty level among females in the United States with a correlation coefficient (R) of -0.234 and weighted average of 13.0%. Similarly, the statistical analysis conducted on geographies consisting of 377,104,369 people shows a moderate positive correlation between the proportion of Immigrants from Guatemala and poverty level among females in the United States with a correlation coefficient (R) of 0.498 and weighted average of 17.0%, a difference of 31.1%.
Female Poverty Correlation Summary
| Measurement | Icelander | Immigrants from Guatemala |
| Minimum | 0.47% | 4.6% |
| Maximum | 33.3% | 65.8% |
| Range | 32.9% | 61.2% |
| Mean | 11.8% | 22.1% |
| Median | 10.4% | 20.2% |
| Interquartile 25% (IQ1) | 6.2% | 16.3% |
| Interquartile 75% (IQ3) | 14.1% | 24.4% |
| Interquartile Range (IQR) | 7.8% | 8.2% |
| Standard Deviation (Sample) | 7.9% | 9.8% |
| Standard Deviation (Population) | 7.8% | 9.7% |
Similar Demographics by Female Poverty
Demographics Similar to Icelanders by Female Poverty
In terms of female poverty, the demographic groups most similar to Icelanders are Brazilian (13.0%, a difference of 0.10%), Immigrants from Malaysia (13.0%, a difference of 0.12%), Afghan (13.0%, a difference of 0.21%), Syrian (13.0%, a difference of 0.24%), and Immigrants from Peru (13.0%, a difference of 0.31%).
| Demographics | Rating | Rank | Female Poverty |
| Immigrants | Switzerland | 85.8 /100 | #134 | Excellent 12.9% |
| French | 85.6 /100 | #135 | Excellent 12.9% |
| Peruvians | 85.2 /100 | #136 | Excellent 12.9% |
| Chileans | 84.7 /100 | #137 | Excellent 12.9% |
| Immigrants | France | 83.6 /100 | #138 | Excellent 12.9% |
| Basques | 83.1 /100 | #139 | Excellent 12.9% |
| Pakistanis | 83.0 /100 | #140 | Excellent 12.9% |
| Icelanders | 81.1 /100 | #141 | Excellent 13.0% |
| Brazilians | 80.5 /100 | #142 | Excellent 13.0% |
| Immigrants | Malaysia | 80.4 /100 | #143 | Excellent 13.0% |
| Afghans | 79.8 /100 | #144 | Good 13.0% |
| Syrians | 79.6 /100 | #145 | Good 13.0% |
| Immigrants | Peru | 79.1 /100 | #146 | Good 13.0% |
| Immigrants | Kazakhstan | 78.6 /100 | #147 | Good 13.0% |
| Yugoslavians | 76.9 /100 | #148 | Good 13.1% |
Demographics Similar to Immigrants from Guatemala by Female Poverty
In terms of female poverty, the demographic groups most similar to Immigrants from Guatemala are Creek (17.0%, a difference of 0.0%), Immigrants from Somalia (17.0%, a difference of 0.090%), British West Indian (17.0%, a difference of 0.17%), Immigrants from Mexico (17.0%, a difference of 0.24%), and Dutch West Indian (17.1%, a difference of 0.42%).
| Demographics | Rating | Rank | Female Poverty |
| Immigrants | Central America | 0.0 /100 | #304 | Tragic 16.8% |
| Immigrants | Grenada | 0.0 /100 | #305 | Tragic 16.8% |
| Immigrants | Caribbean | 0.0 /100 | #306 | Tragic 16.9% |
| Seminole | 0.0 /100 | #307 | Tragic 16.9% |
| Africans | 0.0 /100 | #308 | Tragic 16.9% |
| Immigrants | Mexico | 0.0 /100 | #309 | Tragic 17.0% |
| Creek | 0.0 /100 | #310 | Tragic 17.0% |
| Immigrants | Guatemala | 0.0 /100 | #311 | Tragic 17.0% |
| Immigrants | Somalia | 0.0 /100 | #312 | Tragic 17.0% |
| British West Indians | 0.0 /100 | #313 | Tragic 17.0% |
| Dutch West Indians | 0.0 /100 | #314 | Tragic 17.1% |
| U.S. Virgin Islanders | 0.0 /100 | #315 | Tragic 17.3% |
| Hondurans | 0.0 /100 | #316 | Tragic 17.4% |
| Immigrants | Congo | 0.0 /100 | #317 | Tragic 17.4% |
| Ute | 0.0 /100 | #318 | Tragic 17.5% |