Australian vs Northern European Female Poverty
COMPARE
Australian
Northern European
Female Poverty
Female Poverty Comparison
Australians
Northern Europeans
12.5%
FEMALE POVERTY
95.2/ 100
METRIC RATING
97th/ 347
METRIC RANK
12.4%
FEMALE POVERTY
96.6/ 100
METRIC RATING
84th/ 347
METRIC RANK
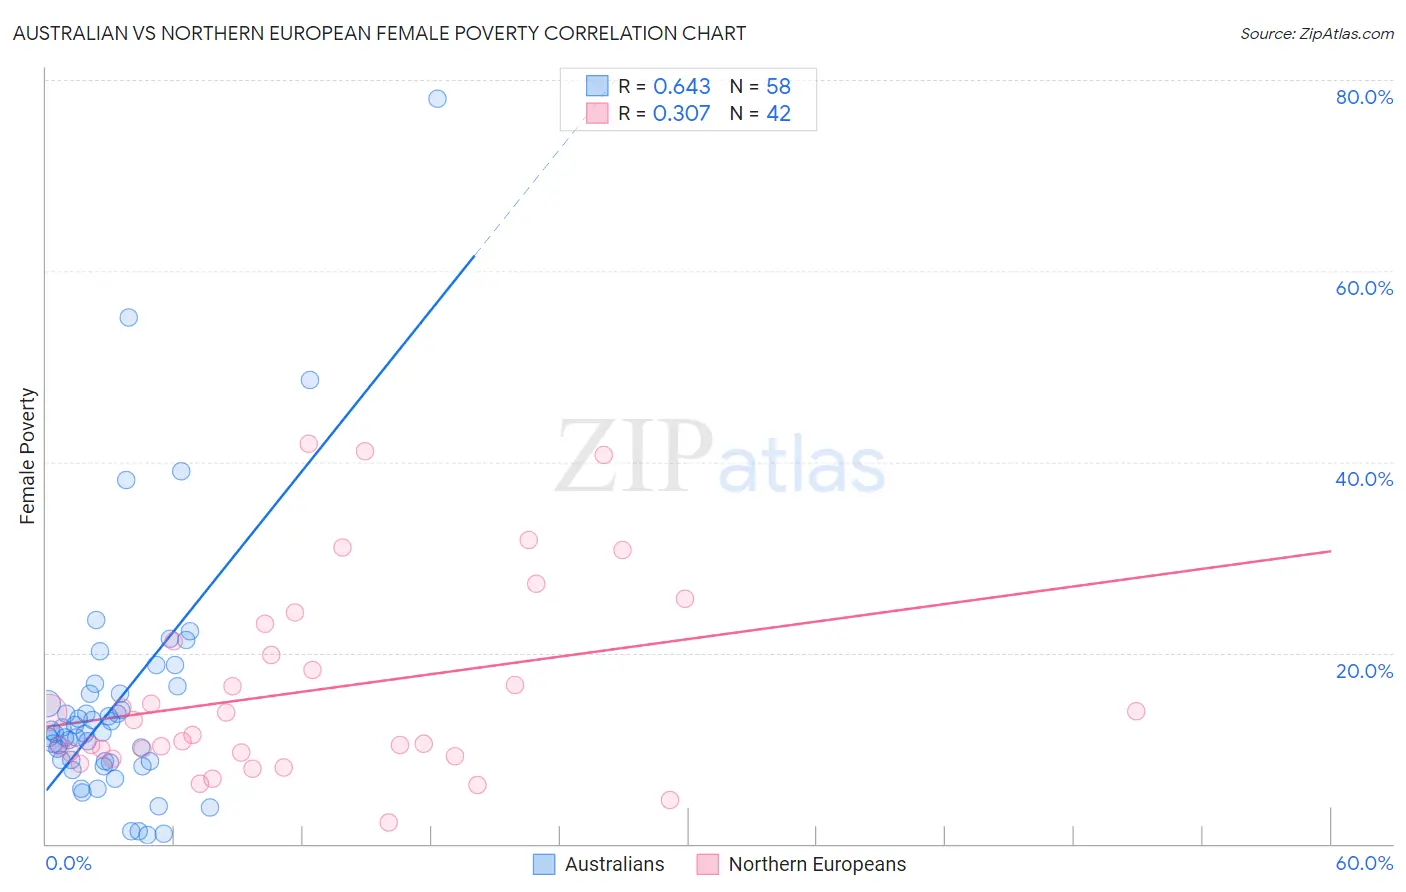
Australian vs Northern European Female Poverty Correlation Chart
The statistical analysis conducted on geographies consisting of 223,990,985 people shows a significant positive correlation between the proportion of Australians and poverty level among females in the United States with a correlation coefficient (R) of 0.643 and weighted average of 12.5%. Similarly, the statistical analysis conducted on geographies consisting of 405,818,739 people shows a mild positive correlation between the proportion of Northern Europeans and poverty level among females in the United States with a correlation coefficient (R) of 0.307 and weighted average of 12.4%, a difference of 0.94%.
Female Poverty Correlation Summary
| Measurement | Australian | Northern European |
| Minimum | 0.92% | 2.2% |
| Maximum | 78.1% | 41.9% |
| Range | 77.2% | 39.7% |
| Mean | 14.9% | 16.1% |
| Median | 11.6% | 12.1% |
| Interquartile 25% (IQ1) | 8.6% | 9.5% |
| Interquartile 75% (IQ3) | 15.8% | 21.2% |
| Interquartile Range (IQR) | 7.1% | 11.6% |
| Standard Deviation (Sample) | 13.3% | 10.2% |
| Standard Deviation (Population) | 13.2% | 10.1% |
Demographics Similar to Australians and Northern Europeans by Female Poverty
In terms of female poverty, the demographic groups most similar to Australians are Native Hawaiian (12.5%, a difference of 0.020%), British (12.5%, a difference of 0.030%), Romanian (12.5%, a difference of 0.050%), Immigrants from South Africa (12.5%, a difference of 0.10%), and Immigrants from Indonesia (12.5%, a difference of 0.14%). Similarly, the demographic groups most similar to Northern Europeans are Irish (12.4%, a difference of 0.050%), Dutch (12.4%, a difference of 0.080%), Okinawan (12.4%, a difference of 0.10%), Finnish (12.4%, a difference of 0.15%), and Immigrants from England (12.3%, a difference of 0.23%).
| Demographics | Rating | Rank | Female Poverty |
| Slovaks | 97.1 /100 | #80 | Exceptional 12.3% |
| Immigrants | Sweden | 97.1 /100 | #81 | Exceptional 12.3% |
| Jordanians | 97.1 /100 | #82 | Exceptional 12.3% |
| Immigrants | England | 96.9 /100 | #83 | Exceptional 12.3% |
| Northern Europeans | 96.6 /100 | #84 | Exceptional 12.4% |
| Irish | 96.5 /100 | #85 | Exceptional 12.4% |
| Dutch | 96.5 /100 | #86 | Exceptional 12.4% |
| Okinawans | 96.4 /100 | #87 | Exceptional 12.4% |
| Finns | 96.4 /100 | #88 | Exceptional 12.4% |
| English | 96.1 /100 | #89 | Exceptional 12.4% |
| Immigrants | Denmark | 95.8 /100 | #90 | Exceptional 12.4% |
| Belgians | 95.8 /100 | #91 | Exceptional 12.4% |
| Czechoslovakians | 95.7 /100 | #92 | Exceptional 12.4% |
| Immigrants | Egypt | 95.5 /100 | #93 | Exceptional 12.5% |
| Immigrants | Indonesia | 95.4 /100 | #94 | Exceptional 12.5% |
| Immigrants | South Africa | 95.4 /100 | #95 | Exceptional 12.5% |
| British | 95.2 /100 | #96 | Exceptional 12.5% |
| Australians | 95.2 /100 | #97 | Exceptional 12.5% |
| Native Hawaiians | 95.1 /100 | #98 | Exceptional 12.5% |
| Romanians | 95.1 /100 | #99 | Exceptional 12.5% |
| Immigrants | Latvia | 94.8 /100 | #100 | Exceptional 12.5% |