Australian vs Immigrants from Guatemala Unemployment Among Women with Children Ages 6 to 17 years
COMPARE
Australian
Immigrants from Guatemala
Unemployment Among Women with Children Ages 6 to 17 years
Unemployment Among Women with Children Ages 6 to 17 years Comparison
Australians
Immigrants from Guatemala
8.5%
UNEMPLOYMENT AMONG WOMEN WITH CHILDREN AGES 6 TO 17 YEARS
98.9/ 100
METRIC RATING
93rd/ 347
METRIC RANK
9.4%
UNEMPLOYMENT AMONG WOMEN WITH CHILDREN AGES 6 TO 17 YEARS
1.3/ 100
METRIC RATING
250th/ 347
METRIC RANK
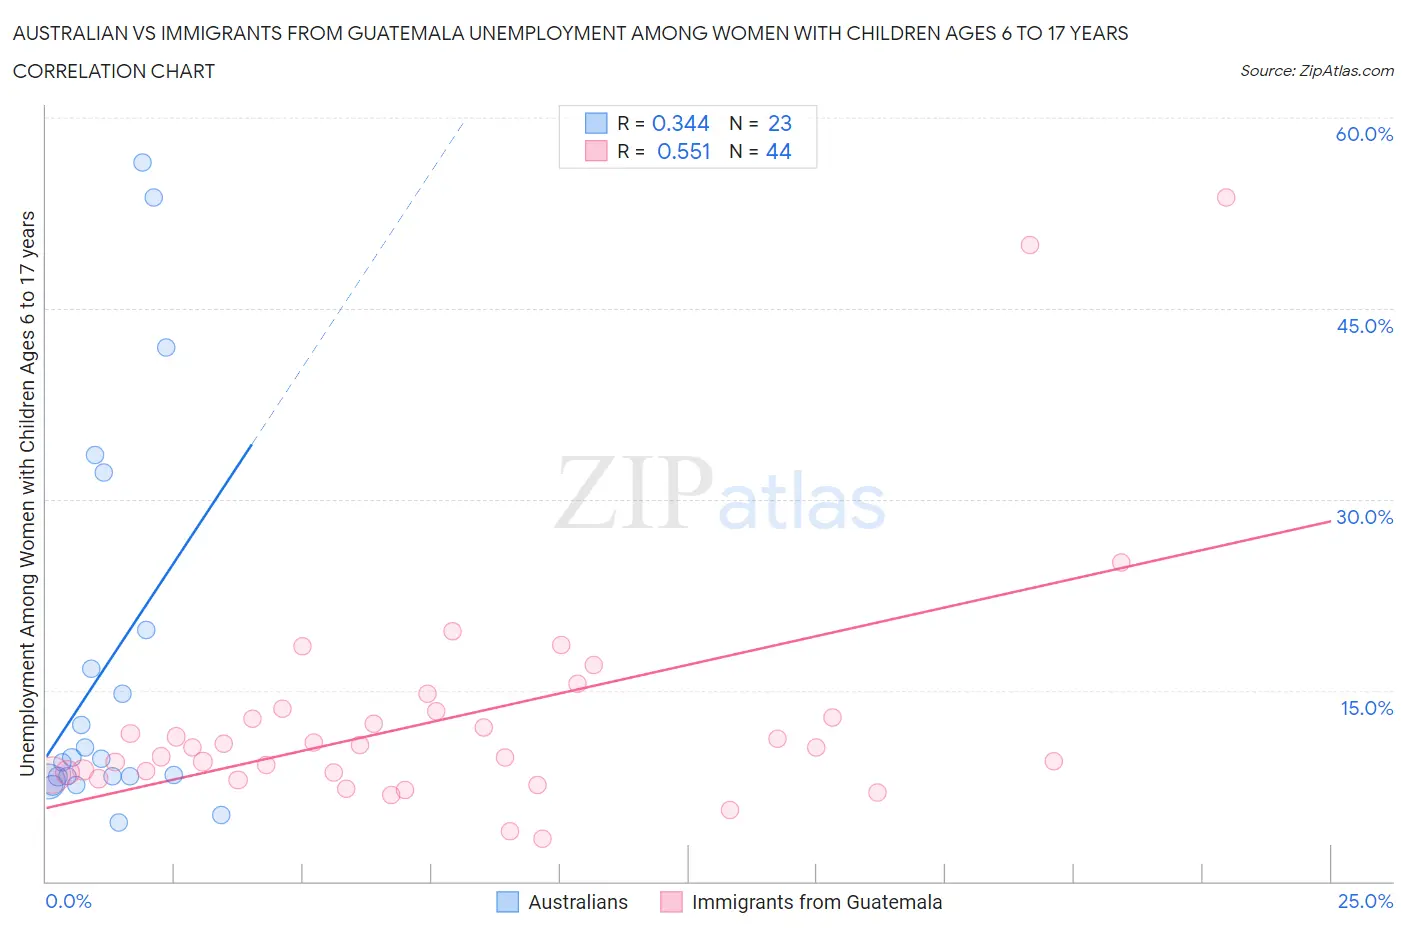
Australian vs Immigrants from Guatemala Unemployment Among Women with Children Ages 6 to 17 years Correlation Chart
The statistical analysis conducted on geographies consisting of 174,001,217 people shows a mild positive correlation between the proportion of Australians and unemployment rate among women with children between the ages 6 and 17 in the United States with a correlation coefficient (R) of 0.344 and weighted average of 8.5%. Similarly, the statistical analysis conducted on geographies consisting of 280,581,568 people shows a substantial positive correlation between the proportion of Immigrants from Guatemala and unemployment rate among women with children between the ages 6 and 17 in the United States with a correlation coefficient (R) of 0.551 and weighted average of 9.4%, a difference of 10.2%.
Unemployment Among Women with Children Ages 6 to 17 years Correlation Summary
| Measurement | Australian | Immigrants from Guatemala |
| Minimum | 4.6% | 3.3% |
| Maximum | 56.5% | 53.7% |
| Range | 51.9% | 50.4% |
| Mean | 17.1% | 12.8% |
| Median | 9.6% | 10.5% |
| Interquartile 25% (IQ1) | 8.2% | 8.4% |
| Interquartile 75% (IQ3) | 19.7% | 13.1% |
| Interquartile Range (IQR) | 11.5% | 4.7% |
| Standard Deviation (Sample) | 15.4% | 9.6% |
| Standard Deviation (Population) | 15.0% | 9.5% |
Similar Demographics by Unemployment Among Women with Children Ages 6 to 17 years
Demographics Similar to Australians by Unemployment Among Women with Children Ages 6 to 17 years
In terms of unemployment among women with children ages 6 to 17 years, the demographic groups most similar to Australians are Immigrants from Barbados (8.5%, a difference of 0.11%), Potawatomi (8.5%, a difference of 0.12%), Immigrants from Eastern Europe (8.5%, a difference of 0.14%), Sri Lankan (8.5%, a difference of 0.16%), and Yugoslavian (8.5%, a difference of 0.21%).
| Demographics | Rating | Rank | Unemployment Among Women with Children Ages 6 to 17 years |
| Alaskan Athabascans | 99.4 /100 | #86 | Exceptional 8.5% |
| Immigrants | Israel | 99.1 /100 | #87 | Exceptional 8.5% |
| Immigrants | Vietnam | 99.1 /100 | #88 | Exceptional 8.5% |
| Paiute | 99.1 /100 | #89 | Exceptional 8.5% |
| Yugoslavians | 99.0 /100 | #90 | Exceptional 8.5% |
| Immigrants | Eastern Europe | 99.0 /100 | #91 | Exceptional 8.5% |
| Potawatomi | 99.0 /100 | #92 | Exceptional 8.5% |
| Australians | 98.9 /100 | #93 | Exceptional 8.5% |
| Immigrants | Barbados | 98.8 /100 | #94 | Exceptional 8.5% |
| Sri Lankans | 98.7 /100 | #95 | Exceptional 8.5% |
| German Russians | 98.6 /100 | #96 | Exceptional 8.5% |
| Bolivians | 98.5 /100 | #97 | Exceptional 8.5% |
| Malaysians | 98.5 /100 | #98 | Exceptional 8.6% |
| Immigrants | Lithuania | 98.4 /100 | #99 | Exceptional 8.6% |
| New Zealanders | 98.4 /100 | #100 | Exceptional 8.6% |
Demographics Similar to Immigrants from Guatemala by Unemployment Among Women with Children Ages 6 to 17 years
In terms of unemployment among women with children ages 6 to 17 years, the demographic groups most similar to Immigrants from Guatemala are Central American (9.4%, a difference of 0.020%), Immigrants from South America (9.4%, a difference of 0.090%), Dutch (9.4%, a difference of 0.10%), Creek (9.4%, a difference of 0.11%), and Polish (9.4%, a difference of 0.14%).
| Demographics | Rating | Rank | Unemployment Among Women with Children Ages 6 to 17 years |
| Scottish | 2.0 /100 | #243 | Tragic 9.4% |
| English | 1.9 /100 | #244 | Tragic 9.4% |
| Immigrants | Cameroon | 1.8 /100 | #245 | Tragic 9.4% |
| Immigrants | Africa | 1.6 /100 | #246 | Tragic 9.4% |
| Poles | 1.5 /100 | #247 | Tragic 9.4% |
| Dutch | 1.5 /100 | #248 | Tragic 9.4% |
| Immigrants | South America | 1.5 /100 | #249 | Tragic 9.4% |
| Immigrants | Guatemala | 1.3 /100 | #250 | Tragic 9.4% |
| Central Americans | 1.3 /100 | #251 | Tragic 9.4% |
| Creek | 1.2 /100 | #252 | Tragic 9.4% |
| Portuguese | 1.1 /100 | #253 | Tragic 9.4% |
| Nicaraguans | 1.0 /100 | #254 | Tragic 9.4% |
| Lithuanians | 0.9 /100 | #255 | Tragic 9.4% |
| Canadians | 0.8 /100 | #256 | Tragic 9.4% |
| Celtics | 0.7 /100 | #257 | Tragic 9.5% |