Egyptian vs Immigrants from Guatemala Female Poverty
COMPARE
Egyptian
Immigrants from Guatemala
Female Poverty
Female Poverty Comparison
Egyptians
Immigrants from Guatemala
12.3%
FEMALE POVERTY
97.2/ 100
METRIC RATING
78th/ 347
METRIC RANK
17.0%
FEMALE POVERTY
0.0/ 100
METRIC RATING
311th/ 347
METRIC RANK
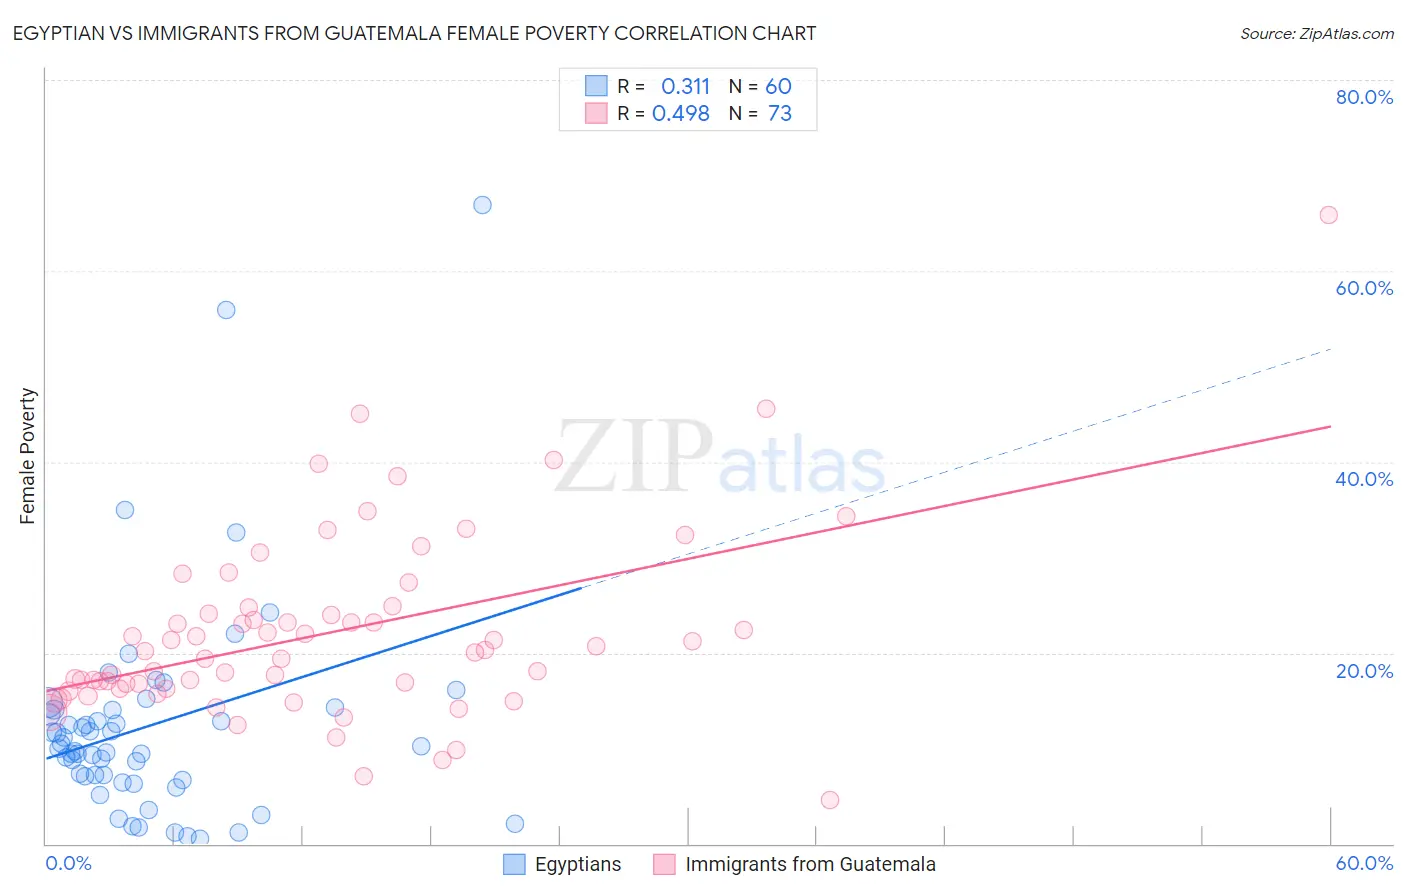
Egyptian vs Immigrants from Guatemala Female Poverty Correlation Chart
The statistical analysis conducted on geographies consisting of 276,729,469 people shows a mild positive correlation between the proportion of Egyptians and poverty level among females in the United States with a correlation coefficient (R) of 0.311 and weighted average of 12.3%. Similarly, the statistical analysis conducted on geographies consisting of 377,104,369 people shows a moderate positive correlation between the proportion of Immigrants from Guatemala and poverty level among females in the United States with a correlation coefficient (R) of 0.498 and weighted average of 17.0%, a difference of 38.3%.
Female Poverty Correlation Summary
| Measurement | Egyptian | Immigrants from Guatemala |
| Minimum | 0.56% | 4.6% |
| Maximum | 66.9% | 65.8% |
| Range | 66.4% | 61.2% |
| Mean | 12.4% | 22.1% |
| Median | 10.1% | 20.2% |
| Interquartile 25% (IQ1) | 6.9% | 16.3% |
| Interquartile 75% (IQ3) | 14.0% | 24.4% |
| Interquartile Range (IQR) | 7.1% | 8.2% |
| Standard Deviation (Sample) | 11.5% | 9.8% |
| Standard Deviation (Population) | 11.4% | 9.7% |
Similar Demographics by Female Poverty
Demographics Similar to Egyptians by Female Poverty
In terms of female poverty, the demographic groups most similar to Egyptians are Serbian (12.3%, a difference of 0.010%), Immigrants from Eastern Europe (12.3%, a difference of 0.040%), Immigrants from North America (12.3%, a difference of 0.070%), Slovak (12.3%, a difference of 0.12%), and Immigrants from Sweden (12.3%, a difference of 0.12%).
| Demographics | Rating | Rank | Female Poverty |
| Carpatho Rusyns | 97.6 /100 | #71 | Exceptional 12.2% |
| Cambodians | 97.5 /100 | #72 | Exceptional 12.2% |
| Zimbabweans | 97.5 /100 | #73 | Exceptional 12.3% |
| Immigrants | Canada | 97.5 /100 | #74 | Exceptional 12.3% |
| Europeans | 97.4 /100 | #75 | Exceptional 12.3% |
| Immigrants | Eastern Europe | 97.2 /100 | #76 | Exceptional 12.3% |
| Serbians | 97.2 /100 | #77 | Exceptional 12.3% |
| Egyptians | 97.2 /100 | #78 | Exceptional 12.3% |
| Immigrants | North America | 97.1 /100 | #79 | Exceptional 12.3% |
| Slovaks | 97.1 /100 | #80 | Exceptional 12.3% |
| Immigrants | Sweden | 97.1 /100 | #81 | Exceptional 12.3% |
| Jordanians | 97.1 /100 | #82 | Exceptional 12.3% |
| Immigrants | England | 96.9 /100 | #83 | Exceptional 12.3% |
| Northern Europeans | 96.6 /100 | #84 | Exceptional 12.4% |
| Irish | 96.5 /100 | #85 | Exceptional 12.4% |
Demographics Similar to Immigrants from Guatemala by Female Poverty
In terms of female poverty, the demographic groups most similar to Immigrants from Guatemala are Creek (17.0%, a difference of 0.0%), Immigrants from Somalia (17.0%, a difference of 0.090%), British West Indian (17.0%, a difference of 0.17%), Immigrants from Mexico (17.0%, a difference of 0.24%), and Dutch West Indian (17.1%, a difference of 0.42%).
| Demographics | Rating | Rank | Female Poverty |
| Immigrants | Central America | 0.0 /100 | #304 | Tragic 16.8% |
| Immigrants | Grenada | 0.0 /100 | #305 | Tragic 16.8% |
| Immigrants | Caribbean | 0.0 /100 | #306 | Tragic 16.9% |
| Seminole | 0.0 /100 | #307 | Tragic 16.9% |
| Africans | 0.0 /100 | #308 | Tragic 16.9% |
| Immigrants | Mexico | 0.0 /100 | #309 | Tragic 17.0% |
| Creek | 0.0 /100 | #310 | Tragic 17.0% |
| Immigrants | Guatemala | 0.0 /100 | #311 | Tragic 17.0% |
| Immigrants | Somalia | 0.0 /100 | #312 | Tragic 17.0% |
| British West Indians | 0.0 /100 | #313 | Tragic 17.0% |
| Dutch West Indians | 0.0 /100 | #314 | Tragic 17.1% |
| U.S. Virgin Islanders | 0.0 /100 | #315 | Tragic 17.3% |
| Hondurans | 0.0 /100 | #316 | Tragic 17.4% |
| Immigrants | Congo | 0.0 /100 | #317 | Tragic 17.4% |
| Ute | 0.0 /100 | #318 | Tragic 17.5% |