Argentinean vs Puget Sound Salish Single Female Poverty
COMPARE
Argentinean
Puget Sound Salish
Single Female Poverty
Single Female Poverty Comparison
Argentineans
Puget Sound Salish
19.1%
SINGLE FEMALE POVERTY
99.7/ 100
METRIC RATING
54th/ 347
METRIC RANK
20.6%
SINGLE FEMALE POVERTY
79.6/ 100
METRIC RATING
151st/ 347
METRIC RANK
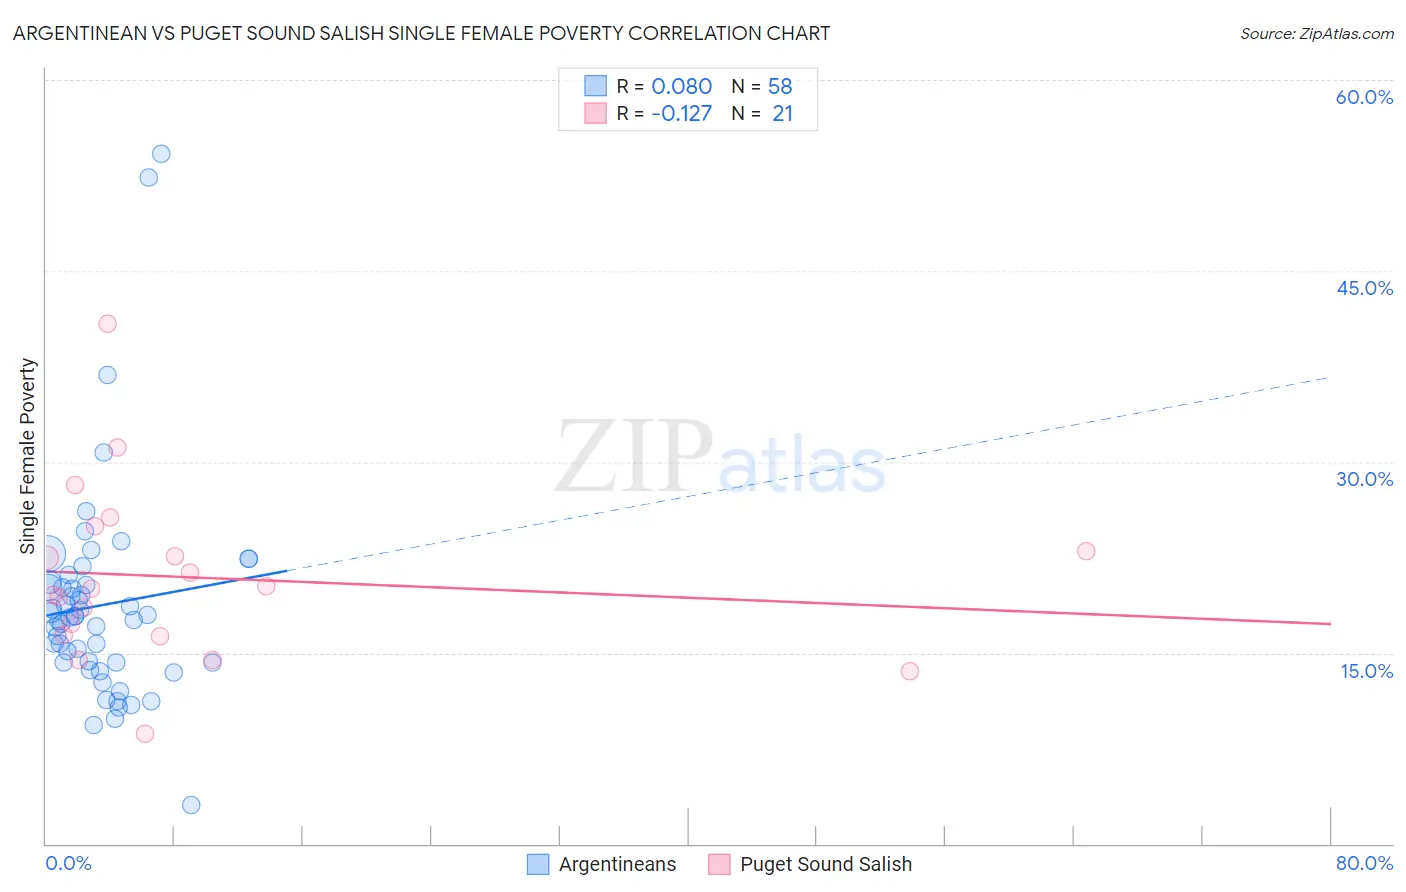
Argentinean vs Puget Sound Salish Single Female Poverty Correlation Chart
The statistical analysis conducted on geographies consisting of 293,674,093 people shows a slight positive correlation between the proportion of Argentineans and poverty level among single females in the United States with a correlation coefficient (R) of 0.080 and weighted average of 19.1%. Similarly, the statistical analysis conducted on geographies consisting of 45,841,624 people shows a poor negative correlation between the proportion of Puget Sound Salish and poverty level among single females in the United States with a correlation coefficient (R) of -0.127 and weighted average of 20.6%, a difference of 7.7%.
Single Female Poverty Correlation Summary
| Measurement | Argentinean | Puget Sound Salish |
| Minimum | 3.0% | 8.6% |
| Maximum | 54.2% | 40.8% |
| Range | 51.2% | 32.2% |
| Mean | 18.7% | 20.9% |
| Median | 17.8% | 20.0% |
| Interquartile 25% (IQ1) | 14.2% | 16.4% |
| Interquartile 75% (IQ3) | 20.3% | 24.0% |
| Interquartile Range (IQR) | 6.1% | 7.6% |
| Standard Deviation (Sample) | 8.5% | 6.9% |
| Standard Deviation (Population) | 8.4% | 6.8% |
Similar Demographics by Single Female Poverty
Demographics Similar to Argentineans by Single Female Poverty
In terms of single female poverty, the demographic groups most similar to Argentineans are Tsimshian (19.1%, a difference of 0.010%), Immigrants from Vietnam (19.1%, a difference of 0.040%), Immigrants from Fiji (19.1%, a difference of 0.090%), Eastern European (19.1%, a difference of 0.15%), and Egyptian (19.1%, a difference of 0.22%).
| Demographics | Rating | Rank | Single Female Poverty |
| Latvians | 99.8 /100 | #47 | Exceptional 19.0% |
| Immigrants | Argentina | 99.8 /100 | #48 | Exceptional 19.0% |
| Immigrants | Czechoslovakia | 99.8 /100 | #49 | Exceptional 19.0% |
| Immigrants | Eastern Europe | 99.8 /100 | #50 | Exceptional 19.0% |
| Immigrants | Italy | 99.8 /100 | #51 | Exceptional 19.0% |
| Egyptians | 99.7 /100 | #52 | Exceptional 19.1% |
| Tsimshian | 99.7 /100 | #53 | Exceptional 19.1% |
| Argentineans | 99.7 /100 | #54 | Exceptional 19.1% |
| Immigrants | Vietnam | 99.7 /100 | #55 | Exceptional 19.1% |
| Immigrants | Fiji | 99.7 /100 | #56 | Exceptional 19.1% |
| Eastern Europeans | 99.7 /100 | #57 | Exceptional 19.1% |
| Immigrants | Bulgaria | 99.7 /100 | #58 | Exceptional 19.1% |
| Sri Lankans | 99.6 /100 | #59 | Exceptional 19.2% |
| Russians | 99.6 /100 | #60 | Exceptional 19.2% |
| Cambodians | 99.6 /100 | #61 | Exceptional 19.2% |
Demographics Similar to Puget Sound Salish by Single Female Poverty
In terms of single female poverty, the demographic groups most similar to Puget Sound Salish are Immigrants from Denmark (20.5%, a difference of 0.090%), Portuguese (20.5%, a difference of 0.19%), Immigrants from Uruguay (20.6%, a difference of 0.19%), Swedish (20.6%, a difference of 0.24%), and Immigrants from Western Europe (20.6%, a difference of 0.27%).
| Demographics | Rating | Rank | Single Female Poverty |
| Immigrants | Uzbekistan | 88.3 /100 | #144 | Excellent 20.3% |
| Austrians | 85.8 /100 | #145 | Excellent 20.4% |
| Venezuelans | 85.5 /100 | #146 | Excellent 20.4% |
| South Africans | 85.3 /100 | #147 | Excellent 20.4% |
| Luxembourgers | 84.9 /100 | #148 | Excellent 20.4% |
| Portuguese | 81.5 /100 | #149 | Excellent 20.5% |
| Immigrants | Denmark | 80.5 /100 | #150 | Excellent 20.5% |
| Puget Sound Salish | 79.6 /100 | #151 | Good 20.6% |
| Immigrants | Uruguay | 77.7 /100 | #152 | Good 20.6% |
| Swedes | 77.1 /100 | #153 | Good 20.6% |
| Immigrants | Western Europe | 76.7 /100 | #154 | Good 20.6% |
| Samoans | 76.0 /100 | #155 | Good 20.6% |
| South American Indians | 75.7 /100 | #156 | Good 20.6% |
| Immigrants | Oceania | 74.3 /100 | #157 | Good 20.7% |
| Danes | 73.0 /100 | #158 | Good 20.7% |