Argentinean vs Immigrants from Spain Single Female Poverty
COMPARE
Argentinean
Immigrants from Spain
Single Female Poverty
Single Female Poverty Comparison
Argentineans
Immigrants from Spain
19.1%
SINGLE FEMALE POVERTY
99.7/ 100
METRIC RATING
54th/ 347
METRIC RANK
20.2%
SINGLE FEMALE POVERTY
92.7/ 100
METRIC RATING
128th/ 347
METRIC RANK
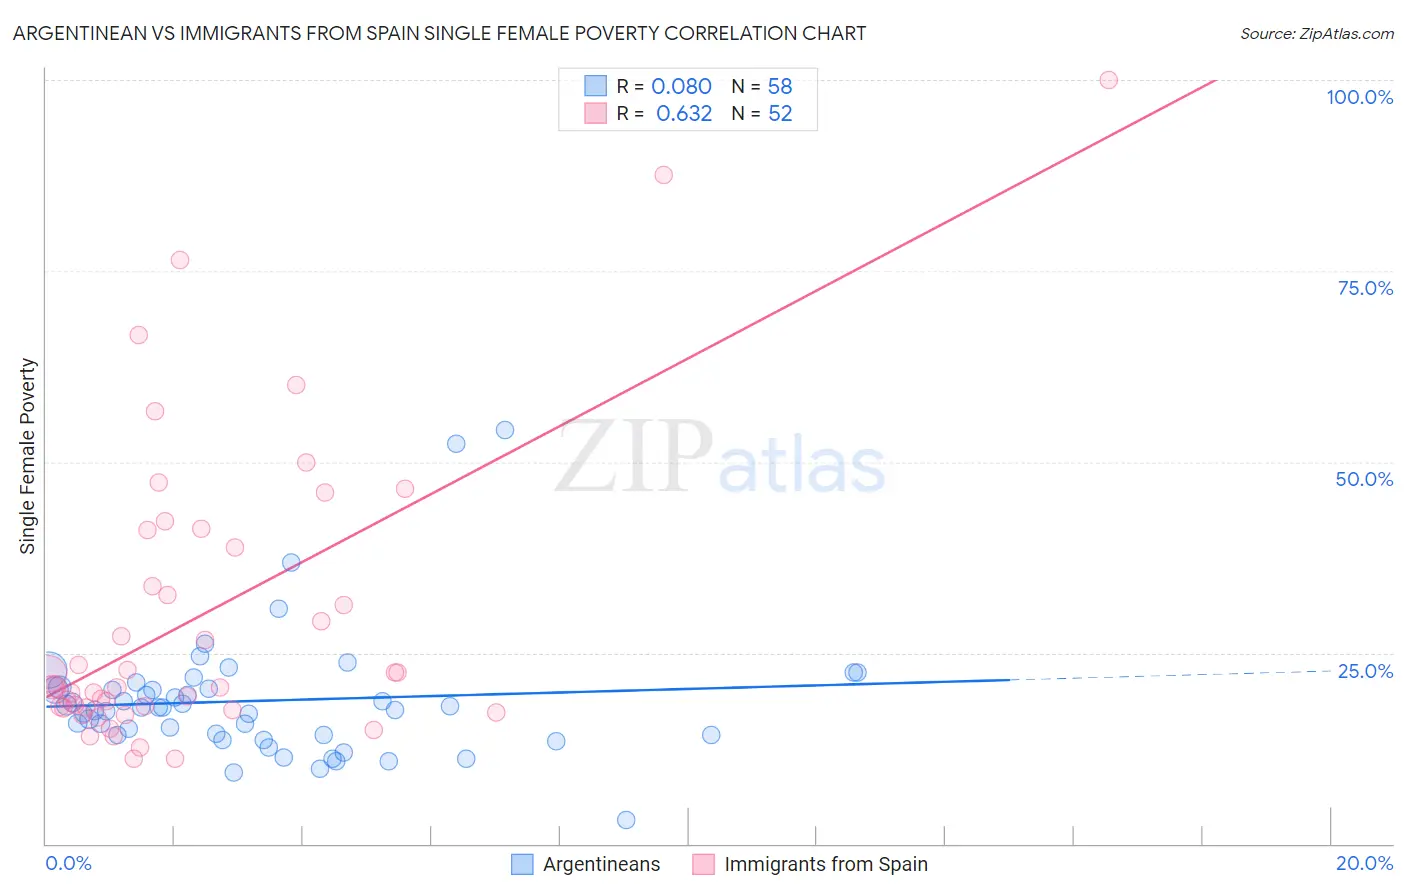
Argentinean vs Immigrants from Spain Single Female Poverty Correlation Chart
The statistical analysis conducted on geographies consisting of 293,674,093 people shows a slight positive correlation between the proportion of Argentineans and poverty level among single females in the United States with a correlation coefficient (R) of 0.080 and weighted average of 19.1%. Similarly, the statistical analysis conducted on geographies consisting of 237,218,477 people shows a significant positive correlation between the proportion of Immigrants from Spain and poverty level among single females in the United States with a correlation coefficient (R) of 0.632 and weighted average of 20.2%, a difference of 5.6%.
Single Female Poverty Correlation Summary
| Measurement | Argentinean | Immigrants from Spain |
| Minimum | 3.0% | 11.2% |
| Maximum | 54.2% | 100.0% |
| Range | 51.2% | 88.8% |
| Mean | 18.7% | 30.0% |
| Median | 17.8% | 20.6% |
| Interquartile 25% (IQ1) | 14.2% | 17.8% |
| Interquartile 75% (IQ3) | 20.3% | 39.9% |
| Interquartile Range (IQR) | 6.1% | 22.0% |
| Standard Deviation (Sample) | 8.5% | 19.8% |
| Standard Deviation (Population) | 8.4% | 19.6% |
Similar Demographics by Single Female Poverty
Demographics Similar to Argentineans by Single Female Poverty
In terms of single female poverty, the demographic groups most similar to Argentineans are Tsimshian (19.1%, a difference of 0.010%), Immigrants from Vietnam (19.1%, a difference of 0.040%), Immigrants from Fiji (19.1%, a difference of 0.090%), Eastern European (19.1%, a difference of 0.15%), and Egyptian (19.1%, a difference of 0.22%).
| Demographics | Rating | Rank | Single Female Poverty |
| Latvians | 99.8 /100 | #47 | Exceptional 19.0% |
| Immigrants | Argentina | 99.8 /100 | #48 | Exceptional 19.0% |
| Immigrants | Czechoslovakia | 99.8 /100 | #49 | Exceptional 19.0% |
| Immigrants | Eastern Europe | 99.8 /100 | #50 | Exceptional 19.0% |
| Immigrants | Italy | 99.8 /100 | #51 | Exceptional 19.0% |
| Egyptians | 99.7 /100 | #52 | Exceptional 19.1% |
| Tsimshian | 99.7 /100 | #53 | Exceptional 19.1% |
| Argentineans | 99.7 /100 | #54 | Exceptional 19.1% |
| Immigrants | Vietnam | 99.7 /100 | #55 | Exceptional 19.1% |
| Immigrants | Fiji | 99.7 /100 | #56 | Exceptional 19.1% |
| Eastern Europeans | 99.7 /100 | #57 | Exceptional 19.1% |
| Immigrants | Bulgaria | 99.7 /100 | #58 | Exceptional 19.1% |
| Sri Lankans | 99.6 /100 | #59 | Exceptional 19.2% |
| Russians | 99.6 /100 | #60 | Exceptional 19.2% |
| Cambodians | 99.6 /100 | #61 | Exceptional 19.2% |
Demographics Similar to Immigrants from Spain by Single Female Poverty
In terms of single female poverty, the demographic groups most similar to Immigrants from Spain are Immigrants from Morocco (20.2%, a difference of 0.080%), Immigrants from Hungary (20.2%, a difference of 0.10%), Mongolian (20.2%, a difference of 0.11%), Serbian (20.1%, a difference of 0.13%), and Pakistani (20.2%, a difference of 0.15%).
| Demographics | Rating | Rank | Single Female Poverty |
| Immigrants | Switzerland | 95.1 /100 | #121 | Exceptional 20.0% |
| Immigrants | South America | 95.0 /100 | #122 | Exceptional 20.0% |
| Brazilians | 94.4 /100 | #123 | Exceptional 20.1% |
| Immigrants | Chile | 94.3 /100 | #124 | Exceptional 20.1% |
| Immigrants | South Africa | 93.9 /100 | #125 | Exceptional 20.1% |
| Serbians | 93.3 /100 | #126 | Exceptional 20.1% |
| Mongolians | 93.2 /100 | #127 | Exceptional 20.2% |
| Immigrants | Spain | 92.7 /100 | #128 | Exceptional 20.2% |
| Immigrants | Morocco | 92.4 /100 | #129 | Exceptional 20.2% |
| Immigrants | Hungary | 92.3 /100 | #130 | Exceptional 20.2% |
| Pakistanis | 92.1 /100 | #131 | Exceptional 20.2% |
| Uruguayans | 92.1 /100 | #132 | Exceptional 20.2% |
| Immigrants | England | 91.9 /100 | #133 | Exceptional 20.2% |
| Immigrants | Venezuela | 91.5 /100 | #134 | Exceptional 20.2% |
| Immigrants | Iraq | 91.2 /100 | #135 | Exceptional 20.2% |