Hopi vs Puget Sound Salish Single Female Poverty
COMPARE
Hopi
Puget Sound Salish
Single Female Poverty
Single Female Poverty Comparison
Hopi
Puget Sound Salish
28.0%
SINGLE FEMALE POVERTY
0.0/ 100
METRIC RATING
330th/ 347
METRIC RANK
20.6%
SINGLE FEMALE POVERTY
79.6/ 100
METRIC RATING
151st/ 347
METRIC RANK
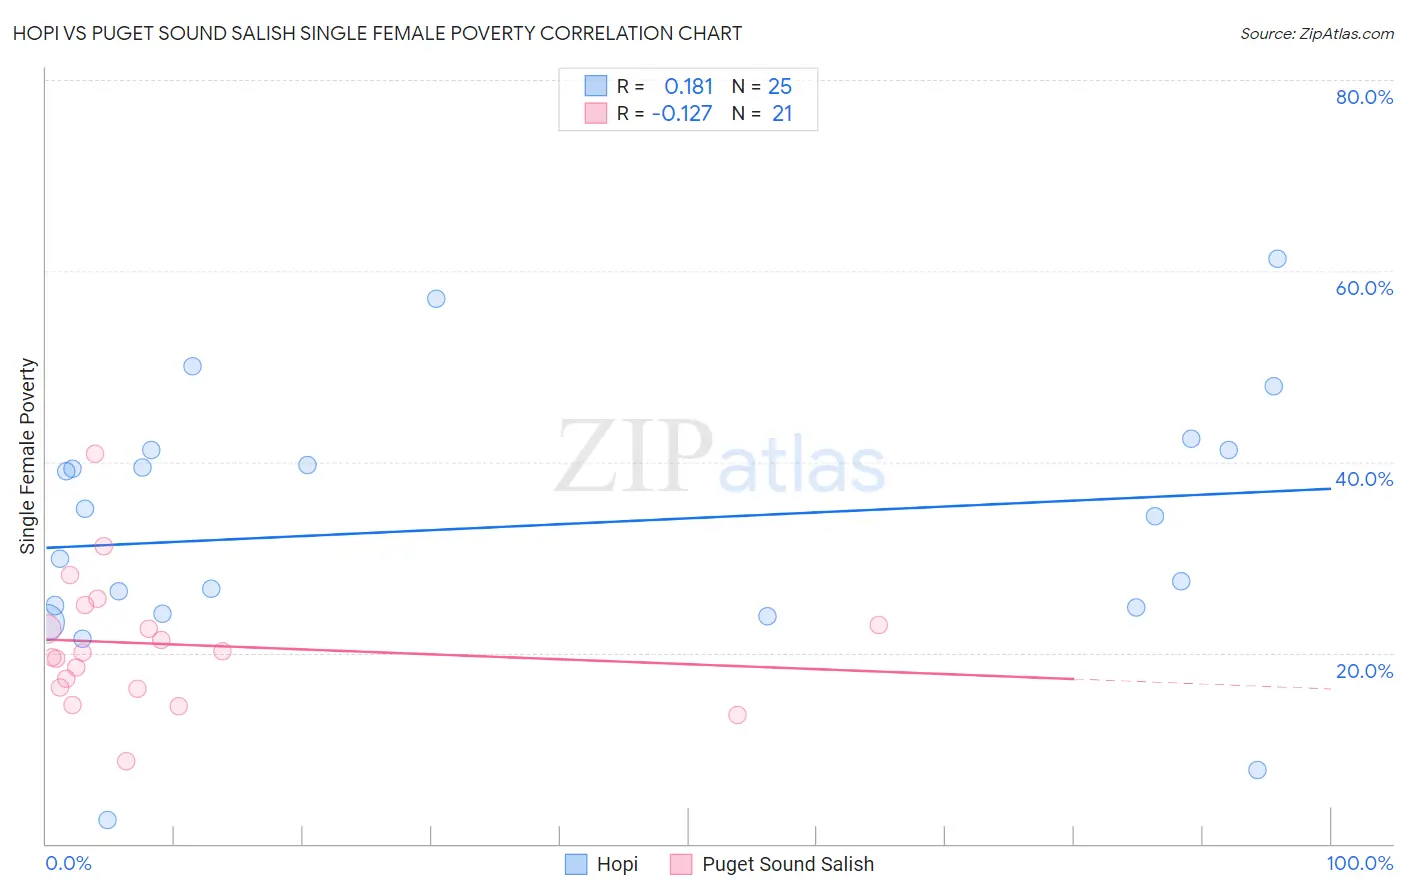
Hopi vs Puget Sound Salish Single Female Poverty Correlation Chart
The statistical analysis conducted on geographies consisting of 74,526,987 people shows a poor positive correlation between the proportion of Hopi and poverty level among single females in the United States with a correlation coefficient (R) of 0.181 and weighted average of 28.0%. Similarly, the statistical analysis conducted on geographies consisting of 45,841,624 people shows a poor negative correlation between the proportion of Puget Sound Salish and poverty level among single females in the United States with a correlation coefficient (R) of -0.127 and weighted average of 20.6%, a difference of 36.4%.
Single Female Poverty Correlation Summary
| Measurement | Hopi | Puget Sound Salish |
| Minimum | 2.4% | 8.6% |
| Maximum | 61.3% | 40.8% |
| Range | 58.9% | 32.2% |
| Mean | 33.2% | 20.9% |
| Median | 34.3% | 20.0% |
| Interquartile 25% (IQ1) | 24.4% | 16.4% |
| Interquartile 75% (IQ3) | 41.2% | 24.0% |
| Interquartile Range (IQR) | 16.8% | 7.6% |
| Standard Deviation (Sample) | 13.7% | 6.9% |
| Standard Deviation (Population) | 13.4% | 6.8% |
Similar Demographics by Single Female Poverty
Demographics Similar to Hopi by Single Female Poverty
In terms of single female poverty, the demographic groups most similar to Hopi are Native/Alaskan (28.2%, a difference of 0.64%), Menominee (27.8%, a difference of 0.71%), Yakama (28.3%, a difference of 0.90%), Apache (27.7%, a difference of 1.2%), and Ute (28.4%, a difference of 1.3%).
| Demographics | Rating | Rank | Single Female Poverty |
| Chippewa | 0.0 /100 | #323 | Tragic 26.8% |
| Kiowa | 0.0 /100 | #324 | Tragic 26.9% |
| Choctaw | 0.0 /100 | #325 | Tragic 27.2% |
| Creek | 0.0 /100 | #326 | Tragic 27.4% |
| Dutch West Indians | 0.0 /100 | #327 | Tragic 27.5% |
| Apache | 0.0 /100 | #328 | Tragic 27.7% |
| Menominee | 0.0 /100 | #329 | Tragic 27.8% |
| Hopi | 0.0 /100 | #330 | Tragic 28.0% |
| Natives/Alaskans | 0.0 /100 | #331 | Tragic 28.2% |
| Yakama | 0.0 /100 | #332 | Tragic 28.3% |
| Ute | 0.0 /100 | #333 | Tragic 28.4% |
| Pueblo | 0.0 /100 | #334 | Tragic 28.6% |
| Immigrants | Yemen | 0.0 /100 | #335 | Tragic 28.9% |
| Colville | 0.0 /100 | #336 | Tragic 29.1% |
| Yuman | 0.0 /100 | #337 | Tragic 29.4% |
Demographics Similar to Puget Sound Salish by Single Female Poverty
In terms of single female poverty, the demographic groups most similar to Puget Sound Salish are Immigrants from Denmark (20.5%, a difference of 0.090%), Portuguese (20.5%, a difference of 0.19%), Immigrants from Uruguay (20.6%, a difference of 0.19%), Swedish (20.6%, a difference of 0.24%), and Immigrants from Western Europe (20.6%, a difference of 0.27%).
| Demographics | Rating | Rank | Single Female Poverty |
| Immigrants | Uzbekistan | 88.3 /100 | #144 | Excellent 20.3% |
| Austrians | 85.8 /100 | #145 | Excellent 20.4% |
| Venezuelans | 85.5 /100 | #146 | Excellent 20.4% |
| South Africans | 85.3 /100 | #147 | Excellent 20.4% |
| Luxembourgers | 84.9 /100 | #148 | Excellent 20.4% |
| Portuguese | 81.5 /100 | #149 | Excellent 20.5% |
| Immigrants | Denmark | 80.5 /100 | #150 | Excellent 20.5% |
| Puget Sound Salish | 79.6 /100 | #151 | Good 20.6% |
| Immigrants | Uruguay | 77.7 /100 | #152 | Good 20.6% |
| Swedes | 77.1 /100 | #153 | Good 20.6% |
| Immigrants | Western Europe | 76.7 /100 | #154 | Good 20.6% |
| Samoans | 76.0 /100 | #155 | Good 20.6% |
| South American Indians | 75.7 /100 | #156 | Good 20.6% |
| Immigrants | Oceania | 74.3 /100 | #157 | Good 20.7% |
| Danes | 73.0 /100 | #158 | Good 20.7% |