Argentinean vs Immigrants from Russia Single Female Poverty
COMPARE
Argentinean
Immigrants from Russia
Single Female Poverty
Single Female Poverty Comparison
Argentineans
Immigrants from Russia
19.1%
SINGLE FEMALE POVERTY
99.7/ 100
METRIC RATING
54th/ 347
METRIC RANK
19.4%
SINGLE FEMALE POVERTY
99.3/ 100
METRIC RATING
77th/ 347
METRIC RANK
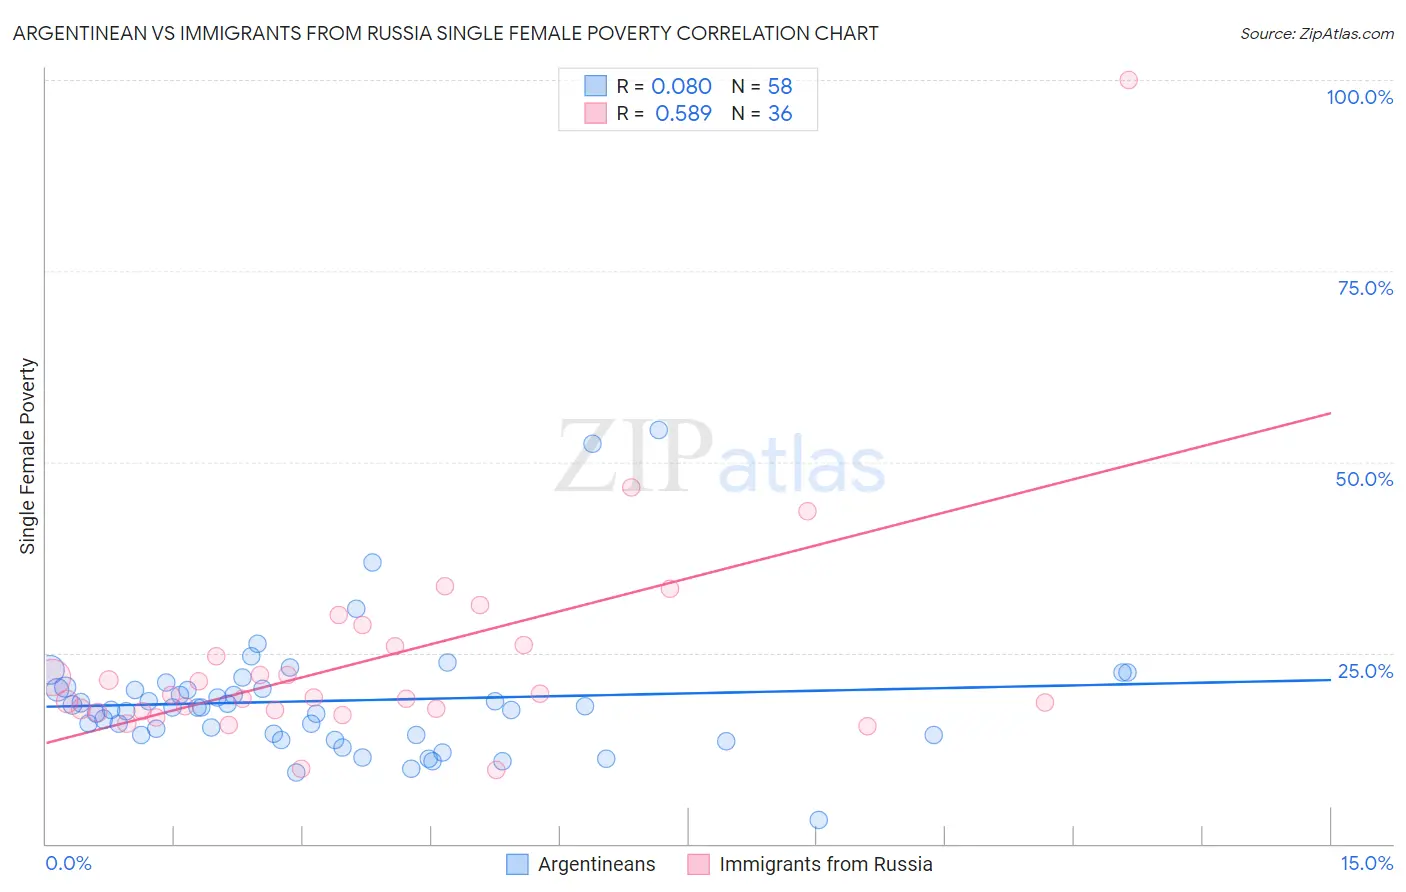
Argentinean vs Immigrants from Russia Single Female Poverty Correlation Chart
The statistical analysis conducted on geographies consisting of 293,674,093 people shows a slight positive correlation between the proportion of Argentineans and poverty level among single females in the United States with a correlation coefficient (R) of 0.080 and weighted average of 19.1%. Similarly, the statistical analysis conducted on geographies consisting of 342,303,580 people shows a substantial positive correlation between the proportion of Immigrants from Russia and poverty level among single females in the United States with a correlation coefficient (R) of 0.589 and weighted average of 19.4%, a difference of 1.5%.
Single Female Poverty Correlation Summary
| Measurement | Argentinean | Immigrants from Russia |
| Minimum | 3.0% | 9.7% |
| Maximum | 54.2% | 100.0% |
| Range | 51.2% | 90.3% |
| Mean | 18.7% | 24.2% |
| Median | 17.8% | 19.3% |
| Interquartile 25% (IQ1) | 14.2% | 17.4% |
| Interquartile 75% (IQ3) | 20.3% | 25.9% |
| Interquartile Range (IQR) | 6.1% | 8.5% |
| Standard Deviation (Sample) | 8.5% | 15.3% |
| Standard Deviation (Population) | 8.4% | 15.0% |
Similar Demographics by Single Female Poverty
Demographics Similar to Argentineans by Single Female Poverty
In terms of single female poverty, the demographic groups most similar to Argentineans are Tsimshian (19.1%, a difference of 0.010%), Immigrants from Vietnam (19.1%, a difference of 0.040%), Immigrants from Fiji (19.1%, a difference of 0.090%), Eastern European (19.1%, a difference of 0.15%), and Egyptian (19.1%, a difference of 0.22%).
| Demographics | Rating | Rank | Single Female Poverty |
| Latvians | 99.8 /100 | #47 | Exceptional 19.0% |
| Immigrants | Argentina | 99.8 /100 | #48 | Exceptional 19.0% |
| Immigrants | Czechoslovakia | 99.8 /100 | #49 | Exceptional 19.0% |
| Immigrants | Eastern Europe | 99.8 /100 | #50 | Exceptional 19.0% |
| Immigrants | Italy | 99.8 /100 | #51 | Exceptional 19.0% |
| Egyptians | 99.7 /100 | #52 | Exceptional 19.1% |
| Tsimshian | 99.7 /100 | #53 | Exceptional 19.1% |
| Argentineans | 99.7 /100 | #54 | Exceptional 19.1% |
| Immigrants | Vietnam | 99.7 /100 | #55 | Exceptional 19.1% |
| Immigrants | Fiji | 99.7 /100 | #56 | Exceptional 19.1% |
| Eastern Europeans | 99.7 /100 | #57 | Exceptional 19.1% |
| Immigrants | Bulgaria | 99.7 /100 | #58 | Exceptional 19.1% |
| Sri Lankans | 99.6 /100 | #59 | Exceptional 19.2% |
| Russians | 99.6 /100 | #60 | Exceptional 19.2% |
| Cambodians | 99.6 /100 | #61 | Exceptional 19.2% |
Demographics Similar to Immigrants from Russia by Single Female Poverty
In terms of single female poverty, the demographic groups most similar to Immigrants from Russia are Albanian (19.4%, a difference of 0.070%), Immigrants from Sierra Leone (19.4%, a difference of 0.090%), Peruvian (19.4%, a difference of 0.13%), Immigrants from Australia (19.4%, a difference of 0.13%), and Immigrants from Scotland (19.4%, a difference of 0.15%).
| Demographics | Rating | Rank | Single Female Poverty |
| Immigrants | Jordan | 99.4 /100 | #70 | Exceptional 19.3% |
| Immigrants | South Eastern Asia | 99.4 /100 | #71 | Exceptional 19.3% |
| Immigrants | Latvia | 99.4 /100 | #72 | Exceptional 19.3% |
| Immigrants | Peru | 99.4 /100 | #73 | Exceptional 19.3% |
| Immigrants | Belarus | 99.4 /100 | #74 | Exceptional 19.3% |
| Immigrants | Turkey | 99.4 /100 | #75 | Exceptional 19.4% |
| Peruvians | 99.4 /100 | #76 | Exceptional 19.4% |
| Immigrants | Russia | 99.3 /100 | #77 | Exceptional 19.4% |
| Albanians | 99.3 /100 | #78 | Exceptional 19.4% |
| Immigrants | Sierra Leone | 99.3 /100 | #79 | Exceptional 19.4% |
| Immigrants | Australia | 99.3 /100 | #80 | Exceptional 19.4% |
| Immigrants | Scotland | 99.2 /100 | #81 | Exceptional 19.4% |
| Immigrants | Malaysia | 99.2 /100 | #82 | Exceptional 19.4% |
| Taiwanese | 99.2 /100 | #83 | Exceptional 19.4% |
| Immigrants | Sweden | 99.2 /100 | #84 | Exceptional 19.4% |