Arapaho vs Immigrants from Chile Median Family Income

COMPARE

Arapaho
Race
Ancestry
AfghanAfricanAlaska NativeAlaskan AthabascanAlbanianAleutAlsatianAmericanApacheArabArapahoArgentineanArmenianAssyrian/Chaldean/SyriacAustralianAustrianBahamianBangladeshiBarbadianBasqueBelgianBelizeanBermudanBhutaneseBlackfeetBolivianBrazilianBritishBritish West IndianBulgarianBurmeseCajunCambodianCanadianCape VerdeanCarpatho RusynCelticCentral AmericanCentral American IndianCherokeeCheyenneChickasawChileanChineseChippewaChoctawColombianColvilleComancheCosta RicanCreeCreekCroatianCrowCubanCypriotCzechCzechoslovakianDanishDelawareDominicanDutchDutch West IndianEastern EuropeanEcuadorianEgyptianEnglishEstonianEthiopianEuropeanFijianFilipinoFinnishFrenchFrench American IndianFrench CanadianGermanGerman RussianGhanaianGreekGuamanian/ChamorroGuatemalanGuyaneseHaitianHmongHonduranHopiHoumaHungarianIcelanderIndian (Asian)IndonesianInupiatIranianIraqiIrishIroquoisIsraeliItalianJamaicanJapaneseJordanianKenyanKiowaKoreanLaotianLatvianLebaneseLiberianLithuanianLumbeeLuxembourgerMacedonianMalaysianMalteseMarshalleseMenomineeMexicanMexican American IndianMongolianMoroccanNative HawaiianNavajoNepaleseNew ZealanderNicaraguanNigerianNorthern EuropeanNorwegianOkinawanOsageOttawaPaiutePakistaniPalestinianPanamanianParaguayanPennsylvania GermanPeruvianPimaPolishPortuguesePotawatomiPuebloPuerto RicanPuget Sound SalishRomanianRussianSalvadoranSamoanScandinavianScotch-IrishScottishSeminoleSenegaleseSerbianShoshoneSierra LeoneanSiouxSlavicSlovakSloveneSomaliSouth AfricanSouth AmericanSouth American IndianSoviet UnionSpaniardSpanishSpanish AmericanSpanish American IndianSri LankanSubsaharan AfricanSudaneseSwedishSwissSyrianTaiwaneseThaiTlingit-HaidaTohono O'OdhamTonganTrinidadian and TobagonianTsimshianTurkishU.S. Virgin IslanderUgandanUkrainianUruguayanUteVenezuelanVietnameseWelshWest IndianYakamaYaquiYugoslavianYumanYup'ikZimbabwean
Immigration
NonimmigrantsImmigrantsAfghanistanAfricaAlbaniaArgentinaArmeniaAsiaAustraliaAustriaBahamasBangladeshBarbadosBelarusBelgiumBelizeBoliviaBosnia and HerzegovinaBrazilBulgariaBurma/MyanmarCabo VerdeCambodiaCameroonCanadaCaribbeanCentral AmericaChinaColombiaCongoCosta RicaCroatiaCubaCzechoslovakiaDenmarkDominicaDominican RepublicEastern AfricaEastern AsiaEastern EuropeEcuadorEgyptEl SalvadorEnglandEritreaEthiopiaEuropeFijiFranceGermanyGhanaGreeceGrenadaGuatemalaGuyanaHaitiHondurasHong KongHungaryIndiaIndonesiaIranIraqIrelandIsraelItalyJamaicaJapanJordanKazakhstanKenyaKoreaKuwaitLaosLatin AmericaLatviaLebanonLiberiaLithuaniaMalaysiaMexicoMicronesiaMiddle AfricaMoldovaMoroccoNepalNetherlandsNicaraguaNigeriaNorth AmericaNorth MacedoniaNorthern AfricaNorthern EuropeNorwayOceaniaPakistanPanamaPeruPhilippinesPolandPortugalRomaniaRussiaSaudi ArabiaScotlandSenegalSerbiaSierra LeoneSingaporeSomaliaSouth AfricaSouth AmericaSouth Central AsiaSouth Eastern AsiaSouthern EuropeSpainSri LankaSt. Vincent and the GrenadinesSudanSwedenSwitzerlandSyriaTaiwanThailandTrinidad and TobagoTurkeyUgandaUkraineUruguayUzbekistanVenezuelaVietnamWest IndiesWestern AfricaWestern AsiaWestern EuropeYemenZaireZimbabweAzores
Immigrants from Chile
Race
Ancestry
AfghanAfricanAlaska NativeAlaskan AthabascanAlbanianAleutAlsatianAmericanApacheArabArgentineanArmenianAssyrian/Chaldean/SyriacAustralianAustrianBahamianBangladeshiBarbadianBasqueBelgianBelizeanBermudanBhutaneseBlackfeetBolivianBrazilianBritishBritish West IndianBulgarianBurmeseCajunCambodianCanadianCape VerdeanCarpatho RusynCelticCentral AmericanCentral American IndianCherokeeCheyenneChickasawChileanChineseChippewaChoctawColombianColvilleComancheCosta RicanCreeCreekCroatianCrowCubanCypriotCzechCzechoslovakianDanishDelawareDominicanDutchDutch West IndianEastern EuropeanEcuadorianEgyptianEnglishEstonianEthiopianEuropeanFijianFilipinoFinnishFrenchFrench American IndianFrench CanadianGermanGerman RussianGhanaianGreekGuamanian/ChamorroGuatemalanGuyaneseHaitianHmongHonduranHopiHoumaHungarianIcelanderIndian (Asian)IndonesianInupiatIranianIraqiIrishIroquoisIsraeliItalianJamaicanJapaneseJordanianKenyanKiowaKoreanLaotianLatvianLebaneseLiberianLithuanianLumbeeLuxembourgerMacedonianMalaysianMalteseMarshalleseMenomineeMexicanMexican American IndianMongolianMoroccanNative HawaiianNavajoNepaleseNew ZealanderNicaraguanNigerianNorthern EuropeanNorwegianOkinawanOsageOttawaPaiutePakistaniPalestinianPanamanianParaguayanPennsylvania GermanPeruvianPimaPolishPortuguesePotawatomiPuebloPuerto RicanPuget Sound SalishRomanianRussianSalvadoranSamoanScandinavianScotch-IrishScottishSeminoleSenegaleseSerbianShoshoneSierra LeoneanSiouxSlavicSlovakSloveneSomaliSouth AfricanSouth AmericanSouth American IndianSoviet UnionSpaniardSpanishSpanish AmericanSpanish American IndianSri LankanSubsaharan AfricanSudaneseSwedishSwissSyrianTaiwaneseThaiTlingit-HaidaTohono O'OdhamTonganTrinidadian and TobagonianTsimshianTurkishU.S. Virgin IslanderUgandanUkrainianUruguayanUteVenezuelanVietnameseWelshWest IndianYakamaYaquiYugoslavianYumanYup'ikZimbabwean
Immigration
NonimmigrantsImmigrantsAfghanistanAfricaAlbaniaArgentinaArmeniaAsiaAustraliaAustriaBahamasBangladeshBarbadosBelarusBelgiumBelizeBoliviaBosnia and HerzegovinaBrazilBulgariaBurma/MyanmarCabo VerdeCambodiaCameroonCanadaCaribbeanCentral AmericaChileChinaColombiaCongoCosta RicaCroatiaCubaCzechoslovakiaDenmarkDominicaDominican RepublicEastern AfricaEastern AsiaEastern EuropeEcuadorEgyptEl SalvadorEnglandEritreaEthiopiaEuropeFijiFranceGermanyGhanaGreeceGrenadaGuatemalaGuyanaHaitiHondurasHong KongHungaryIndiaIndonesiaIranIraqIrelandIsraelItalyJamaicaJapanJordanKazakhstanKenyaKoreaKuwaitLaosLatin AmericaLatviaLebanonLiberiaLithuaniaMalaysiaMexicoMicronesiaMiddle AfricaMoldovaMoroccoNepalNetherlandsNicaraguaNigeriaNorth AmericaNorth MacedoniaNorthern AfricaNorthern EuropeNorwayOceaniaPakistanPanamaPeruPhilippinesPolandPortugalRomaniaRussiaSaudi ArabiaScotlandSenegalSerbiaSierra LeoneSingaporeSomaliaSouth AfricaSouth AmericaSouth Central AsiaSouth Eastern AsiaSouthern EuropeSpainSri LankaSt. Vincent and the GrenadinesSudanSwedenSwitzerlandSyriaTaiwanThailandTrinidad and TobagoTurkeyUgandaUkraineUruguayUzbekistanVenezuelaVietnamWest IndiesWestern AfricaWestern AsiaWestern EuropeYemenZaireZimbabweAzores
Median Family Income
Income
Poverty
Unemployment
Labor Participation
Family Structure
Vehicle Availability
Education Level
Disability

Median Family Income Comparison

Arapaho

Immigrants from Chile

Tragic
Excellent
$82,064
MEDIAN FAMILY INCOME
0.0/ 100
METRIC RATING
327th/ 347
METRIC RANK
$105,655
MEDIAN FAMILY INCOME
82.1/ 100
METRIC RATING
147th/ 347
METRIC RANK

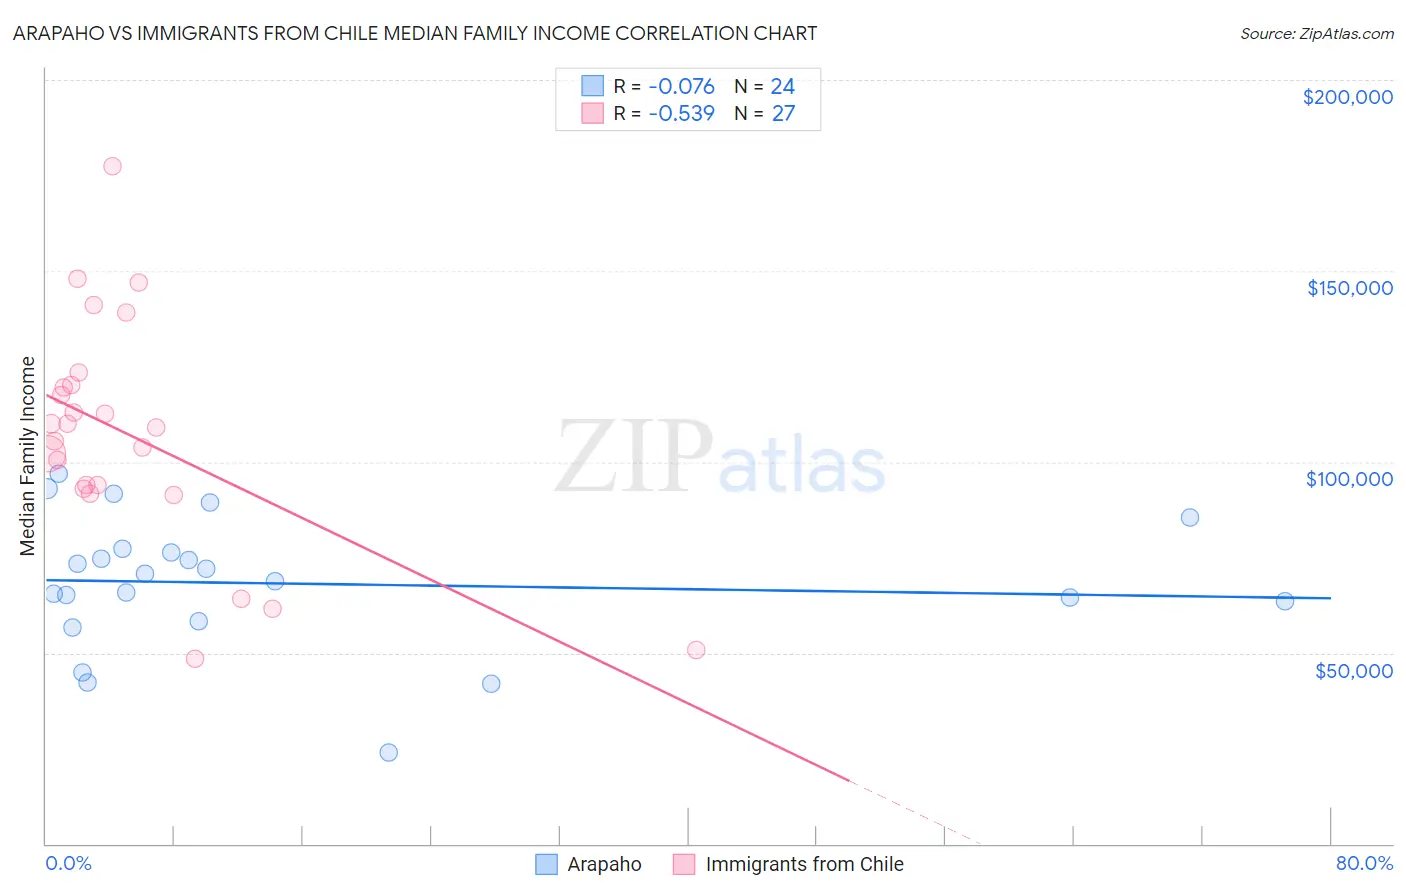
Arapaho vs Immigrants from Chile Median Family Income Correlation Chart

The statistical analysis conducted on geographies consisting of 29,776,303 people shows a slight negative correlation between the proportion of Arapaho and median family income in the United States with a correlation coefficient (R) of -0.076 and weighted average of $82,064. Similarly, the statistical analysis conducted on geographies consisting of 218,577,241 people shows a substantial negative correlation between the proportion of Immigrants from Chile and median family income in the United States with a correlation coefficient (R) of -0.539 and weighted average of $105,655, a difference of 28.7%.
Arapaho vs Immigrants from Chile Median Family Income

Median Family Income Correlation Summary

MeasurementArapahoImmigrants from Chile
Minimum$23,750$48,403
Maximum$96,782$177,440
Range$73,032$129,037
Mean$68,152$106,979
Median$69,777$109,000
Interquartile 25% (IQ1)$60,858$92,919
Interquartile 75% (IQ3)$76,786$120,092
Interquartile Range (IQR)$15,928$27,173
Standard Deviation (Sample)$17,667$29,634
Standard Deviation (Population)$17,295$29,080

Similar Demographics by Median Family Income

Demographics Similar to Arapaho by Median Family Income

In terms of median family income, the demographic groups most similar to Arapaho are Black/African American ($81,912, a difference of 0.18%), Immigrants from Congo ($82,216, a difference of 0.19%), Dutch West Indian ($81,852, a difference of 0.26%), Sioux ($82,386, a difference of 0.39%), and Creek ($82,560, a difference of 0.61%).
DemographicsRating | RankMedian Family Income
Seminole
0.0
/100
|
#320
Tragic
$83,354
Immigrants | Caribbean
0.0
/100
|
#321
Tragic
$83,319
Dominicans
0.0
/100
|
#322
Tragic
$82,888
Bahamians
0.0
/100
|
#323
Tragic
$82,631
Creek
0.0
/100
|
#324
Tragic
$82,560
Sioux
0.0
/100
|
#325
Tragic
$82,386
Immigrants | Congo
0.0
/100
|
#326
Tragic
$82,216
Arapaho
0.0
/100
|
#327
Tragic
$82,064
Blacks/African Americans
0.0
/100
|
#328
Tragic
$81,912
Dutch West Indians
0.0
/100
|
#329
Tragic
$81,852
Cheyenne
0.0
/100
|
#330
Tragic
$81,385
Immigrants | Dominican Republic
0.0
/100
|
#331
Tragic
$81,233
Natives/Alaskans
0.0
/100
|
#332
Tragic
$80,908
Kiowa
0.0
/100
|
#333
Tragic
$80,885
Menominee
0.0
/100
|
#334
Tragic
$79,563

Demographics Similar to Immigrants from Chile by Median Family Income

In terms of median family income, the demographic groups most similar to Immigrants from Chile are Hungarian ($105,609, a difference of 0.040%), Immigrants from Germany ($105,507, a difference of 0.14%), Czech ($105,839, a difference of 0.17%), Irish ($105,453, a difference of 0.19%), and Peruvian ($105,444, a difference of 0.20%).
DemographicsRating | RankMedian Family Income
Norwegians
85.5
/100
|
#140
Excellent
$106,144
Immigrants | Syria
85.3
/100
|
#141
Excellent
$106,118
Slovenes
84.7
/100
|
#142
Excellent
$106,020
Tongans
84.3
/100
|
#143
Excellent
$105,967
Immigrants | Morocco
84.3
/100
|
#144
Excellent
$105,964
Danes
83.8
/100
|
#145
Excellent
$105,900
Czechs
83.4
/100
|
#146
Excellent
$105,839
Immigrants | Chile
82.1
/100
|
#147
Excellent
$105,655
Hungarians
81.7
/100
|
#148
Excellent
$105,609
Immigrants | Germany
80.9
/100
|
#149
Excellent
$105,507
Irish
80.5
/100
|
#150
Excellent
$105,453
Peruvians
80.4
/100
|
#151
Excellent
$105,444
Immigrants | Albania
79.1
/100
|
#152
Good
$105,285
Slavs
77.9
/100
|
#153
Good
$105,144
Immigrants | Nepal
76.3
/100
|
#154
Good
$104,966