Arapaho vs Immigrants from South Africa Married-Couple Family Poverty
COMPARE
Arapaho
Immigrants from South Africa
Married-Couple Family Poverty
Married-Couple Family Poverty Comparison
Arapaho
Immigrants from South Africa
6.6%
MARRIED-COUPLE FAMILY POVERTY
0.0/ 100
METRIC RATING
293rd/ 347
METRIC RANK
4.5%
MARRIED-COUPLE FAMILY POVERTY
99.1/ 100
METRIC RATING
76th/ 347
METRIC RANK
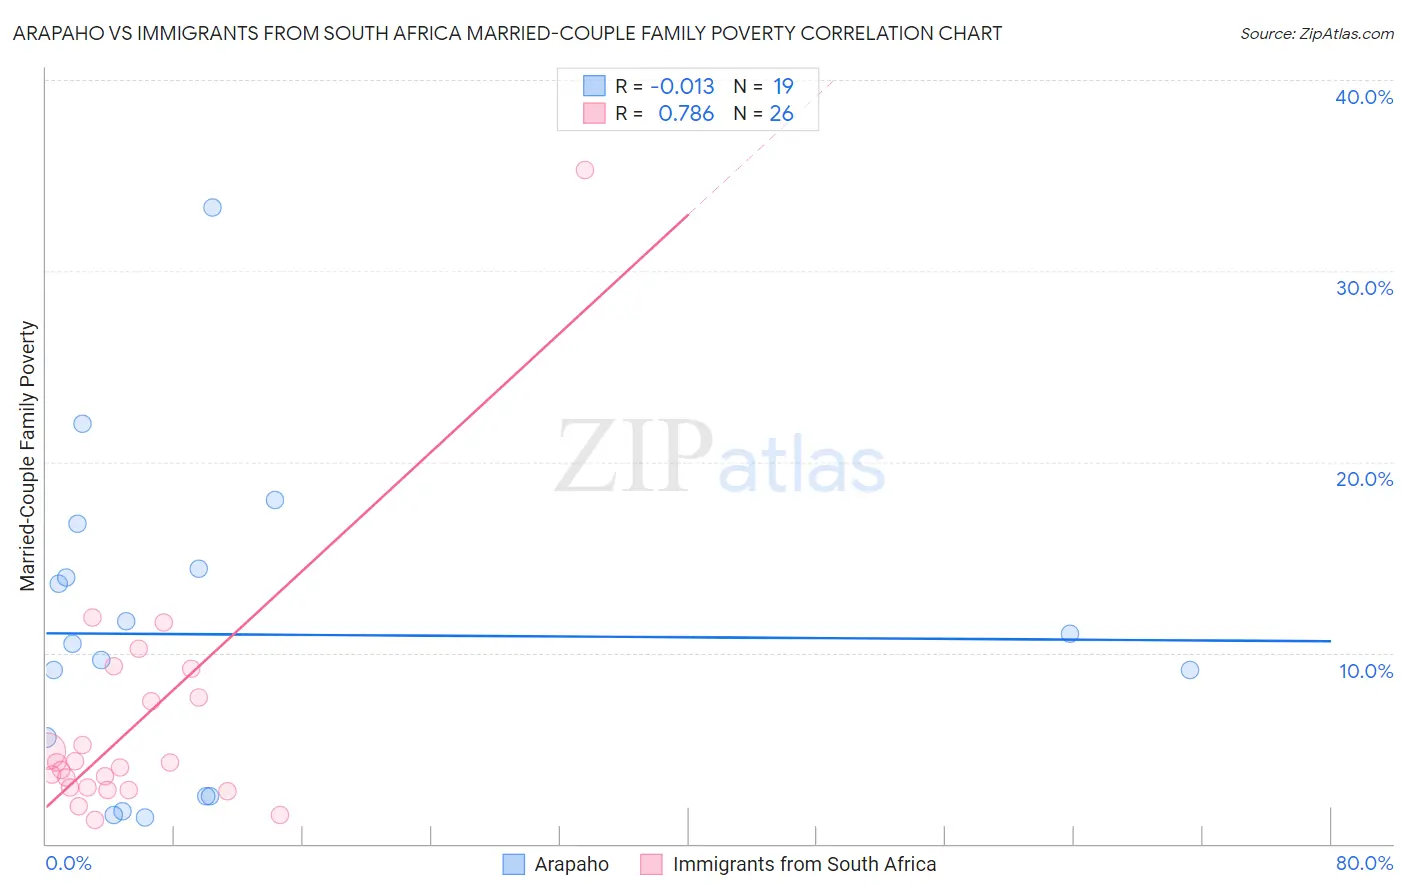
Arapaho vs Immigrants from South Africa Married-Couple Family Poverty Correlation Chart
The statistical analysis conducted on geographies consisting of 29,746,597 people shows no correlation between the proportion of Arapaho and poverty level among married-couple families in the United States with a correlation coefficient (R) of -0.013 and weighted average of 6.6%. Similarly, the statistical analysis conducted on geographies consisting of 231,973,185 people shows a strong positive correlation between the proportion of Immigrants from South Africa and poverty level among married-couple families in the United States with a correlation coefficient (R) of 0.786 and weighted average of 4.5%, a difference of 45.9%.
Married-Couple Family Poverty Correlation Summary
| Measurement | Arapaho | Immigrants from South Africa |
| Minimum | 1.4% | 1.2% |
| Maximum | 33.3% | 35.3% |
| Range | 31.9% | 34.1% |
| Mean | 11.0% | 6.3% |
| Median | 10.5% | 4.1% |
| Interquartile 25% (IQ1) | 2.5% | 2.9% |
| Interquartile 75% (IQ3) | 14.4% | 7.7% |
| Interquartile Range (IQR) | 11.9% | 4.8% |
| Standard Deviation (Sample) | 8.1% | 6.7% |
| Standard Deviation (Population) | 7.9% | 6.5% |
Similar Demographics by Married-Couple Family Poverty
Demographics Similar to Arapaho by Married-Couple Family Poverty
In terms of married-couple family poverty, the demographic groups most similar to Arapaho are Immigrants from Lebanon (6.6%, a difference of 0.080%), Belizean (6.5%, a difference of 0.26%), Immigrants from Barbados (6.5%, a difference of 0.29%), Nepalese (6.5%, a difference of 0.52%), and Salvadoran (6.5%, a difference of 0.70%).
| Demographics | Rating | Rank | Married-Couple Family Poverty |
| Guyanese | 0.0 /100 | #286 | Tragic 6.5% |
| Ecuadorians | 0.0 /100 | #287 | Tragic 6.5% |
| Salvadorans | 0.0 /100 | #288 | Tragic 6.5% |
| Nepalese | 0.0 /100 | #289 | Tragic 6.5% |
| Immigrants | Barbados | 0.0 /100 | #290 | Tragic 6.5% |
| Belizeans | 0.0 /100 | #291 | Tragic 6.5% |
| Immigrants | Lebanon | 0.0 /100 | #292 | Tragic 6.6% |
| Arapaho | 0.0 /100 | #293 | Tragic 6.6% |
| Bahamians | 0.0 /100 | #294 | Tragic 6.6% |
| Immigrants | Uzbekistan | 0.0 /100 | #295 | Tragic 6.6% |
| U.S. Virgin Islanders | 0.0 /100 | #296 | Tragic 6.6% |
| Kiowa | 0.0 /100 | #297 | Tragic 6.6% |
| Immigrants | Guyana | 0.0 /100 | #298 | Tragic 6.7% |
| Nicaraguans | 0.0 /100 | #299 | Tragic 6.7% |
| Immigrants | Belize | 0.0 /100 | #300 | Tragic 6.7% |
Demographics Similar to Immigrants from South Africa by Married-Couple Family Poverty
In terms of married-couple family poverty, the demographic groups most similar to Immigrants from South Africa are Cambodian (4.5%, a difference of 0.11%), Immigrants from Latvia (4.5%, a difference of 0.17%), Scotch-Irish (4.5%, a difference of 0.25%), Immigrants from Austria (4.5%, a difference of 0.38%), and Ukrainian (4.5%, a difference of 0.48%).
| Demographics | Rating | Rank | Married-Couple Family Poverty |
| New Zealanders | 99.4 /100 | #69 | Exceptional 4.4% |
| Immigrants | Korea | 99.4 /100 | #70 | Exceptional 4.5% |
| Immigrants | North America | 99.3 /100 | #71 | Exceptional 4.5% |
| Immigrants | England | 99.3 /100 | #72 | Exceptional 4.5% |
| Ukrainians | 99.2 /100 | #73 | Exceptional 4.5% |
| Immigrants | Austria | 99.2 /100 | #74 | Exceptional 4.5% |
| Cambodians | 99.2 /100 | #75 | Exceptional 4.5% |
| Immigrants | South Africa | 99.1 /100 | #76 | Exceptional 4.5% |
| Immigrants | Latvia | 99.1 /100 | #77 | Exceptional 4.5% |
| Scotch-Irish | 99.1 /100 | #78 | Exceptional 4.5% |
| Immigrants | Iran | 99.0 /100 | #79 | Exceptional 4.5% |
| Icelanders | 99.0 /100 | #80 | Exceptional 4.5% |
| Immigrants | Greece | 98.9 /100 | #81 | Exceptional 4.5% |
| Canadians | 98.8 /100 | #82 | Exceptional 4.5% |
| Immigrants | Denmark | 98.8 /100 | #83 | Exceptional 4.6% |