Aleut vs Lithuanian Single Female Poverty
COMPARE
Aleut
Lithuanian
Single Female Poverty
Single Female Poverty Comparison
Aleuts
Lithuanians
25.4%
SINGLE FEMALE POVERTY
0.0/ 100
METRIC RATING
308th/ 347
METRIC RANK
19.2%
SINGLE FEMALE POVERTY
99.6/ 100
METRIC RATING
62nd/ 347
METRIC RANK
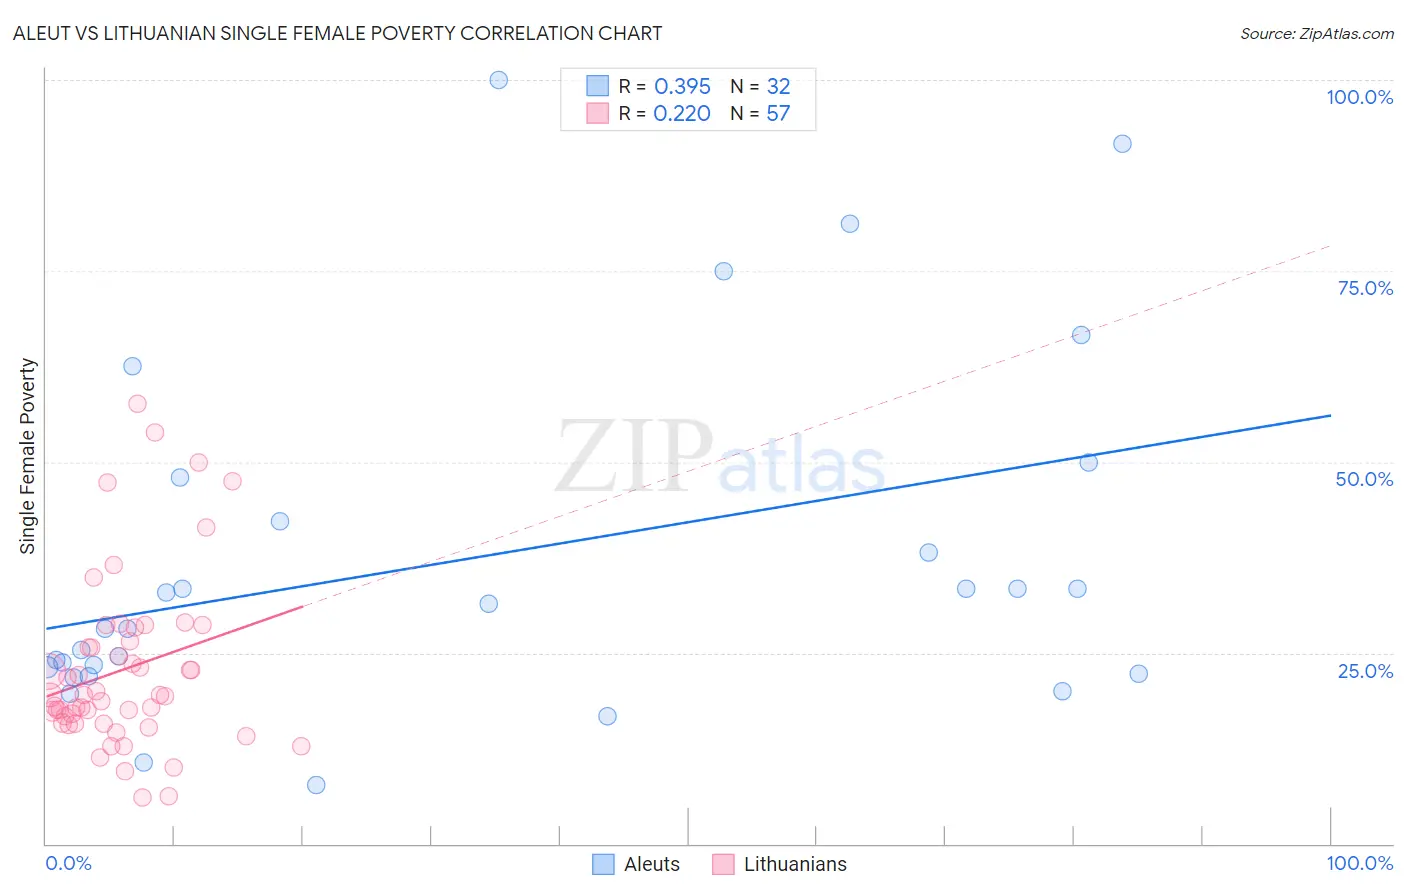
Aleut vs Lithuanian Single Female Poverty Correlation Chart
The statistical analysis conducted on geographies consisting of 61,521,342 people shows a mild positive correlation between the proportion of Aleuts and poverty level among single females in the United States with a correlation coefficient (R) of 0.395 and weighted average of 25.4%. Similarly, the statistical analysis conducted on geographies consisting of 412,150,693 people shows a weak positive correlation between the proportion of Lithuanians and poverty level among single females in the United States with a correlation coefficient (R) of 0.220 and weighted average of 19.2%, a difference of 32.4%.
Single Female Poverty Correlation Summary
| Measurement | Aleut | Lithuanian |
| Minimum | 7.7% | 6.1% |
| Maximum | 100.0% | 57.6% |
| Range | 92.3% | 51.5% |
| Mean | 37.3% | 22.8% |
| Median | 29.8% | 19.4% |
| Interquartile 25% (IQ1) | 22.7% | 15.7% |
| Interquartile 75% (IQ3) | 45.1% | 27.4% |
| Interquartile Range (IQR) | 22.4% | 11.7% |
| Standard Deviation (Sample) | 23.2% | 11.3% |
| Standard Deviation (Population) | 22.8% | 11.2% |
Similar Demographics by Single Female Poverty
Demographics Similar to Aleuts by Single Female Poverty
In terms of single female poverty, the demographic groups most similar to Aleuts are Dominican (25.4%, a difference of 0.010%), Central American Indian (25.5%, a difference of 0.16%), Potawatomi (25.4%, a difference of 0.17%), Immigrants from Mexico (25.3%, a difference of 0.39%), and Immigrants from Honduras (25.5%, a difference of 0.44%).
| Demographics | Rating | Rank | Single Female Poverty |
| Hondurans | 0.0 /100 | #301 | Tragic 25.1% |
| Shoshone | 0.0 /100 | #302 | Tragic 25.1% |
| Somalis | 0.0 /100 | #303 | Tragic 25.2% |
| Immigrants | Congo | 0.0 /100 | #304 | Tragic 25.3% |
| Immigrants | Dominican Republic | 0.0 /100 | #305 | Tragic 25.3% |
| Immigrants | Mexico | 0.0 /100 | #306 | Tragic 25.3% |
| Potawatomi | 0.0 /100 | #307 | Tragic 25.4% |
| Aleuts | 0.0 /100 | #308 | Tragic 25.4% |
| Dominicans | 0.0 /100 | #309 | Tragic 25.4% |
| Central American Indians | 0.0 /100 | #310 | Tragic 25.5% |
| Immigrants | Honduras | 0.0 /100 | #311 | Tragic 25.5% |
| Paiute | 0.0 /100 | #312 | Tragic 25.5% |
| Comanche | 0.0 /100 | #313 | Tragic 25.6% |
| Cherokee | 0.0 /100 | #314 | Tragic 25.7% |
| Iroquois | 0.0 /100 | #315 | Tragic 25.7% |
Demographics Similar to Lithuanians by Single Female Poverty
In terms of single female poverty, the demographic groups most similar to Lithuanians are Cambodian (19.2%, a difference of 0.050%), Russian (19.2%, a difference of 0.070%), Immigrants from Northern Europe (19.2%, a difference of 0.12%), Immigrants from Europe (19.2%, a difference of 0.13%), and Cypriot (19.2%, a difference of 0.15%).
| Demographics | Rating | Rank | Single Female Poverty |
| Immigrants | Vietnam | 99.7 /100 | #55 | Exceptional 19.1% |
| Immigrants | Fiji | 99.7 /100 | #56 | Exceptional 19.1% |
| Eastern Europeans | 99.7 /100 | #57 | Exceptional 19.1% |
| Immigrants | Bulgaria | 99.7 /100 | #58 | Exceptional 19.1% |
| Sri Lankans | 99.6 /100 | #59 | Exceptional 19.2% |
| Russians | 99.6 /100 | #60 | Exceptional 19.2% |
| Cambodians | 99.6 /100 | #61 | Exceptional 19.2% |
| Lithuanians | 99.6 /100 | #62 | Exceptional 19.2% |
| Immigrants | Northern Europe | 99.6 /100 | #63 | Exceptional 19.2% |
| Immigrants | Europe | 99.6 /100 | #64 | Exceptional 19.2% |
| Cypriots | 99.6 /100 | #65 | Exceptional 19.2% |
| Palestinians | 99.6 /100 | #66 | Exceptional 19.2% |
| Immigrants | Egypt | 99.6 /100 | #67 | Exceptional 19.2% |
| Laotians | 99.5 /100 | #68 | Exceptional 19.3% |
| Paraguayans | 99.5 /100 | #69 | Exceptional 19.3% |