Aleut vs Immigrants from Israel Single Female Poverty
COMPARE
Aleut
Immigrants from Israel
Single Female Poverty
Single Female Poverty Comparison
Aleuts
Immigrants from Israel
25.4%
SINGLE FEMALE POVERTY
0.0/ 100
METRIC RATING
308th/ 347
METRIC RANK
18.3%
SINGLE FEMALE POVERTY
100.0/ 100
METRIC RATING
26th/ 347
METRIC RANK
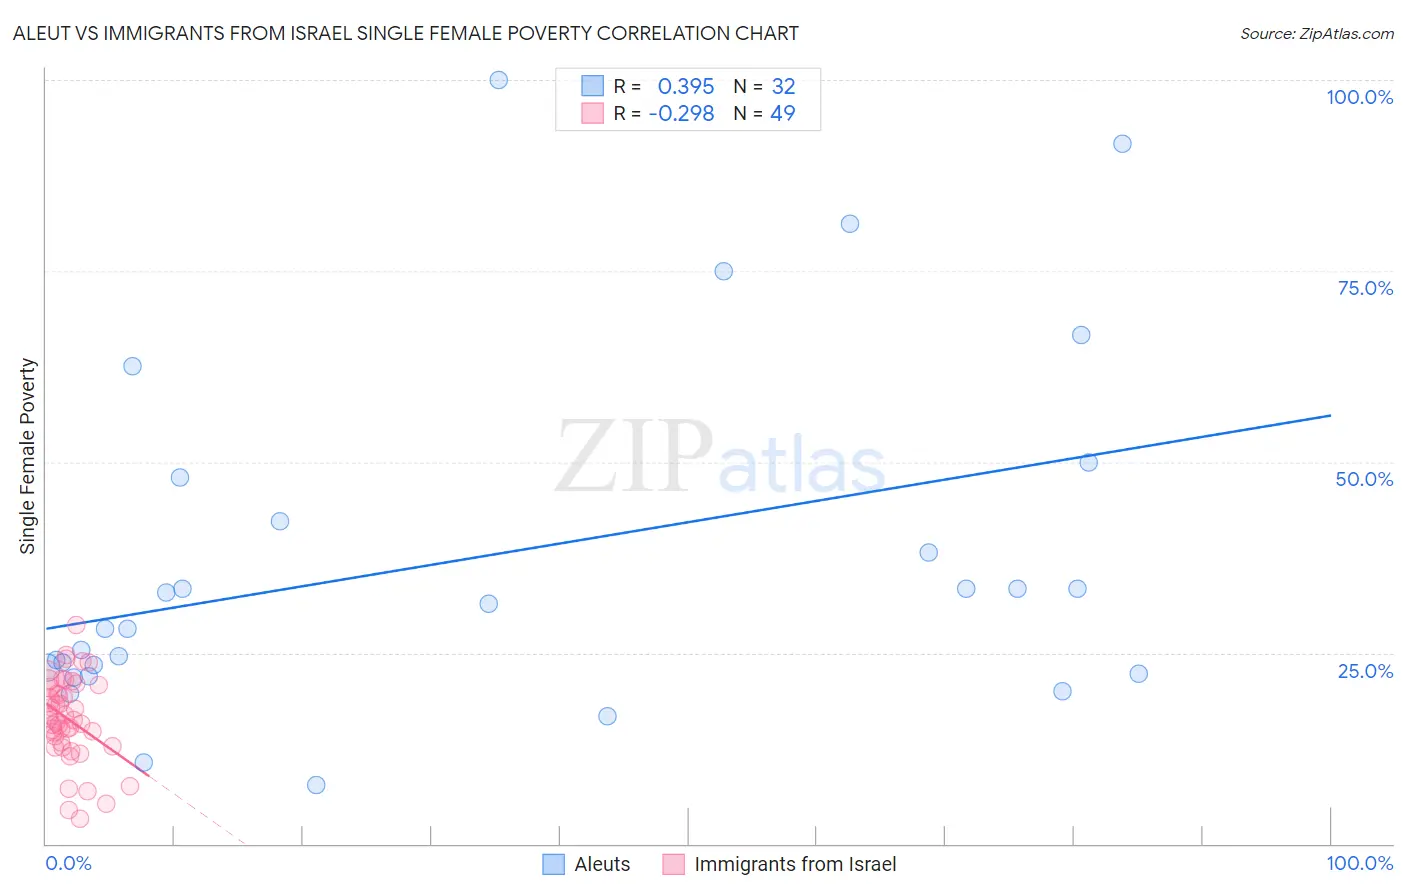
Aleut vs Immigrants from Israel Single Female Poverty Correlation Chart
The statistical analysis conducted on geographies consisting of 61,521,342 people shows a mild positive correlation between the proportion of Aleuts and poverty level among single females in the United States with a correlation coefficient (R) of 0.395 and weighted average of 25.4%. Similarly, the statistical analysis conducted on geographies consisting of 207,619,232 people shows a weak negative correlation between the proportion of Immigrants from Israel and poverty level among single females in the United States with a correlation coefficient (R) of -0.298 and weighted average of 18.3%, a difference of 38.6%.
Single Female Poverty Correlation Summary
| Measurement | Aleut | Immigrants from Israel |
| Minimum | 7.7% | 3.3% |
| Maximum | 100.0% | 28.6% |
| Range | 92.3% | 25.2% |
| Mean | 37.3% | 16.3% |
| Median | 29.8% | 16.3% |
| Interquartile 25% (IQ1) | 22.7% | 13.0% |
| Interquartile 75% (IQ3) | 45.1% | 20.6% |
| Interquartile Range (IQR) | 22.4% | 7.6% |
| Standard Deviation (Sample) | 23.2% | 5.5% |
| Standard Deviation (Population) | 22.8% | 5.4% |
Similar Demographics by Single Female Poverty
Demographics Similar to Aleuts by Single Female Poverty
In terms of single female poverty, the demographic groups most similar to Aleuts are Dominican (25.4%, a difference of 0.010%), Central American Indian (25.5%, a difference of 0.16%), Potawatomi (25.4%, a difference of 0.17%), Immigrants from Mexico (25.3%, a difference of 0.39%), and Immigrants from Honduras (25.5%, a difference of 0.44%).
| Demographics | Rating | Rank | Single Female Poverty |
| Hondurans | 0.0 /100 | #301 | Tragic 25.1% |
| Shoshone | 0.0 /100 | #302 | Tragic 25.1% |
| Somalis | 0.0 /100 | #303 | Tragic 25.2% |
| Immigrants | Congo | 0.0 /100 | #304 | Tragic 25.3% |
| Immigrants | Dominican Republic | 0.0 /100 | #305 | Tragic 25.3% |
| Immigrants | Mexico | 0.0 /100 | #306 | Tragic 25.3% |
| Potawatomi | 0.0 /100 | #307 | Tragic 25.4% |
| Aleuts | 0.0 /100 | #308 | Tragic 25.4% |
| Dominicans | 0.0 /100 | #309 | Tragic 25.4% |
| Central American Indians | 0.0 /100 | #310 | Tragic 25.5% |
| Immigrants | Honduras | 0.0 /100 | #311 | Tragic 25.5% |
| Paiute | 0.0 /100 | #312 | Tragic 25.5% |
| Comanche | 0.0 /100 | #313 | Tragic 25.6% |
| Cherokee | 0.0 /100 | #314 | Tragic 25.7% |
| Iroquois | 0.0 /100 | #315 | Tragic 25.7% |
Demographics Similar to Immigrants from Israel by Single Female Poverty
In terms of single female poverty, the demographic groups most similar to Immigrants from Israel are Immigrants from Singapore (18.3%, a difference of 0.020%), Armenian (18.3%, a difference of 0.12%), Immigrants from Pakistan (18.4%, a difference of 0.33%), Burmese (18.3%, a difference of 0.35%), and Asian (18.3%, a difference of 0.35%).
| Demographics | Rating | Rank | Single Female Poverty |
| Immigrants | China | 100.0 /100 | #19 | Exceptional 18.1% |
| Immigrants | Greece | 100.0 /100 | #20 | Exceptional 18.3% |
| Maltese | 100.0 /100 | #21 | Exceptional 18.3% |
| Burmese | 100.0 /100 | #22 | Exceptional 18.3% |
| Asians | 100.0 /100 | #23 | Exceptional 18.3% |
| Armenians | 100.0 /100 | #24 | Exceptional 18.3% |
| Immigrants | Singapore | 100.0 /100 | #25 | Exceptional 18.3% |
| Immigrants | Israel | 100.0 /100 | #26 | Exceptional 18.3% |
| Immigrants | Pakistan | 100.0 /100 | #27 | Exceptional 18.4% |
| Immigrants | Moldova | 100.0 /100 | #28 | Exceptional 18.5% |
| Immigrants | Poland | 100.0 /100 | #29 | Exceptional 18.5% |
| Immigrants | North Macedonia | 99.9 /100 | #30 | Exceptional 18.5% |
| Immigrants | Asia | 99.9 /100 | #31 | Exceptional 18.6% |
| Immigrants | Sri Lanka | 99.9 /100 | #32 | Exceptional 18.6% |
| Immigrants | Philippines | 99.9 /100 | #33 | Exceptional 18.6% |