Aleut vs Immigrants from Austria Single Female Poverty
COMPARE
Aleut
Immigrants from Austria
Single Female Poverty
Single Female Poverty Comparison
Aleuts
Immigrants from Austria
25.4%
SINGLE FEMALE POVERTY
0.0/ 100
METRIC RATING
308th/ 347
METRIC RANK
19.6%
SINGLE FEMALE POVERTY
98.8/ 100
METRIC RATING
93rd/ 347
METRIC RANK
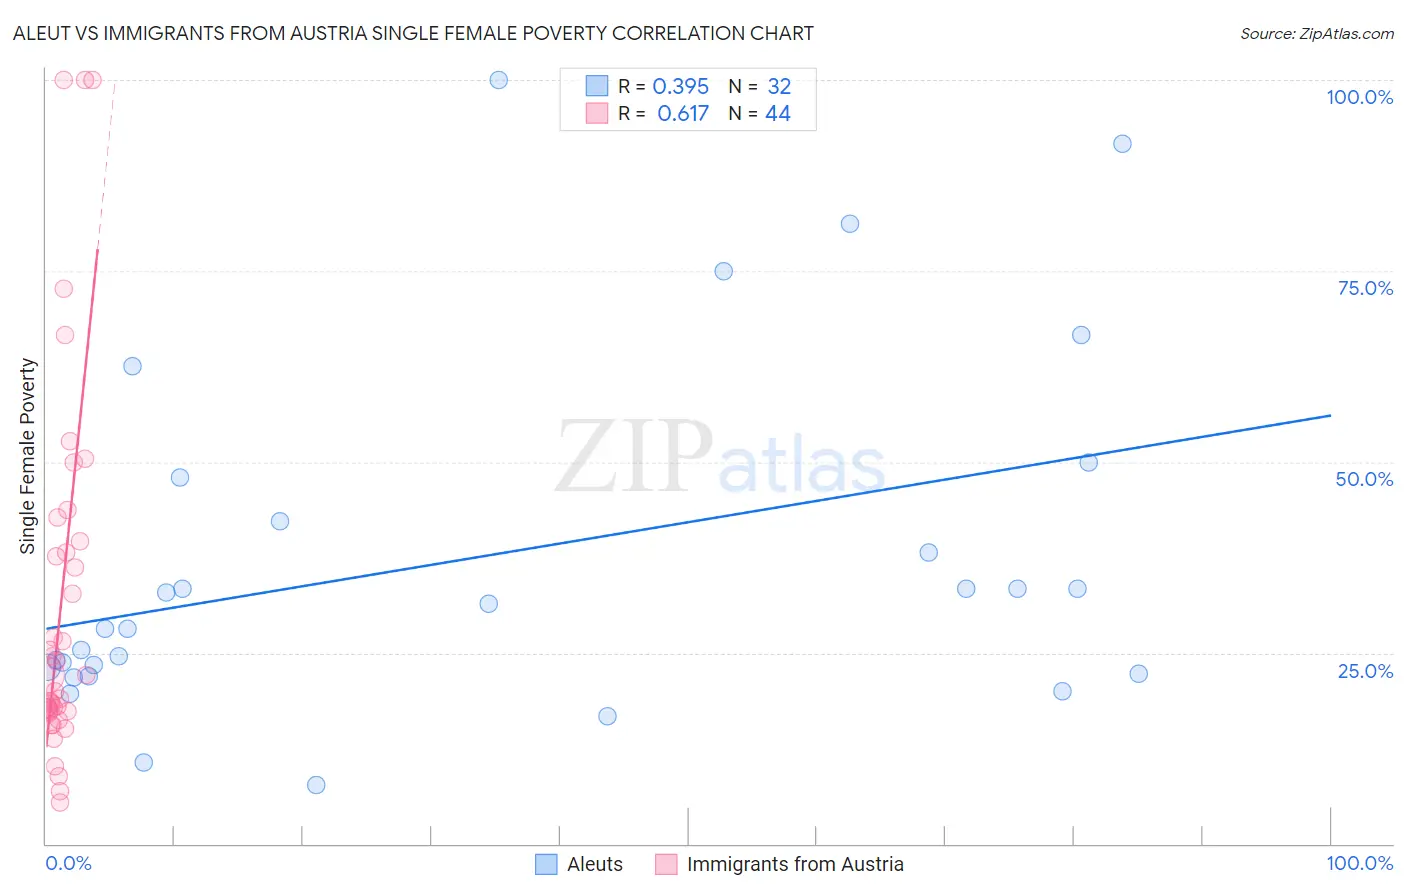
Aleut vs Immigrants from Austria Single Female Poverty Correlation Chart
The statistical analysis conducted on geographies consisting of 61,521,342 people shows a mild positive correlation between the proportion of Aleuts and poverty level among single females in the United States with a correlation coefficient (R) of 0.395 and weighted average of 25.4%. Similarly, the statistical analysis conducted on geographies consisting of 166,235,913 people shows a significant positive correlation between the proportion of Immigrants from Austria and poverty level among single females in the United States with a correlation coefficient (R) of 0.617 and weighted average of 19.6%, a difference of 29.8%.
Single Female Poverty Correlation Summary
| Measurement | Aleut | Immigrants from Austria |
| Minimum | 7.7% | 5.5% |
| Maximum | 100.0% | 100.0% |
| Range | 92.3% | 94.5% |
| Mean | 37.3% | 31.3% |
| Median | 29.8% | 21.0% |
| Interquartile 25% (IQ1) | 22.7% | 17.4% |
| Interquartile 75% (IQ3) | 45.1% | 38.9% |
| Interquartile Range (IQR) | 22.4% | 21.4% |
| Standard Deviation (Sample) | 23.2% | 24.1% |
| Standard Deviation (Population) | 22.8% | 23.8% |
Similar Demographics by Single Female Poverty
Demographics Similar to Aleuts by Single Female Poverty
In terms of single female poverty, the demographic groups most similar to Aleuts are Dominican (25.4%, a difference of 0.010%), Central American Indian (25.5%, a difference of 0.16%), Potawatomi (25.4%, a difference of 0.17%), Immigrants from Mexico (25.3%, a difference of 0.39%), and Immigrants from Honduras (25.5%, a difference of 0.44%).
| Demographics | Rating | Rank | Single Female Poverty |
| Hondurans | 0.0 /100 | #301 | Tragic 25.1% |
| Shoshone | 0.0 /100 | #302 | Tragic 25.1% |
| Somalis | 0.0 /100 | #303 | Tragic 25.2% |
| Immigrants | Congo | 0.0 /100 | #304 | Tragic 25.3% |
| Immigrants | Dominican Republic | 0.0 /100 | #305 | Tragic 25.3% |
| Immigrants | Mexico | 0.0 /100 | #306 | Tragic 25.3% |
| Potawatomi | 0.0 /100 | #307 | Tragic 25.4% |
| Aleuts | 0.0 /100 | #308 | Tragic 25.4% |
| Dominicans | 0.0 /100 | #309 | Tragic 25.4% |
| Central American Indians | 0.0 /100 | #310 | Tragic 25.5% |
| Immigrants | Honduras | 0.0 /100 | #311 | Tragic 25.5% |
| Paiute | 0.0 /100 | #312 | Tragic 25.5% |
| Comanche | 0.0 /100 | #313 | Tragic 25.6% |
| Cherokee | 0.0 /100 | #314 | Tragic 25.7% |
| Iroquois | 0.0 /100 | #315 | Tragic 25.7% |
Demographics Similar to Immigrants from Austria by Single Female Poverty
In terms of single female poverty, the demographic groups most similar to Immigrants from Austria are Italian (19.6%, a difference of 0.010%), Soviet Union (19.6%, a difference of 0.060%), Immigrants from Lebanon (19.6%, a difference of 0.12%), Romanian (19.6%, a difference of 0.22%), and Immigrants from Ukraine (19.5%, a difference of 0.30%).
| Demographics | Rating | Rank | Single Female Poverty |
| Greeks | 99.2 /100 | #86 | Exceptional 19.4% |
| Zimbabweans | 99.0 /100 | #87 | Exceptional 19.5% |
| Afghans | 99.0 /100 | #88 | Exceptional 19.5% |
| Immigrants | Ukraine | 99.0 /100 | #89 | Exceptional 19.5% |
| Immigrants | Lebanon | 98.8 /100 | #90 | Exceptional 19.6% |
| Soviet Union | 98.8 /100 | #91 | Exceptional 19.6% |
| Italians | 98.8 /100 | #92 | Exceptional 19.6% |
| Immigrants | Austria | 98.8 /100 | #93 | Exceptional 19.6% |
| Romanians | 98.6 /100 | #94 | Exceptional 19.6% |
| Estonians | 98.2 /100 | #95 | Exceptional 19.7% |
| Immigrants | Brazil | 98.2 /100 | #96 | Exceptional 19.7% |
| Croatians | 98.1 /100 | #97 | Exceptional 19.7% |
| Immigrants | France | 97.9 /100 | #98 | Exceptional 19.7% |
| Sierra Leoneans | 97.9 /100 | #99 | Exceptional 19.7% |
| Ukrainians | 97.6 /100 | #100 | Exceptional 19.8% |