Immigrants from Scotland vs Lithuanian Single Female Poverty
COMPARE
Immigrants from Scotland
Lithuanian
Single Female Poverty
Single Female Poverty Comparison
Immigrants from Scotland
Lithuanians
19.4%
SINGLE FEMALE POVERTY
99.2/ 100
METRIC RATING
81st/ 347
METRIC RANK
19.2%
SINGLE FEMALE POVERTY
99.6/ 100
METRIC RATING
62nd/ 347
METRIC RANK
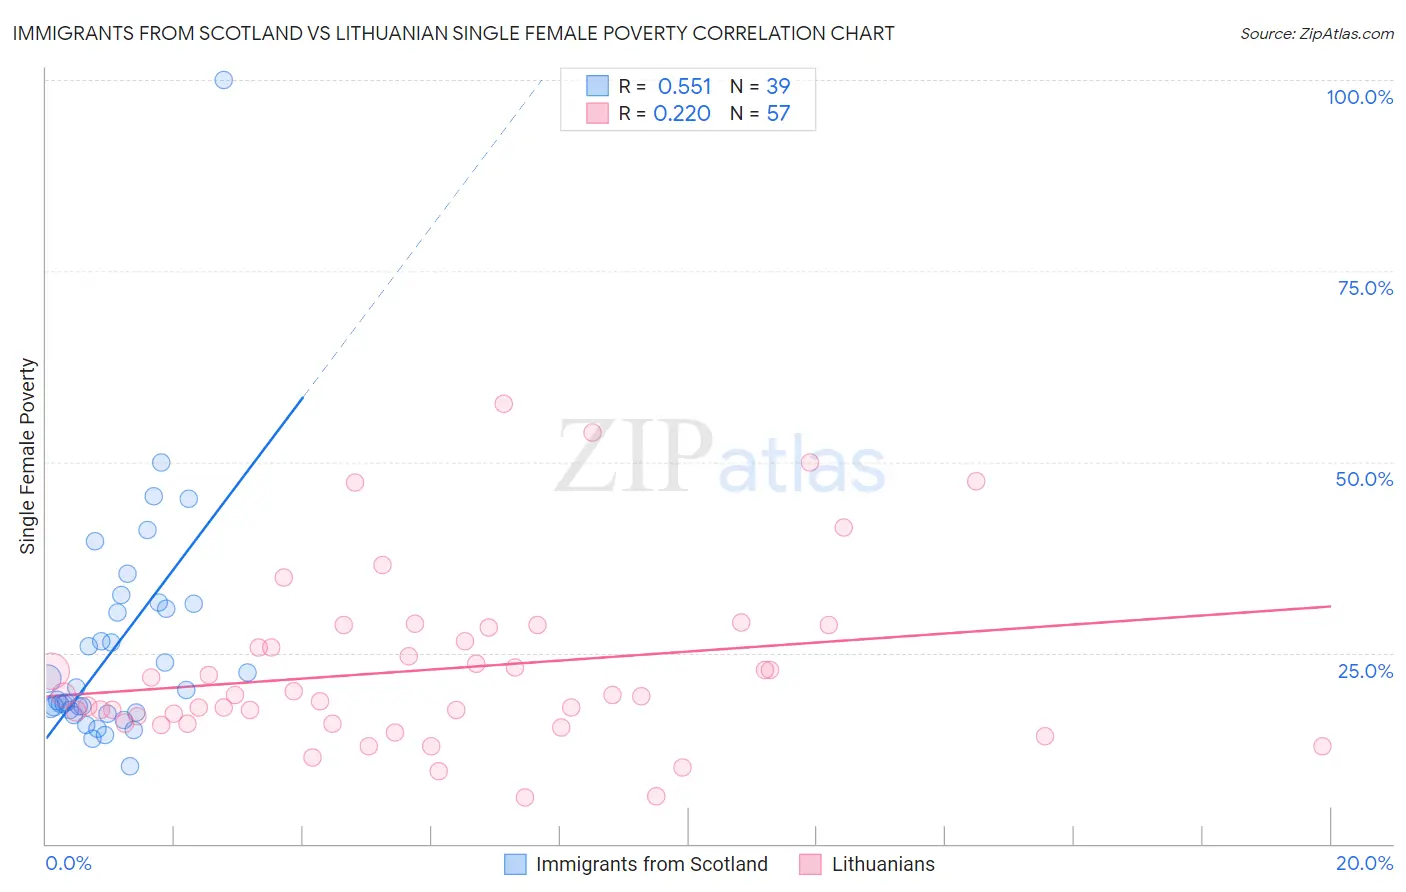
Immigrants from Scotland vs Lithuanian Single Female Poverty Correlation Chart
The statistical analysis conducted on geographies consisting of 194,087,969 people shows a substantial positive correlation between the proportion of Immigrants from Scotland and poverty level among single females in the United States with a correlation coefficient (R) of 0.551 and weighted average of 19.4%. Similarly, the statistical analysis conducted on geographies consisting of 412,150,693 people shows a weak positive correlation between the proportion of Lithuanians and poverty level among single females in the United States with a correlation coefficient (R) of 0.220 and weighted average of 19.2%, a difference of 1.1%.
Single Female Poverty Correlation Summary
| Measurement | Immigrants from Scotland | Lithuanian |
| Minimum | 10.1% | 6.1% |
| Maximum | 100.0% | 57.6% |
| Range | 89.9% | 51.5% |
| Mean | 26.0% | 22.8% |
| Median | 20.2% | 19.4% |
| Interquartile 25% (IQ1) | 17.1% | 15.7% |
| Interquartile 75% (IQ3) | 31.4% | 27.4% |
| Interquartile Range (IQR) | 14.3% | 11.7% |
| Standard Deviation (Sample) | 15.7% | 11.3% |
| Standard Deviation (Population) | 15.5% | 11.2% |
Demographics Similar to Immigrants from Scotland and Lithuanians by Single Female Poverty
In terms of single female poverty, the demographic groups most similar to Immigrants from Scotland are Immigrants from Australia (19.4%, a difference of 0.020%), Immigrants from Sierra Leone (19.4%, a difference of 0.060%), Albanian (19.4%, a difference of 0.080%), Immigrants from Russia (19.4%, a difference of 0.15%), and Peruvian (19.4%, a difference of 0.28%). Similarly, the demographic groups most similar to Lithuanians are Cambodian (19.2%, a difference of 0.050%), Immigrants from Northern Europe (19.2%, a difference of 0.12%), Immigrants from Europe (19.2%, a difference of 0.13%), Cypriot (19.2%, a difference of 0.15%), and Palestinian (19.2%, a difference of 0.17%).
| Demographics | Rating | Rank | Single Female Poverty |
| Cambodians | 99.6 /100 | #61 | Exceptional 19.2% |
| Lithuanians | 99.6 /100 | #62 | Exceptional 19.2% |
| Immigrants | Northern Europe | 99.6 /100 | #63 | Exceptional 19.2% |
| Immigrants | Europe | 99.6 /100 | #64 | Exceptional 19.2% |
| Cypriots | 99.6 /100 | #65 | Exceptional 19.2% |
| Palestinians | 99.6 /100 | #66 | Exceptional 19.2% |
| Immigrants | Egypt | 99.6 /100 | #67 | Exceptional 19.2% |
| Laotians | 99.5 /100 | #68 | Exceptional 19.3% |
| Paraguayans | 99.5 /100 | #69 | Exceptional 19.3% |
| Immigrants | Jordan | 99.4 /100 | #70 | Exceptional 19.3% |
| Immigrants | South Eastern Asia | 99.4 /100 | #71 | Exceptional 19.3% |
| Immigrants | Latvia | 99.4 /100 | #72 | Exceptional 19.3% |
| Immigrants | Peru | 99.4 /100 | #73 | Exceptional 19.3% |
| Immigrants | Belarus | 99.4 /100 | #74 | Exceptional 19.3% |
| Immigrants | Turkey | 99.4 /100 | #75 | Exceptional 19.4% |
| Peruvians | 99.4 /100 | #76 | Exceptional 19.4% |
| Immigrants | Russia | 99.3 /100 | #77 | Exceptional 19.4% |
| Albanians | 99.3 /100 | #78 | Exceptional 19.4% |
| Immigrants | Sierra Leone | 99.3 /100 | #79 | Exceptional 19.4% |
| Immigrants | Australia | 99.3 /100 | #80 | Exceptional 19.4% |
| Immigrants | Scotland | 99.2 /100 | #81 | Exceptional 19.4% |