Aleut vs English Single Female Poverty
COMPARE
Aleut
English
Single Female Poverty
Single Female Poverty Comparison
Aleuts
English
25.4%
SINGLE FEMALE POVERTY
0.0/ 100
METRIC RATING
308th/ 347
METRIC RANK
21.9%
SINGLE FEMALE POVERTY
6.4/ 100
METRIC RATING
225th/ 347
METRIC RANK
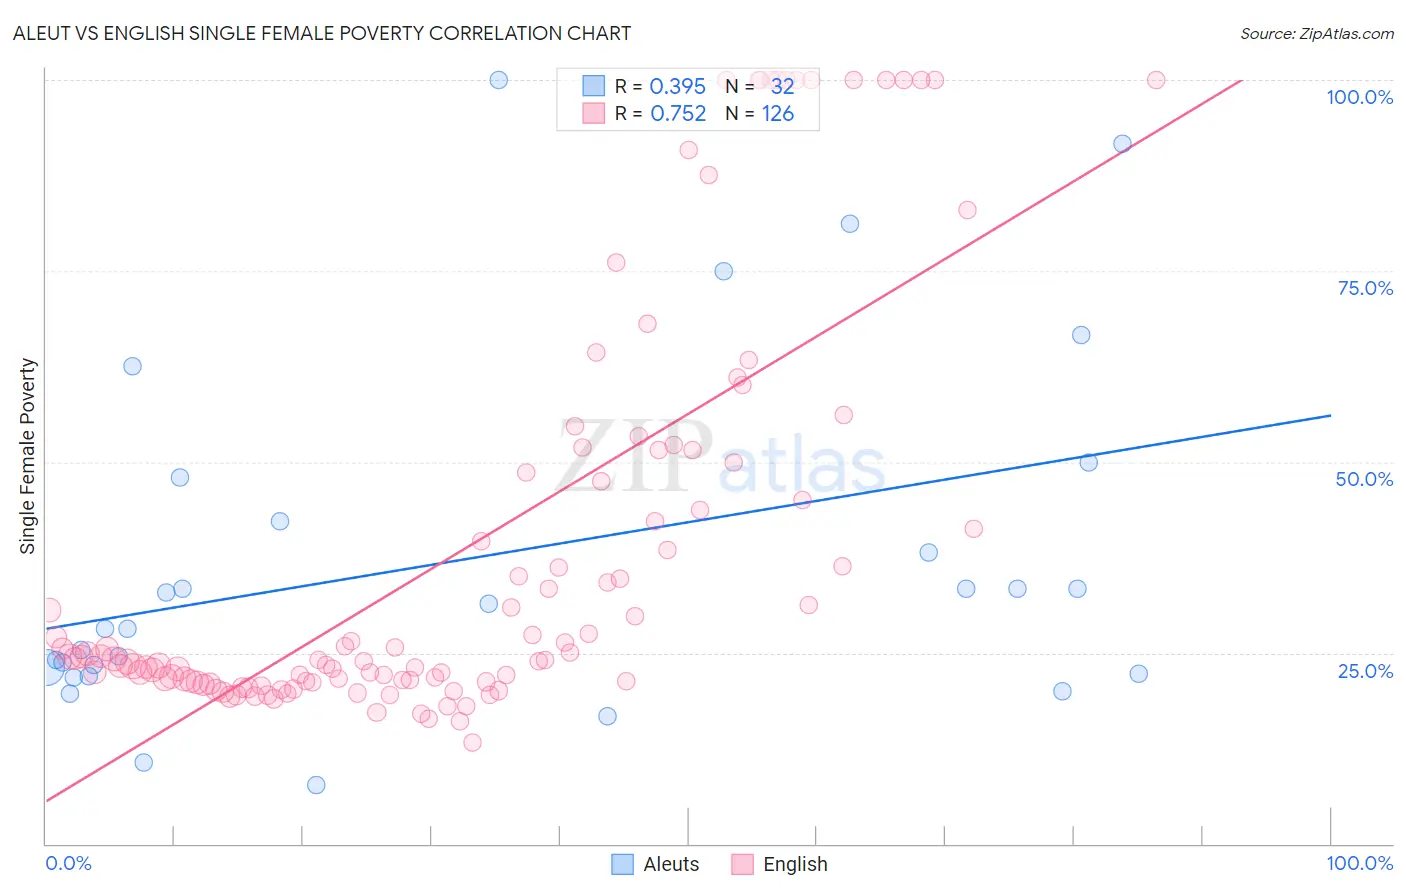
Aleut vs English Single Female Poverty Correlation Chart
The statistical analysis conducted on geographies consisting of 61,521,342 people shows a mild positive correlation between the proportion of Aleuts and poverty level among single females in the United States with a correlation coefficient (R) of 0.395 and weighted average of 25.4%. Similarly, the statistical analysis conducted on geographies consisting of 556,985,462 people shows a strong positive correlation between the proportion of English and poverty level among single females in the United States with a correlation coefficient (R) of 0.752 and weighted average of 21.9%, a difference of 16.2%.
Single Female Poverty Correlation Summary
| Measurement | Aleut | English |
| Minimum | 7.7% | 13.3% |
| Maximum | 100.0% | 100.0% |
| Range | 92.3% | 86.7% |
| Mean | 37.3% | 38.4% |
| Median | 29.8% | 24.4% |
| Interquartile 25% (IQ1) | 22.7% | 21.3% |
| Interquartile 75% (IQ3) | 45.1% | 48.5% |
| Interquartile Range (IQR) | 22.4% | 27.3% |
| Standard Deviation (Sample) | 23.2% | 26.6% |
| Standard Deviation (Population) | 22.8% | 26.5% |
Similar Demographics by Single Female Poverty
Demographics Similar to Aleuts by Single Female Poverty
In terms of single female poverty, the demographic groups most similar to Aleuts are Dominican (25.4%, a difference of 0.010%), Central American Indian (25.5%, a difference of 0.16%), Potawatomi (25.4%, a difference of 0.17%), Immigrants from Mexico (25.3%, a difference of 0.39%), and Immigrants from Honduras (25.5%, a difference of 0.44%).
| Demographics | Rating | Rank | Single Female Poverty |
| Hondurans | 0.0 /100 | #301 | Tragic 25.1% |
| Shoshone | 0.0 /100 | #302 | Tragic 25.1% |
| Somalis | 0.0 /100 | #303 | Tragic 25.2% |
| Immigrants | Congo | 0.0 /100 | #304 | Tragic 25.3% |
| Immigrants | Dominican Republic | 0.0 /100 | #305 | Tragic 25.3% |
| Immigrants | Mexico | 0.0 /100 | #306 | Tragic 25.3% |
| Potawatomi | 0.0 /100 | #307 | Tragic 25.4% |
| Aleuts | 0.0 /100 | #308 | Tragic 25.4% |
| Dominicans | 0.0 /100 | #309 | Tragic 25.4% |
| Central American Indians | 0.0 /100 | #310 | Tragic 25.5% |
| Immigrants | Honduras | 0.0 /100 | #311 | Tragic 25.5% |
| Paiute | 0.0 /100 | #312 | Tragic 25.5% |
| Comanche | 0.0 /100 | #313 | Tragic 25.6% |
| Cherokee | 0.0 /100 | #314 | Tragic 25.7% |
| Iroquois | 0.0 /100 | #315 | Tragic 25.7% |
Demographics Similar to English by Single Female Poverty
In terms of single female poverty, the demographic groups most similar to English are Immigrants from Portugal (21.9%, a difference of 0.16%), Immigrants from Ghana (21.9%, a difference of 0.16%), Barbadian (21.8%, a difference of 0.18%), Scottish (21.8%, a difference of 0.20%), and Salvadoran (21.9%, a difference of 0.26%).
| Demographics | Rating | Rank | Single Female Poverty |
| Nepalese | 9.7 /100 | #218 | Tragic 21.7% |
| Panamanians | 9.4 /100 | #219 | Tragic 21.7% |
| Germans | 8.3 /100 | #220 | Tragic 21.8% |
| Immigrants | Grenada | 8.0 /100 | #221 | Tragic 21.8% |
| Immigrants | Eritrea | 7.9 /100 | #222 | Tragic 21.8% |
| Scottish | 7.3 /100 | #223 | Tragic 21.8% |
| Barbadians | 7.2 /100 | #224 | Tragic 21.8% |
| English | 6.4 /100 | #225 | Tragic 21.9% |
| Immigrants | Portugal | 5.8 /100 | #226 | Tragic 21.9% |
| Immigrants | Ghana | 5.8 /100 | #227 | Tragic 21.9% |
| Salvadorans | 5.5 /100 | #228 | Tragic 21.9% |
| Tlingit-Haida | 5.4 /100 | #229 | Tragic 21.9% |
| Immigrants | Western Africa | 5.3 /100 | #230 | Tragic 22.0% |
| Welsh | 5.0 /100 | #231 | Tragic 22.0% |
| Immigrants | Thailand | 5.0 /100 | #232 | Tragic 22.0% |