American vs English Single Female Poverty
COMPARE
American
English
Single Female Poverty
Single Female Poverty Comparison
Americans
English
24.5%
SINGLE FEMALE POVERTY
0.0/ 100
METRIC RATING
293rd/ 347
METRIC RANK
21.9%
SINGLE FEMALE POVERTY
6.4/ 100
METRIC RATING
225th/ 347
METRIC RANK
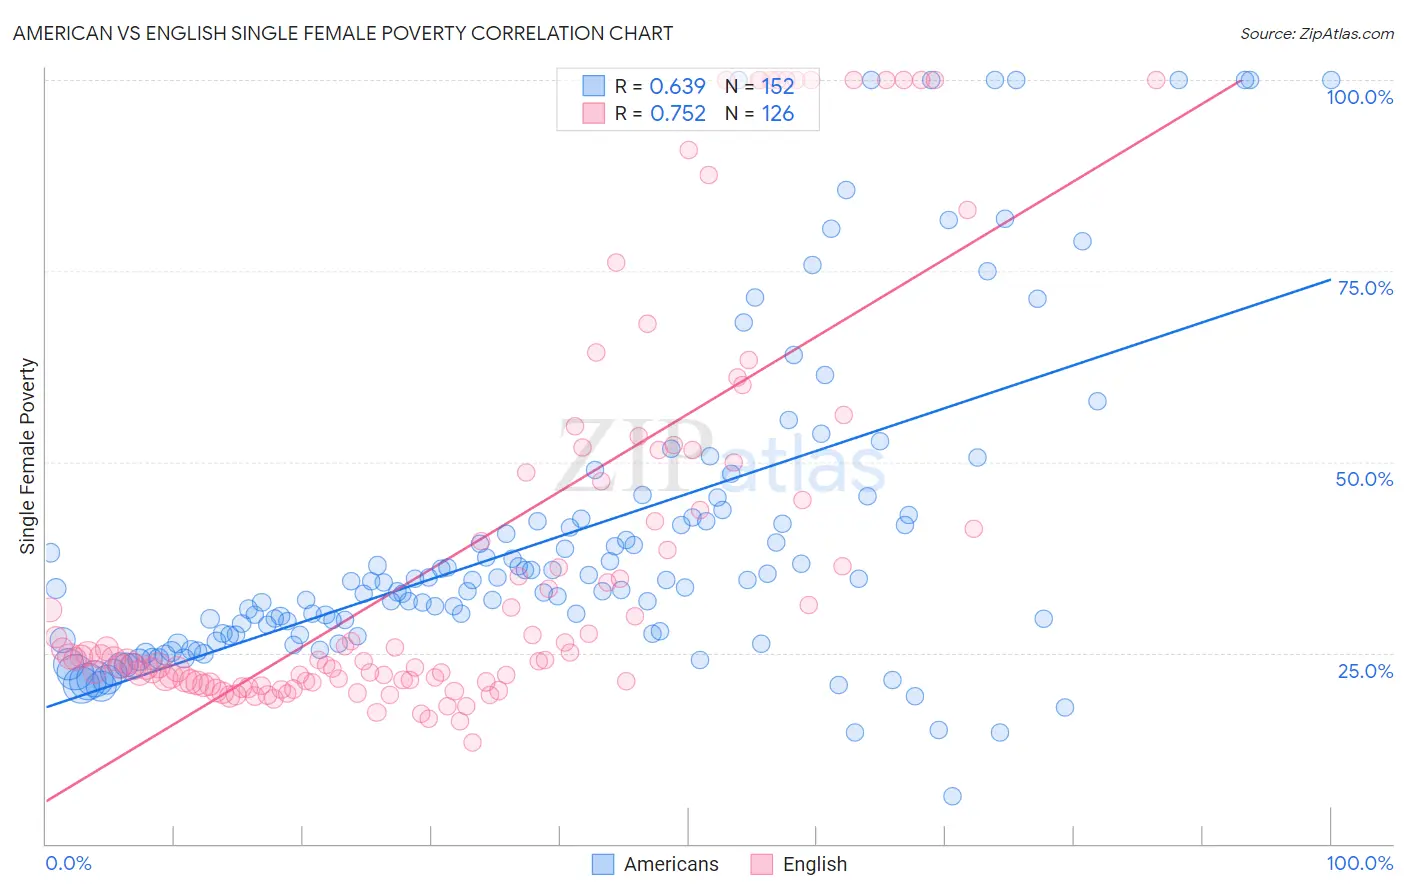
American vs English Single Female Poverty Correlation Chart
The statistical analysis conducted on geographies consisting of 559,828,526 people shows a significant positive correlation between the proportion of Americans and poverty level among single females in the United States with a correlation coefficient (R) of 0.639 and weighted average of 24.5%. Similarly, the statistical analysis conducted on geographies consisting of 556,985,462 people shows a strong positive correlation between the proportion of English and poverty level among single females in the United States with a correlation coefficient (R) of 0.752 and weighted average of 21.9%, a difference of 12.0%.
Single Female Poverty Correlation Summary
| Measurement | American | English |
| Minimum | 6.2% | 13.3% |
| Maximum | 100.0% | 100.0% |
| Range | 93.8% | 86.7% |
| Mean | 39.7% | 38.4% |
| Median | 33.3% | 24.4% |
| Interquartile 25% (IQ1) | 27.3% | 21.3% |
| Interquartile 75% (IQ3) | 42.3% | 48.5% |
| Interquartile Range (IQR) | 15.0% | 27.3% |
| Standard Deviation (Sample) | 20.8% | 26.6% |
| Standard Deviation (Population) | 20.7% | 26.5% |
Similar Demographics by Single Female Poverty
Demographics Similar to Americans by Single Female Poverty
In terms of single female poverty, the demographic groups most similar to Americans are Alsatian (24.5%, a difference of 0.080%), French American Indian (24.6%, a difference of 0.15%), Osage (24.4%, a difference of 0.44%), Hispanic or Latino (24.6%, a difference of 0.49%), and African (24.8%, a difference of 0.98%).
| Demographics | Rating | Rank | Single Female Poverty |
| Cree | 0.0 /100 | #286 | Tragic 24.1% |
| Bangladeshis | 0.0 /100 | #287 | Tragic 24.2% |
| Spanish Americans | 0.0 /100 | #288 | Tragic 24.2% |
| U.S. Virgin Islanders | 0.0 /100 | #289 | Tragic 24.2% |
| Indonesians | 0.0 /100 | #290 | Tragic 24.3% |
| Osage | 0.0 /100 | #291 | Tragic 24.4% |
| Alsatians | 0.0 /100 | #292 | Tragic 24.5% |
| Americans | 0.0 /100 | #293 | Tragic 24.5% |
| French American Indians | 0.0 /100 | #294 | Tragic 24.6% |
| Hispanics or Latinos | 0.0 /100 | #295 | Tragic 24.6% |
| Africans | 0.0 /100 | #296 | Tragic 24.8% |
| Immigrants | Central America | 0.0 /100 | #297 | Tragic 24.8% |
| Yaqui | 0.0 /100 | #298 | Tragic 24.9% |
| Mexicans | 0.0 /100 | #299 | Tragic 25.0% |
| Blackfeet | 0.0 /100 | #300 | Tragic 25.1% |
Demographics Similar to English by Single Female Poverty
In terms of single female poverty, the demographic groups most similar to English are Immigrants from Portugal (21.9%, a difference of 0.16%), Immigrants from Ghana (21.9%, a difference of 0.16%), Barbadian (21.8%, a difference of 0.18%), Scottish (21.8%, a difference of 0.20%), and Salvadoran (21.9%, a difference of 0.26%).
| Demographics | Rating | Rank | Single Female Poverty |
| Nepalese | 9.7 /100 | #218 | Tragic 21.7% |
| Panamanians | 9.4 /100 | #219 | Tragic 21.7% |
| Germans | 8.3 /100 | #220 | Tragic 21.8% |
| Immigrants | Grenada | 8.0 /100 | #221 | Tragic 21.8% |
| Immigrants | Eritrea | 7.9 /100 | #222 | Tragic 21.8% |
| Scottish | 7.3 /100 | #223 | Tragic 21.8% |
| Barbadians | 7.2 /100 | #224 | Tragic 21.8% |
| English | 6.4 /100 | #225 | Tragic 21.9% |
| Immigrants | Portugal | 5.8 /100 | #226 | Tragic 21.9% |
| Immigrants | Ghana | 5.8 /100 | #227 | Tragic 21.9% |
| Salvadorans | 5.5 /100 | #228 | Tragic 21.9% |
| Tlingit-Haida | 5.4 /100 | #229 | Tragic 21.9% |
| Immigrants | Western Africa | 5.3 /100 | #230 | Tragic 22.0% |
| Welsh | 5.0 /100 | #231 | Tragic 22.0% |
| Immigrants | Thailand | 5.0 /100 | #232 | Tragic 22.0% |