Aleut vs English Doctorate Degree
COMPARE
Aleut
English
Doctorate Degree
Doctorate Degree Comparison
Aleuts
English
1.5%
DOCTORATE DEGREE
0.4/ 100
METRIC RATING
275th/ 347
METRIC RANK
1.9%
DOCTORATE DEGREE
75.9/ 100
METRIC RATING
150th/ 347
METRIC RANK
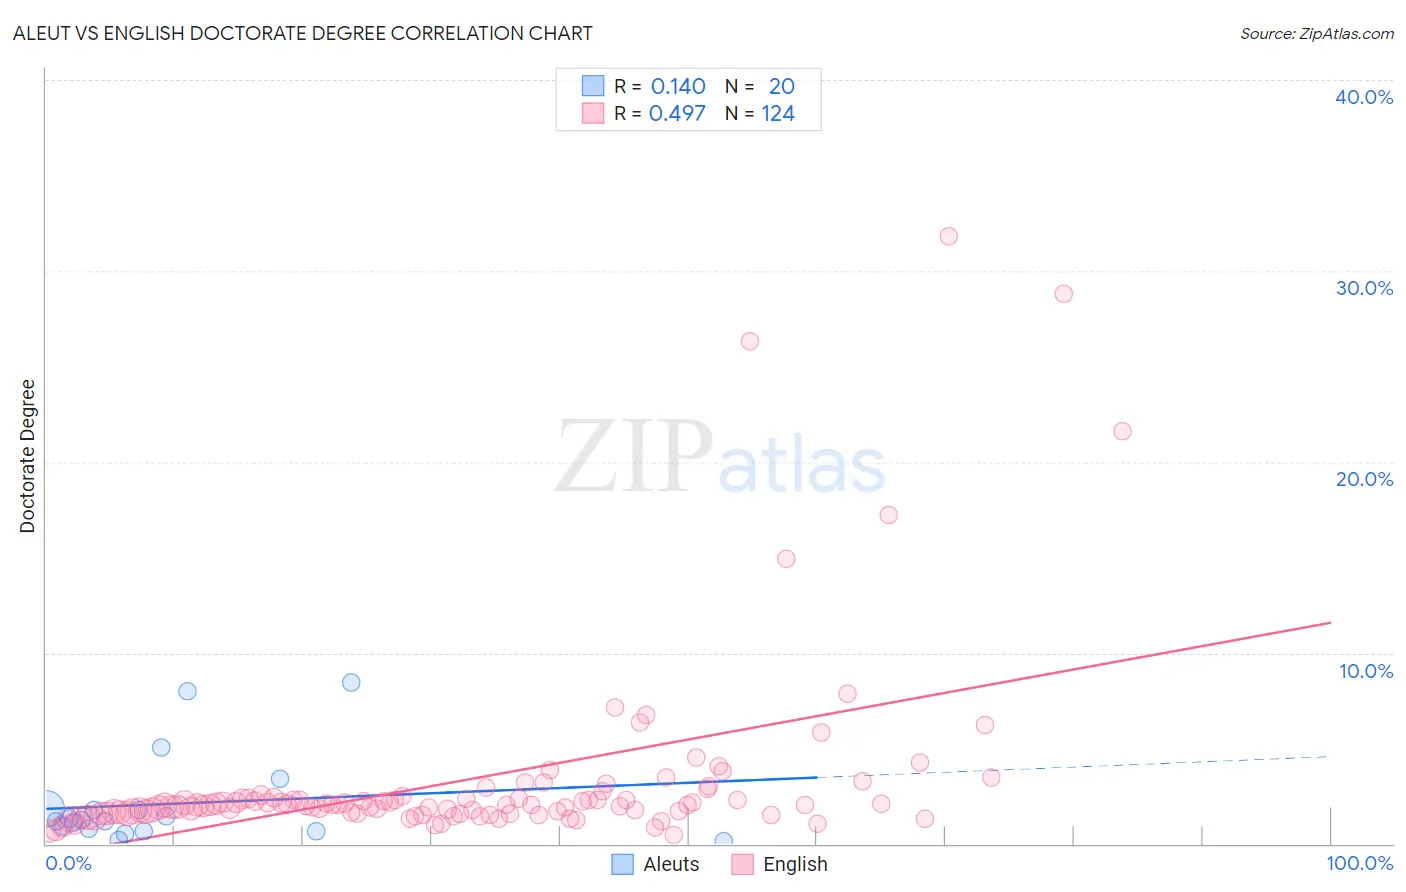
Aleut vs English Doctorate Degree Correlation Chart
The statistical analysis conducted on geographies consisting of 61,540,256 people shows a poor positive correlation between the proportion of Aleuts and percentage of population with at least doctorate degree education in the United States with a correlation coefficient (R) of 0.140 and weighted average of 1.5%. Similarly, the statistical analysis conducted on geographies consisting of 550,351,908 people shows a moderate positive correlation between the proportion of English and percentage of population with at least doctorate degree education in the United States with a correlation coefficient (R) of 0.497 and weighted average of 1.9%, a difference of 30.2%.
Doctorate Degree Correlation Summary
| Measurement | Aleut | English |
| Minimum | 0.13% | 0.49% |
| Maximum | 8.5% | 31.8% |
| Range | 8.3% | 31.3% |
| Mean | 2.1% | 3.3% |
| Median | 1.2% | 2.0% |
| Interquartile 25% (IQ1) | 0.74% | 1.6% |
| Interquartile 75% (IQ3) | 1.8% | 2.4% |
| Interquartile Range (IQR) | 1.1% | 0.77% |
| Standard Deviation (Sample) | 2.4% | 4.9% |
| Standard Deviation (Population) | 2.3% | 4.9% |
Similar Demographics by Doctorate Degree
Demographics Similar to Aleuts by Doctorate Degree
In terms of doctorate degree, the demographic groups most similar to Aleuts are Paiute (1.5%, a difference of 0.050%), Yaqui (1.5%, a difference of 0.12%), Sioux (1.5%, a difference of 0.14%), Immigrants from Barbados (1.5%, a difference of 0.25%), and Immigrants from Trinidad and Tobago (1.5%, a difference of 0.34%).
| Demographics | Rating | Rank | Doctorate Degree |
| U.S. Virgin Islanders | 0.5 /100 | #268 | Tragic 1.5% |
| Crow | 0.5 /100 | #269 | Tragic 1.5% |
| Salvadorans | 0.5 /100 | #270 | Tragic 1.5% |
| Immigrants | Trinidad and Tobago | 0.5 /100 | #271 | Tragic 1.5% |
| Immigrants | Barbados | 0.4 /100 | #272 | Tragic 1.5% |
| Sioux | 0.4 /100 | #273 | Tragic 1.5% |
| Yaqui | 0.4 /100 | #274 | Tragic 1.5% |
| Aleuts | 0.4 /100 | #275 | Tragic 1.5% |
| Paiute | 0.4 /100 | #276 | Tragic 1.5% |
| Bahamians | 0.4 /100 | #277 | Tragic 1.5% |
| Hawaiians | 0.4 /100 | #278 | Tragic 1.5% |
| Marshallese | 0.4 /100 | #279 | Tragic 1.5% |
| Ecuadorians | 0.4 /100 | #280 | Tragic 1.5% |
| Tohono O'odham | 0.4 /100 | #281 | Tragic 1.5% |
| British West Indians | 0.3 /100 | #282 | Tragic 1.5% |
Demographics Similar to English by Doctorate Degree
In terms of doctorate degree, the demographic groups most similar to English are Albanian (1.9%, a difference of 0.19%), Basque (1.9%, a difference of 0.20%), Immigrants from Kenya (1.9%, a difference of 0.30%), Immigrants from Oceania (1.9%, a difference of 0.34%), and Immigrants from Albania (1.9%, a difference of 0.57%).
| Demographics | Rating | Rank | Doctorate Degree |
| Sierra Leoneans | 85.1 /100 | #143 | Excellent 2.0% |
| Immigrants | Moldova | 84.3 /100 | #144 | Excellent 2.0% |
| Kenyans | 83.6 /100 | #145 | Excellent 1.9% |
| Immigrants | Syria | 83.6 /100 | #146 | Excellent 1.9% |
| Immigrants | Senegal | 82.5 /100 | #147 | Excellent 1.9% |
| Luxembourgers | 81.1 /100 | #148 | Excellent 1.9% |
| Basques | 76.9 /100 | #149 | Good 1.9% |
| English | 75.9 /100 | #150 | Good 1.9% |
| Albanians | 74.8 /100 | #151 | Good 1.9% |
| Immigrants | Kenya | 74.3 /100 | #152 | Good 1.9% |
| Immigrants | Oceania | 74.0 /100 | #153 | Good 1.9% |
| Immigrants | Albania | 72.8 /100 | #154 | Good 1.9% |
| Poles | 72.7 /100 | #155 | Good 1.9% |
| Slavs | 72.4 /100 | #156 | Good 1.9% |
| Danes | 71.9 /100 | #157 | Good 1.9% |