Alaska Native vs Trinidadian and Tobagonian Female Unemployment
COMPARE
Alaska Native
Trinidadian and Tobagonian
Female Unemployment
Female Unemployment Comparison
Alaska Natives
Trinidadians and Tobagonians
6.6%
FEMALE UNEMPLOYMENT
0.0/ 100
METRIC RATING
327th/ 347
METRIC RANK
6.1%
FEMALE UNEMPLOYMENT
0.0/ 100
METRIC RATING
289th/ 347
METRIC RANK
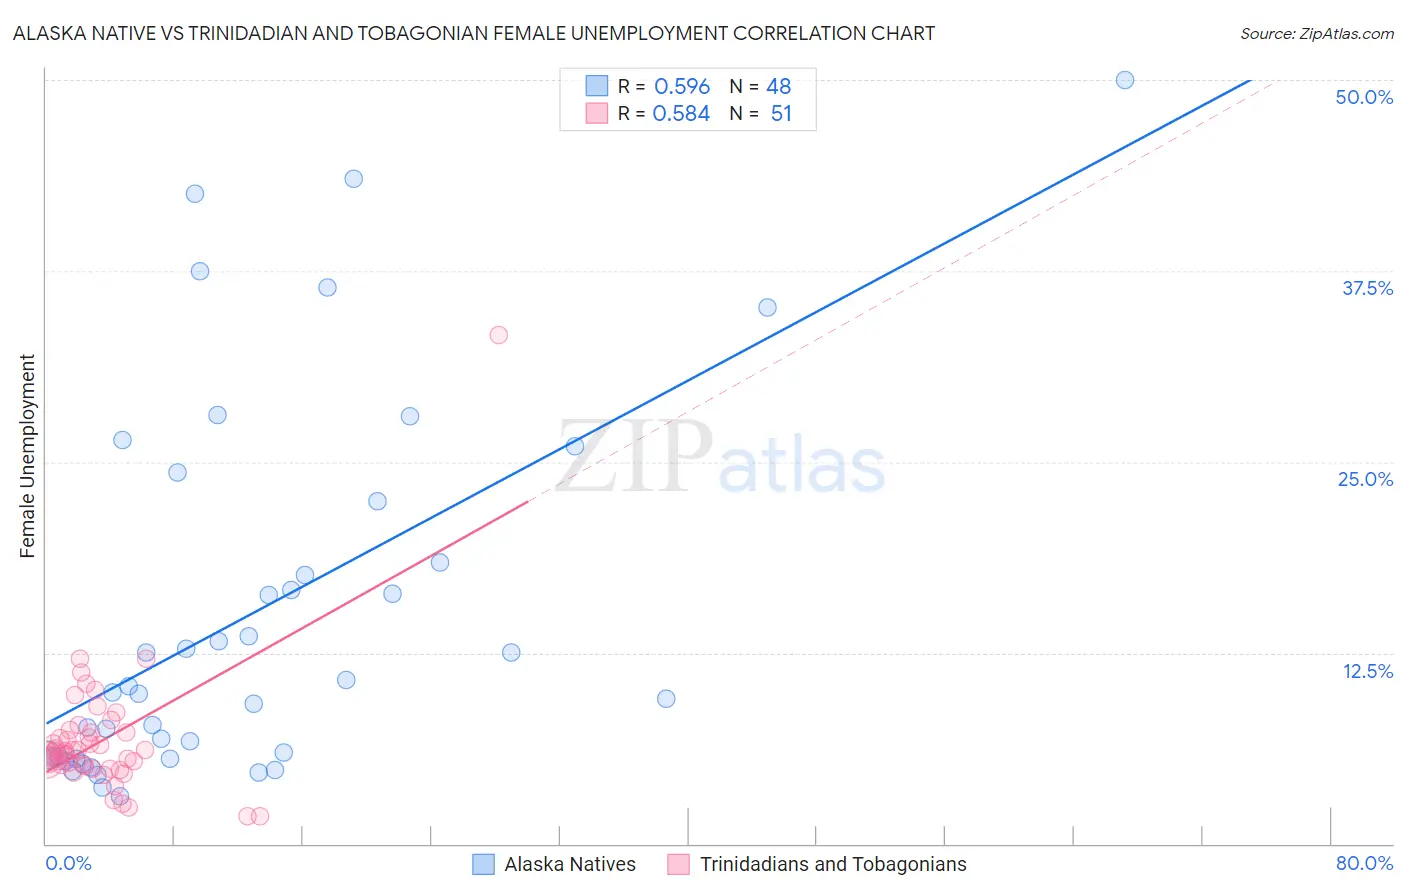
Alaska Native vs Trinidadian and Tobagonian Female Unemployment Correlation Chart
The statistical analysis conducted on geographies consisting of 76,648,149 people shows a substantial positive correlation between the proportion of Alaska Natives and unemploymnet rate among females in the United States with a correlation coefficient (R) of 0.596 and weighted average of 6.6%. Similarly, the statistical analysis conducted on geographies consisting of 219,519,508 people shows a substantial positive correlation between the proportion of Trinidadians and Tobagonians and unemploymnet rate among females in the United States with a correlation coefficient (R) of 0.584 and weighted average of 6.1%, a difference of 8.9%.
Female Unemployment Correlation Summary
| Measurement | Alaska Native | Trinidadian and Tobagonian |
| Minimum | 3.1% | 1.8% |
| Maximum | 50.0% | 33.3% |
| Range | 46.9% | 31.5% |
| Mean | 15.0% | 6.8% |
| Median | 10.1% | 6.0% |
| Interquartile 25% (IQ1) | 5.7% | 5.1% |
| Interquartile 75% (IQ3) | 20.4% | 7.3% |
| Interquartile Range (IQR) | 14.7% | 2.2% |
| Standard Deviation (Sample) | 12.1% | 4.4% |
| Standard Deviation (Population) | 12.0% | 4.4% |
Similar Demographics by Female Unemployment
Demographics Similar to Alaska Natives by Female Unemployment
In terms of female unemployment, the demographic groups most similar to Alaska Natives are Native/Alaskan (6.6%, a difference of 0.090%), Guyanese (6.7%, a difference of 0.44%), Apache (6.6%, a difference of 0.64%), Immigrants from Guyana (6.7%, a difference of 0.80%), and Cheyenne (6.6%, a difference of 0.91%).
| Demographics | Rating | Rank | Female Unemployment |
| Immigrants | Dominica | 0.0 /100 | #320 | Tragic 6.5% |
| Blacks/African Americans | 0.0 /100 | #321 | Tragic 6.5% |
| Vietnamese | 0.0 /100 | #322 | Tragic 6.5% |
| Immigrants | Belize | 0.0 /100 | #323 | Tragic 6.5% |
| Cheyenne | 0.0 /100 | #324 | Tragic 6.6% |
| Apache | 0.0 /100 | #325 | Tragic 6.6% |
| Natives/Alaskans | 0.0 /100 | #326 | Tragic 6.6% |
| Alaska Natives | 0.0 /100 | #327 | Tragic 6.6% |
| Guyanese | 0.0 /100 | #328 | Tragic 6.7% |
| Immigrants | Guyana | 0.0 /100 | #329 | Tragic 6.7% |
| Yakama | 0.0 /100 | #330 | Tragic 6.7% |
| Paiute | 0.0 /100 | #331 | Tragic 6.8% |
| Sioux | 0.0 /100 | #332 | Tragic 7.0% |
| Menominee | 0.0 /100 | #333 | Tragic 7.0% |
| Immigrants | Armenia | 0.0 /100 | #334 | Tragic 7.1% |
Demographics Similar to Trinidadians and Tobagonians by Female Unemployment
In terms of female unemployment, the demographic groups most similar to Trinidadians and Tobagonians are Haitian (6.1%, a difference of 0.010%), Immigrants from Guatemala (6.1%, a difference of 0.050%), Immigrants from Caribbean (6.1%, a difference of 0.060%), Chippewa (6.1%, a difference of 0.080%), and Immigrants from Cabo Verde (6.1%, a difference of 0.11%).
| Demographics | Rating | Rank | Female Unemployment |
| Colville | 0.0 /100 | #282 | Tragic 6.0% |
| Salvadorans | 0.0 /100 | #283 | Tragic 6.0% |
| Immigrants | Senegal | 0.0 /100 | #284 | Tragic 6.1% |
| Immigrants | Cabo Verde | 0.0 /100 | #285 | Tragic 6.1% |
| Chippewa | 0.0 /100 | #286 | Tragic 6.1% |
| Immigrants | Guatemala | 0.0 /100 | #287 | Tragic 6.1% |
| Haitians | 0.0 /100 | #288 | Tragic 6.1% |
| Trinidadians and Tobagonians | 0.0 /100 | #289 | Tragic 6.1% |
| Immigrants | Caribbean | 0.0 /100 | #290 | Tragic 6.1% |
| Immigrants | West Indies | 0.0 /100 | #291 | Tragic 6.1% |
| Immigrants | Trinidad and Tobago | 0.0 /100 | #292 | Tragic 6.1% |
| Mexicans | 0.0 /100 | #293 | Tragic 6.1% |
| Immigrants | El Salvador | 0.0 /100 | #294 | Tragic 6.1% |
| Immigrants | Latin America | 0.0 /100 | #295 | Tragic 6.1% |
| Alaskan Athabascans | 0.0 /100 | #296 | Tragic 6.1% |