Alaska Native vs Menominee Family Poverty
COMPARE
Alaska Native
Menominee
Family Poverty
Family Poverty Comparison
Alaska Natives
Menominee
10.4%
FAMILY POVERTY
1.0/ 100
METRIC RATING
242nd/ 347
METRIC RANK
12.7%
FAMILY POVERTY
0.0/ 100
METRIC RATING
323rd/ 347
METRIC RANK
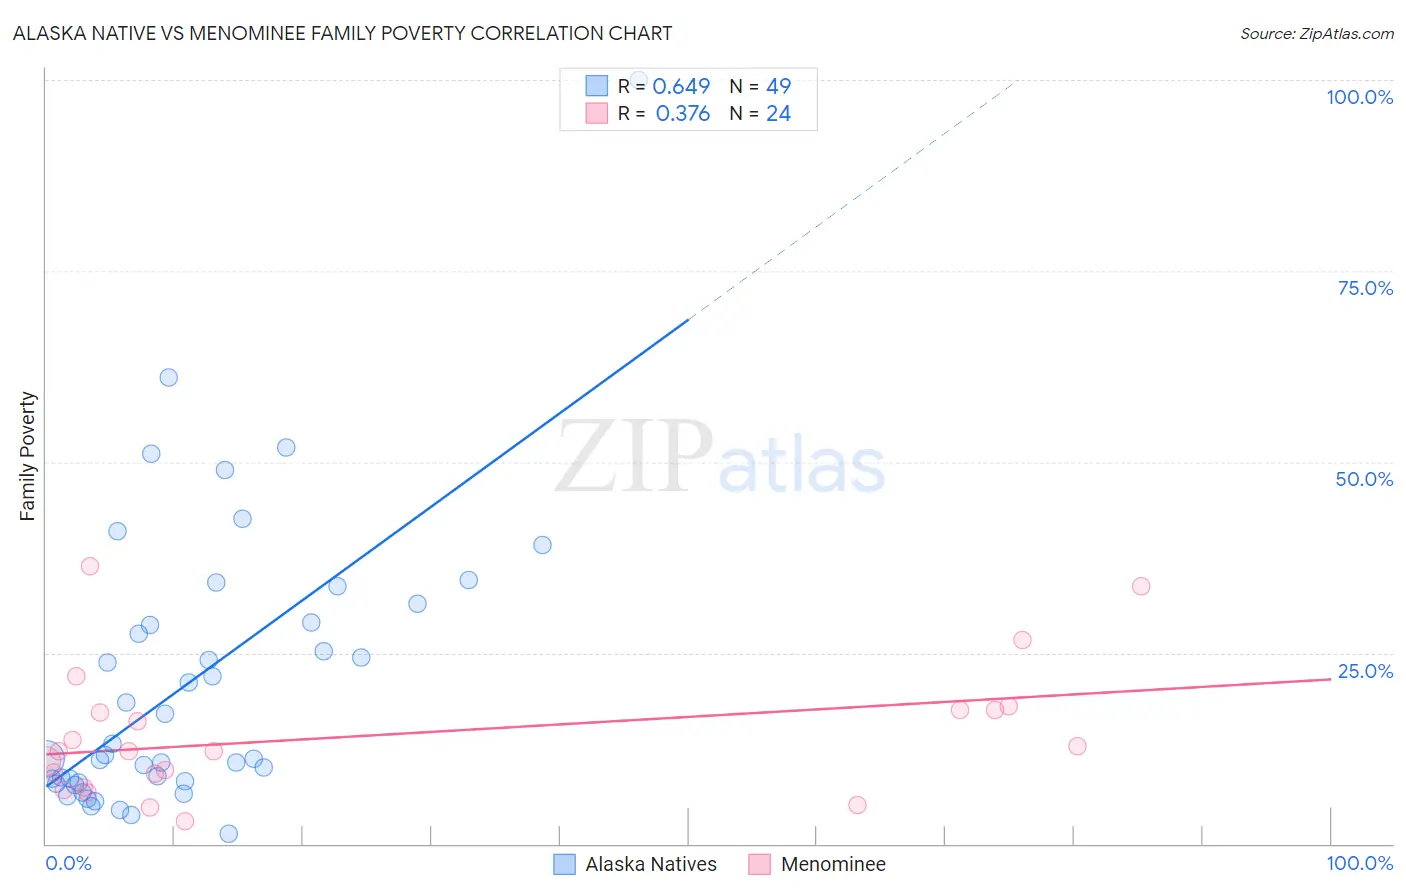
Alaska Native vs Menominee Family Poverty Correlation Chart
The statistical analysis conducted on geographies consisting of 76,710,212 people shows a significant positive correlation between the proportion of Alaska Natives and poverty level among families in the United States with a correlation coefficient (R) of 0.649 and weighted average of 10.4%. Similarly, the statistical analysis conducted on geographies consisting of 45,766,702 people shows a mild positive correlation between the proportion of Menominee and poverty level among families in the United States with a correlation coefficient (R) of 0.376 and weighted average of 12.7%, a difference of 22.8%.
Family Poverty Correlation Summary
| Measurement | Alaska Native | Menominee |
| Minimum | 1.3% | 2.9% |
| Maximum | 100.0% | 36.4% |
| Range | 98.7% | 33.5% |
| Mean | 21.3% | 14.2% |
| Median | 11.6% | 12.2% |
| Interquartile 25% (IQ1) | 8.1% | 8.2% |
| Interquartile 75% (IQ3) | 30.2% | 17.5% |
| Interquartile Range (IQR) | 22.0% | 9.3% |
| Standard Deviation (Sample) | 18.8% | 8.6% |
| Standard Deviation (Population) | 18.6% | 8.4% |
Similar Demographics by Family Poverty
Demographics Similar to Alaska Natives by Family Poverty
In terms of family poverty, the demographic groups most similar to Alaska Natives are Nepalese (10.4%, a difference of 0.48%), Ghanaian (10.3%, a difference of 0.86%), Cree (10.5%, a difference of 0.94%), Immigrants from the Azores (10.3%, a difference of 0.95%), and Potawatomi (10.2%, a difference of 1.3%).
| Demographics | Rating | Rank | Family Poverty |
| Nigerians | 2.0 /100 | #235 | Tragic 10.1% |
| Immigrants | Nigeria | 1.9 /100 | #236 | Tragic 10.2% |
| Immigrants | Laos | 1.7 /100 | #237 | Tragic 10.2% |
| French American Indians | 1.5 /100 | #238 | Tragic 10.2% |
| Potawatomi | 1.5 /100 | #239 | Tragic 10.2% |
| Immigrants | Azores | 1.4 /100 | #240 | Tragic 10.3% |
| Ghanaians | 1.3 /100 | #241 | Tragic 10.3% |
| Alaska Natives | 1.0 /100 | #242 | Tragic 10.4% |
| Nepalese | 0.8 /100 | #243 | Tragic 10.4% |
| Cree | 0.7 /100 | #244 | Tragic 10.5% |
| Immigrants | Burma/Myanmar | 0.6 /100 | #245 | Tragic 10.5% |
| Cherokee | 0.5 /100 | #246 | Tragic 10.6% |
| Liberians | 0.4 /100 | #247 | Tragic 10.6% |
| Nicaraguans | 0.4 /100 | #248 | Tragic 10.6% |
| Cubans | 0.4 /100 | #249 | Tragic 10.6% |
Demographics Similar to Menominee by Family Poverty
In terms of family poverty, the demographic groups most similar to Menominee are Immigrants from Dominica (12.7%, a difference of 0.080%), Immigrants from Honduras (12.7%, a difference of 0.54%), Arapaho (12.7%, a difference of 0.65%), Paiute (13.0%, a difference of 2.0%), and Colville (13.0%, a difference of 2.1%).
| Demographics | Rating | Rank | Family Poverty |
| Hondurans | 0.0 /100 | #316 | Tragic 12.4% |
| Immigrants | Grenada | 0.0 /100 | #317 | Tragic 12.4% |
| U.S. Virgin Islanders | 0.0 /100 | #318 | Tragic 12.4% |
| British West Indians | 0.0 /100 | #319 | Tragic 12.4% |
| Inupiat | 0.0 /100 | #320 | Tragic 12.5% |
| Arapaho | 0.0 /100 | #321 | Tragic 12.7% |
| Immigrants | Honduras | 0.0 /100 | #322 | Tragic 12.7% |
| Menominee | 0.0 /100 | #323 | Tragic 12.7% |
| Immigrants | Dominica | 0.0 /100 | #324 | Tragic 12.7% |
| Paiute | 0.0 /100 | #325 | Tragic 13.0% |
| Colville | 0.0 /100 | #326 | Tragic 13.0% |
| Yakama | 0.0 /100 | #327 | Tragic 13.1% |
| Central American Indians | 0.0 /100 | #328 | Tragic 13.3% |
| Blacks/African Americans | 0.0 /100 | #329 | Tragic 13.3% |
| Natives/Alaskans | 0.0 /100 | #330 | Tragic 14.3% |