Alaska Native vs Immigrants from Senegal Family Poverty
COMPARE
Alaska Native
Immigrants from Senegal
Family Poverty
Family Poverty Comparison
Alaska Natives
Immigrants from Senegal
10.4%
FAMILY POVERTY
1.0/ 100
METRIC RATING
242nd/ 347
METRIC RANK
11.7%
FAMILY POVERTY
0.0/ 100
METRIC RATING
298th/ 347
METRIC RANK
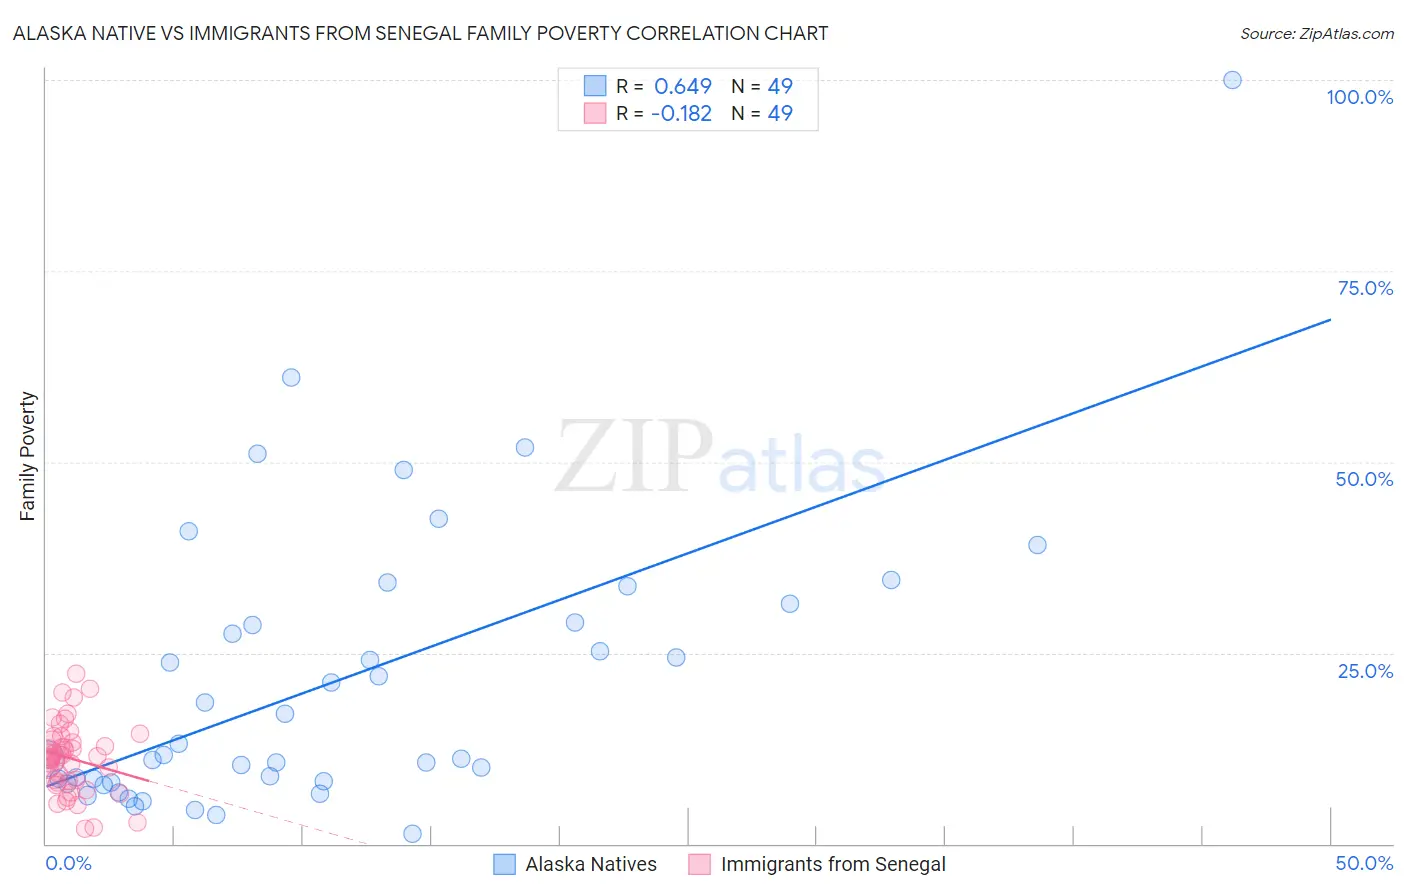
Alaska Native vs Immigrants from Senegal Family Poverty Correlation Chart
The statistical analysis conducted on geographies consisting of 76,710,212 people shows a significant positive correlation between the proportion of Alaska Natives and poverty level among families in the United States with a correlation coefficient (R) of 0.649 and weighted average of 10.4%. Similarly, the statistical analysis conducted on geographies consisting of 90,075,938 people shows a poor negative correlation between the proportion of Immigrants from Senegal and poverty level among families in the United States with a correlation coefficient (R) of -0.182 and weighted average of 11.7%, a difference of 12.5%.
Family Poverty Correlation Summary
| Measurement | Alaska Native | Immigrants from Senegal |
| Minimum | 1.3% | 2.0% |
| Maximum | 100.0% | 22.3% |
| Range | 98.7% | 20.2% |
| Mean | 21.3% | 11.2% |
| Median | 11.6% | 11.5% |
| Interquartile 25% (IQ1) | 8.1% | 8.1% |
| Interquartile 75% (IQ3) | 30.2% | 13.8% |
| Interquartile Range (IQR) | 22.0% | 5.7% |
| Standard Deviation (Sample) | 18.8% | 4.6% |
| Standard Deviation (Population) | 18.6% | 4.5% |
Similar Demographics by Family Poverty
Demographics Similar to Alaska Natives by Family Poverty
In terms of family poverty, the demographic groups most similar to Alaska Natives are Nepalese (10.4%, a difference of 0.48%), Ghanaian (10.3%, a difference of 0.86%), Cree (10.5%, a difference of 0.94%), Immigrants from the Azores (10.3%, a difference of 0.95%), and Potawatomi (10.2%, a difference of 1.3%).
| Demographics | Rating | Rank | Family Poverty |
| Nigerians | 2.0 /100 | #235 | Tragic 10.1% |
| Immigrants | Nigeria | 1.9 /100 | #236 | Tragic 10.2% |
| Immigrants | Laos | 1.7 /100 | #237 | Tragic 10.2% |
| French American Indians | 1.5 /100 | #238 | Tragic 10.2% |
| Potawatomi | 1.5 /100 | #239 | Tragic 10.2% |
| Immigrants | Azores | 1.4 /100 | #240 | Tragic 10.3% |
| Ghanaians | 1.3 /100 | #241 | Tragic 10.3% |
| Alaska Natives | 1.0 /100 | #242 | Tragic 10.4% |
| Nepalese | 0.8 /100 | #243 | Tragic 10.4% |
| Cree | 0.7 /100 | #244 | Tragic 10.5% |
| Immigrants | Burma/Myanmar | 0.6 /100 | #245 | Tragic 10.5% |
| Cherokee | 0.5 /100 | #246 | Tragic 10.6% |
| Liberians | 0.4 /100 | #247 | Tragic 10.6% |
| Nicaraguans | 0.4 /100 | #248 | Tragic 10.6% |
| Cubans | 0.4 /100 | #249 | Tragic 10.6% |
Demographics Similar to Immigrants from Senegal by Family Poverty
In terms of family poverty, the demographic groups most similar to Immigrants from Senegal are Dutch West Indian (11.7%, a difference of 0.10%), Immigrants from Bangladesh (11.7%, a difference of 0.11%), Creek (11.7%, a difference of 0.14%), Bahamian (11.7%, a difference of 0.36%), and Choctaw (11.6%, a difference of 0.37%).
| Demographics | Rating | Rank | Family Poverty |
| Haitians | 0.0 /100 | #291 | Tragic 11.5% |
| Immigrants | Somalia | 0.0 /100 | #292 | Tragic 11.5% |
| Immigrants | Cabo Verde | 0.0 /100 | #293 | Tragic 11.6% |
| Immigrants | St. Vincent and the Grenadines | 0.0 /100 | #294 | Tragic 11.6% |
| Immigrants | Haiti | 0.0 /100 | #295 | Tragic 11.6% |
| Choctaw | 0.0 /100 | #296 | Tragic 11.6% |
| Creek | 0.0 /100 | #297 | Tragic 11.7% |
| Immigrants | Senegal | 0.0 /100 | #298 | Tragic 11.7% |
| Dutch West Indians | 0.0 /100 | #299 | Tragic 11.7% |
| Immigrants | Bangladesh | 0.0 /100 | #300 | Tragic 11.7% |
| Bahamians | 0.0 /100 | #301 | Tragic 11.7% |
| Guatemalans | 0.0 /100 | #302 | Tragic 11.7% |
| Africans | 0.0 /100 | #303 | Tragic 11.8% |
| Immigrants | Latin America | 0.0 /100 | #304 | Tragic 11.8% |
| Mexicans | 0.0 /100 | #305 | Tragic 11.8% |