Alaska Native vs Trinidadian and Tobagonian Male Poverty
COMPARE
Alaska Native
Trinidadian and Tobagonian
Male Poverty
Male Poverty Comparison
Alaska Natives
Trinidadians and Tobagonians
12.4%
MALE POVERTY
1.4/ 100
METRIC RATING
227th/ 347
METRIC RANK
13.1%
MALE POVERTY
0.1/ 100
METRIC RATING
261st/ 347
METRIC RANK
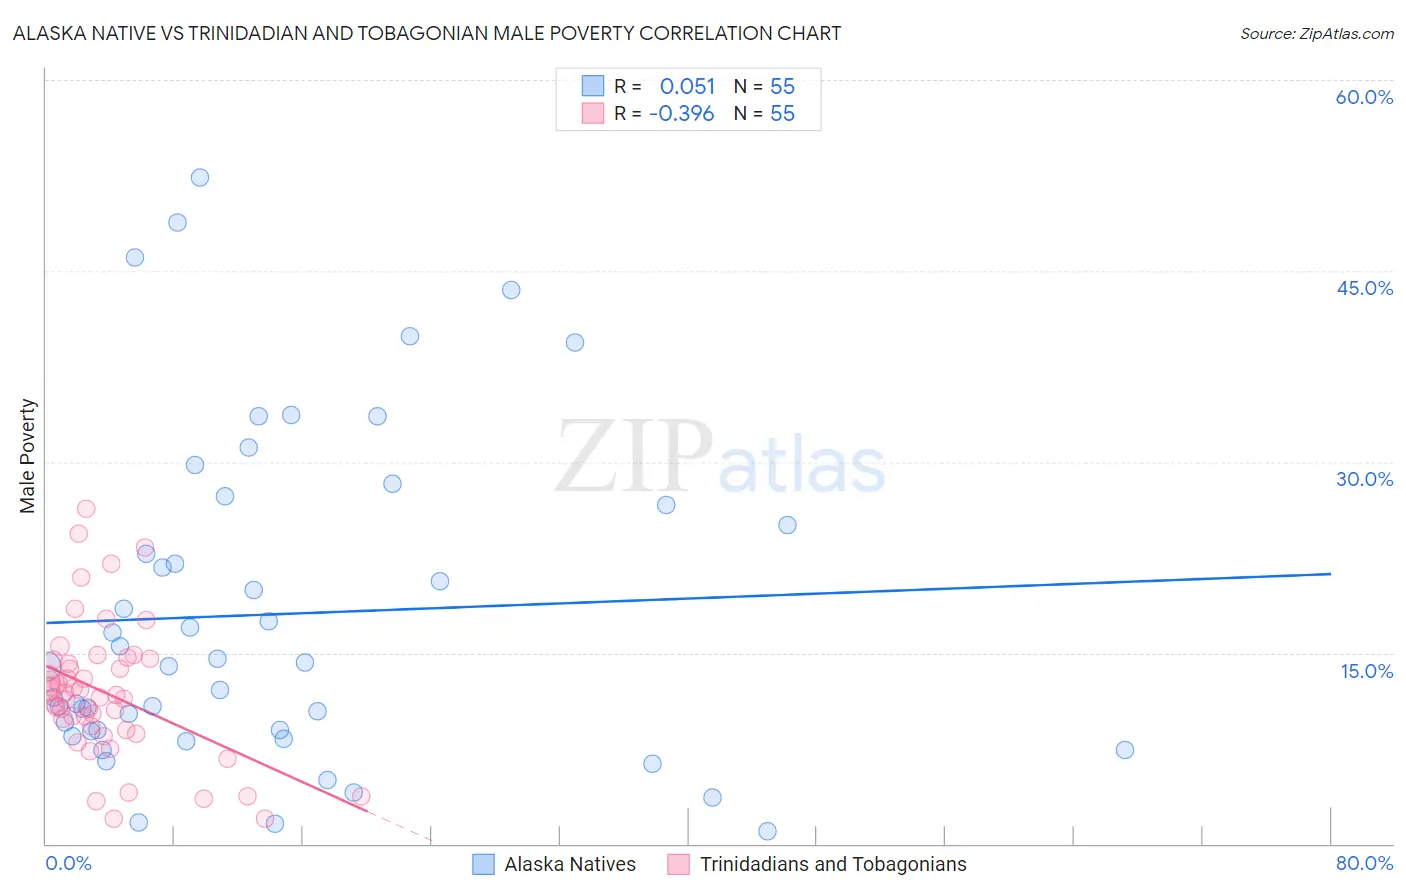
Alaska Native vs Trinidadian and Tobagonian Male Poverty Correlation Chart
The statistical analysis conducted on geographies consisting of 76,750,766 people shows a slight positive correlation between the proportion of Alaska Natives and poverty level among males in the United States with a correlation coefficient (R) of 0.051 and weighted average of 12.4%. Similarly, the statistical analysis conducted on geographies consisting of 219,673,525 people shows a mild negative correlation between the proportion of Trinidadians and Tobagonians and poverty level among males in the United States with a correlation coefficient (R) of -0.396 and weighted average of 13.1%, a difference of 6.0%.
Male Poverty Correlation Summary
| Measurement | Alaska Native | Trinidadian and Tobagonian |
| Minimum | 0.96% | 2.0% |
| Maximum | 52.4% | 26.4% |
| Range | 51.4% | 24.4% |
| Mean | 18.0% | 11.9% |
| Median | 14.0% | 11.7% |
| Interquartile 25% (IQ1) | 8.8% | 8.9% |
| Interquartile 75% (IQ3) | 26.6% | 14.4% |
| Interquartile Range (IQR) | 17.8% | 5.5% |
| Standard Deviation (Sample) | 12.9% | 5.3% |
| Standard Deviation (Population) | 12.8% | 5.3% |
Similar Demographics by Male Poverty
Demographics Similar to Alaska Natives by Male Poverty
In terms of male poverty, the demographic groups most similar to Alaska Natives are Alsatian (12.4%, a difference of 0.040%), Nigerian (12.3%, a difference of 0.090%), Cuban (12.4%, a difference of 0.13%), Osage (12.3%, a difference of 0.26%), and Immigrants from Nigeria (12.3%, a difference of 0.32%).
| Demographics | Rating | Rank | Male Poverty |
| Immigrants | Eritrea | 2.4 /100 | #220 | Tragic 12.2% |
| Ugandans | 2.2 /100 | #221 | Tragic 12.2% |
| Immigrants | Africa | 2.1 /100 | #222 | Tragic 12.2% |
| Immigrants | Micronesia | 2.1 /100 | #223 | Tragic 12.2% |
| Immigrants | Nigeria | 1.6 /100 | #224 | Tragic 12.3% |
| Osage | 1.5 /100 | #225 | Tragic 12.3% |
| Nigerians | 1.4 /100 | #226 | Tragic 12.3% |
| Alaska Natives | 1.4 /100 | #227 | Tragic 12.4% |
| Alsatians | 1.3 /100 | #228 | Tragic 12.4% |
| Cubans | 1.3 /100 | #229 | Tragic 12.4% |
| Marshallese | 0.8 /100 | #230 | Tragic 12.5% |
| Salvadorans | 0.6 /100 | #231 | Tragic 12.6% |
| Nicaraguans | 0.6 /100 | #232 | Tragic 12.6% |
| Fijians | 0.6 /100 | #233 | Tragic 12.6% |
| Immigrants | Armenia | 0.6 /100 | #234 | Tragic 12.6% |
Demographics Similar to Trinidadians and Tobagonians by Male Poverty
In terms of male poverty, the demographic groups most similar to Trinidadians and Tobagonians are Ottawa (13.1%, a difference of 0.020%), Spanish American Indian (13.1%, a difference of 0.050%), Cherokee (13.1%, a difference of 0.13%), Cape Verdean (13.1%, a difference of 0.30%), and Immigrants from Trinidad and Tobago (13.1%, a difference of 0.42%).
| Demographics | Rating | Rank | Male Poverty |
| Mexican American Indians | 0.1 /100 | #254 | Tragic 13.0% |
| Immigrants | Liberia | 0.1 /100 | #255 | Tragic 13.0% |
| Immigrants | Burma/Myanmar | 0.1 /100 | #256 | Tragic 13.0% |
| Immigrants | Trinidad and Tobago | 0.1 /100 | #257 | Tragic 13.1% |
| Cape Verdeans | 0.1 /100 | #258 | Tragic 13.1% |
| Cherokee | 0.1 /100 | #259 | Tragic 13.1% |
| Ottawa | 0.1 /100 | #260 | Tragic 13.1% |
| Trinidadians and Tobagonians | 0.1 /100 | #261 | Tragic 13.1% |
| Spanish American Indians | 0.1 /100 | #262 | Tragic 13.1% |
| Central Americans | 0.1 /100 | #263 | Tragic 13.2% |
| Iroquois | 0.1 /100 | #264 | Tragic 13.2% |
| Jamaicans | 0.1 /100 | #265 | Tragic 13.2% |
| Immigrants | Guyana | 0.1 /100 | #266 | Tragic 13.2% |
| Immigrants | Jamaica | 0.1 /100 | #267 | Tragic 13.3% |
| Sub-Saharan Africans | 0.1 /100 | #268 | Tragic 13.3% |