Alaska Native vs Haitian Family Poverty

COMPARE

Alaska Native
Race
Ancestry
AfghanAfricanAlaska NativeAlaskan AthabascanAlbanianAleutAlsatianAmericanApacheArabArapahoArgentineanArmenianAssyrian/Chaldean/SyriacAustralianAustrianBahamianBangladeshiBarbadianBasqueBelgianBelizeanBermudanBhutaneseBlackfeetBolivianBrazilianBritishBritish West IndianBulgarianBurmeseCajunCambodianCanadianCape VerdeanCarpatho RusynCelticCentral AmericanCentral American IndianCherokeeCheyenneChickasawChileanChineseChippewaChoctawColombianColvilleComancheCosta RicanCreeCreekCroatianCrowCubanCypriotCzechCzechoslovakianDanishDelawareDominicanDutchDutch West IndianEastern EuropeanEcuadorianEgyptianEnglishEstonianEthiopianEuropeanFijianFilipinoFinnishFrenchFrench American IndianFrench CanadianGermanGerman RussianGhanaianGreekGuamanian/ChamorroGuatemalanGuyaneseHmongHonduranHopiHoumaHungarianIcelanderIndian (Asian)IndonesianInupiatIranianIraqiIrishIroquoisIsraeliItalianJamaicanJapaneseJordanianKenyanKiowaKoreanLaotianLatvianLebaneseLiberianLithuanianLumbeeLuxembourgerMacedonianMalaysianMalteseMarshalleseMenomineeMexicanMexican American IndianMongolianMoroccanNative HawaiianNavajoNepaleseNew ZealanderNicaraguanNigerianNorthern EuropeanNorwegianOkinawanOsageOttawaPaiutePakistaniPalestinianPanamanianParaguayanPennsylvania GermanPeruvianPimaPolishPortuguesePotawatomiPuebloPuerto RicanPuget Sound SalishRomanianRussianSalvadoranSamoanScandinavianScotch-IrishScottishSeminoleSenegaleseSerbianShoshoneSierra LeoneanSiouxSlavicSlovakSloveneSomaliSouth AfricanSouth AmericanSouth American IndianSoviet UnionSpaniardSpanishSpanish AmericanSpanish American IndianSri LankanSubsaharan AfricanSudaneseSwedishSwissSyrianTaiwaneseThaiTlingit-HaidaTohono O'OdhamTonganTrinidadian and TobagonianTsimshianTurkishU.S. Virgin IslanderUgandanUkrainianUruguayanUteVenezuelanVietnameseWelshWest IndianYakamaYaquiYugoslavianYumanYup'ikZimbabwean
Immigration
NonimmigrantsImmigrantsAfghanistanAfricaAlbaniaArgentinaArmeniaAsiaAustraliaAustriaBahamasBangladeshBarbadosBelarusBelgiumBelizeBoliviaBosnia and HerzegovinaBrazilBulgariaBurma/MyanmarCabo VerdeCambodiaCameroonCanadaCaribbeanCentral AmericaChileChinaColombiaCongoCosta RicaCroatiaCubaCzechoslovakiaDenmarkDominicaDominican RepublicEastern AfricaEastern AsiaEastern EuropeEcuadorEgyptEl SalvadorEnglandEritreaEthiopiaEuropeFijiFranceGermanyGhanaGreeceGrenadaGuatemalaGuyanaHaitiHondurasHong KongHungaryIndiaIndonesiaIranIraqIrelandIsraelItalyJamaicaJapanJordanKazakhstanKenyaKoreaKuwaitLaosLatin AmericaLatviaLebanonLiberiaLithuaniaMalaysiaMexicoMicronesiaMiddle AfricaMoldovaMoroccoNepalNetherlandsNicaraguaNigeriaNorth AmericaNorth MacedoniaNorthern AfricaNorthern EuropeNorwayOceaniaPakistanPanamaPeruPhilippinesPolandPortugalRomaniaRussiaSaudi ArabiaScotlandSenegalSerbiaSierra LeoneSingaporeSomaliaSouth AfricaSouth AmericaSouth Central AsiaSouth Eastern AsiaSouthern EuropeSpainSri LankaSt. Vincent and the GrenadinesSudanSwedenSwitzerlandSyriaTaiwanThailandTrinidad and TobagoTurkeyUgandaUkraineUruguayUzbekistanVenezuelaVietnamWest IndiesWestern AfricaWestern AsiaWestern EuropeYemenZaireZimbabweAzores
Haitian
Race
Ancestry
AfghanAfricanAlaskan AthabascanAlbanianAleutAlsatianAmericanApacheArabArapahoArgentineanArmenianAssyrian/Chaldean/SyriacAustralianAustrianBahamianBangladeshiBarbadianBasqueBelgianBelizeanBermudanBhutaneseBlackfeetBolivianBrazilianBritishBritish West IndianBulgarianBurmeseCajunCambodianCanadianCape VerdeanCarpatho RusynCelticCentral AmericanCentral American IndianCherokeeCheyenneChickasawChileanChineseChippewaChoctawColombianColvilleComancheCosta RicanCreeCreekCroatianCrowCubanCypriotCzechCzechoslovakianDanishDelawareDominicanDutchDutch West IndianEastern EuropeanEcuadorianEgyptianEnglishEstonianEthiopianEuropeanFijianFilipinoFinnishFrenchFrench American IndianFrench CanadianGermanGerman RussianGhanaianGreekGuamanian/ChamorroGuatemalanGuyaneseHaitianHmongHonduranHopiHoumaHungarianIcelanderIndian (Asian)IndonesianInupiatIranianIraqiIrishIroquoisIsraeliItalianJamaicanJapaneseJordanianKenyanKiowaKoreanLaotianLatvianLebaneseLiberianLithuanianLumbeeLuxembourgerMacedonianMalaysianMalteseMarshalleseMenomineeMexicanMexican American IndianMongolianMoroccanNative HawaiianNavajoNepaleseNew ZealanderNicaraguanNigerianNorthern EuropeanNorwegianOkinawanOsageOttawaPaiutePakistaniPalestinianPanamanianParaguayanPennsylvania GermanPeruvianPimaPolishPortuguesePotawatomiPuebloPuerto RicanPuget Sound SalishRomanianRussianSalvadoranSamoanScandinavianScotch-IrishScottishSeminoleSenegaleseSerbianShoshoneSierra LeoneanSiouxSlavicSlovakSloveneSomaliSouth AfricanSouth AmericanSouth American IndianSoviet UnionSpaniardSpanishSpanish AmericanSpanish American IndianSri LankanSubsaharan AfricanSudaneseSwedishSwissSyrianTaiwaneseThaiTlingit-HaidaTohono O'OdhamTonganTrinidadian and TobagonianTsimshianTurkishU.S. Virgin IslanderUgandanUkrainianUruguayanUteVenezuelanVietnameseWelshWest IndianYakamaYaquiYugoslavianYumanYup'ikZimbabwean
Immigration
NonimmigrantsImmigrantsAfghanistanAfricaAlbaniaArgentinaArmeniaAsiaAustraliaAustriaBahamasBangladeshBarbadosBelarusBelgiumBelizeBoliviaBosnia and HerzegovinaBrazilBulgariaBurma/MyanmarCabo VerdeCambodiaCameroonCanadaCaribbeanCentral AmericaChileChinaColombiaCongoCosta RicaCroatiaCubaCzechoslovakiaDenmarkDominicaDominican RepublicEastern AfricaEastern AsiaEastern EuropeEcuadorEgyptEl SalvadorEnglandEritreaEthiopiaEuropeFijiFranceGermanyGhanaGreeceGrenadaGuatemalaGuyanaHaitiHondurasHong KongHungaryIndiaIndonesiaIranIraqIrelandIsraelItalyJamaicaJapanJordanKazakhstanKenyaKoreaKuwaitLaosLatin AmericaLatviaLebanonLiberiaLithuaniaMalaysiaMexicoMicronesiaMiddle AfricaMoldovaMoroccoNepalNetherlandsNicaraguaNigeriaNorth AmericaNorth MacedoniaNorthern AfricaNorthern EuropeNorwayOceaniaPakistanPanamaPeruPhilippinesPolandPortugalRomaniaRussiaSaudi ArabiaScotlandSenegalSerbiaSierra LeoneSingaporeSomaliaSouth AfricaSouth AmericaSouth Central AsiaSouth Eastern AsiaSouthern EuropeSpainSri LankaSt. Vincent and the GrenadinesSudanSwedenSwitzerlandSyriaTaiwanThailandTrinidad and TobagoTurkeyUgandaUkraineUruguayUzbekistanVenezuelaVietnamWest IndiesWestern AfricaWestern AsiaWestern EuropeYemenZaireZimbabweAzores
Family Poverty
Income
Poverty
Unemployment
Labor Participation
Family Structure
Vehicle Availability
Education Level
Disability

Family Poverty Comparison

Alaska Natives

Haitians

Tragic
Tragic
10.4%
FAMILY POVERTY
1.0/ 100
METRIC RATING
242nd/ 347
METRIC RANK
11.5%
FAMILY POVERTY
0.0/ 100
METRIC RATING
291st/ 347
METRIC RANK

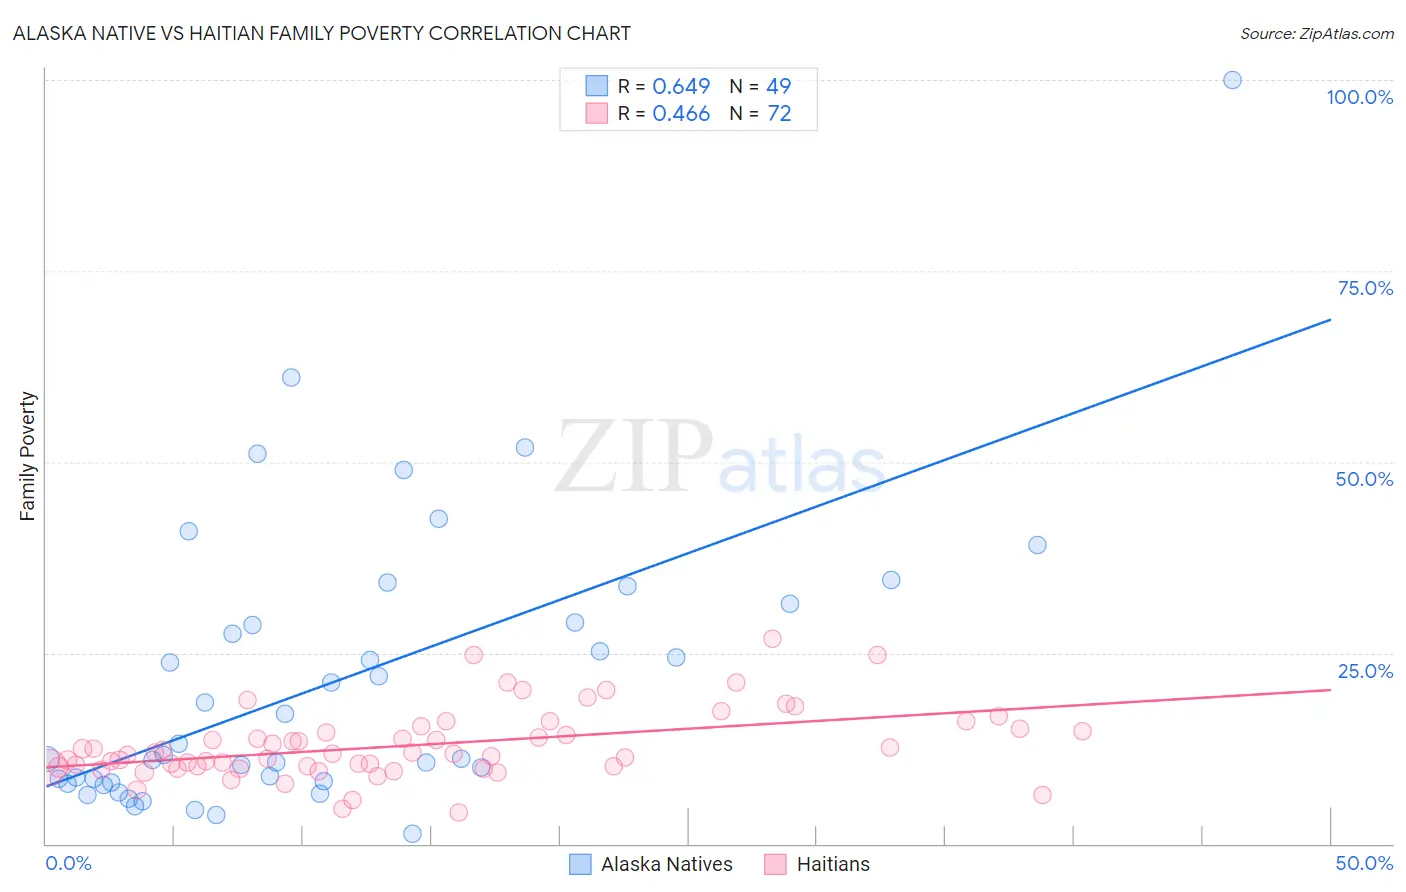
Alaska Native vs Haitian Family Poverty Correlation Chart

The statistical analysis conducted on geographies consisting of 76,710,212 people shows a significant positive correlation between the proportion of Alaska Natives and poverty level among families in the United States with a correlation coefficient (R) of 0.649 and weighted average of 10.4%. Similarly, the statistical analysis conducted on geographies consisting of 287,320,460 people shows a moderate positive correlation between the proportion of Haitians and poverty level among families in the United States with a correlation coefficient (R) of 0.466 and weighted average of 11.5%, a difference of 11.2%.
Alaska Native vs Haitian Family Poverty

Family Poverty Correlation Summary

MeasurementAlaska NativeHaitian
Minimum1.3%4.1%
Maximum100.0%26.8%
Range98.7%22.8%
Mean21.3%12.9%
Median11.6%11.7%
Interquartile 25% (IQ1)8.1%10.0%
Interquartile 75% (IQ3)30.2%14.9%
Interquartile Range (IQR)22.0%4.9%
Standard Deviation (Sample)18.8%4.5%
Standard Deviation (Population)18.6%4.5%

Similar Demographics by Family Poverty

Demographics Similar to Alaska Natives by Family Poverty

In terms of family poverty, the demographic groups most similar to Alaska Natives are Nepalese (10.4%, a difference of 0.48%), Ghanaian (10.3%, a difference of 0.86%), Cree (10.5%, a difference of 0.94%), Immigrants from the Azores (10.3%, a difference of 0.95%), and Potawatomi (10.2%, a difference of 1.3%).
DemographicsRating | RankFamily Poverty
Nigerians
2.0
/100
|
#235
Tragic
10.1%
Immigrants | Nigeria
1.9
/100
|
#236
Tragic
10.2%
Immigrants | Laos
1.7
/100
|
#237
Tragic
10.2%
French American Indians
1.5
/100
|
#238
Tragic
10.2%
Potawatomi
1.5
/100
|
#239
Tragic
10.2%
Immigrants | Azores
1.4
/100
|
#240
Tragic
10.3%
Ghanaians
1.3
/100
|
#241
Tragic
10.3%
Alaska Natives
1.0
/100
|
#242
Tragic
10.4%
Nepalese
0.8
/100
|
#243
Tragic
10.4%
Cree
0.7
/100
|
#244
Tragic
10.5%
Immigrants | Burma/Myanmar
0.6
/100
|
#245
Tragic
10.5%
Cherokee
0.5
/100
|
#246
Tragic
10.6%
Liberians
0.4
/100
|
#247
Tragic
10.6%
Nicaraguans
0.4
/100
|
#248
Tragic
10.6%
Cubans
0.4
/100
|
#249
Tragic
10.6%

Demographics Similar to Haitians by Family Poverty

In terms of family poverty, the demographic groups most similar to Haitians are West Indian (11.5%, a difference of 0.060%), Immigrants from Barbados (11.5%, a difference of 0.070%), Immigrants from Somalia (11.5%, a difference of 0.11%), Immigrants from Belize (11.5%, a difference of 0.12%), and Vietnamese (11.5%, a difference of 0.31%).
DemographicsRating | RankFamily Poverty
Yaqui
0.0
/100
|
#284
Tragic
11.3%
Barbadians
0.0
/100
|
#285
Tragic
11.3%
Senegalese
0.0
/100
|
#286
Tragic
11.5%
Vietnamese
0.0
/100
|
#287
Tragic
11.5%
Immigrants | Belize
0.0
/100
|
#288
Tragic
11.5%
Immigrants | Barbados
0.0
/100
|
#289
Tragic
11.5%
West Indians
0.0
/100
|
#290
Tragic
11.5%
Haitians
0.0
/100
|
#291
Tragic
11.5%
Immigrants | Somalia
0.0
/100
|
#292
Tragic
11.5%
Immigrants | Cabo Verde
0.0
/100
|
#293
Tragic
11.6%
Immigrants | St. Vincent and the Grenadines
0.0
/100
|
#294
Tragic
11.6%
Immigrants | Haiti
0.0
/100
|
#295
Tragic
11.6%
Choctaw
0.0
/100
|
#296
Tragic
11.6%
Creek
0.0
/100
|
#297
Tragic
11.7%
Immigrants | Senegal
0.0
/100
|
#298
Tragic
11.7%