Alaska Native vs Trinidadian and Tobagonian Single Male Poverty
COMPARE
Alaska Native
Trinidadian and Tobagonian
Single Male Poverty
Single Male Poverty Comparison
Alaska Natives
Trinidadians and Tobagonians
15.4%
SINGLE MALE POVERTY
0.0/ 100
METRIC RATING
304th/ 347
METRIC RANK
13.0%
SINGLE MALE POVERTY
21.4/ 100
METRIC RATING
201st/ 347
METRIC RANK
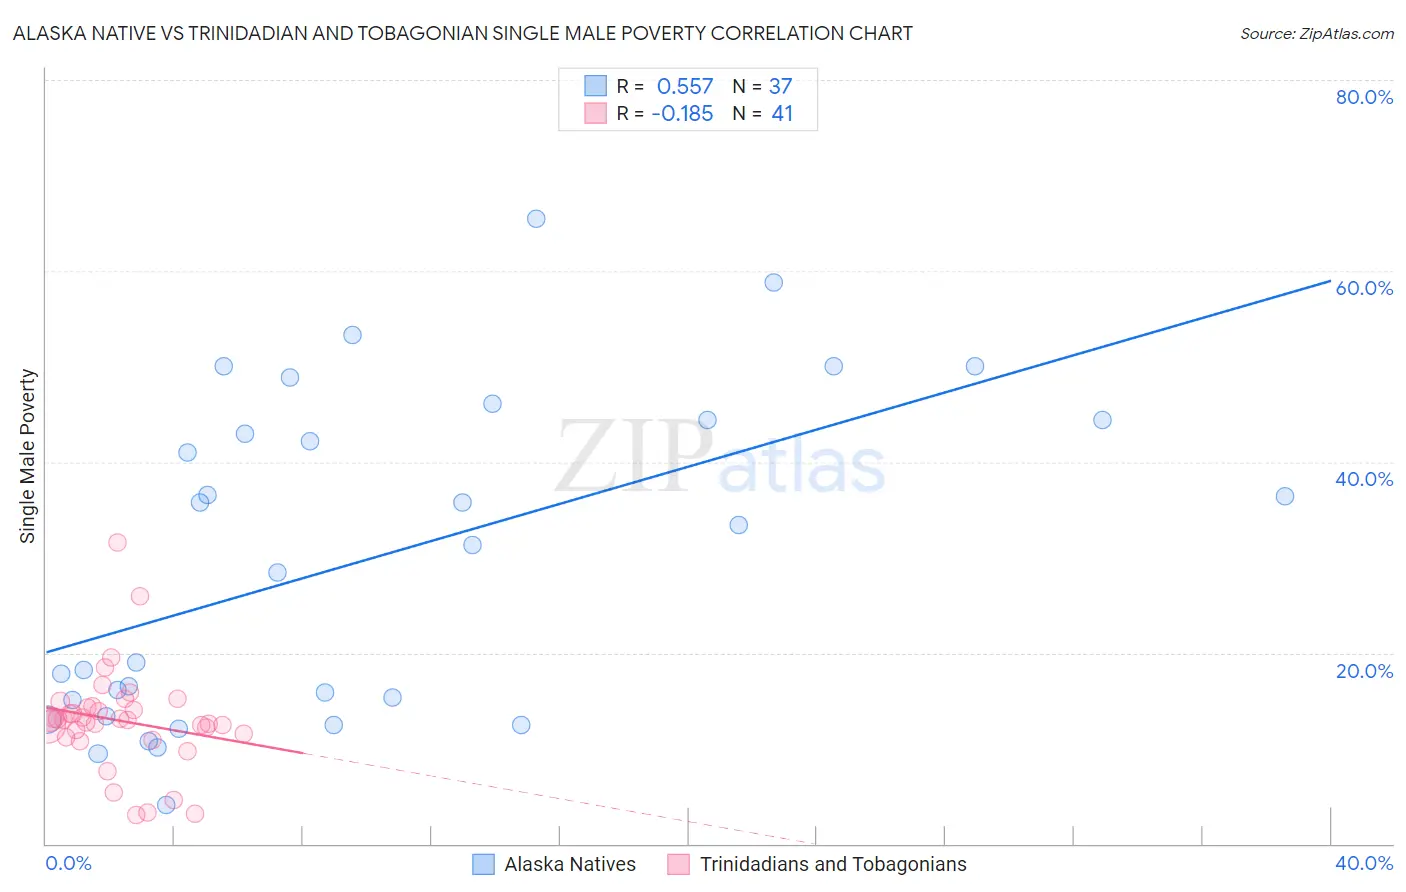
Alaska Native vs Trinidadian and Tobagonian Single Male Poverty Correlation Chart
The statistical analysis conducted on geographies consisting of 74,357,121 people shows a substantial positive correlation between the proportion of Alaska Natives and poverty level among single males in the United States with a correlation coefficient (R) of 0.557 and weighted average of 15.4%. Similarly, the statistical analysis conducted on geographies consisting of 204,213,293 people shows a poor negative correlation between the proportion of Trinidadians and Tobagonians and poverty level among single males in the United States with a correlation coefficient (R) of -0.185 and weighted average of 13.0%, a difference of 18.4%.
Single Male Poverty Correlation Summary
| Measurement | Alaska Native | Trinidadian and Tobagonian |
| Minimum | 4.0% | 3.0% |
| Maximum | 65.5% | 31.6% |
| Range | 61.5% | 28.6% |
| Mean | 29.9% | 12.9% |
| Median | 31.2% | 13.0% |
| Interquartile 25% (IQ1) | 14.2% | 11.3% |
| Interquartile 75% (IQ3) | 44.4% | 14.4% |
| Interquartile Range (IQR) | 30.2% | 3.1% |
| Standard Deviation (Sample) | 16.9% | 5.3% |
| Standard Deviation (Population) | 16.6% | 5.2% |
Similar Demographics by Single Male Poverty
Demographics Similar to Alaska Natives by Single Male Poverty
In terms of single male poverty, the demographic groups most similar to Alaska Natives are Aleut (15.4%, a difference of 0.11%), Blackfeet (15.5%, a difference of 0.53%), Pennsylvania German (15.6%, a difference of 0.96%), Alsatian (15.2%, a difference of 1.1%), and Dominican (15.2%, a difference of 1.3%).
| Demographics | Rating | Rank | Single Male Poverty |
| Immigrants | Dominican Republic | 0.0 /100 | #297 | Tragic 14.8% |
| French American Indians | 0.0 /100 | #298 | Tragic 15.0% |
| Delaware | 0.0 /100 | #299 | Tragic 15.0% |
| Cree | 0.0 /100 | #300 | Tragic 15.1% |
| Dominicans | 0.0 /100 | #301 | Tragic 15.2% |
| Alsatians | 0.0 /100 | #302 | Tragic 15.2% |
| Aleuts | 0.0 /100 | #303 | Tragic 15.4% |
| Alaska Natives | 0.0 /100 | #304 | Tragic 15.4% |
| Blackfeet | 0.0 /100 | #305 | Tragic 15.5% |
| Pennsylvania Germans | 0.0 /100 | #306 | Tragic 15.6% |
| Ute | 0.0 /100 | #307 | Tragic 15.7% |
| Potawatomi | 0.0 /100 | #308 | Tragic 15.8% |
| Americans | 0.0 /100 | #309 | Tragic 15.8% |
| Yakama | 0.0 /100 | #310 | Tragic 15.9% |
| Seminole | 0.0 /100 | #311 | Tragic 16.0% |
Demographics Similar to Trinidadians and Tobagonians by Single Male Poverty
In terms of single male poverty, the demographic groups most similar to Trinidadians and Tobagonians are Slovene (13.0%, a difference of 0.010%), Immigrants from Norway (13.0%, a difference of 0.030%), Lithuanian (13.0%, a difference of 0.050%), Basque (13.0%, a difference of 0.060%), and Immigrants from Bangladesh (13.0%, a difference of 0.090%).
| Demographics | Rating | Rank | Single Male Poverty |
| Liberians | 25.2 /100 | #194 | Fair 13.0% |
| Immigrants | England | 23.4 /100 | #195 | Fair 13.0% |
| Immigrants | Grenada | 23.1 /100 | #196 | Fair 13.0% |
| Immigrants | Laos | 23.1 /100 | #197 | Fair 13.0% |
| Lithuanians | 22.1 /100 | #198 | Fair 13.0% |
| Immigrants | Norway | 21.8 /100 | #199 | Fair 13.0% |
| Slovenes | 21.6 /100 | #200 | Fair 13.0% |
| Trinidadians and Tobagonians | 21.4 /100 | #201 | Fair 13.0% |
| Basques | 20.7 /100 | #202 | Fair 13.0% |
| Immigrants | Bangladesh | 20.4 /100 | #203 | Fair 13.0% |
| Estonians | 20.3 /100 | #204 | Fair 13.0% |
| Poles | 19.3 /100 | #205 | Poor 13.0% |
| Northern Europeans | 18.9 /100 | #206 | Poor 13.0% |
| Sudanese | 17.7 /100 | #207 | Poor 13.1% |
| Immigrants | Western Africa | 17.6 /100 | #208 | Poor 13.1% |