Zip Codes with the Highest Percentage of Population Employed in Health Diagnosing & Treating in Bethlehem, PA
RELATED REPORTS & OPTIONS
Health Diagnosing & Treating
Bethlehem
Compare Zip Codes
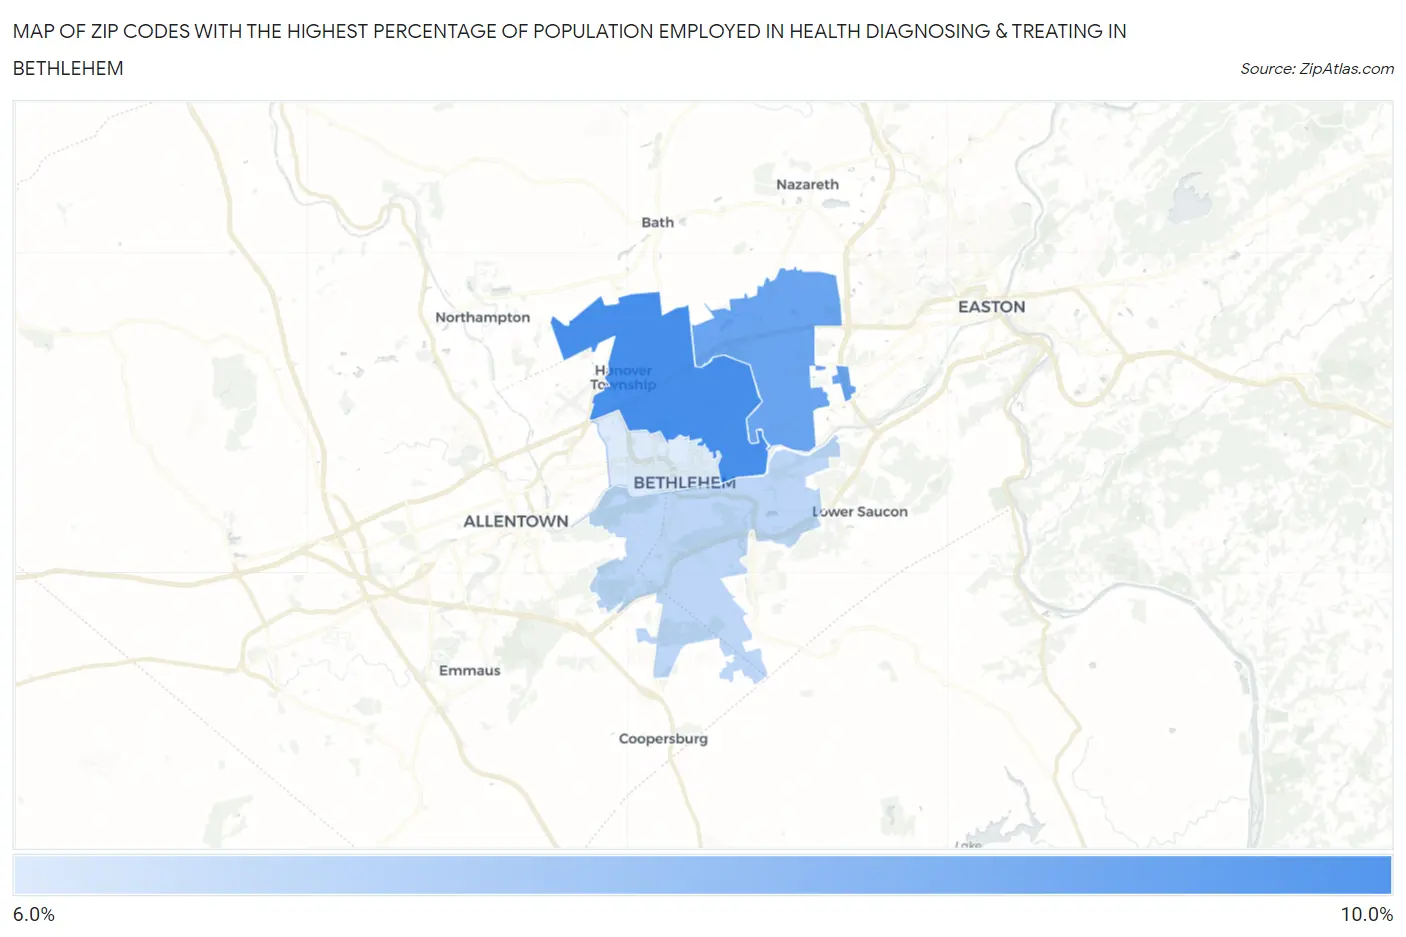
Map of Zip Codes with the Highest Percentage of Population Employed in Health Diagnosing & Treating in Bethlehem
6.5%
8.5%
Zip Codes with the Highest Percentage of Population Employed in Health Diagnosing & Treating in Bethlehem, PA
| Zip Code | % Employed | vs State | vs National | |
| 1. | 18017 | 8.5% | 7.4%(+1.14)#471 | 6.2%(+2.24)#6,357 |
| 2. | 18020 | 8.0% | 7.4%(+0.679)#551 | 6.2%(+1.78)#7,420 |
| 3. | 18015 | 7.0% | 7.4%(-0.397)#741 | 6.2%(+0.709)#10,502 |
| 4. | 18018 | 6.5% | 7.4%(-0.821)#842 | 6.2%(+0.285)#11,919 |
1
Common Questions
What are the Top 3 Zip Codes with the Highest Percentage of Population Employed in Health Diagnosing & Treating in Bethlehem, PA?
Top 3 Zip Codes with the Highest Percentage of Population Employed in Health Diagnosing & Treating in Bethlehem, PA are:
What zip code has the Highest Percentage of Population Employed in Health Diagnosing & Treating in Bethlehem, PA?
18017 has the Highest Percentage of Population Employed in Health Diagnosing & Treating in Bethlehem, PA with 8.5%.
What is the Percentage of Population Employed in Health Diagnosing & Treating in Bethlehem, PA?
Percentage of Population Employed in Health Diagnosing & Treating in Bethlehem is 6.3%.
What is the Percentage of Population Employed in Health Diagnosing & Treating in Pennsylvania?
Percentage of Population Employed in Health Diagnosing & Treating in Pennsylvania is 7.4%.
What is the Percentage of Population Employed in Health Diagnosing & Treating in the United States?
Percentage of Population Employed in Health Diagnosing & Treating in the United States is 6.2%.