Washoe County, NV Map & Demographics
Washoe County Map
Washoe County Overview
$44,448
PER CAPITA INCOME
$98,619
AVG FAMILY INCOME
$81,531
AVG HOUSEHOLD INCOME
23.0%
WAGE / INCOME GAP [ % ]
77.0¢/ $1
WAGE / INCOME GAP [ $ ]
$9,752
FAMILY INCOME DEFICIT
0.47
INEQUALITY / GINI INDEX
486,674
TOTAL POPULATION
247,473
MALE POPULATION
239,201
FEMALE POPULATION
103.46
MALES / 100 FEMALES
96.66
FEMALES / 100 MALES
38.6
MEDIAN AGE
3.0
AVG FAMILY SIZE
2.5
AVG HOUSEHOLD SIZE
262,006
LABOR FORCE [ PEOPLE ]
66.2%
PERCENT IN LABOR FORCE
5.0%
UNEMPLOYMENT RATE
Washoe County Area Codes
Income in Washoe County
Income Overview in Washoe County
Per Capita Income in Washoe County is $44,448, while median incomes of families and households are $98,619 and $81,531 respectively.
| Characteristic | Number | Measure |
| Per Capita Income | 486,674 | $44,448 |
| Median Family Income | 119,417 | $98,619 |
| Mean Family Income | 119,417 | $131,134 |
| Median Household Income | 192,420 | $81,531 |
| Mean Household Income | 192,420 | $111,026 |
| Income Deficit | 119,417 | $9,752 |
| Wage / Income Gap (%) | 486,674 | 23.00% |
| Wage / Income Gap ($) | 486,674 | 77.00¢ per $1 |
| Gini / Inequality Index | 486,674 | 0.47 |
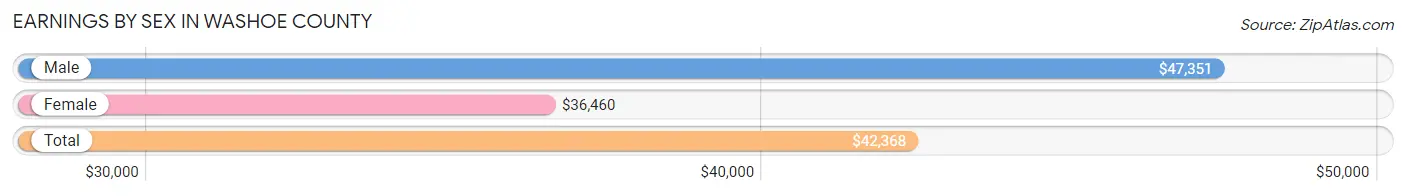
Earnings by Sex in Washoe County
Average Earnings in Washoe County are $42,368, $47,351 for men and $36,460 for women, a difference of 23.0%.
| Sex | Number | Average Earnings |
| Male | 147,146 (54.1%) | $47,351 |
| Female | 124,889 (45.9%) | $36,460 |
| Total | 272,035 (100.0%) | $42,368 |
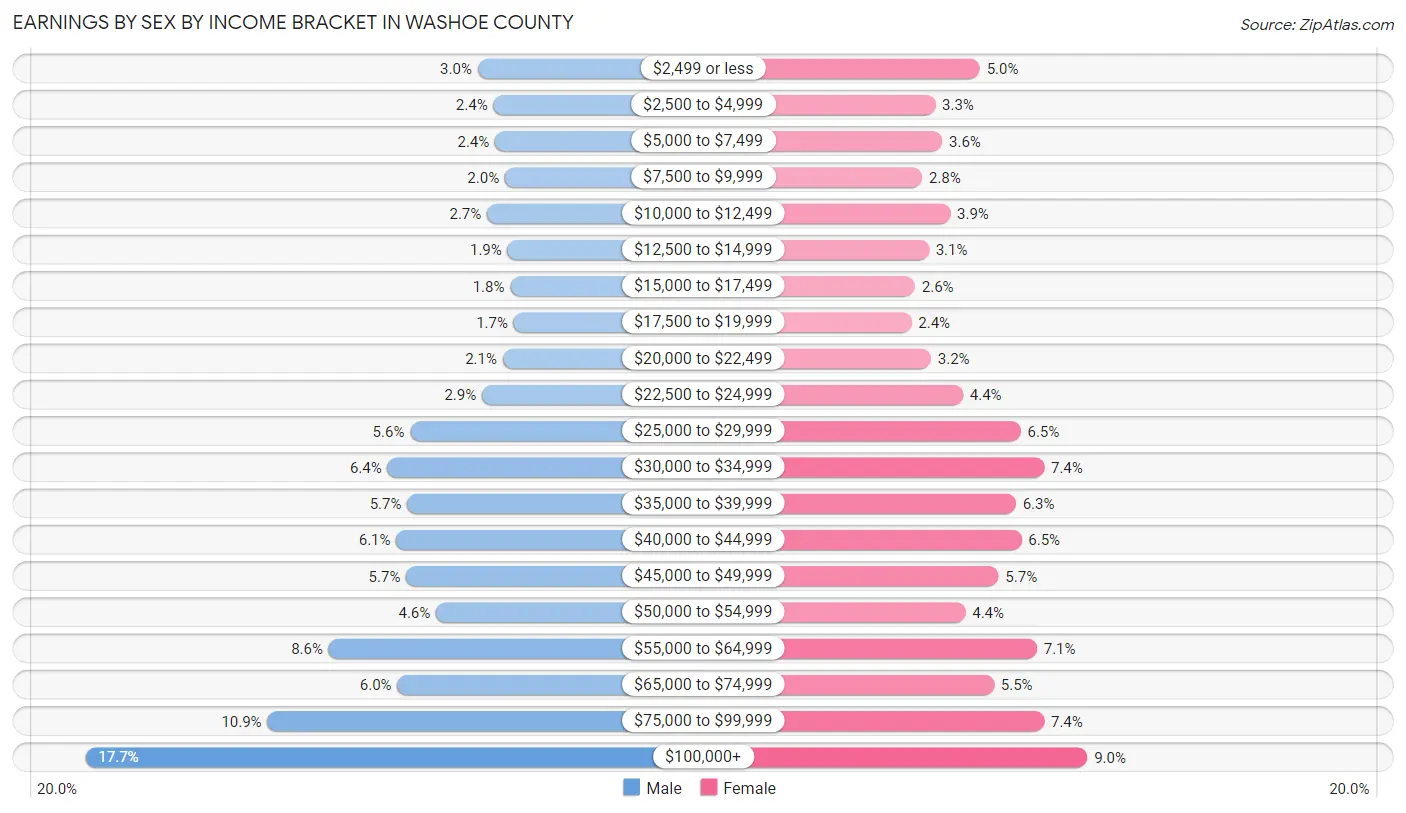
Earnings by Sex by Income Bracket in Washoe County
The most common earnings brackets in Washoe County are $100,000+ for men (26,069 | 17.7%) and $100,000+ for women (11,257 | 9.0%).
| Income | Male | Female |
| $2,499 or less | 4,445 (3.0%) | 6,223 (5.0%) |
| $2,500 to $4,999 | 3,572 (2.4%) | 4,138 (3.3%) |
| $5,000 to $7,499 | 3,482 (2.4%) | 4,461 (3.6%) |
| $7,500 to $9,999 | 2,936 (2.0%) | 3,526 (2.8%) |
| $10,000 to $12,499 | 3,933 (2.7%) | 4,829 (3.9%) |
| $12,500 to $14,999 | 2,792 (1.9%) | 3,835 (3.1%) |
| $15,000 to $17,499 | 2,655 (1.8%) | 3,180 (2.5%) |
| $17,500 to $19,999 | 2,464 (1.7%) | 3,017 (2.4%) |
| $20,000 to $22,499 | 3,054 (2.1%) | 3,932 (3.2%) |
| $22,500 to $24,999 | 4,213 (2.9%) | 5,431 (4.3%) |
| $25,000 to $29,999 | 8,160 (5.6%) | 8,135 (6.5%) |
| $30,000 to $34,999 | 9,422 (6.4%) | 9,224 (7.4%) |
| $35,000 to $39,999 | 8,327 (5.7%) | 7,910 (6.3%) |
| $40,000 to $44,999 | 8,932 (6.1%) | 8,166 (6.5%) |
| $45,000 to $49,999 | 8,387 (5.7%) | 7,088 (5.7%) |
| $50,000 to $54,999 | 6,732 (4.6%) | 5,545 (4.4%) |
| $55,000 to $64,999 | 12,651 (8.6%) | 8,886 (7.1%) |
| $65,000 to $74,999 | 8,877 (6.0%) | 6,880 (5.5%) |
| $75,000 to $99,999 | 16,043 (10.9%) | 9,226 (7.4%) |
| $100,000+ | 26,069 (17.7%) | 11,257 (9.0%) |
| Total | 147,146 (100.0%) | 124,889 (100.0%) |
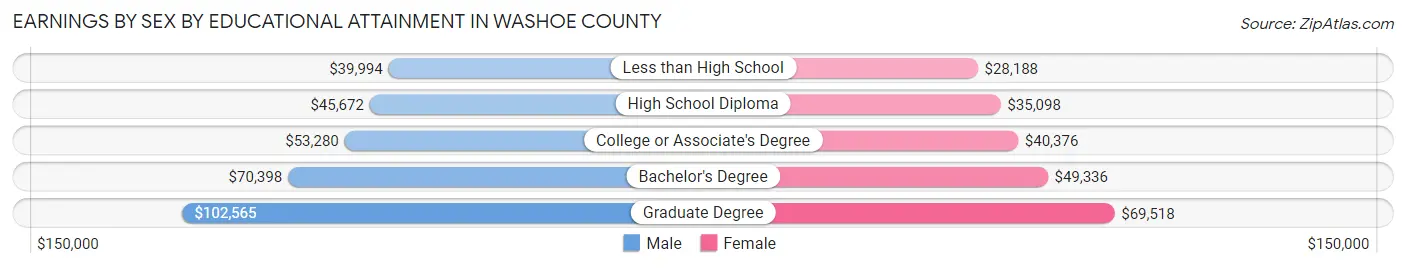
Earnings by Sex by Educational Attainment in Washoe County
Average earnings in Washoe County are $54,449 for men and $41,760 for women, a difference of 23.3%. Men with an educational attainment of graduate degree enjoy the highest average annual earnings of $102,565, while those with less than high school education earn the least with $39,994. Women with an educational attainment of graduate degree earn the most with the average annual earnings of $69,518, while those with less than high school education have the smallest earnings of $28,188.
| Educational Attainment | Male Income | Female Income |
| Less than High School | $39,994 | $28,188 |
| High School Diploma | $45,672 | $35,098 |
| College or Associate's Degree | $53,280 | $40,376 |
| Bachelor's Degree | $70,398 | $49,336 |
| Graduate Degree | $102,565 | $69,518 |
| Total | $54,449 | $41,760 |
Family Income in Washoe County
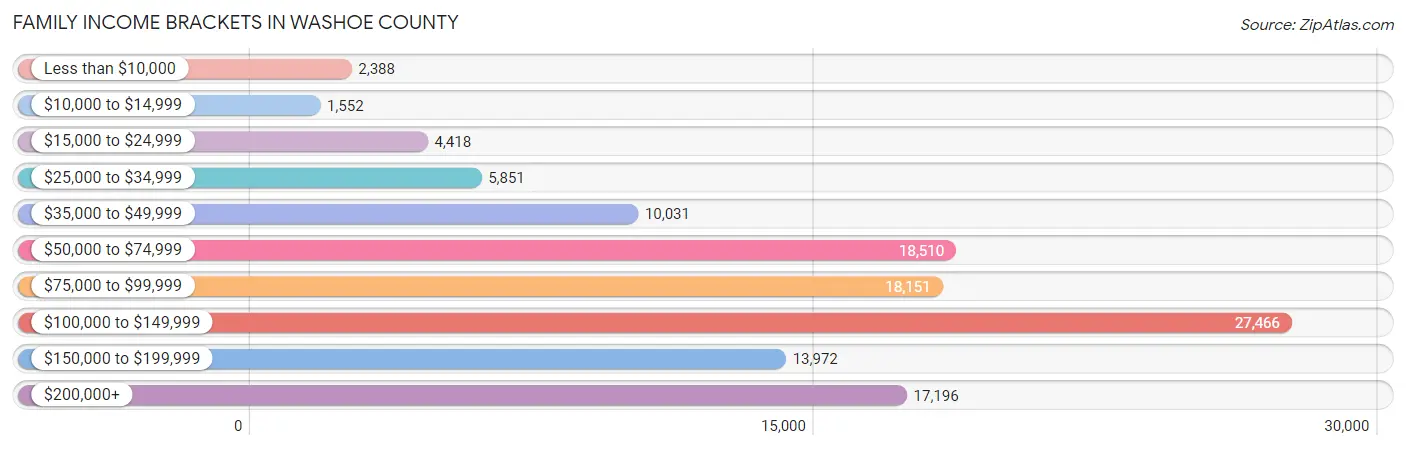
Family Income Brackets in Washoe County
According to the Washoe County family income data, there are 27,466 families falling into the $100,000 to $149,999 income range, which is the most common income bracket and makes up 23.0% of all families. Conversely, the $10,000 to $14,999 income bracket is the least frequent group with only 1,552 families (1.3%) belonging to this category.
| Income Bracket | # Families | % Families |
| Less than $10,000 | 2,388 | 2.0% |
| $10,000 to $14,999 | 1,552 | 1.3% |
| $15,000 to $24,999 | 4,418 | 3.7% |
| $25,000 to $34,999 | 5,851 | 4.9% |
| $35,000 to $49,999 | 10,031 | 8.4% |
| $50,000 to $74,999 | 18,510 | 15.5% |
| $75,000 to $99,999 | 18,151 | 15.2% |
| $100,000 to $149,999 | 27,466 | 23.0% |
| $150,000 to $199,999 | 13,972 | 11.7% |
| $200,000+ | 17,196 | 14.4% |
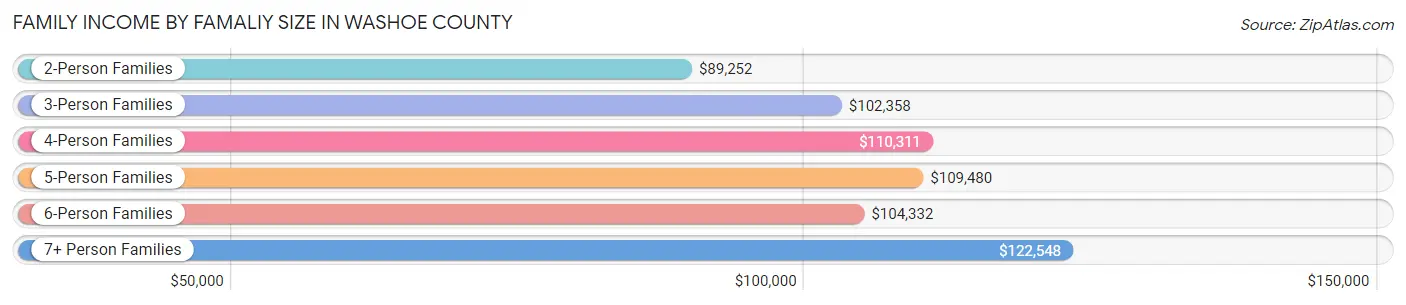
Family Income by Famaliy Size in Washoe County
7+ person families (2,218 | 1.9%) account for the highest median family income in Washoe County with $122,548 per family, while 2-person families (56,981 | 47.7%) have the highest median income of $44,626 per family member.
| Income Bracket | # Families | Median Income |
| 2-Person Families | 56,981 (47.7%) | $89,252 |
| 3-Person Families | 25,926 (21.7%) | $102,358 |
| 4-Person Families | 21,330 (17.9%) | $110,311 |
| 5-Person Families | 9,949 (8.3%) | $109,480 |
| 6-Person Families | 3,013 (2.5%) | $104,332 |
| 7+ Person Families | 2,218 (1.9%) | $122,548 |
| Total | 119,417 (100.0%) | $98,619 |
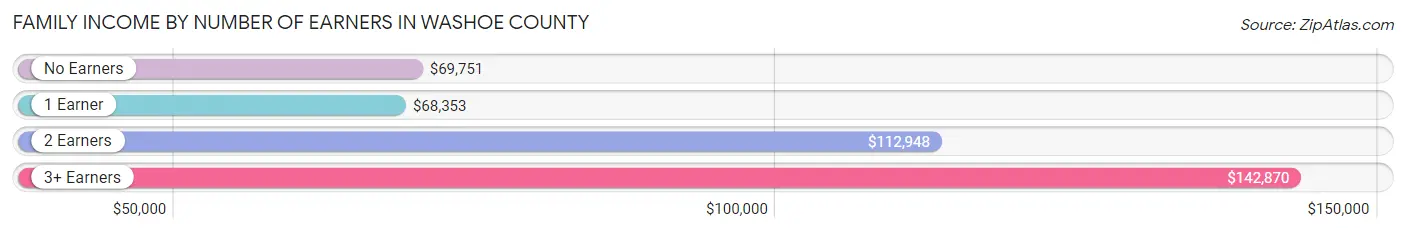
Family Income by Number of Earners in Washoe County
The median family income in Washoe County is $98,619, with families comprising 3+ earners (15,387) having the highest median family income of $142,870, while families with 1 earner (37,021) have the lowest median family income of $68,353, accounting for 12.9% and 31.0% of families, respectively.
| Number of Earners | # Families | Median Income |
| No Earners | 17,409 (14.6%) | $69,751 |
| 1 Earner | 37,021 (31.0%) | $68,353 |
| 2 Earners | 49,600 (41.5%) | $112,948 |
| 3+ Earners | 15,387 (12.9%) | $142,870 |
| Total | 119,417 (100.0%) | $98,619 |
Household Income in Washoe County
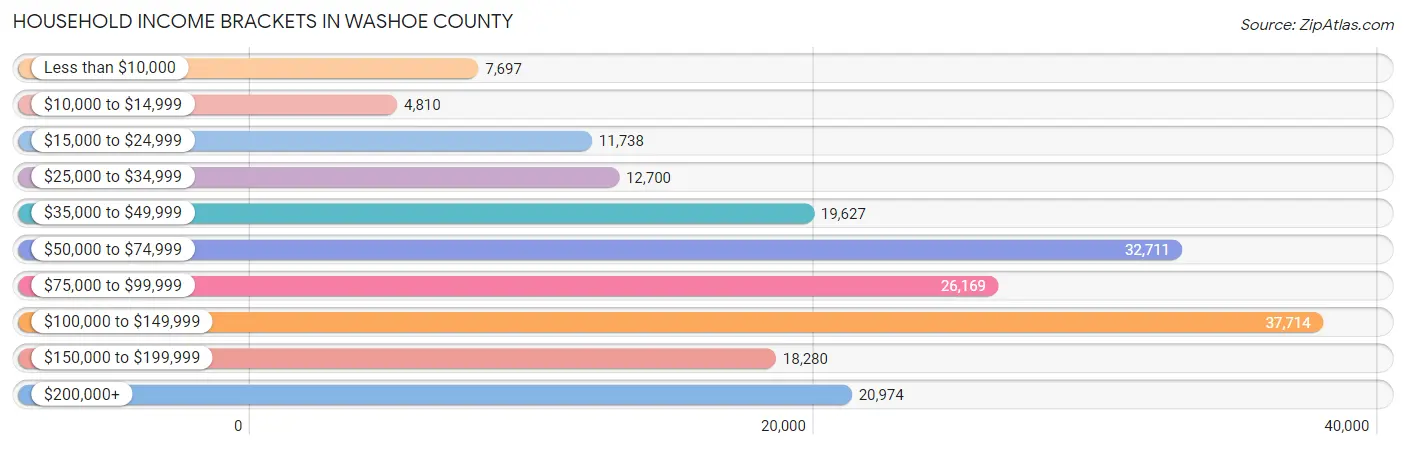
Household Income Brackets in Washoe County
With 37,714 households falling in the category, the $100,000 to $149,999 income range is the most frequent in Washoe County, accounting for 19.6% of all households. In contrast, only 4,810 households (2.5%) fall into the $10,000 to $14,999 income bracket, making it the least populous group.
| Income Bracket | # Households | % Households |
| Less than $10,000 | 7,697 | 4.0% |
| $10,000 to $14,999 | 4,810 | 2.5% |
| $15,000 to $24,999 | 11,738 | 6.1% |
| $25,000 to $34,999 | 12,700 | 6.6% |
| $35,000 to $49,999 | 19,627 | 10.2% |
| $50,000 to $74,999 | 32,711 | 17.0% |
| $75,000 to $99,999 | 26,169 | 13.6% |
| $100,000 to $149,999 | 37,714 | 19.6% |
| $150,000 to $199,999 | 18,280 | 9.5% |
| $200,000+ | 20,974 | 10.9% |
Household Income by Householder Age in Washoe County
The median household income in Washoe County is $81,531, with the highest median household income of $97,518 found in the 45 to 64 years age bracket for the primary householder. A total of 66,439 households (34.5%) fall into this category. Meanwhile, the 15 to 24 years age bracket for the primary householder has the lowest median household income of $49,655, with 9,384 households (4.9%) in this group.
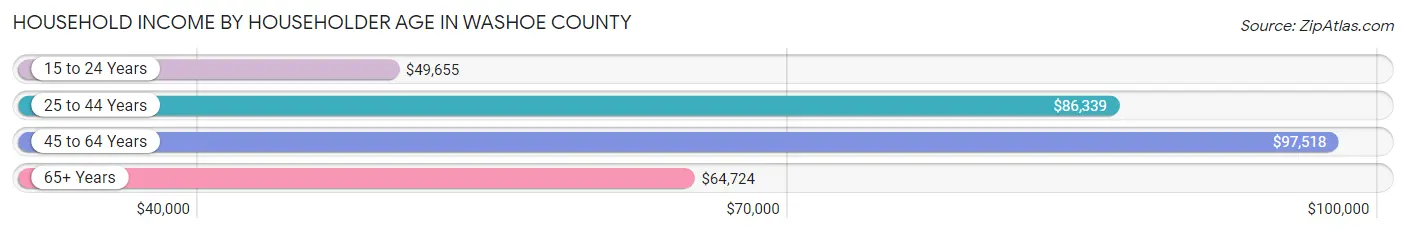
| Income Bracket | # Households | Median Income |
| 15 to 24 Years | 9,384 (4.9%) | $49,655 |
| 25 to 44 Years | 65,252 (33.9%) | $86,339 |
| 45 to 64 Years | 66,439 (34.5%) | $97,518 |
| 65+ Years | 51,345 (26.7%) | $64,724 |
| Total | 192,420 (100.0%) | $81,531 |
Poverty in Washoe County
Income Below Poverty by Sex and Age in Washoe County
With 10.1% poverty level for males and 11.7% for females among the residents of Washoe County, 18 to 24 year old males and 18 to 24 year old females are the most vulnerable to poverty, with 4,311 males (19.7%) and 4,685 females (23.2%) in their respective age groups living below the poverty level.
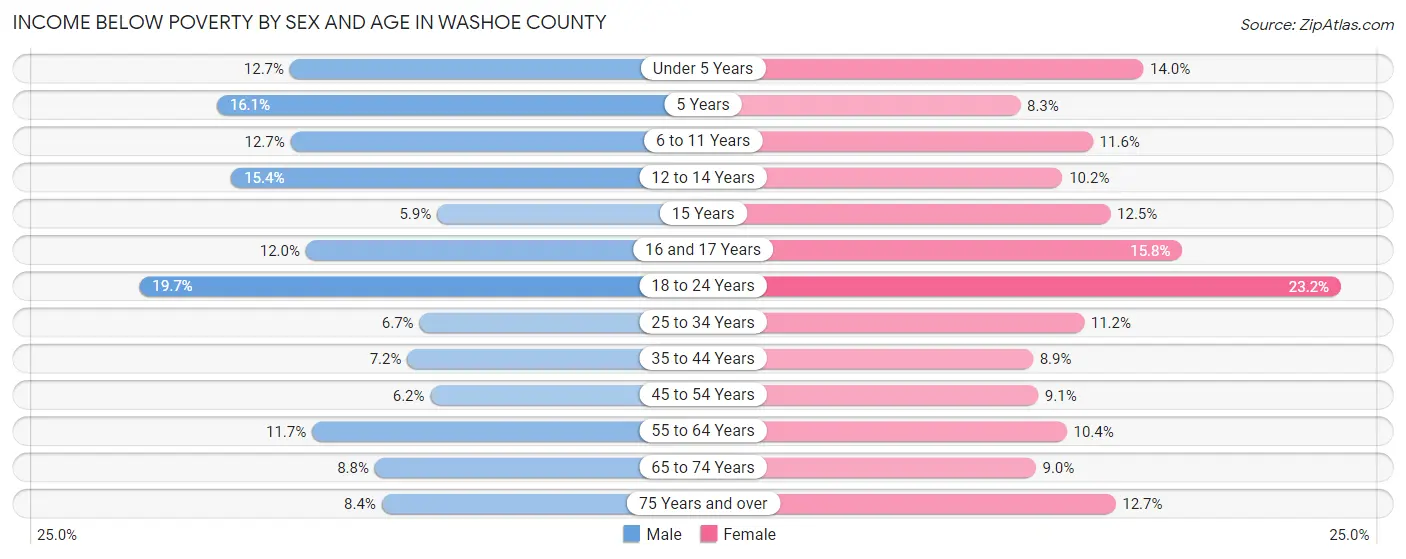
| Age Bracket | Male | Female |
| Under 5 Years | 1,678 (12.7%) | 1,776 (14.0%) |
| 5 Years | 476 (16.1%) | 247 (8.3%) |
| 6 to 11 Years | 2,186 (12.7%) | 1,820 (11.6%) |
| 12 to 14 Years | 1,355 (15.4%) | 929 (10.2%) |
| 15 Years | 180 (5.9%) | 348 (12.4%) |
| 16 and 17 Years | 717 (11.9%) | 904 (15.8%) |
| 18 to 24 Years | 4,311 (19.7%) | 4,685 (23.2%) |
| 25 to 34 Years | 2,508 (6.7%) | 3,898 (11.2%) |
| 35 to 44 Years | 2,324 (7.2%) | 2,655 (8.9%) |
| 45 to 54 Years | 1,858 (6.2%) | 2,578 (9.1%) |
| 55 to 64 Years | 3,681 (11.7%) | 3,268 (10.4%) |
| 65 to 74 Years | 2,186 (8.7%) | 2,357 (9.0%) |
| 75 Years and over | 1,169 (8.4%) | 2,071 (12.7%) |
| Total | 24,629 (10.1%) | 27,536 (11.7%) |
Income Above Poverty by Sex and Age in Washoe County
According to the poverty statistics in Washoe County, males aged 15 years and females aged 5 years are the age groups that are most secure financially, with 94.1% of males and 91.7% of females in these age groups living above the poverty line.
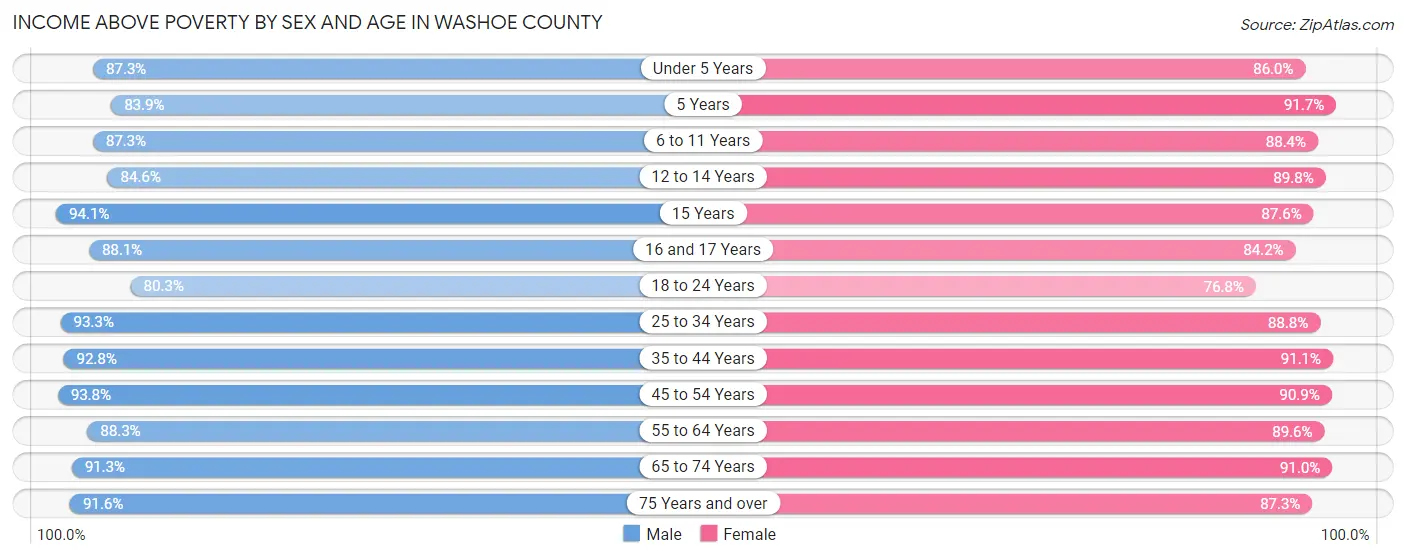
| Age Bracket | Male | Female |
| Under 5 Years | 11,544 (87.3%) | 10,931 (86.0%) |
| 5 Years | 2,484 (83.9%) | 2,741 (91.7%) |
| 6 to 11 Years | 15,081 (87.3%) | 13,822 (88.4%) |
| 12 to 14 Years | 7,436 (84.6%) | 8,151 (89.8%) |
| 15 Years | 2,893 (94.1%) | 2,448 (87.5%) |
| 16 and 17 Years | 5,282 (88.0%) | 4,818 (84.2%) |
| 18 to 24 Years | 17,608 (80.3%) | 15,548 (76.8%) |
| 25 to 34 Years | 35,054 (93.3%) | 30,809 (88.8%) |
| 35 to 44 Years | 29,764 (92.8%) | 27,319 (91.1%) |
| 45 to 54 Years | 28,253 (93.8%) | 25,742 (90.9%) |
| 55 to 64 Years | 27,895 (88.3%) | 28,075 (89.6%) |
| 65 to 74 Years | 22,806 (91.2%) | 23,857 (91.0%) |
| 75 Years and over | 12,704 (91.6%) | 14,255 (87.3%) |
| Total | 218,804 (89.9%) | 208,516 (88.3%) |
Income Below Poverty Among Married-Couple Families in Washoe County
The poverty statistics for married-couple families in Washoe County show that 3.4% or 2,963 of the total 86,306 families live below the poverty line. Families with 5 or more children have the highest poverty rate of 27.8%, comprising of 126 families. On the other hand, families with 1 or 2 children have the lowest poverty rate of 2.7%, which includes 702 families.
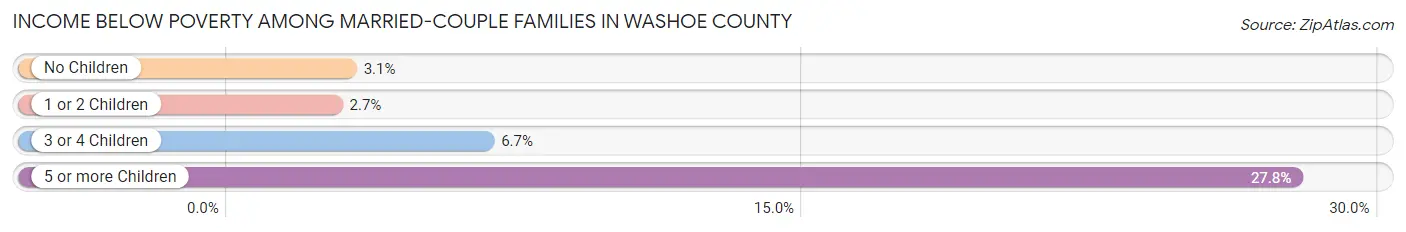
| Children | Above Poverty | Below Poverty |
| No Children | 50,943 (96.9%) | 1,629 (3.1%) |
| 1 or 2 Children | 25,013 (97.3%) | 702 (2.7%) |
| 3 or 4 Children | 7,060 (93.3%) | 506 (6.7%) |
| 5 or more Children | 327 (72.2%) | 126 (27.8%) |
| Total | 83,343 (96.6%) | 2,963 (3.4%) |
Income Below Poverty Among Single-Parent Households in Washoe County
According to the poverty data in Washoe County, 9.8% or 1,185 single-father households and 17.7% or 3,725 single-mother households are living below the poverty line. Among single-father households, those with 3 or 4 children have the highest poverty rate, with 220 households (21.7%) experiencing poverty. Likewise, among single-mother households, those with 5 or more children have the highest poverty rate, with 161 households (63.4%) falling below the poverty line.
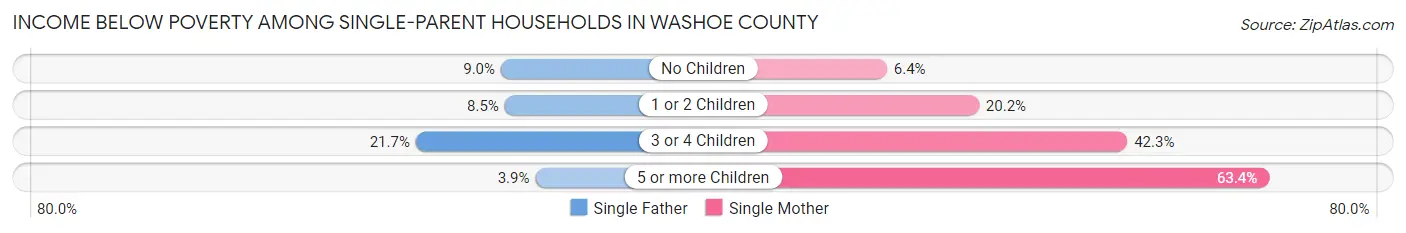
| Children | Single Father | Single Mother |
| No Children | 461 (9.0%) | 517 (6.4%) |
| 1 or 2 Children | 501 (8.5%) | 2,118 (20.2%) |
| 3 or 4 Children | 220 (21.7%) | 929 (42.2%) |
| 5 or more Children | 3 (3.9%) | 161 (63.4%) |
| Total | 1,185 (9.8%) | 3,725 (17.7%) |
Income Below Poverty Among Married-Couple vs Single-Parent Households in Washoe County
The poverty data for Washoe County shows that 2,963 of the married-couple family households (3.4%) and 4,910 of the single-parent households (14.8%) are living below the poverty level. Within the married-couple family households, those with 5 or more children have the highest poverty rate, with 126 households (27.8%) falling below the poverty line. Among the single-parent households, those with 5 or more children have the highest poverty rate, with 164 household (49.5%) living below poverty.
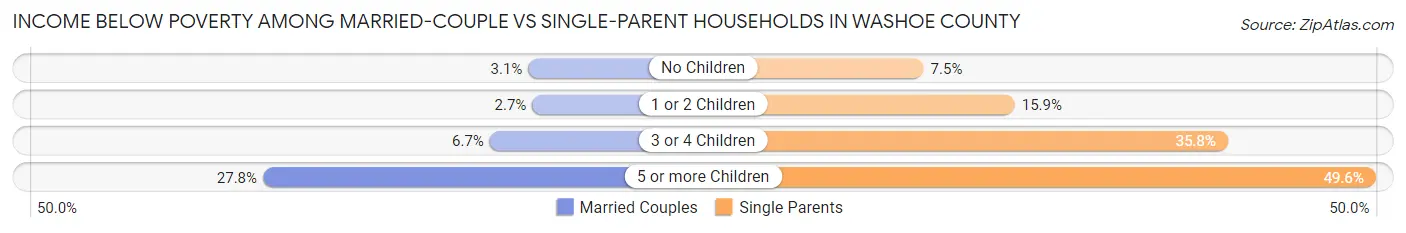
| Children | Married-Couple Families | Single-Parent Households |
| No Children | 1,629 (3.1%) | 978 (7.4%) |
| 1 or 2 Children | 702 (2.7%) | 2,619 (15.9%) |
| 3 or 4 Children | 506 (6.7%) | 1,149 (35.8%) |
| 5 or more Children | 126 (27.8%) | 164 (49.5%) |
| Total | 2,963 (3.4%) | 4,910 (14.8%) |
Race in Washoe County
The most populous races in Washoe County are White / Caucasian (330,713 | 67.9%), Hispanic or Latino (123,956 | 25.5%), and Two or more Races (55,685 | 11.4%).
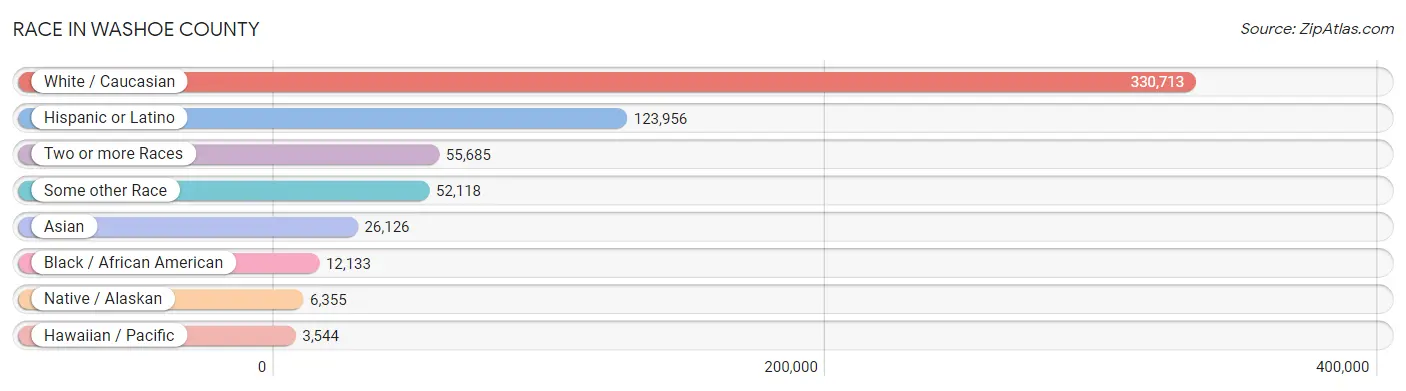
| Race | # Population | % Population |
| Asian | 26,126 | 5.4% |
| Black / African American | 12,133 | 2.5% |
| Hawaiian / Pacific | 3,544 | 0.7% |
| Hispanic or Latino | 123,956 | 25.5% |
| Native / Alaskan | 6,355 | 1.3% |
| White / Caucasian | 330,713 | 67.9% |
| Two or more Races | 55,685 | 11.4% |
| Some other Race | 52,118 | 10.7% |
| Total | 486,674 | 100.0% |
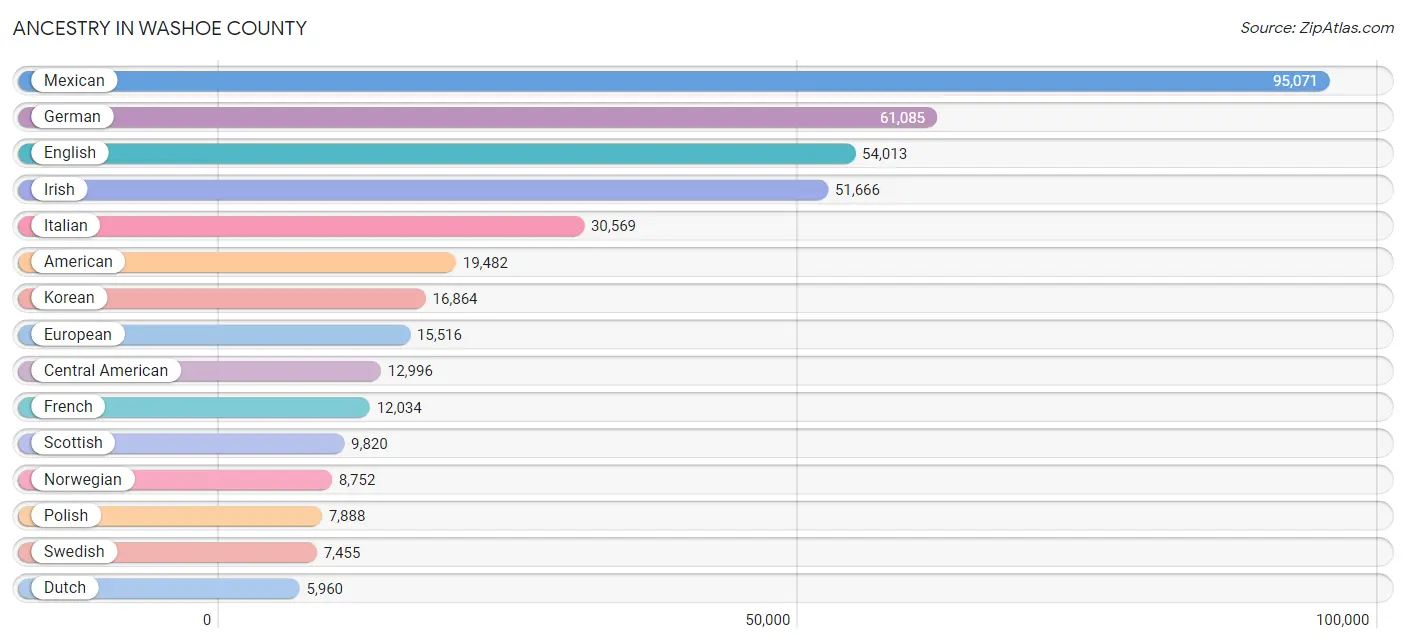
Ancestry in Washoe County
The most populous ancestries reported in Washoe County are Mexican (95,071 | 19.5%), German (61,085 | 12.6%), English (54,013 | 11.1%), Irish (51,666 | 10.6%), and Italian (30,569 | 6.3%), together accounting for 60.1% of all Washoe County residents.
| Ancestry | # Population | % Population |
| Afghan | 20 | 0.0% |
| African | 799 | 0.2% |
| Alaska Native | 68 | 0.0% |
| Alaskan Athabascan | 60 | 0.0% |
| Albanian | 4 | 0.0% |
| Aleut | 138 | 0.0% |
| Alsatian | 6 | 0.0% |
| American | 19,482 | 4.0% |
| Apache | 428 | 0.1% |
| Arab | 1,580 | 0.3% |
| Arapaho | 71 | 0.0% |
| Argentinean | 232 | 0.1% |
| Armenian | 845 | 0.2% |
| Assyrian / Chaldean / Syriac | 67 | 0.0% |
| Australian | 288 | 0.1% |
| Austrian | 1,150 | 0.2% |
| Bahamian | 14 | 0.0% |
| Bangladeshi | 43 | 0.0% |
| Barbadian | 3 | 0.0% |
| Basque | 1,496 | 0.3% |
| Belgian | 251 | 0.1% |
| Belizean | 16 | 0.0% |
| Bhutanese | 3,626 | 0.7% |
| Blackfeet | 731 | 0.2% |
| Bolivian | 142 | 0.0% |
| Brazilian | 337 | 0.1% |
| British | 2,738 | 0.6% |
| Bulgarian | 143 | 0.0% |
| Burmese | 1,831 | 0.4% |
| Cajun | 52 | 0.0% |
| Cambodian | 10 | 0.0% |
| Canadian | 1,429 | 0.3% |
| Carpatho Rusyn | 29 | 0.0% |
| Celtic | 91 | 0.0% |
| Central American | 12,996 | 2.7% |
| Central American Indian | 346 | 0.1% |
| Cherokee | 1,656 | 0.3% |
| Cheyenne | 73 | 0.0% |
| Chickasaw | 138 | 0.0% |
| Chilean | 197 | 0.0% |
| Chinese | 10 | 0.0% |
| Chippewa | 247 | 0.1% |
| Choctaw | 325 | 0.1% |
| Colombian | 1,160 | 0.2% |
| Colville | 78 | 0.0% |
| Comanche | 3 | 0.0% |
| Costa Rican | 648 | 0.1% |
| Cree | 27 | 0.0% |
| Creek | 133 | 0.0% |
| Croatian | 950 | 0.2% |
| Crow | 183 | 0.0% |
| Cuban | 1,712 | 0.4% |
| Czech | 1,703 | 0.4% |
| Czechoslovakian | 362 | 0.1% |
| Danish | 3,347 | 0.7% |
| Delaware | 29 | 0.0% |
| Dominican | 207 | 0.0% |
| Dutch | 5,960 | 1.2% |
| Dutch West Indian | 13 | 0.0% |
| Eastern European | 1,677 | 0.3% |
| Ecuadorian | 140 | 0.0% |
| Egyptian | 99 | 0.0% |
| English | 54,013 | 11.1% |
| Estonian | 36 | 0.0% |
| Ethiopian | 621 | 0.1% |
| European | 15,516 | 3.2% |
| Fijian | 166 | 0.0% |
| Filipino | 181 | 0.0% |
| Finnish | 1,182 | 0.2% |
| French | 12,034 | 2.5% |
| French American Indian | 28 | 0.0% |
| French Canadian | 2,484 | 0.5% |
| German | 61,085 | 12.6% |
| German Russian | 51 | 0.0% |
| Ghanaian | 81 | 0.0% |
| Greek | 1,671 | 0.3% |
| Guamanian / Chamorro | 456 | 0.1% |
| Guatemalan | 5,148 | 1.1% |
| Haitian | 293 | 0.1% |
| Honduran | 476 | 0.1% |
| Hopi | 46 | 0.0% |
| Houma | 84 | 0.0% |
| Hungarian | 1,650 | 0.3% |
| Icelander | 147 | 0.0% |
| Indian (Asian) | 5,780 | 1.2% |
| Indonesian | 3 | 0.0% |
| Inupiat | 40 | 0.0% |
| Iranian | 861 | 0.2% |
| Iraqi | 48 | 0.0% |
| Irish | 51,666 | 10.6% |
| Iroquois | 168 | 0.0% |
| Israeli | 12 | 0.0% |
| Italian | 30,569 | 6.3% |
| Jamaican | 103 | 0.0% |
| Japanese | 103 | 0.0% |
| Kenyan | 158 | 0.0% |
| Korean | 16,864 | 3.5% |
| Laotian | 278 | 0.1% |
| Latvian | 119 | 0.0% |
| Lebanese | 703 | 0.1% |
| Liberian | 100 | 0.0% |
| Lithuanian | 953 | 0.2% |
| Lumbee | 19 | 0.0% |
| Luxembourger | 117 | 0.0% |
| Macedonian | 76 | 0.0% |
| Malaysian | 113 | 0.0% |
| Maltese | 24 | 0.0% |
| Marshallese | 29 | 0.0% |
| Mexican | 95,071 | 19.5% |
| Mexican American Indian | 1,692 | 0.4% |
| Mongolian | 12 | 0.0% |
| Moroccan | 34 | 0.0% |
| Native Hawaiian | 2,434 | 0.5% |
| Navajo | 410 | 0.1% |
| New Zealander | 77 | 0.0% |
| Nicaraguan | 789 | 0.2% |
| Nigerian | 712 | 0.2% |
| Northern European | 3,177 | 0.6% |
| Norwegian | 8,752 | 1.8% |
| Okinawan | 9 | 0.0% |
| Osage | 104 | 0.0% |
| Paiute | 2,064 | 0.4% |
| Pakistani | 841 | 0.2% |
| Palestinian | 55 | 0.0% |
| Panamanian | 68 | 0.0% |
| Paraguayan | 39 | 0.0% |
| Pennsylvania German | 81 | 0.0% |
| Peruvian | 675 | 0.1% |
| Pima | 50 | 0.0% |
| Polish | 7,888 | 1.6% |
| Portuguese | 4,607 | 0.9% |
| Potawatomi | 104 | 0.0% |
| Pueblo | 32 | 0.0% |
| Puerto Rican | 3,185 | 0.6% |
| Puget Sound Salish | 2 | 0.0% |
| Romanian | 1,010 | 0.2% |
| Russian | 2,767 | 0.6% |
| Salvadoran | 5,783 | 1.2% |
| Samoan | 1,096 | 0.2% |
| Scandinavian | 2,651 | 0.5% |
| Scotch-Irish | 3,438 | 0.7% |
| Scottish | 9,820 | 2.0% |
| Seminole | 146 | 0.0% |
| Serbian | 358 | 0.1% |
| Shoshone | 432 | 0.1% |
| Sioux | 378 | 0.1% |
| Slavic | 467 | 0.1% |
| Slovak | 263 | 0.1% |
| Slovene | 190 | 0.0% |
| Somali | 25 | 0.0% |
| South African | 47 | 0.0% |
| South American | 3,178 | 0.6% |
| South American Indian | 55 | 0.0% |
| Spaniard | 2,134 | 0.4% |
| Spanish | 2,573 | 0.5% |
| Spanish American | 47 | 0.0% |
| Sri Lankan | 2,333 | 0.5% |
| Subsaharan African | 2,740 | 0.6% |
| Swedish | 7,455 | 1.5% |
| Swiss | 2,046 | 0.4% |
| Syrian | 76 | 0.0% |
| Taiwanese | 35 | 0.0% |
| Thai | 4,602 | 0.9% |
| Tlingit-Haida | 17 | 0.0% |
| Tohono O'Odham | 14 | 0.0% |
| Tongan | 1,096 | 0.2% |
| Trinidadian and Tobagonian | 146 | 0.0% |
| Turkish | 66 | 0.0% |
| Ugandan | 9 | 0.0% |
| Ukrainian | 1,185 | 0.2% |
| Uruguayan | 417 | 0.1% |
| Venezuelan | 67 | 0.0% |
| Vietnamese | 404 | 0.1% |
| Welsh | 2,849 | 0.6% |
| Yaqui | 50 | 0.0% |
| Yugoslavian | 480 | 0.1% |
| Yuman | 44 | 0.0% |
| Zimbabwean | 31 | 0.0% | View All 178 Rows |
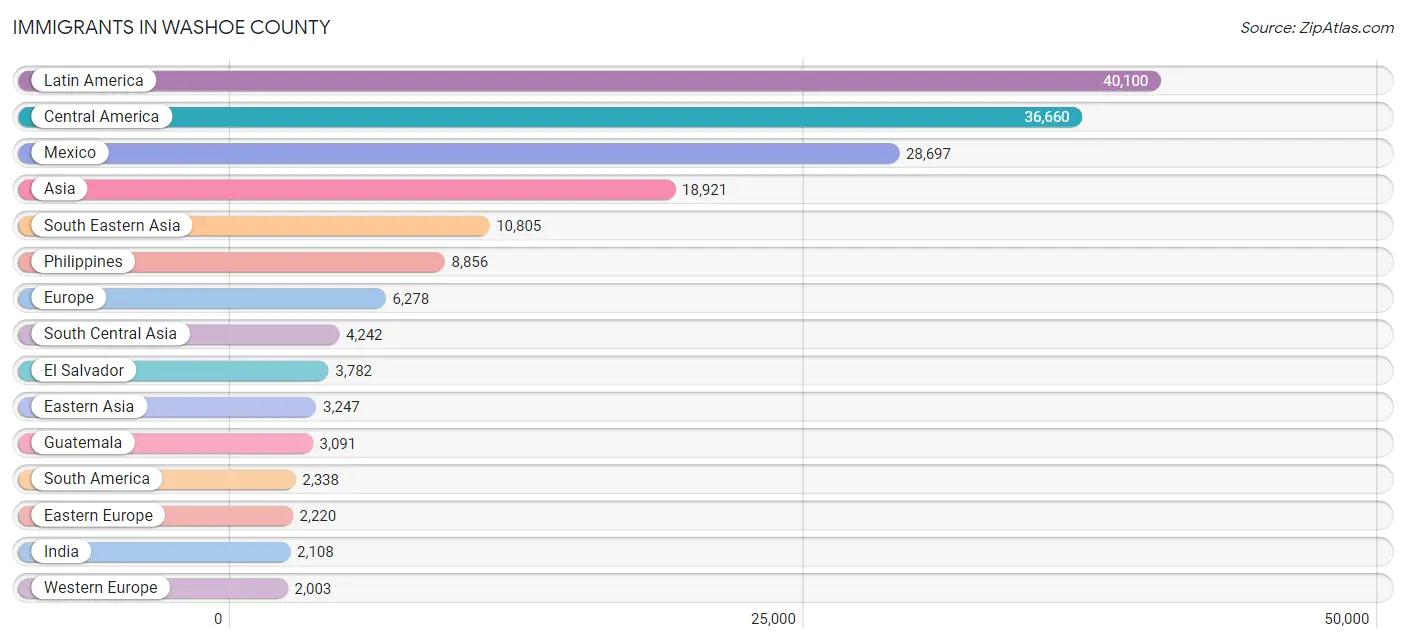
Immigrants in Washoe County
The most numerous immigrant groups reported in Washoe County came from Latin America (40,100 | 8.2%), Central America (36,660 | 7.5%), Mexico (28,697 | 5.9%), Asia (18,921 | 3.9%), and South Eastern Asia (10,805 | 2.2%), together accounting for 27.8% of all Washoe County residents.
| Immigration Origin | # Population | % Population |
| Afghanistan | 28 | 0.0% |
| Africa | 1,909 | 0.4% |
| Argentina | 163 | 0.0% |
| Armenia | 122 | 0.0% |
| Asia | 18,921 | 3.9% |
| Australia | 134 | 0.0% |
| Austria | 141 | 0.0% |
| Azores | 8 | 0.0% |
| Bahamas | 4 | 0.0% |
| Bangladesh | 969 | 0.2% |
| Barbados | 11 | 0.0% |
| Belarus | 77 | 0.0% |
| Belgium | 10 | 0.0% |
| Belize | 10 | 0.0% |
| Bolivia | 68 | 0.0% |
| Bosnia and Herzegovina | 83 | 0.0% |
| Brazil | 279 | 0.1% |
| Bulgaria | 60 | 0.0% |
| Cambodia | 49 | 0.0% |
| Cameroon | 252 | 0.1% |
| Canada | 1,716 | 0.4% |
| Caribbean | 1,102 | 0.2% |
| Central America | 36,660 | 7.5% |
| Chile | 165 | 0.0% |
| China | 1,878 | 0.4% |
| Colombia | 672 | 0.1% |
| Costa Rica | 311 | 0.1% |
| Croatia | 59 | 0.0% |
| Cuba | 650 | 0.1% |
| Czechoslovakia | 119 | 0.0% |
| Denmark | 48 | 0.0% |
| Dominican Republic | 89 | 0.0% |
| Eastern Africa | 763 | 0.2% |
| Eastern Asia | 3,247 | 0.7% |
| Eastern Europe | 2,220 | 0.5% |
| Ecuador | 74 | 0.0% |
| Egypt | 31 | 0.0% |
| El Salvador | 3,782 | 0.8% |
| England | 612 | 0.1% |
| Eritrea | 58 | 0.0% |
| Ethiopia | 386 | 0.1% |
| Europe | 6,278 | 1.3% |
| Fiji | 78 | 0.0% |
| France | 239 | 0.1% |
| Germany | 1,326 | 0.3% |
| Ghana | 220 | 0.1% |
| Greece | 57 | 0.0% |
| Guatemala | 3,091 | 0.6% |
| Guyana | 12 | 0.0% |
| Haiti | 179 | 0.0% |
| Honduras | 321 | 0.1% |
| Hong Kong | 217 | 0.0% |
| Hungary | 180 | 0.0% |
| India | 2,108 | 0.4% |
| Indonesia | 160 | 0.0% |
| Iran | 684 | 0.1% |
| Iraq | 38 | 0.0% |
| Ireland | 250 | 0.1% |
| Israel | 110 | 0.0% |
| Italy | 112 | 0.0% |
| Jamaica | 58 | 0.0% |
| Japan | 517 | 0.1% |
| Kazakhstan | 14 | 0.0% |
| Kenya | 167 | 0.0% |
| Korea | 852 | 0.2% |
| Kuwait | 41 | 0.0% |
| Laos | 26 | 0.0% |
| Latin America | 40,100 | 8.2% |
| Latvia | 22 | 0.0% |
| Lebanon | 68 | 0.0% |
| Liberia | 19 | 0.0% |
| Lithuania | 77 | 0.0% |
| Malaysia | 49 | 0.0% |
| Mexico | 28,697 | 5.9% |
| Micronesia | 201 | 0.0% |
| Middle Africa | 252 | 0.1% |
| Moldova | 23 | 0.0% |
| Morocco | 25 | 0.0% |
| Nepal | 32 | 0.0% |
| Netherlands | 184 | 0.0% |
| Nicaragua | 406 | 0.1% |
| Nigeria | 368 | 0.1% |
| Northern Africa | 114 | 0.0% |
| Northern Europe | 1,673 | 0.3% |
| Norway | 25 | 0.0% |
| Oceania | 1,047 | 0.2% |
| Pakistan | 172 | 0.0% |
| Panama | 42 | 0.0% |
| Peru | 448 | 0.1% |
| Philippines | 8,856 | 1.8% |
| Poland | 404 | 0.1% |
| Portugal | 89 | 0.0% |
| Romania | 551 | 0.1% |
| Russia | 185 | 0.0% |
| Saudi Arabia | 47 | 0.0% |
| Scotland | 79 | 0.0% |
| Serbia | 34 | 0.0% |
| Singapore | 60 | 0.0% |
| Somalia | 53 | 0.0% |
| South Africa | 90 | 0.0% |
| South America | 2,338 | 0.5% |
| South Central Asia | 4,242 | 0.9% |
| South Eastern Asia | 10,805 | 2.2% |
| Southern Europe | 358 | 0.1% |
| Spain | 78 | 0.0% |
| Sri Lanka | 18 | 0.0% |
| Sweden | 83 | 0.0% |
| Switzerland | 103 | 0.0% |
| Syria | 62 | 0.0% |
| Taiwan | 340 | 0.1% |
| Thailand | 398 | 0.1% |
| Trinidad and Tobago | 111 | 0.0% |
| Turkey | 17 | 0.0% |
| Uganda | 9 | 0.0% |
| Ukraine | 258 | 0.1% |
| Uruguay | 307 | 0.1% |
| Uzbekistan | 36 | 0.0% |
| Venezuela | 111 | 0.0% |
| Vietnam | 1,204 | 0.3% |
| Western Africa | 675 | 0.1% |
| Western Asia | 605 | 0.1% |
| Western Europe | 2,003 | 0.4% |
| Zimbabwe | 40 | 0.0% | View All 123 Rows |
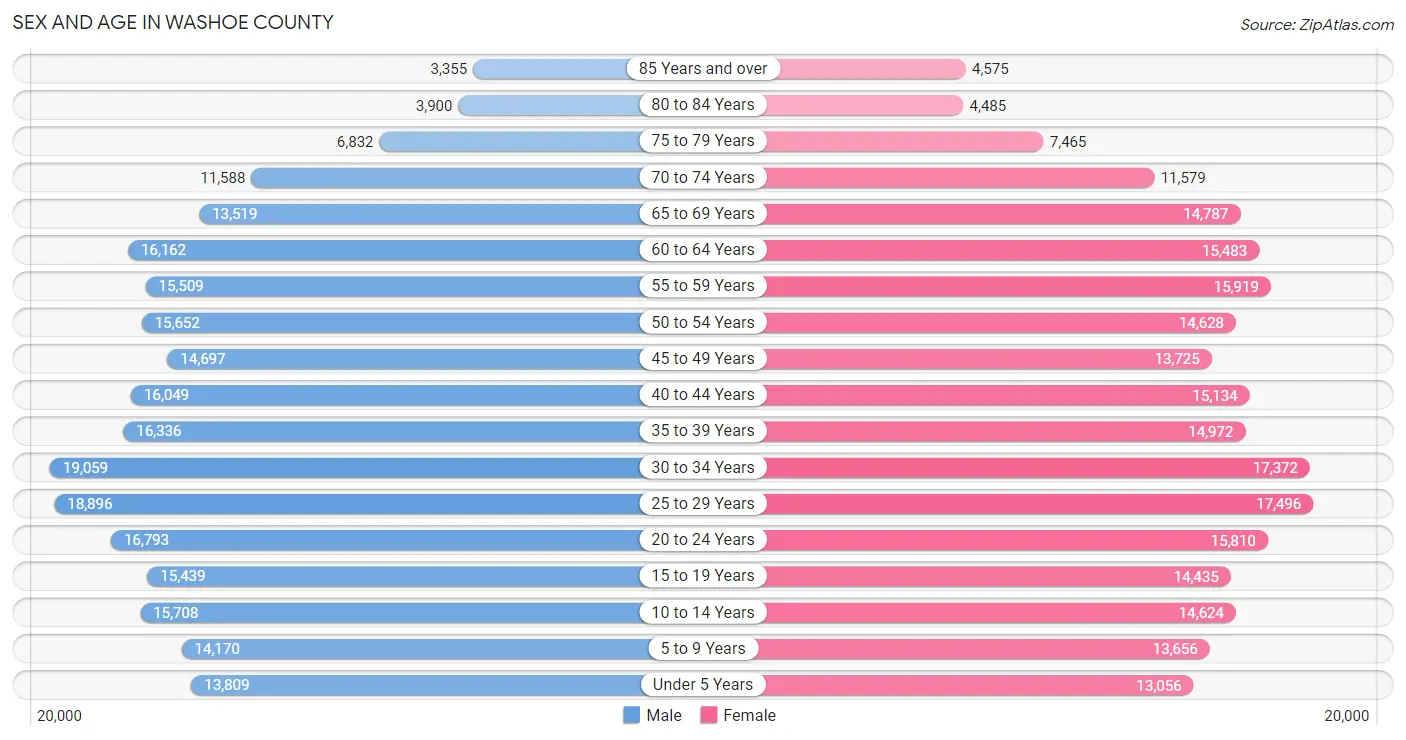
Sex and Age in Washoe County
Sex and Age in Washoe County
The most populous age groups in Washoe County are 30 to 34 Years (19,059 | 7.7%) for men and 25 to 29 Years (17,496 | 7.3%) for women.
| Age Bracket | Male | Female |
| Under 5 Years | 13,809 (5.6%) | 13,056 (5.5%) |
| 5 to 9 Years | 14,170 (5.7%) | 13,656 (5.7%) |
| 10 to 14 Years | 15,708 (6.4%) | 14,624 (6.1%) |
| 15 to 19 Years | 15,439 (6.2%) | 14,435 (6.0%) |
| 20 to 24 Years | 16,793 (6.8%) | 15,810 (6.6%) |
| 25 to 29 Years | 18,896 (7.6%) | 17,496 (7.3%) |
| 30 to 34 Years | 19,059 (7.7%) | 17,372 (7.3%) |
| 35 to 39 Years | 16,336 (6.6%) | 14,972 (6.3%) |
| 40 to 44 Years | 16,049 (6.5%) | 15,134 (6.3%) |
| 45 to 49 Years | 14,697 (5.9%) | 13,725 (5.7%) |
| 50 to 54 Years | 15,652 (6.3%) | 14,628 (6.1%) |
| 55 to 59 Years | 15,509 (6.3%) | 15,919 (6.7%) |
| 60 to 64 Years | 16,162 (6.5%) | 15,483 (6.5%) |
| 65 to 69 Years | 13,519 (5.5%) | 14,787 (6.2%) |
| 70 to 74 Years | 11,588 (4.7%) | 11,579 (4.8%) |
| 75 to 79 Years | 6,832 (2.8%) | 7,465 (3.1%) |
| 80 to 84 Years | 3,900 (1.6%) | 4,485 (1.9%) |
| 85 Years and over | 3,355 (1.4%) | 4,575 (1.9%) |
| Total | 247,473 (100.0%) | 239,201 (100.0%) |
Families and Households in Washoe County
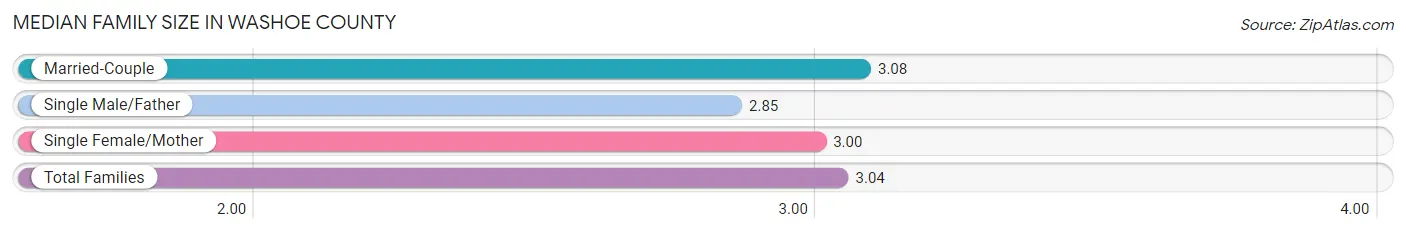
Median Family Size in Washoe County
The median family size in Washoe County is 3.04 persons per family, with married-couple families (86,306 | 72.3%) accounting for the largest median family size of 3.08 persons per family. On the other hand, single male/father families (12,118 | 10.2%) represent the smallest median family size with 2.85 persons per family.
| Family Type | # Families | Family Size |
| Married-Couple | 86,306 (72.3%) | 3.08 |
| Single Male/Father | 12,118 (10.2%) | 2.85 |
| Single Female/Mother | 20,993 (17.6%) | 3.00 |
| Total Families | 119,417 (100.0%) | 3.04 |
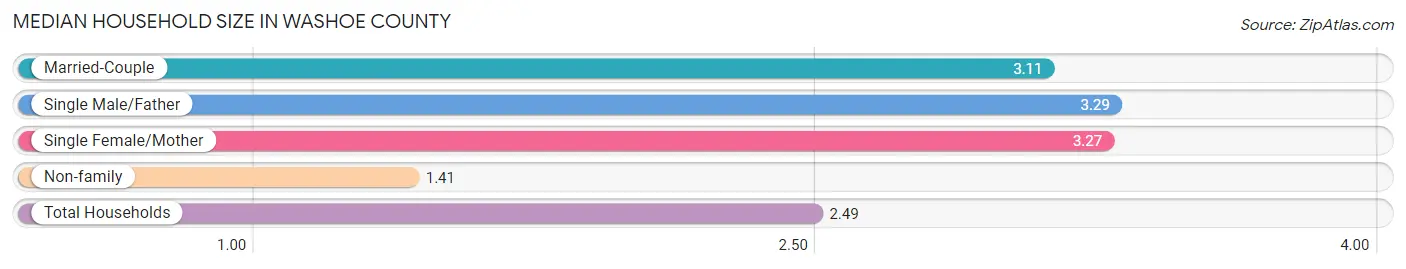
Median Household Size in Washoe County
The median household size in Washoe County is 2.49 persons per household, with single male/father households (12,118 | 6.3%) accounting for the largest median household size of 3.29 persons per household. non-family households (73,003 | 37.9%) represent the smallest median household size with 1.41 persons per household.
| Household Type | # Households | Household Size |
| Married-Couple | 86,306 (44.9%) | 3.11 |
| Single Male/Father | 12,118 (6.3%) | 3.29 |
| Single Female/Mother | 20,993 (10.9%) | 3.27 |
| Non-family | 73,003 (37.9%) | 1.41 |
| Total Households | 192,420 (100.0%) | 2.49 |
Household Size by Marriage Status in Washoe County
Out of a total of 192,420 households in Washoe County, 119,417 (62.1%) are family households, while 73,003 (37.9%) are nonfamily households. The most numerous type of family households are 2-person households, comprising 51,910, and the most common type of nonfamily households are 1-person households, comprising 52,885.
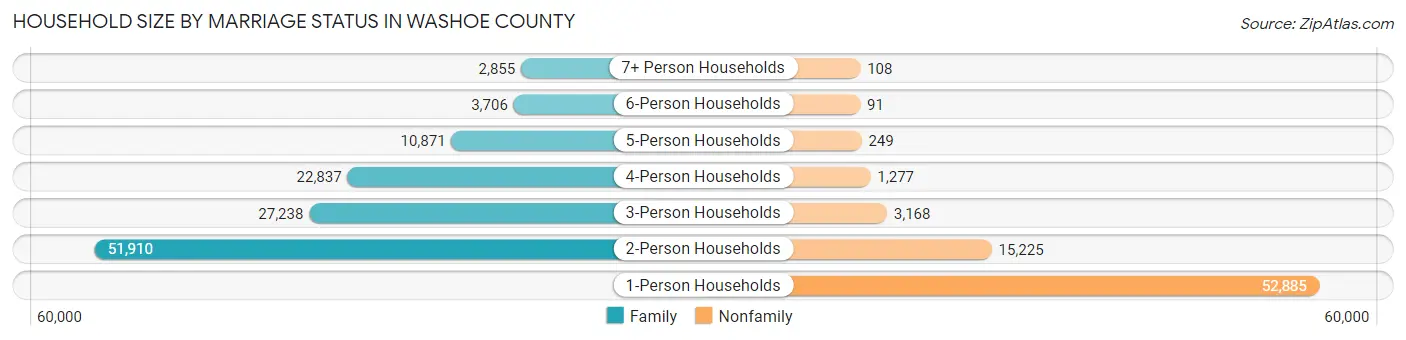
| Household Size | Family Households | Nonfamily Households |
| 1-Person Households | - | 52,885 (27.5%) |
| 2-Person Households | 51,910 (27.0%) | 15,225 (7.9%) |
| 3-Person Households | 27,238 (14.2%) | 3,168 (1.7%) |
| 4-Person Households | 22,837 (11.9%) | 1,277 (0.7%) |
| 5-Person Households | 10,871 (5.7%) | 249 (0.1%) |
| 6-Person Households | 3,706 (1.9%) | 91 (0.1%) |
| 7+ Person Households | 2,855 (1.5%) | 108 (0.1%) |
| Total | 119,417 (62.1%) | 73,003 (37.9%) |
Female Fertility in Washoe County
Fertility by Age in Washoe County
Average fertility rate in Washoe County is 50.0 births per 1,000 women. Women in the age bracket of 20 to 34 years have the highest fertility rate with 75.0 births per 1,000 women. Women in the age bracket of 20 to 34 years acount for 68.2% of all women with births.
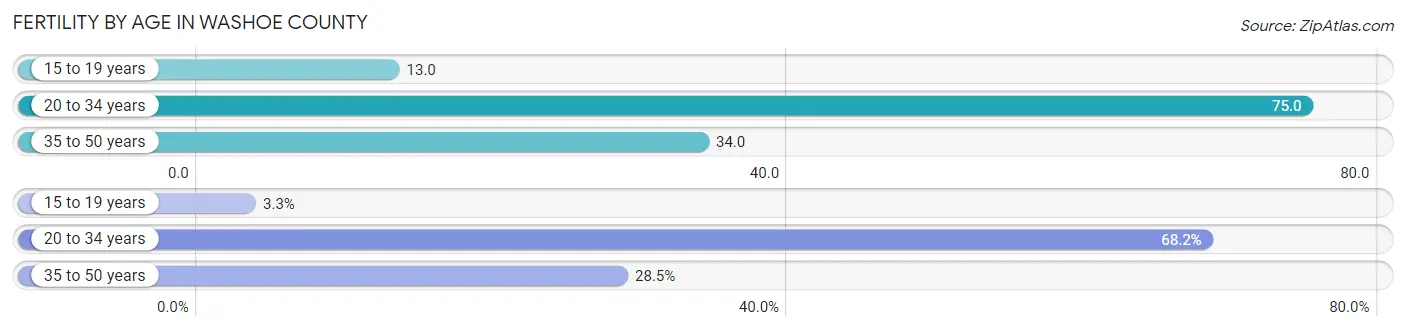
| Age Bracket | Women with Births | Births / 1,000 Women |
| 15 to 19 years | 181 (3.3%) | 13.0 |
| 20 to 34 years | 3,784 (68.2%) | 75.0 |
| 35 to 50 years | 1,581 (28.5%) | 34.0 |
| Total | 5,546 (100.0%) | 50.0 |
Fertility by Age by Marriage Status in Washoe County
62.1% of women with births (5,546) in Washoe County are married. The highest percentage of unmarried women with births falls into 15 to 19 years age bracket with 89.5% of them unmarried at the time of birth, while the lowest percentage of unmarried women with births belong to 35 to 50 years age bracket with 25.2% of them unmarried.
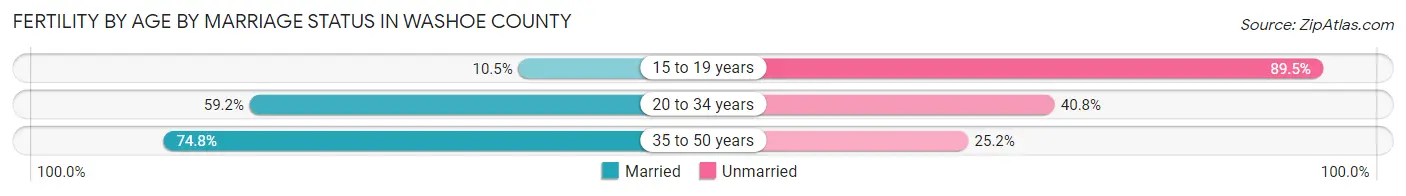
| Age Bracket | Married | Unmarried |
| 15 to 19 years | 19 (10.5%) | 162 (89.5%) |
| 20 to 34 years | 2,240 (59.2%) | 1,544 (40.8%) |
| 35 to 50 years | 1,183 (74.8%) | 398 (25.2%) |
| Total | 3,444 (62.1%) | 2,102 (37.9%) |
Fertility by Education in Washoe County
Average fertility rate in Washoe County is 50.0 births per 1,000 women. Women with the education attainment of graduate degree have the highest fertility rate of 59.0 births per 1,000 women, while women with the education attainment of college or associate's degree have the lowest fertility at 47.0 births per 1,000 women. Women with the education attainment of college or associate's degree represent 31.0% of all women with births.
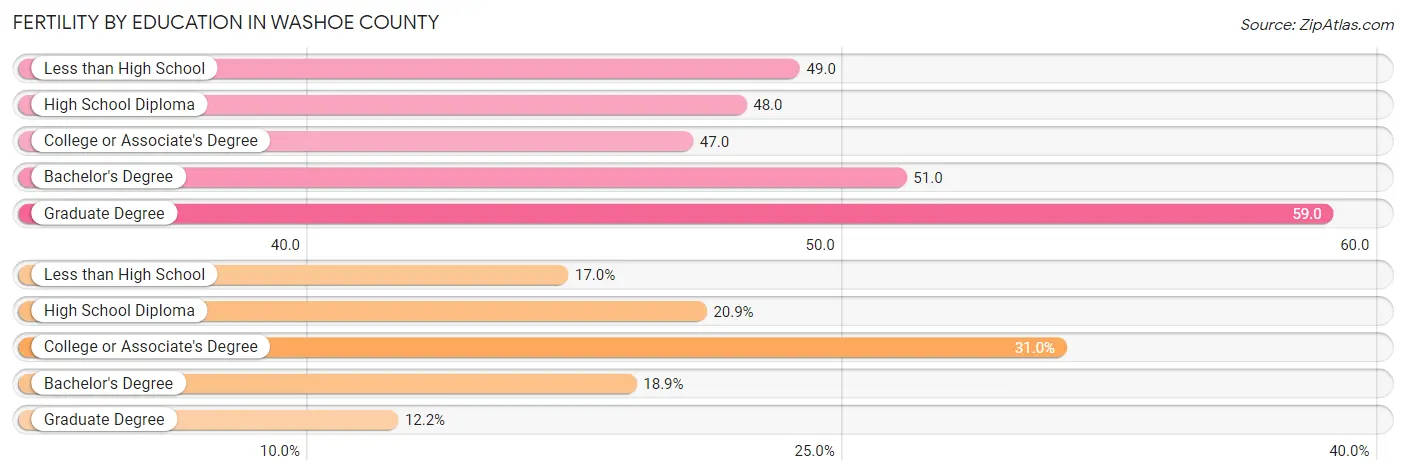
| Educational Attainment | Women with Births | Births / 1,000 Women |
| Less than High School | 942 (17.0%) | 49.0 |
| High School Diploma | 1,158 (20.9%) | 48.0 |
| College or Associate's Degree | 1,720 (31.0%) | 47.0 |
| Bachelor's Degree | 1,049 (18.9%) | 51.0 |
| Graduate Degree | 677 (12.2%) | 59.0 |
| Total | 5,546 (100.0%) | 50.0 |
Fertility by Education by Marriage Status in Washoe County
37.9% of women with births in Washoe County are unmarried. Women with the educational attainment of graduate degree are most likely to be married with 92.5% of them married at childbirth, while women with the educational attainment of less than high school are least likely to be married with 59.6% of them unmarried at childbirth.
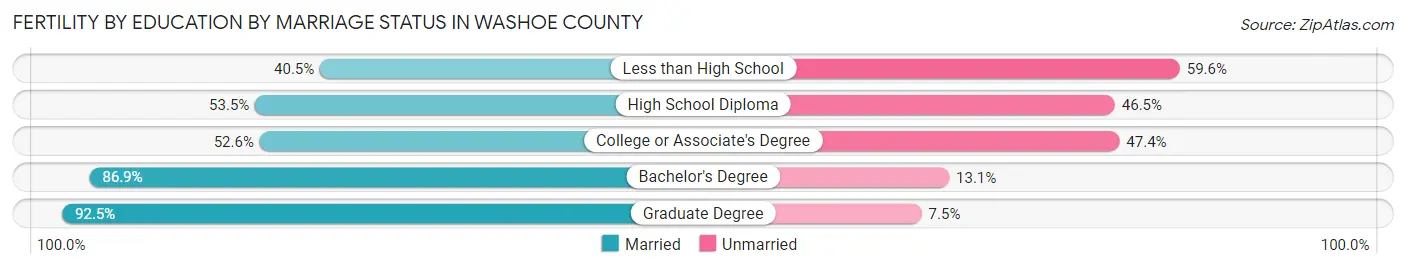
| Educational Attainment | Married | Unmarried |
| Less than High School | 381 (40.5%) | 561 (59.6%) |
| High School Diploma | 620 (53.5%) | 538 (46.5%) |
| College or Associate's Degree | 905 (52.6%) | 815 (47.4%) |
| Bachelor's Degree | 912 (86.9%) | 137 (13.1%) |
| Graduate Degree | 626 (92.5%) | 51 (7.5%) |
| Total | 3,444 (62.1%) | 2,102 (37.9%) |
Employment Characteristics in Washoe County
Employment by Class of Employer in Washoe County
Among the 244,367 employed individuals in Washoe County, private company employees (175,163 | 71.7%), local government employees (15,394 | 6.3%), and not-for-profit organizations (14,068 | 5.8%) make up the most common classes of employment.
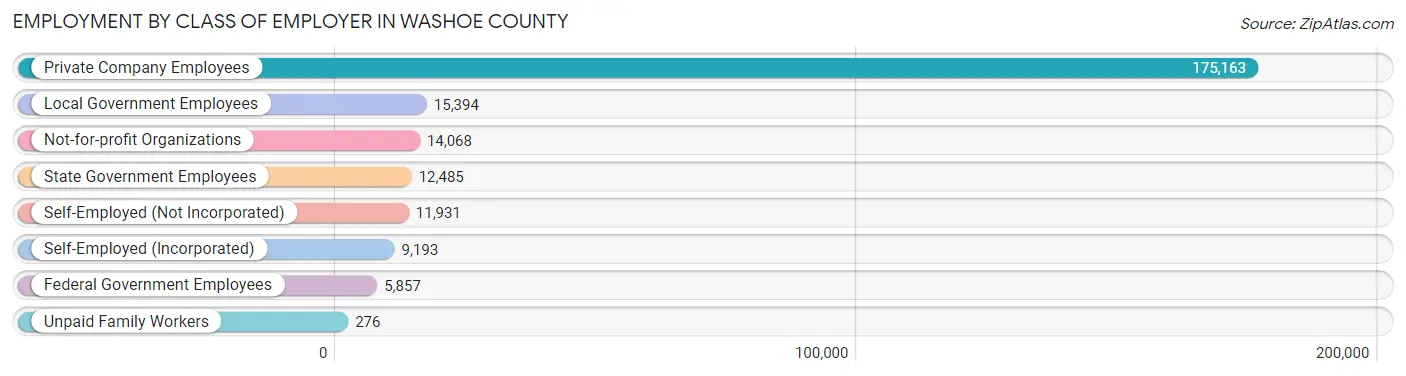
| Employer Class | # Employees | % Employees |
| Private Company Employees | 175,163 | 71.7% |
| Self-Employed (Incorporated) | 9,193 | 3.8% |
| Self-Employed (Not Incorporated) | 11,931 | 4.9% |
| Not-for-profit Organizations | 14,068 | 5.8% |
| Local Government Employees | 15,394 | 6.3% |
| State Government Employees | 12,485 | 5.1% |
| Federal Government Employees | 5,857 | 2.4% |
| Unpaid Family Workers | 276 | 0.1% |
| Total | 244,367 | 100.0% |
Employment Status by Age in Washoe County
According to the labor force statistics for Washoe County, out of the total population over 16 years of age (395,779), 66.2% or 262,006 individuals are in the labor force, with 5.0% or 13,100 of them unemployed. The age group with the highest labor force participation rate is 25 to 29 years, with 88.9% or 32,352 individuals in the labor force. Within the labor force, the 16 to 19 years age range has the highest percentage of unemployed individuals, with 18.3% or 2,051 of them being unemployed.
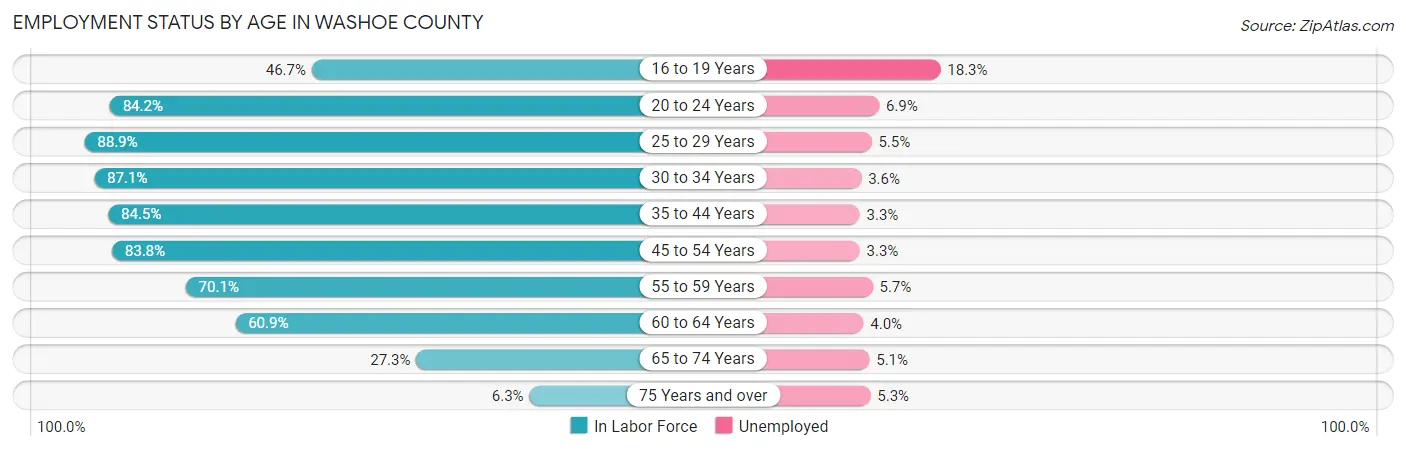
| Age Bracket | In Labor Force | Unemployed |
| 16 to 19 Years | 11,209 (46.7%) | 2,051 (18.3%) |
| 20 to 24 Years | 27,452 (84.2%) | 1,894 (6.9%) |
| 25 to 29 Years | 32,352 (88.9%) | 1,779 (5.5%) |
| 30 to 34 Years | 31,731 (87.1%) | 1,142 (3.6%) |
| 35 to 44 Years | 52,805 (84.5%) | 1,743 (3.3%) |
| 45 to 54 Years | 49,192 (83.8%) | 1,623 (3.3%) |
| 55 to 59 Years | 22,031 (70.1%) | 1,256 (5.7%) |
| 60 to 64 Years | 19,272 (60.9%) | 771 (4.0%) |
| 65 to 74 Years | 14,052 (27.3%) | 717 (5.1%) |
| 75 Years and over | 1,929 (6.3%) | 102 (5.3%) |
| Total | 262,006 (66.2%) | 13,100 (5.0%) |
Employment Status by Educational Attainment in Washoe County
According to labor force statistics for Washoe County, 80.7% of individuals (207,471) out of the total population between 25 and 64 years of age (257,089) are in the labor force, with 4.0% or 8,299 of them being unemployed. The group with the highest labor force participation rate are those with the educational attainment of bachelor's degree or higher, with 86.5% or 71,317 individuals in the labor force. Within the labor force, individuals with less than high school education have the highest percentage of unemployment, with 6.5% or 1,452 of them being unemployed.
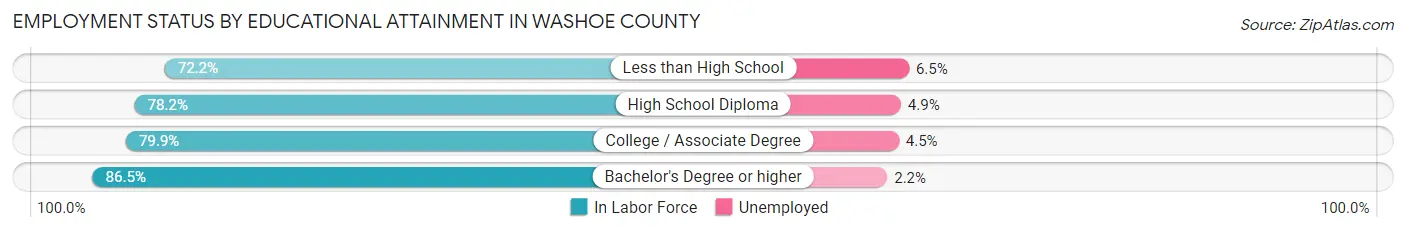
| Educational Attainment | In Labor Force | Unemployed |
| Less than High School | 22,332 (72.2%) | 2,011 (6.5%) |
| High School Diploma | 48,458 (78.2%) | 3,036 (4.9%) |
| College / Associate Degree | 65,313 (79.9%) | 3,678 (4.5%) |
| Bachelor's Degree or higher | 71,317 (86.5%) | 1,814 (2.2%) |
| Total | 207,471 (80.7%) | 10,284 (4.0%) |
Employment Occupations by Sex in Washoe County
Management, Business, Science and Arts Occupations
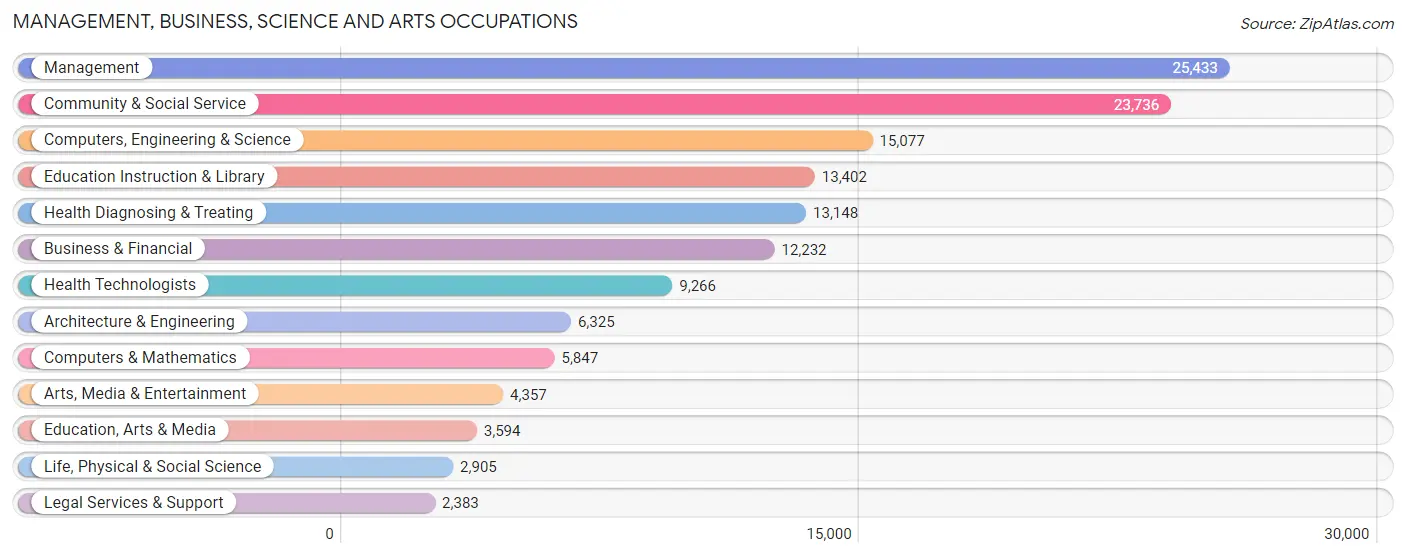
The most common Management, Business, Science and Arts occupations in Washoe County are Management (25,433 | 10.2%), Community & Social Service (23,736 | 9.6%), Computers, Engineering & Science (15,077 | 6.1%), Education Instruction & Library (13,402 | 5.4%), and Health Diagnosing & Treating (13,148 | 5.3%).
Management, Business, Science and Arts Occupations by Sex
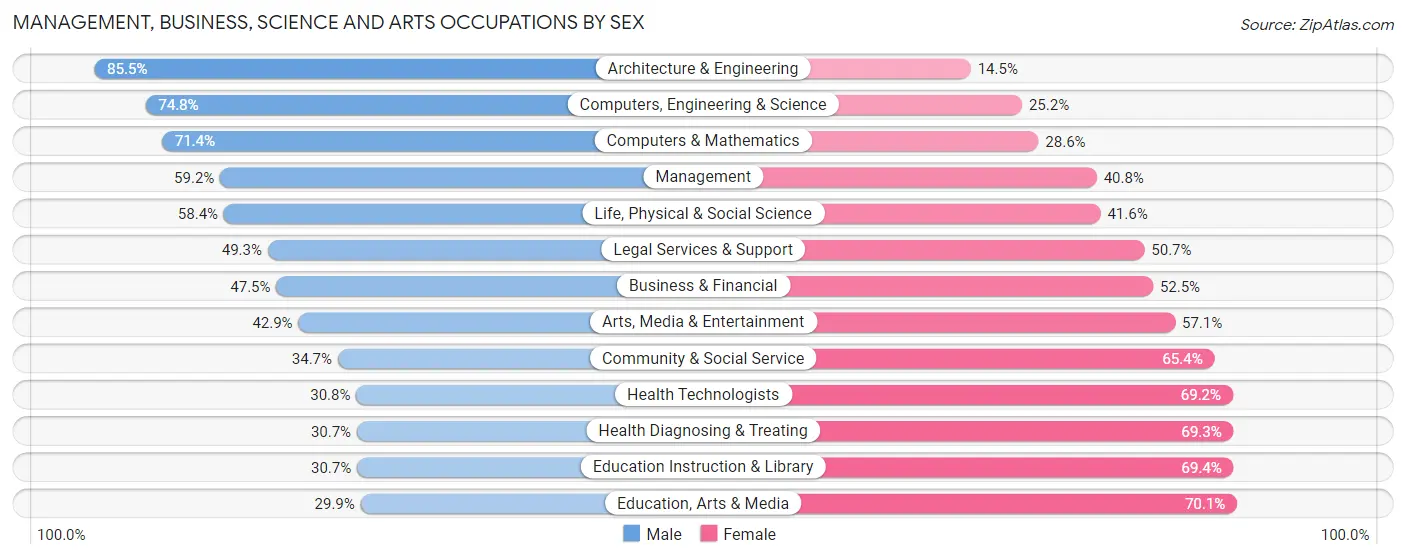
Within the Management, Business, Science and Arts occupations in Washoe County, the most male-oriented occupations are Architecture & Engineering (85.5%), Computers, Engineering & Science (74.8%), and Computers & Mathematics (71.4%), while the most female-oriented occupations are Education, Arts & Media (70.1%), Education Instruction & Library (69.4%), and Health Diagnosing & Treating (69.3%).
| Occupation | Male | Female |
| Management | 15,058 (59.2%) | 10,375 (40.8%) |
| Business & Financial | 5,808 (47.5%) | 6,424 (52.5%) |
| Computers, Engineering & Science | 11,277 (74.8%) | 3,800 (25.2%) |
| Computers & Mathematics | 4,173 (71.4%) | 1,674 (28.6%) |
| Architecture & Engineering | 5,407 (85.5%) | 918 (14.5%) |
| Life, Physical & Social Science | 1,697 (58.4%) | 1,208 (41.6%) |
| Community & Social Service | 8,225 (34.6%) | 15,511 (65.3%) |
| Education, Arts & Media | 1,075 (29.9%) | 2,519 (70.1%) |
| Legal Services & Support | 1,174 (49.3%) | 1,209 (50.7%) |
| Education Instruction & Library | 4,108 (30.6%) | 9,294 (69.4%) |
| Arts, Media & Entertainment | 1,868 (42.9%) | 2,489 (57.1%) |
| Health Diagnosing & Treating | 4,032 (30.7%) | 9,116 (69.3%) |
| Health Technologists | 2,855 (30.8%) | 6,411 (69.2%) |
| Total (Category) | 44,400 (49.5%) | 45,226 (50.5%) |
| Total (Overall) | 134,212 (54.1%) | 113,981 (45.9%) |
Services Occupations
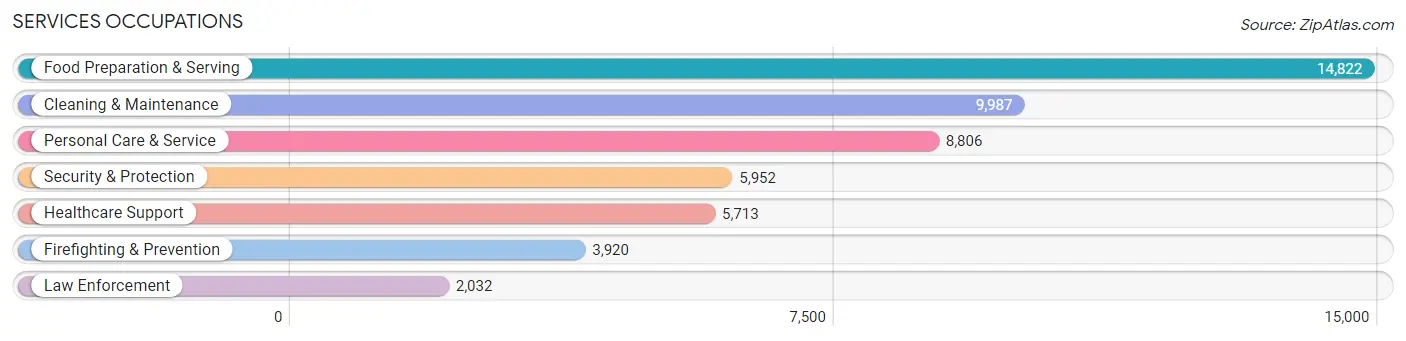
The most common Services occupations in Washoe County are Food Preparation & Serving (14,822 | 6.0%), Cleaning & Maintenance (9,987 | 4.0%), Personal Care & Service (8,806 | 3.5%), Security & Protection (5,952 | 2.4%), and Healthcare Support (5,713 | 2.3%).
Services Occupations by Sex
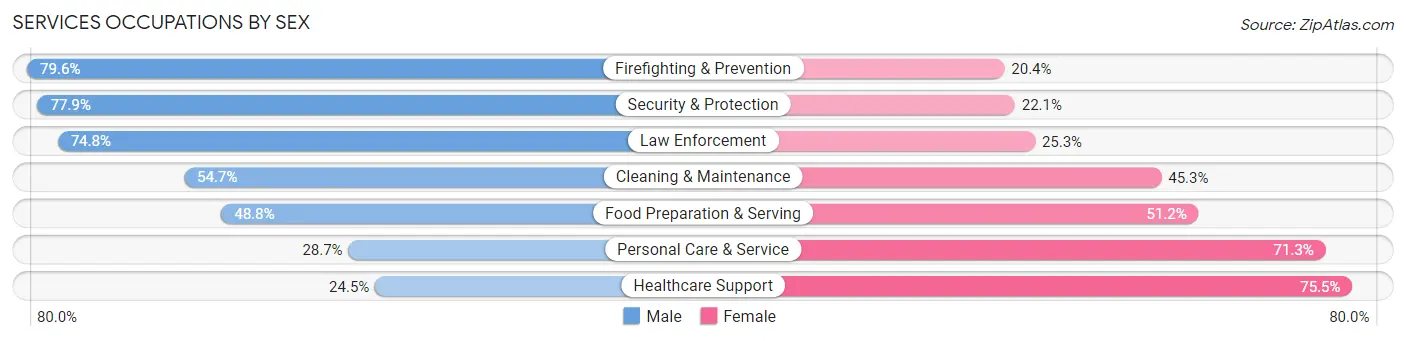
Within the Services occupations in Washoe County, the most male-oriented occupations are Firefighting & Prevention (79.6%), Security & Protection (77.9%), and Law Enforcement (74.8%), while the most female-oriented occupations are Healthcare Support (75.5%), Personal Care & Service (71.3%), and Food Preparation & Serving (51.2%).
| Occupation | Male | Female |
| Healthcare Support | 1,398 (24.5%) | 4,315 (75.5%) |
| Security & Protection | 4,639 (77.9%) | 1,313 (22.1%) |
| Firefighting & Prevention | 3,120 (79.6%) | 800 (20.4%) |
| Law Enforcement | 1,519 (74.8%) | 513 (25.3%) |
| Food Preparation & Serving | 7,237 (48.8%) | 7,585 (51.2%) |
| Cleaning & Maintenance | 5,467 (54.7%) | 4,520 (45.3%) |
| Personal Care & Service | 2,527 (28.7%) | 6,279 (71.3%) |
| Total (Category) | 21,268 (47.0%) | 24,012 (53.0%) |
| Total (Overall) | 134,212 (54.1%) | 113,981 (45.9%) |
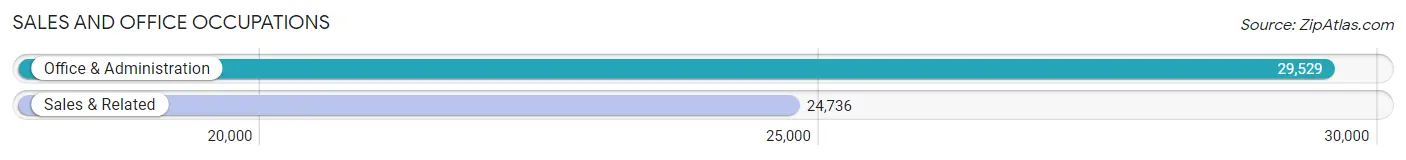
Sales and Office Occupations
The most common Sales and Office occupations in Washoe County are Office & Administration (29,529 | 11.9%), and Sales & Related (24,736 | 10.0%).
Sales and Office Occupations by Sex
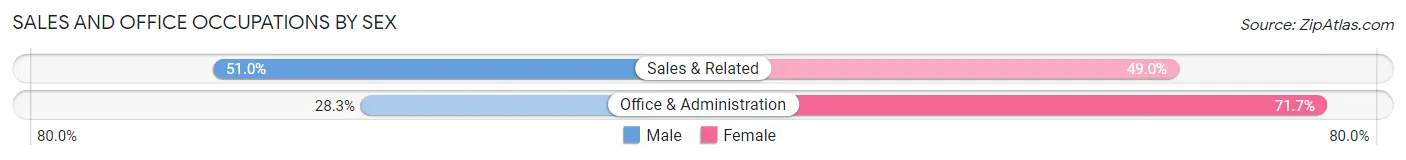
| Occupation | Male | Female |
| Sales & Related | 12,620 (51.0%) | 12,116 (49.0%) |
| Office & Administration | 8,349 (28.3%) | 21,180 (71.7%) |
| Total (Category) | 20,969 (38.6%) | 33,296 (61.4%) |
| Total (Overall) | 134,212 (54.1%) | 113,981 (45.9%) |
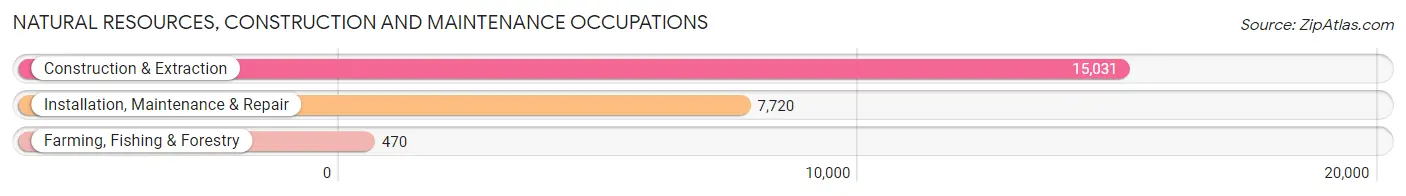
Natural Resources, Construction and Maintenance Occupations
The most common Natural Resources, Construction and Maintenance occupations in Washoe County are Construction & Extraction (15,031 | 6.1%), Installation, Maintenance & Repair (7,720 | 3.1%), and Farming, Fishing & Forestry (470 | 0.2%).
Natural Resources, Construction and Maintenance Occupations by Sex
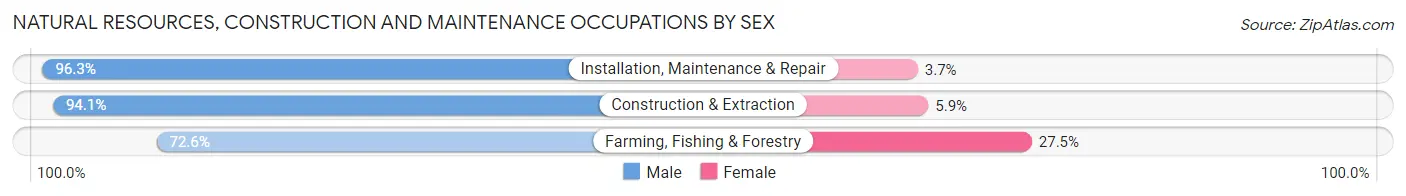
| Occupation | Male | Female |
| Farming, Fishing & Forestry | 341 (72.6%) | 129 (27.5%) |
| Construction & Extraction | 14,143 (94.1%) | 888 (5.9%) |
| Installation, Maintenance & Repair | 7,432 (96.3%) | 288 (3.7%) |
| Total (Category) | 21,916 (94.4%) | 1,305 (5.6%) |
| Total (Overall) | 134,212 (54.1%) | 113,981 (45.9%) |
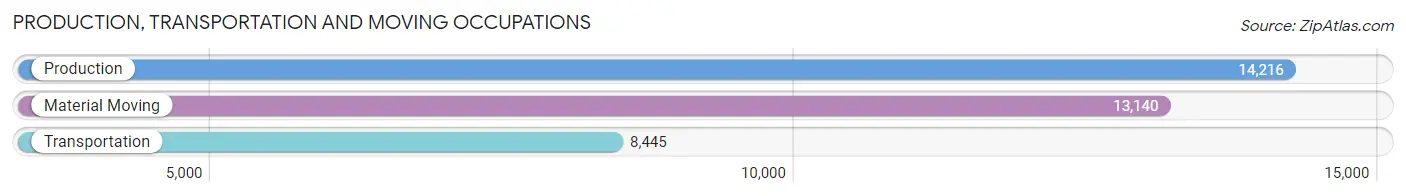
Production, Transportation and Moving Occupations
The most common Production, Transportation and Moving occupations in Washoe County are Production (14,216 | 5.7%), Material Moving (13,140 | 5.3%), and Transportation (8,445 | 3.4%).
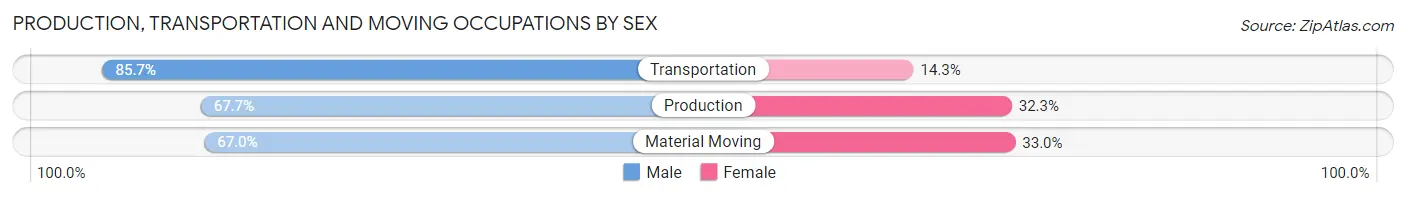
Production, Transportation and Moving Occupations by Sex
| Occupation | Male | Female |
| Production | 9,618 (67.7%) | 4,598 (32.3%) |
| Transportation | 7,236 (85.7%) | 1,209 (14.3%) |
| Material Moving | 8,805 (67.0%) | 4,335 (33.0%) |
| Total (Category) | 25,659 (71.7%) | 10,142 (28.3%) |
| Total (Overall) | 134,212 (54.1%) | 113,981 (45.9%) |
Employment Industries by Sex in Washoe County
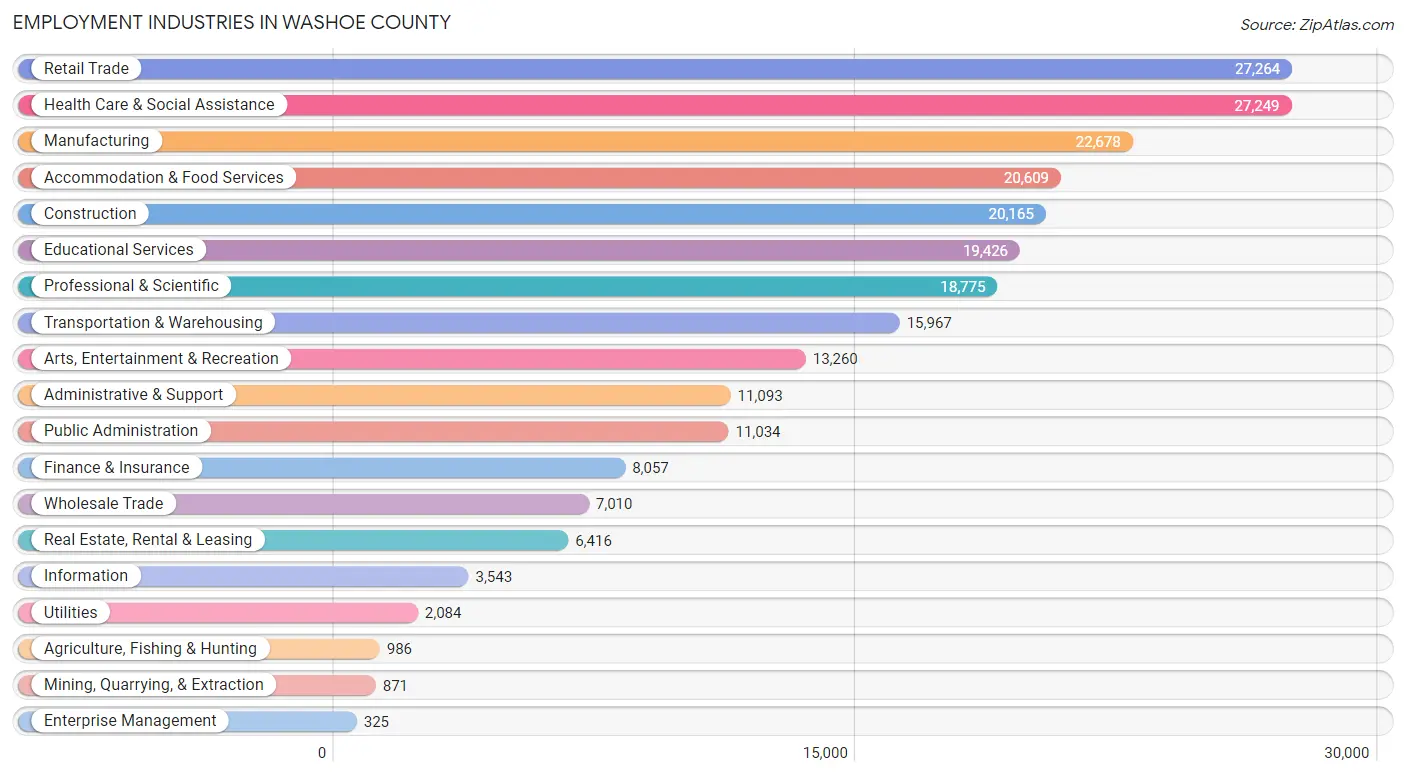
Employment Industries in Washoe County
The major employment industries in Washoe County include Retail Trade (27,264 | 11.0%), Health Care & Social Assistance (27,249 | 11.0%), Manufacturing (22,678 | 9.1%), Accommodation & Food Services (20,609 | 8.3%), and Construction (20,165 | 8.1%).
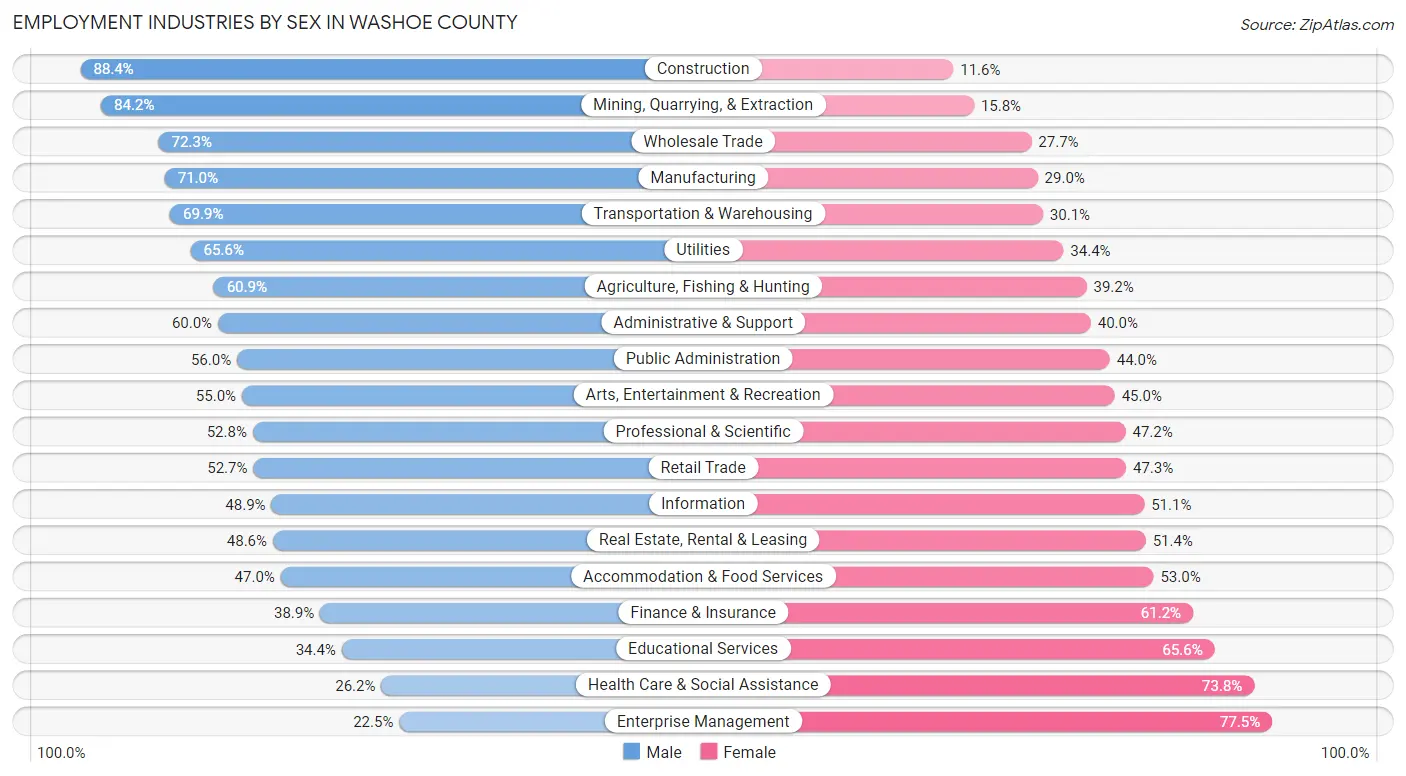
Employment Industries by Sex in Washoe County
The Washoe County industries that see more men than women are Construction (88.4%), Mining, Quarrying, & Extraction (84.2%), and Wholesale Trade (72.3%), whereas the industries that tend to have a higher number of women are Enterprise Management (77.5%), Health Care & Social Assistance (73.8%), and Educational Services (65.6%).
| Industry | Male | Female |
| Agriculture, Fishing & Hunting | 600 (60.9%) | 386 (39.2%) |
| Mining, Quarrying, & Extraction | 733 (84.2%) | 138 (15.8%) |
| Construction | 17,831 (88.4%) | 2,334 (11.6%) |
| Manufacturing | 16,095 (71.0%) | 6,583 (29.0%) |
| Wholesale Trade | 5,066 (72.3%) | 1,944 (27.7%) |
| Retail Trade | 14,361 (52.7%) | 12,903 (47.3%) |
| Transportation & Warehousing | 11,160 (69.9%) | 4,807 (30.1%) |
| Utilities | 1,368 (65.6%) | 716 (34.4%) |
| Information | 1,733 (48.9%) | 1,810 (51.1%) |
| Finance & Insurance | 3,130 (38.9%) | 4,927 (61.2%) |
| Real Estate, Rental & Leasing | 3,119 (48.6%) | 3,297 (51.4%) |
| Professional & Scientific | 9,909 (52.8%) | 8,866 (47.2%) |
| Enterprise Management | 73 (22.5%) | 252 (77.5%) |
| Administrative & Support | 6,654 (60.0%) | 4,439 (40.0%) |
| Educational Services | 6,676 (34.4%) | 12,750 (65.6%) |
| Health Care & Social Assistance | 7,132 (26.2%) | 20,117 (73.8%) |
| Arts, Entertainment & Recreation | 7,296 (55.0%) | 5,964 (45.0%) |
| Accommodation & Food Services | 9,686 (47.0%) | 10,923 (53.0%) |
| Public Administration | 6,183 (56.0%) | 4,851 (44.0%) |
| Total | 134,212 (54.1%) | 113,981 (45.9%) |
Education in Washoe County
School Enrollment in Washoe County
The most common levels of schooling among the 113,979 students in Washoe County are college / undergraduate (27,358 | 24.0%), middle school (23,893 | 21.0%), and high school (23,653 | 20.7%).
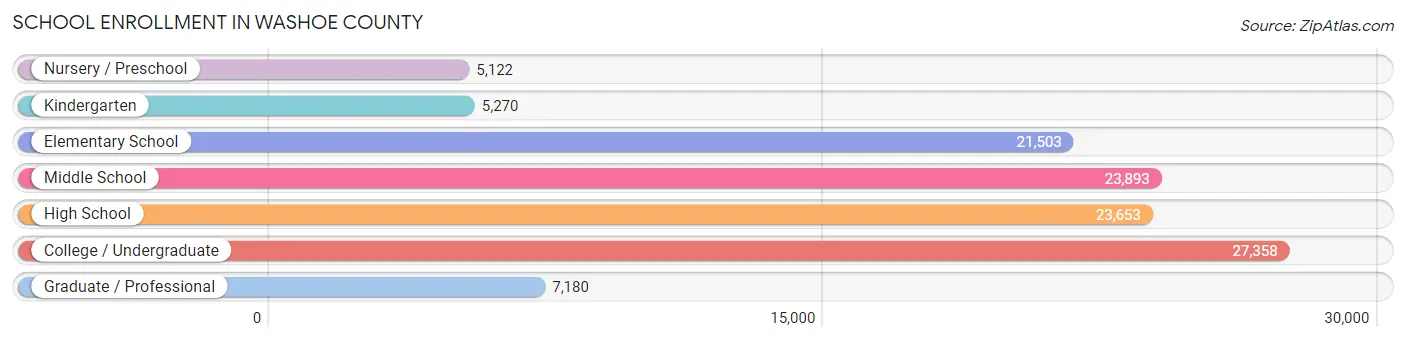
| School Level | # Students | % Students |
| Nursery / Preschool | 5,122 | 4.5% |
| Kindergarten | 5,270 | 4.6% |
| Elementary School | 21,503 | 18.9% |
| Middle School | 23,893 | 21.0% |
| High School | 23,653 | 20.7% |
| College / Undergraduate | 27,358 | 24.0% |
| Graduate / Professional | 7,180 | 6.3% |
| Total | 113,979 | 100.0% |
School Enrollment by Age by Funding Source in Washoe County
Out of a total of 113,979 students who are enrolled in schools in Washoe County, 14,475 (12.7%) attend a private institution, while the remaining 99,504 (87.3%) are enrolled in public schools. The age group of 3 to 4 year olds has the highest likelihood of being enrolled in private schools, with 2,026 (46.2% in the age bracket) enrolled. Conversely, the age group of 15 to 17 year olds has the lowest likelihood of being enrolled in a private school, with 15,587 (92.3% in the age bracket) attending a public institution.
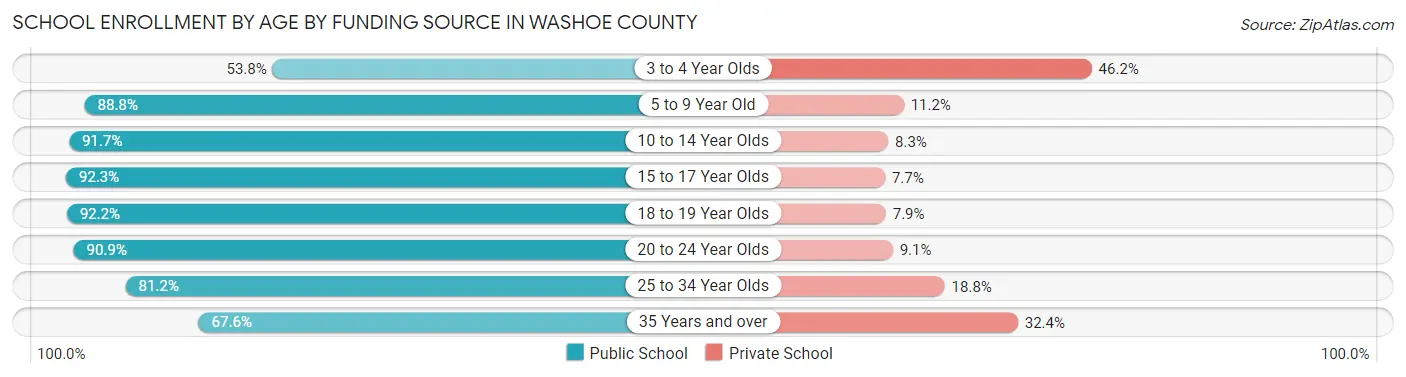
| Age Bracket | Public School | Private School |
| 3 to 4 Year Olds | 2,360 (53.8%) | 2,026 (46.2%) |
| 5 to 9 Year Old | 22,711 (88.8%) | 2,860 (11.2%) |
| 10 to 14 Year Olds | 26,937 (91.7%) | 2,430 (8.3%) |
| 15 to 17 Year Olds | 15,587 (92.3%) | 1,298 (7.7%) |
| 18 to 19 Year Olds | 7,991 (92.1%) | 681 (7.9%) |
| 20 to 24 Year Olds | 11,713 (90.9%) | 1,177 (9.1%) |
| 25 to 34 Year Olds | 7,284 (81.2%) | 1,687 (18.8%) |
| 35 Years and over | 4,890 (67.6%) | 2,347 (32.4%) |
| Total | 99,504 (87.3%) | 14,475 (12.7%) |
Educational Attainment by Field of Study in Washoe County
Business (21,335 | 18.0%), education (12,550 | 10.6%), science & technology (11,761 | 10.0%), engineering (10,390 | 8.8%), and bio, nature & agricultural (10,114 | 8.6%) are the most common fields of study among 118,255 individuals in Washoe County who have obtained a bachelor's degree or higher.
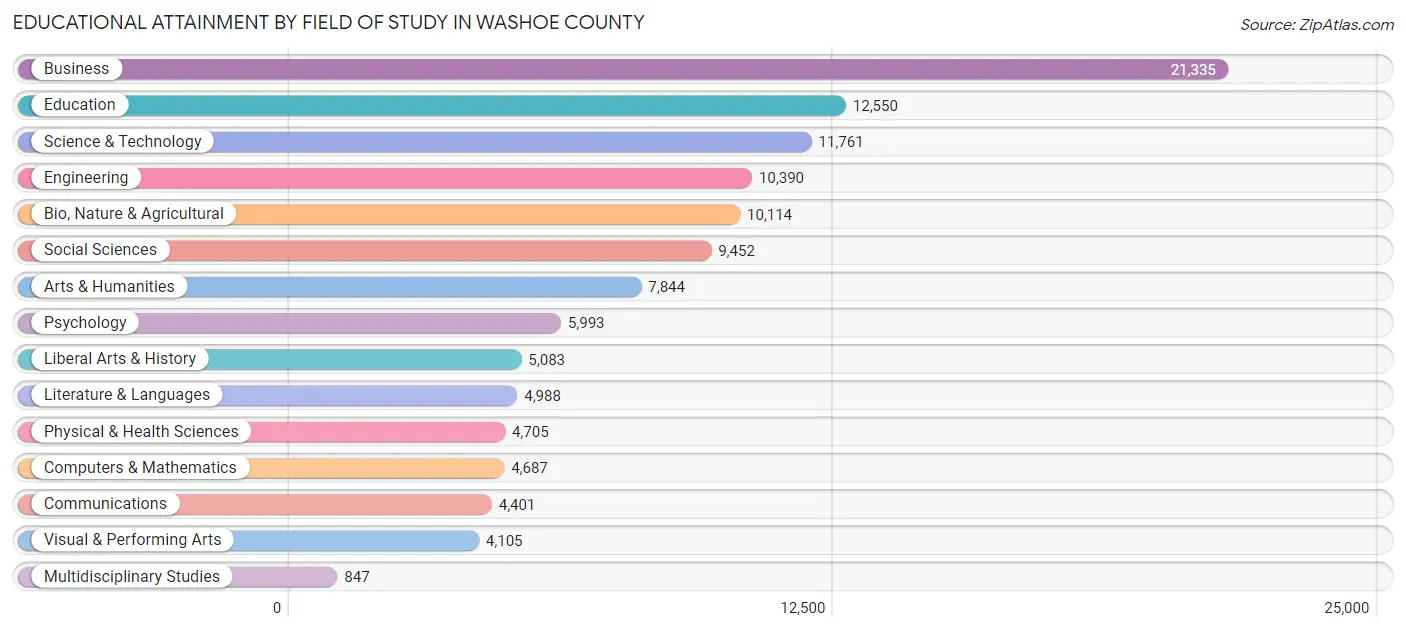
| Field of Study | # Graduates | % Graduates |
| Computers & Mathematics | 4,687 | 4.0% |
| Bio, Nature & Agricultural | 10,114 | 8.6% |
| Physical & Health Sciences | 4,705 | 4.0% |
| Psychology | 5,993 | 5.1% |
| Social Sciences | 9,452 | 8.0% |
| Engineering | 10,390 | 8.8% |
| Multidisciplinary Studies | 847 | 0.7% |
| Science & Technology | 11,761 | 10.0% |
| Business | 21,335 | 18.0% |
| Education | 12,550 | 10.6% |
| Literature & Languages | 4,988 | 4.2% |
| Liberal Arts & History | 5,083 | 4.3% |
| Visual & Performing Arts | 4,105 | 3.5% |
| Communications | 4,401 | 3.7% |
| Arts & Humanities | 7,844 | 6.6% |
| Total | 118,255 | 100.0% |
Transportation & Commute in Washoe County
Vehicle Availability by Sex in Washoe County
The most prevalent vehicle ownership categories in Washoe County are males with 2 vehicles (52,167, accounting for 39.5%) and females with 2 vehicles (43,222, making up 47.0%).
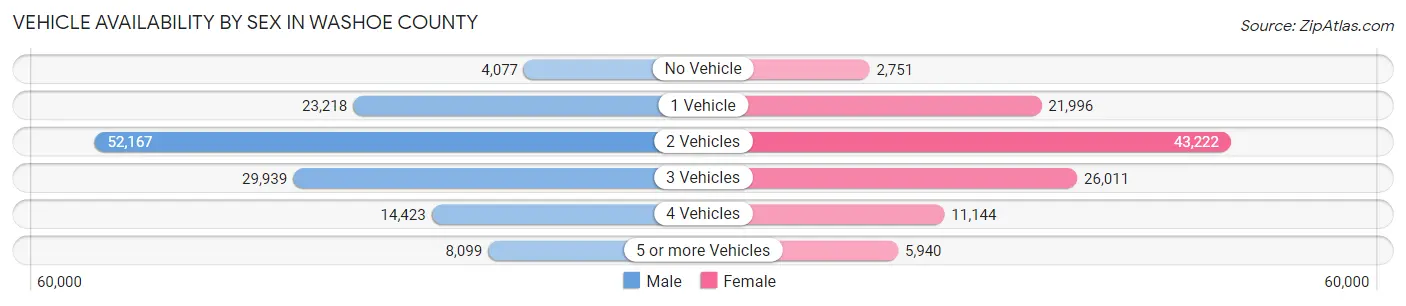
| Vehicles Available | Male | Female |
| No Vehicle | 4,077 (3.1%) | 2,751 (2.5%) |
| 1 Vehicle | 23,218 (17.6%) | 21,996 (19.8%) |
| 2 Vehicles | 52,167 (39.5%) | 43,222 (38.9%) |
| 3 Vehicles | 29,939 (22.7%) | 26,011 (23.4%) |
| 4 Vehicles | 14,423 (10.9%) | 11,144 (10.0%) |
| 5 or more Vehicles | 8,099 (6.1%) | 5,940 (5.3%) |
| Total | 131,923 (100.0%) | 111,064 (100.0%) |
Commute Time in Washoe County
The most frequently occuring commute durations in Washoe County are 15 to 19 minutes (44,918 commuters, 20.3%), 20 to 24 minutes (38,710 commuters, 17.5%), and 10 to 14 minutes (33,579 commuters, 15.2%).
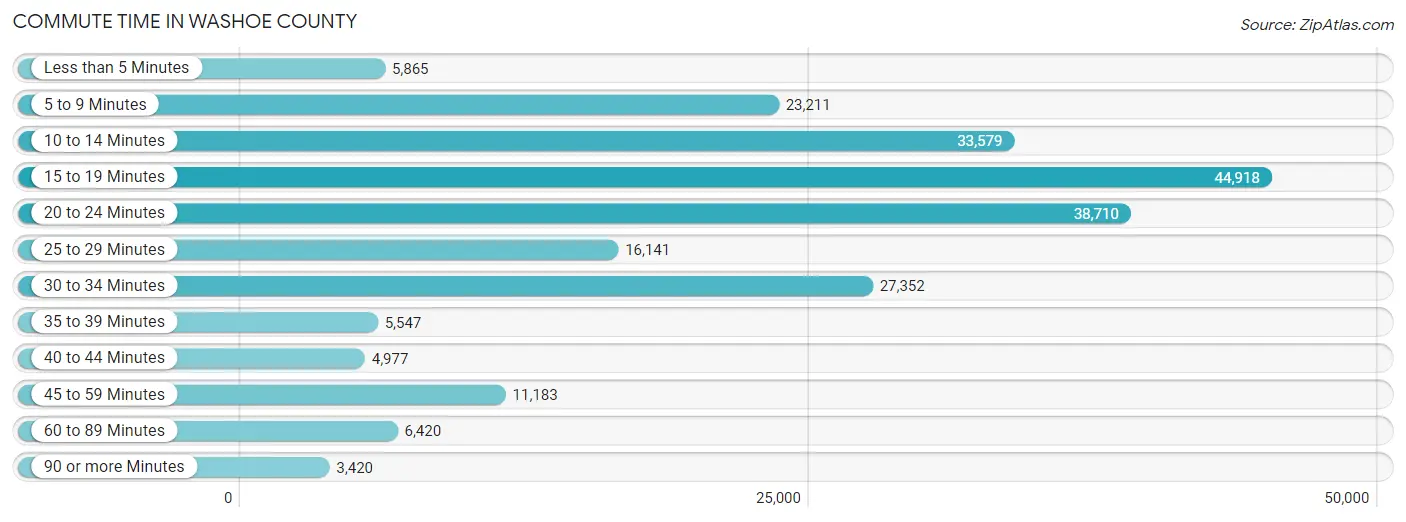
| Commute Time | # Commuters | % Commuters |
| Less than 5 Minutes | 5,865 | 2.6% |
| 5 to 9 Minutes | 23,211 | 10.5% |
| 10 to 14 Minutes | 33,579 | 15.2% |
| 15 to 19 Minutes | 44,918 | 20.3% |
| 20 to 24 Minutes | 38,710 | 17.5% |
| 25 to 29 Minutes | 16,141 | 7.3% |
| 30 to 34 Minutes | 27,352 | 12.4% |
| 35 to 39 Minutes | 5,547 | 2.5% |
| 40 to 44 Minutes | 4,977 | 2.2% |
| 45 to 59 Minutes | 11,183 | 5.1% |
| 60 to 89 Minutes | 6,420 | 2.9% |
| 90 or more Minutes | 3,420 | 1.5% |
Commute Time by Sex in Washoe County
The most common commute times in Washoe County are 15 to 19 minutes (24,194 commuters, 20.0%) for males and 15 to 19 minutes (20,724 commuters, 20.6%) for females.
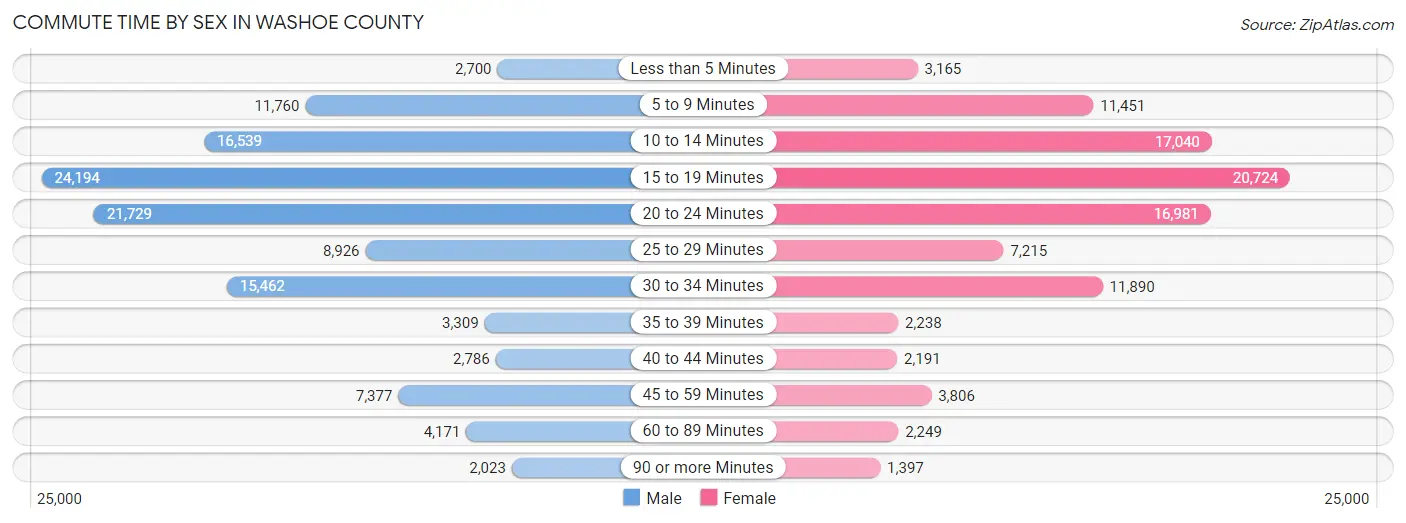
| Commute Time | Male | Female |
| Less than 5 Minutes | 2,700 (2.2%) | 3,165 (3.2%) |
| 5 to 9 Minutes | 11,760 (9.7%) | 11,451 (11.4%) |
| 10 to 14 Minutes | 16,539 (13.7%) | 17,040 (17.0%) |
| 15 to 19 Minutes | 24,194 (20.0%) | 20,724 (20.6%) |
| 20 to 24 Minutes | 21,729 (18.0%) | 16,981 (16.9%) |
| 25 to 29 Minutes | 8,926 (7.4%) | 7,215 (7.2%) |
| 30 to 34 Minutes | 15,462 (12.8%) | 11,890 (11.8%) |
| 35 to 39 Minutes | 3,309 (2.7%) | 2,238 (2.2%) |
| 40 to 44 Minutes | 2,786 (2.3%) | 2,191 (2.2%) |
| 45 to 59 Minutes | 7,377 (6.1%) | 3,806 (3.8%) |
| 60 to 89 Minutes | 4,171 (3.5%) | 2,249 (2.2%) |
| 90 or more Minutes | 2,023 (1.7%) | 1,397 (1.4%) |
Time of Departure to Work by Sex in Washoe County
The most frequent times of departure to work in Washoe County are 7:00 AM to 7:29 AM (14,730, 12.2%) for males and 7:30 AM to 7:59 AM (13,618, 13.6%) for females.
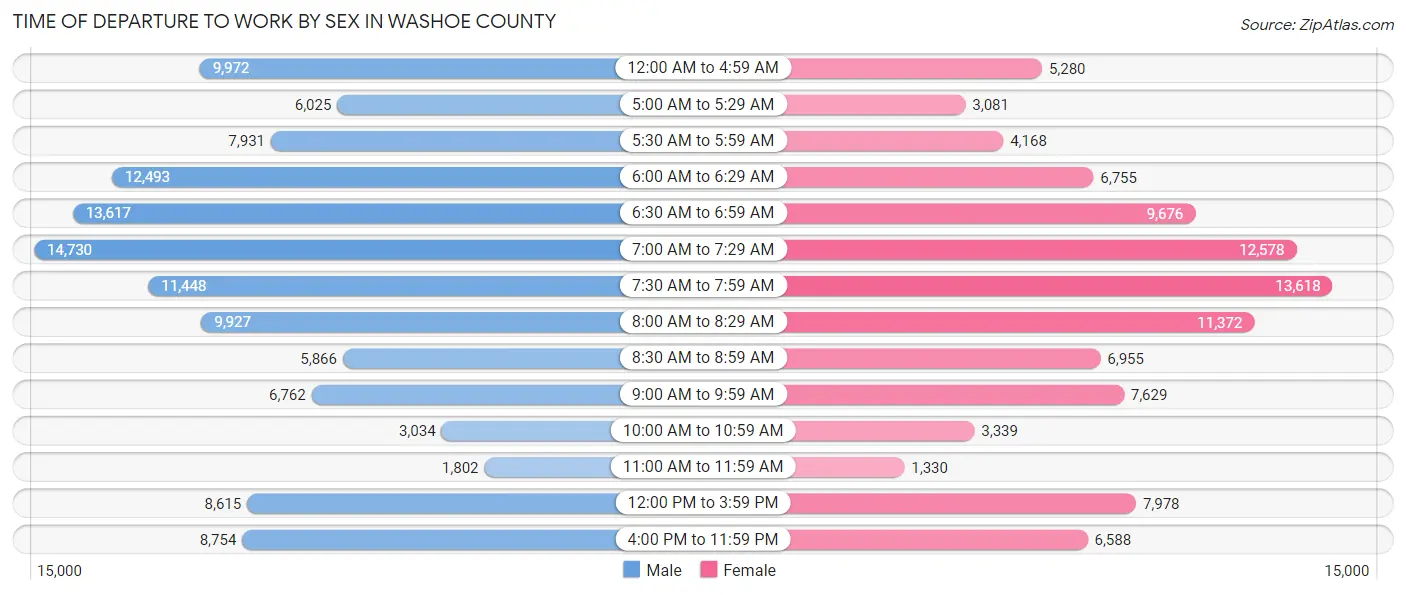
| Time of Departure | Male | Female |
| 12:00 AM to 4:59 AM | 9,972 (8.2%) | 5,280 (5.3%) |
| 5:00 AM to 5:29 AM | 6,025 (5.0%) | 3,081 (3.1%) |
| 5:30 AM to 5:59 AM | 7,931 (6.6%) | 4,168 (4.2%) |
| 6:00 AM to 6:29 AM | 12,493 (10.3%) | 6,755 (6.7%) |
| 6:30 AM to 6:59 AM | 13,617 (11.3%) | 9,676 (9.6%) |
| 7:00 AM to 7:29 AM | 14,730 (12.2%) | 12,578 (12.5%) |
| 7:30 AM to 7:59 AM | 11,448 (9.5%) | 13,618 (13.6%) |
| 8:00 AM to 8:29 AM | 9,927 (8.2%) | 11,372 (11.3%) |
| 8:30 AM to 8:59 AM | 5,866 (4.9%) | 6,955 (6.9%) |
| 9:00 AM to 9:59 AM | 6,762 (5.6%) | 7,629 (7.6%) |
| 10:00 AM to 10:59 AM | 3,034 (2.5%) | 3,339 (3.3%) |
| 11:00 AM to 11:59 AM | 1,802 (1.5%) | 1,330 (1.3%) |
| 12:00 PM to 3:59 PM | 8,615 (7.1%) | 7,978 (8.0%) |
| 4:00 PM to 11:59 PM | 8,754 (7.2%) | 6,588 (6.6%) |
| Total | 120,976 (100.0%) | 100,347 (100.0%) |
Housing Occupancy in Washoe County
Occupancy by Ownership in Washoe County
Of the total 192,420 dwellings in Washoe County, owner-occupied units account for 112,671 (58.6%), while renter-occupied units make up 79,749 (41.4%).
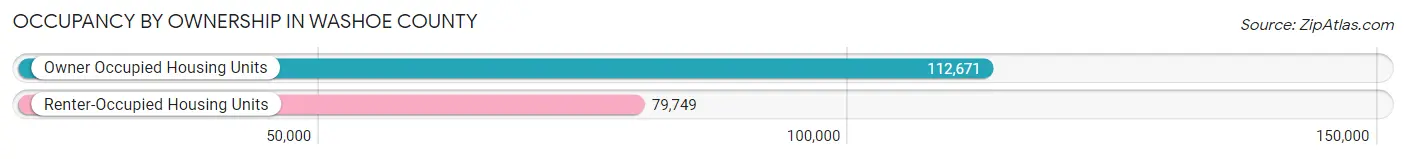
| Occupancy | # Housing Units | % Housing Units |
| Owner Occupied Housing Units | 112,671 | 58.6% |
| Renter-Occupied Housing Units | 79,749 | 41.4% |
| Total Occupied Housing Units | 192,420 | 100.0% |
Occupancy by Household Size in Washoe County
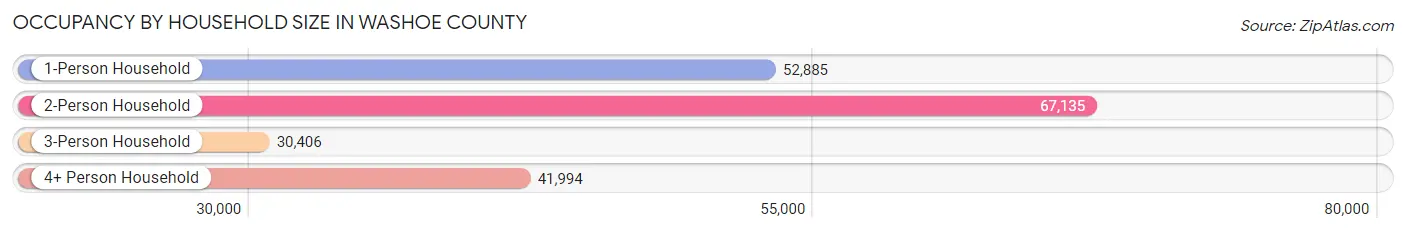
| Household Size | # Housing Units | % Housing Units |
| 1-Person Household | 52,885 | 27.5% |
| 2-Person Household | 67,135 | 34.9% |
| 3-Person Household | 30,406 | 15.8% |
| 4+ Person Household | 41,994 | 21.8% |
| Total Housing Units | 192,420 | 100.0% |
Occupancy by Ownership by Household Size in Washoe County
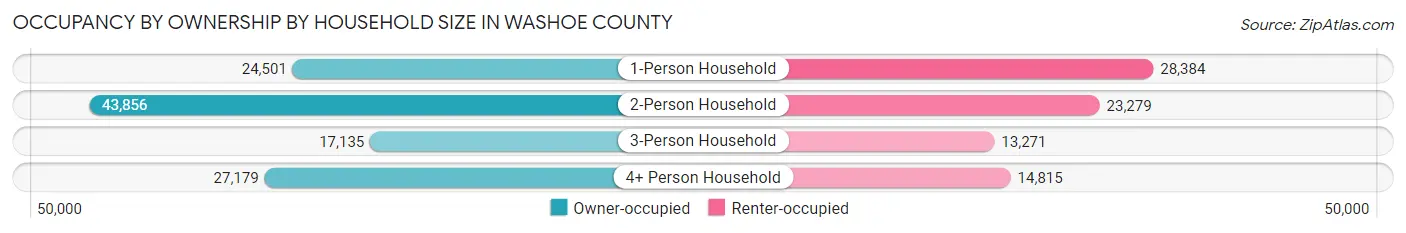
| Household Size | Owner-occupied | Renter-occupied |
| 1-Person Household | 24,501 (46.3%) | 28,384 (53.7%) |
| 2-Person Household | 43,856 (65.3%) | 23,279 (34.7%) |
| 3-Person Household | 17,135 (56.4%) | 13,271 (43.6%) |
| 4+ Person Household | 27,179 (64.7%) | 14,815 (35.3%) |
| Total Housing Units | 112,671 (58.6%) | 79,749 (41.4%) |
Occupancy by Educational Attainment in Washoe County
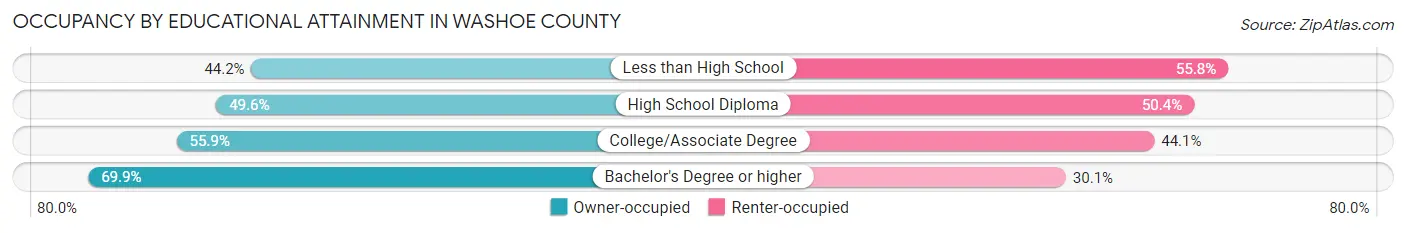
| Household Size | Owner-occupied | Renter-occupied |
| Less than High School | 7,499 (44.2%) | 9,474 (55.8%) |
| High School Diploma | 19,634 (49.6%) | 19,954 (50.4%) |
| College/Associate Degree | 37,641 (55.9%) | 29,703 (44.1%) |
| Bachelor's Degree or higher | 47,897 (69.9%) | 20,618 (30.1%) |
Occupancy by Age of Householder in Washoe County
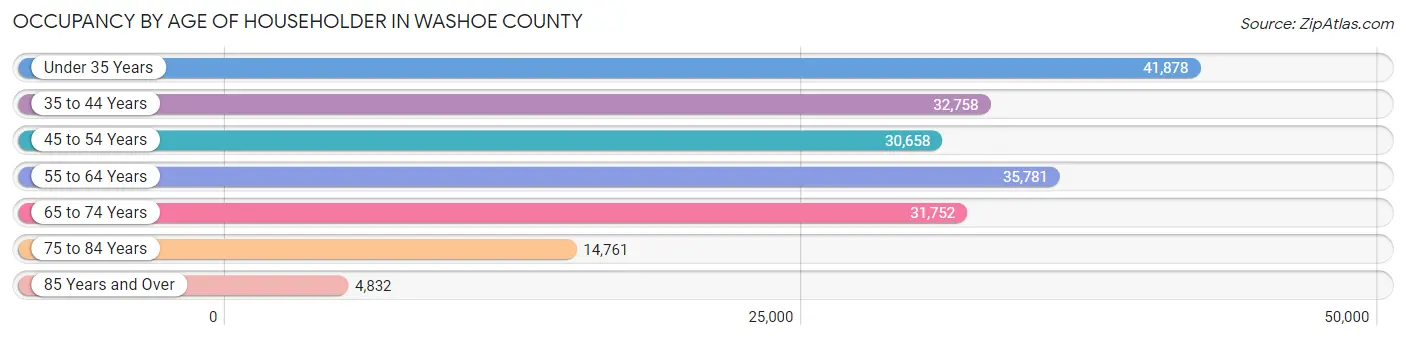
| Age Bracket | # Households | % Households |
| Under 35 Years | 41,878 | 21.8% |
| 35 to 44 Years | 32,758 | 17.0% |
| 45 to 54 Years | 30,658 | 15.9% |
| 55 to 64 Years | 35,781 | 18.6% |
| 65 to 74 Years | 31,752 | 16.5% |
| 75 to 84 Years | 14,761 | 7.7% |
| 85 Years and Over | 4,832 | 2.5% |
| Total | 192,420 | 100.0% |
Housing Finances in Washoe County
Median Income by Occupancy in Washoe County
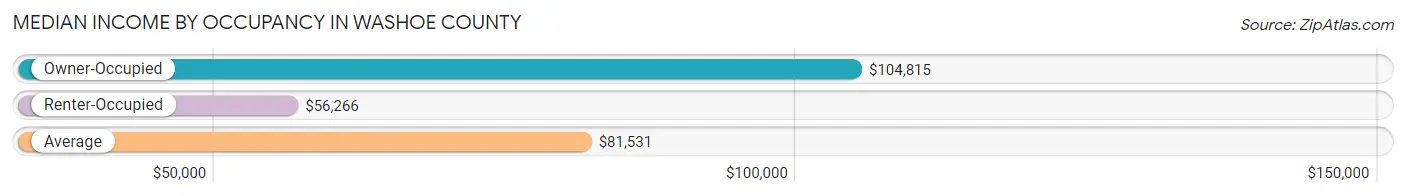
| Occupancy Type | # Households | Median Income |
| Owner-Occupied | 112,671 (58.6%) | $104,815 |
| Renter-Occupied | 79,749 (41.4%) | $56,266 |
| Average | 192,420 (100.0%) | $81,531 |
Occupancy by Householder Income Bracket in Washoe County
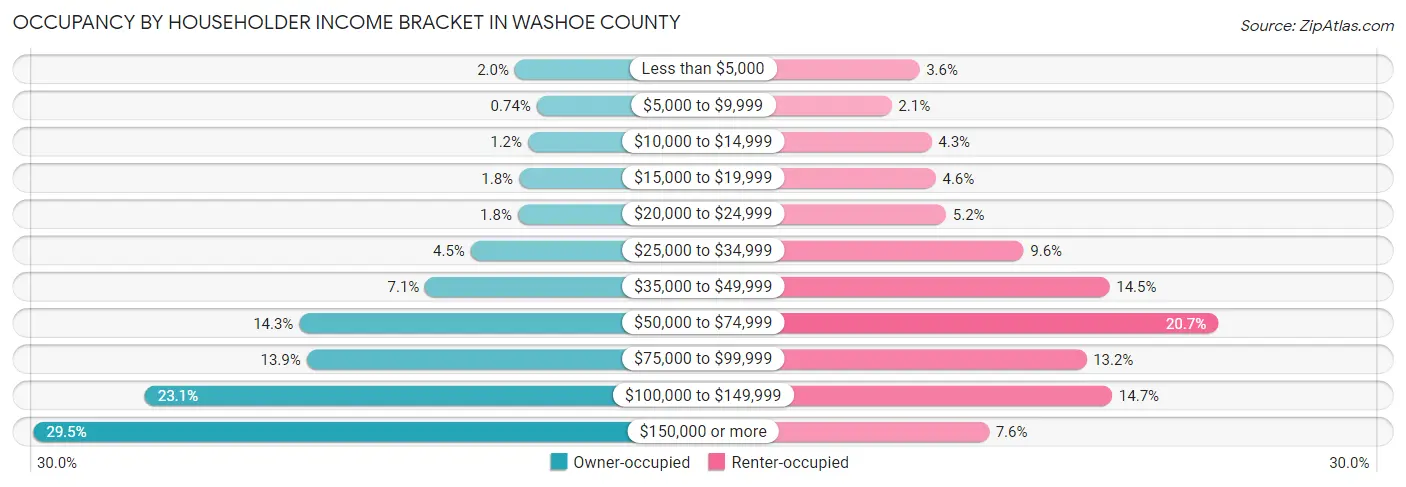
| Income Bracket | Owner-occupied | Renter-occupied |
| Less than $5,000 | 2,239 (2.0%) | 2,904 (3.6%) |
| $5,000 to $9,999 | 831 (0.7%) | 1,637 (2.1%) |
| $10,000 to $14,999 | 1,401 (1.2%) | 3,454 (4.3%) |
| $15,000 to $19,999 | 1,975 (1.8%) | 3,646 (4.6%) |
| $20,000 to $24,999 | 2,049 (1.8%) | 4,118 (5.2%) |
| $25,000 to $34,999 | 5,082 (4.5%) | 7,645 (9.6%) |
| $35,000 to $49,999 | 8,014 (7.1%) | 11,565 (14.5%) |
| $50,000 to $74,999 | 16,126 (14.3%) | 16,516 (20.7%) |
| $75,000 to $99,999 | 15,654 (13.9%) | 10,511 (13.2%) |
| $100,000 to $149,999 | 26,058 (23.1%) | 11,686 (14.6%) |
| $150,000 or more | 33,242 (29.5%) | 6,067 (7.6%) |
| Total | 112,671 (100.0%) | 79,749 (100.0%) |
Monthly Housing Cost Tiers in Washoe County
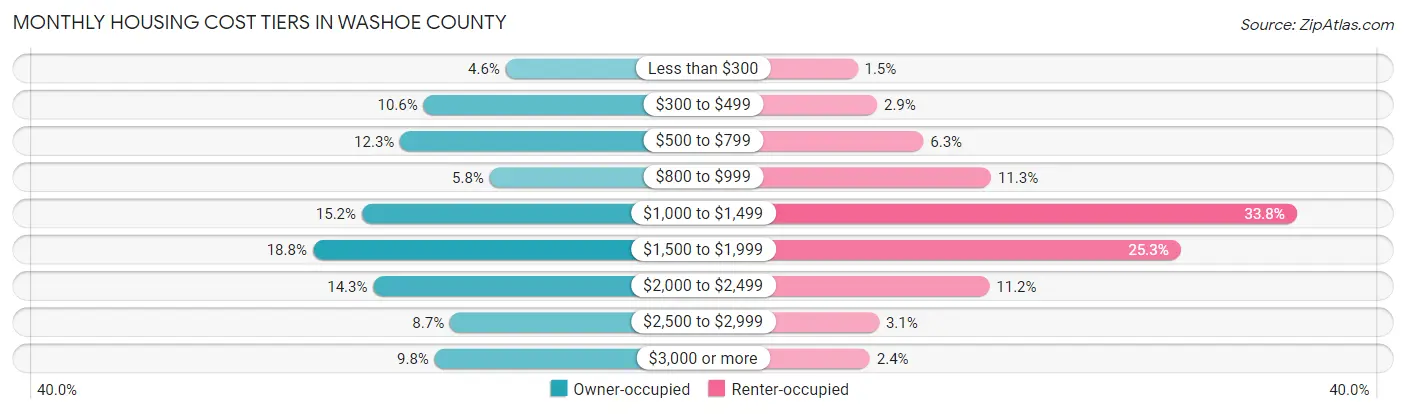
| Monthly Cost | Owner-occupied | Renter-occupied |
| Less than $300 | 5,149 (4.6%) | 1,179 (1.5%) |
| $300 to $499 | 11,963 (10.6%) | 2,327 (2.9%) |
| $500 to $799 | 13,906 (12.3%) | 5,048 (6.3%) |
| $800 to $999 | 6,473 (5.8%) | 9,018 (11.3%) |
| $1,000 to $1,499 | 17,080 (15.2%) | 26,962 (33.8%) |
| $1,500 to $1,999 | 21,159 (18.8%) | 20,154 (25.3%) |
| $2,000 to $2,499 | 16,132 (14.3%) | 8,926 (11.2%) |
| $2,500 to $2,999 | 9,764 (8.7%) | 2,442 (3.1%) |
| $3,000 or more | 11,045 (9.8%) | 1,909 (2.4%) |
| Total | 112,671 (100.0%) | 79,749 (100.0%) |
Physical Housing Characteristics in Washoe County
Housing Structures in Washoe County
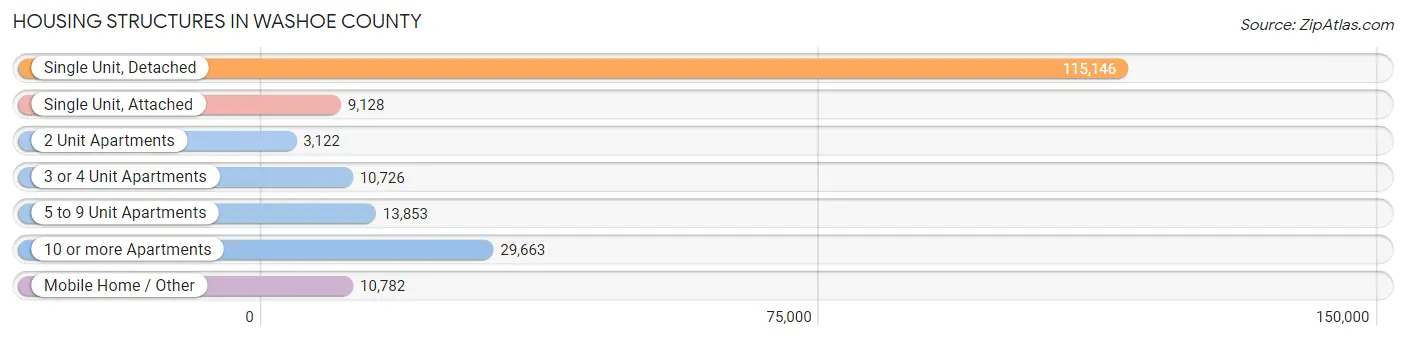
| Structure Type | # Housing Units | % Housing Units |
| Single Unit, Detached | 115,146 | 59.8% |
| Single Unit, Attached | 9,128 | 4.7% |
| 2 Unit Apartments | 3,122 | 1.6% |
| 3 or 4 Unit Apartments | 10,726 | 5.6% |
| 5 to 9 Unit Apartments | 13,853 | 7.2% |
| 10 or more Apartments | 29,663 | 15.4% |
| Mobile Home / Other | 10,782 | 5.6% |
| Total | 192,420 | 100.0% |
Housing Structures by Occupancy in Washoe County
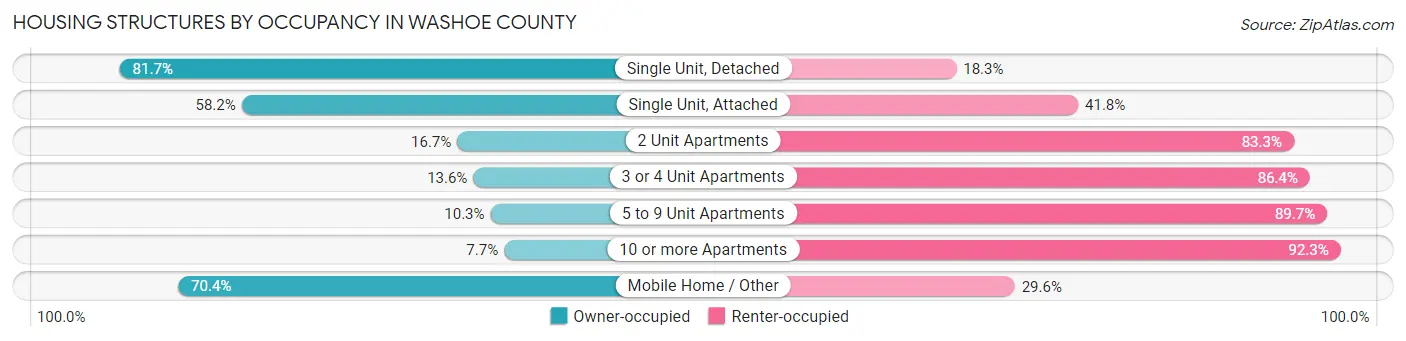
| Structure Type | Owner-occupied | Renter-occupied |
| Single Unit, Detached | 94,063 (81.7%) | 21,083 (18.3%) |
| Single Unit, Attached | 5,315 (58.2%) | 3,813 (41.8%) |
| 2 Unit Apartments | 522 (16.7%) | 2,600 (83.3%) |
| 3 or 4 Unit Apartments | 1,462 (13.6%) | 9,264 (86.4%) |
| 5 to 9 Unit Apartments | 1,430 (10.3%) | 12,423 (89.7%) |
| 10 or more Apartments | 2,285 (7.7%) | 27,378 (92.3%) |
| Mobile Home / Other | 7,594 (70.4%) | 3,188 (29.6%) |
| Total | 112,671 (58.6%) | 79,749 (41.4%) |
Housing Structures by Number of Rooms in Washoe County
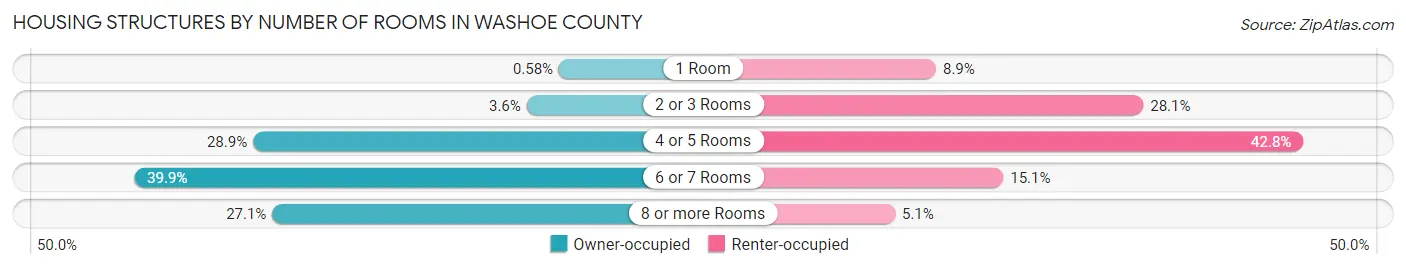
| Number of Rooms | Owner-occupied | Renter-occupied |
| 1 Room | 656 (0.6%) | 7,091 (8.9%) |
| 2 or 3 Rooms | 4,018 (3.6%) | 22,381 (28.1%) |
| 4 or 5 Rooms | 32,543 (28.9%) | 34,163 (42.8%) |
| 6 or 7 Rooms | 44,919 (39.9%) | 12,054 (15.1%) |
| 8 or more Rooms | 30,535 (27.1%) | 4,060 (5.1%) |
| Total | 112,671 (100.0%) | 79,749 (100.0%) |
Housing Structure by Heating Type in Washoe County
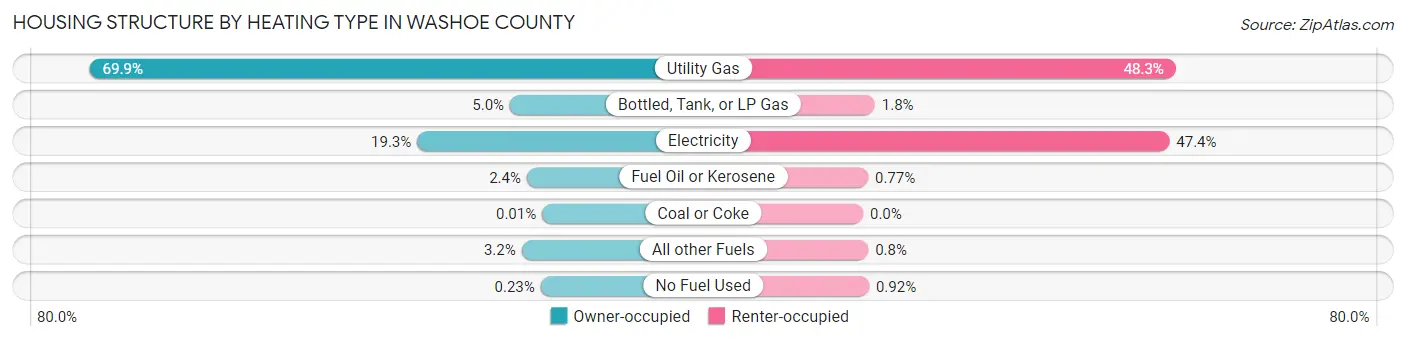
| Heating Type | Owner-occupied | Renter-occupied |
| Utility Gas | 78,799 (69.9%) | 38,546 (48.3%) |
| Bottled, Tank, or LP Gas | 5,599 (5.0%) | 1,454 (1.8%) |
| Electricity | 21,765 (19.3%) | 37,759 (47.3%) |
| Fuel Oil or Kerosene | 2,661 (2.4%) | 615 (0.8%) |
| Coal or Coke | 13 (0.0%) | 0 (0.0%) |
| All other Fuels | 3,579 (3.2%) | 641 (0.8%) |
| No Fuel Used | 255 (0.2%) | 734 (0.9%) |
| Total | 112,671 (100.0%) | 79,749 (100.0%) |
Household Vehicle Usage in Washoe County
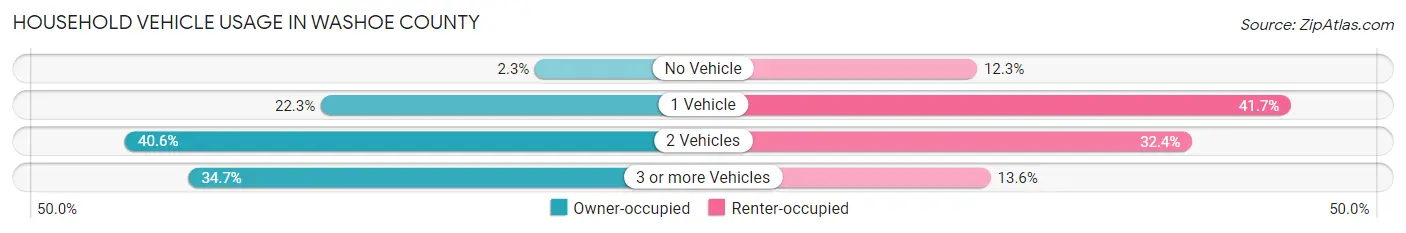
| Vehicles per Household | Owner-occupied | Renter-occupied |
| No Vehicle | 2,638 (2.3%) | 9,834 (12.3%) |
| 1 Vehicle | 25,163 (22.3%) | 33,217 (41.6%) |
| 2 Vehicles | 45,772 (40.6%) | 25,855 (32.4%) |
| 3 or more Vehicles | 39,098 (34.7%) | 10,843 (13.6%) |
| Total | 112,671 (100.0%) | 79,749 (100.0%) |
Real Estate & Mortgages in Washoe County
Real Estate and Mortgage Overview in Washoe County
| Characteristic | Without Mortgage | With Mortgage |
| Housing Units | 37,472 | 75,199 |
| Median Property Value | $441,200 | $467,000 |
| Median Household Income | $81,919 | $25,039 |
| Monthly Housing Costs | $543 | $10,814 |
| Real Estate Taxes | $2,091 | $2,008 |
Property Value by Mortgage Status in Washoe County
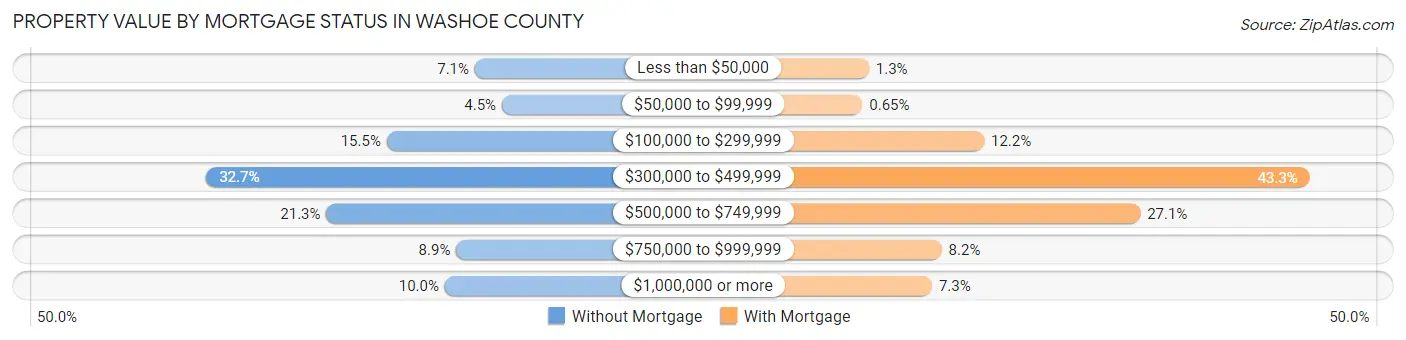
| Property Value | Without Mortgage | With Mortgage |
| Less than $50,000 | 2,667 (7.1%) | 958 (1.3%) |
| $50,000 to $99,999 | 1,703 (4.5%) | 490 (0.6%) |
| $100,000 to $299,999 | 5,812 (15.5%) | 9,202 (12.2%) |
| $300,000 to $499,999 | 12,253 (32.7%) | 32,521 (43.2%) |
| $500,000 to $749,999 | 7,965 (21.3%) | 20,385 (27.1%) |
| $750,000 to $999,999 | 3,331 (8.9%) | 6,165 (8.2%) |
| $1,000,000 or more | 3,741 (10.0%) | 5,478 (7.3%) |
| Total | 37,472 (100.0%) | 75,199 (100.0%) |
Household Income by Mortgage Status in Washoe County
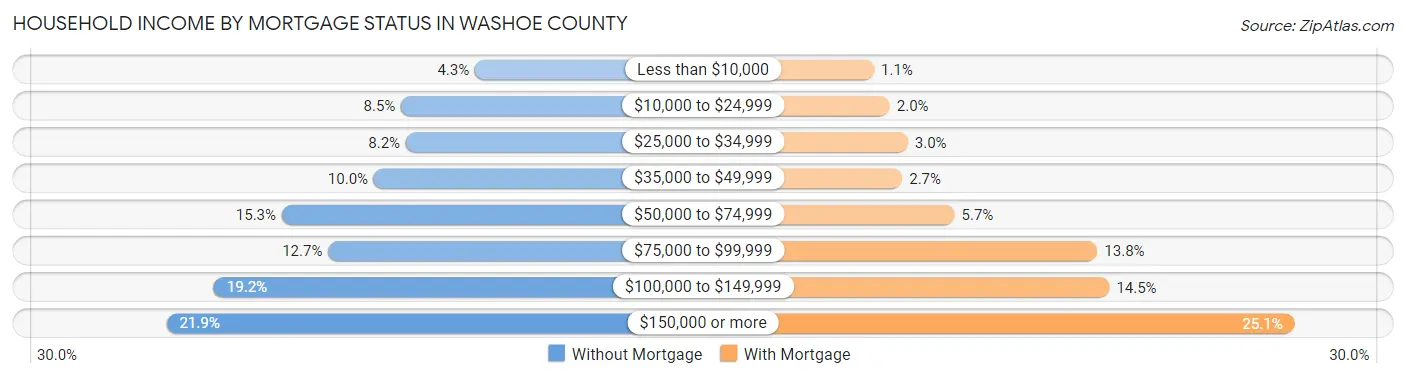
| Household Income | Without Mortgage | With Mortgage |
| Less than $10,000 | 1,598 (4.3%) | 795 (1.1%) |
| $10,000 to $24,999 | 3,176 (8.5%) | 1,472 (2.0%) |
| $25,000 to $34,999 | 3,075 (8.2%) | 2,249 (3.0%) |
| $35,000 to $49,999 | 3,761 (10.0%) | 2,007 (2.7%) |
| $50,000 to $74,999 | 5,732 (15.3%) | 4,253 (5.7%) |
| $75,000 to $99,999 | 4,740 (12.7%) | 10,394 (13.8%) |
| $100,000 to $149,999 | 7,187 (19.2%) | 10,914 (14.5%) |
| $150,000 or more | 8,203 (21.9%) | 18,871 (25.1%) |
| Total | 37,472 (100.0%) | 75,199 (100.0%) |
Property Value to Household Income Ratio in Washoe County
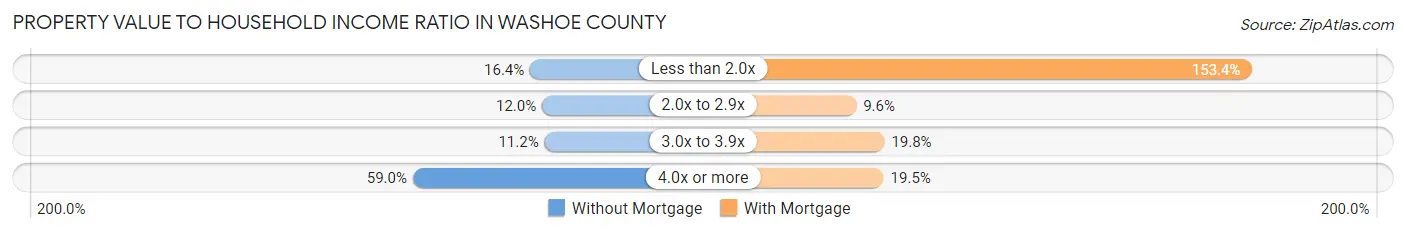
| Value-to-Income Ratio | Without Mortgage | With Mortgage |
| Less than 2.0x | 6,140 (16.4%) | 115,368 (153.4%) |
| 2.0x to 2.9x | 4,513 (12.0%) | 7,187 (9.6%) |
| 3.0x to 3.9x | 4,184 (11.2%) | 14,899 (19.8%) |
| 4.0x or more | 22,103 (59.0%) | 14,681 (19.5%) |
| Total | 37,472 (100.0%) | 75,199 (100.0%) |
Real Estate Taxes by Mortgage Status in Washoe County
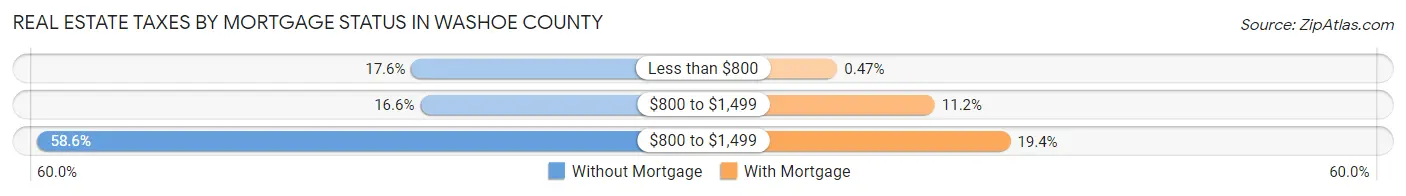
| Property Taxes | Without Mortgage | With Mortgage |
| Less than $800 | 6,603 (17.6%) | 353 (0.5%) |
| $800 to $1,499 | 6,234 (16.6%) | 8,389 (11.2%) |
| $800 to $1,499 | 21,952 (58.6%) | 14,618 (19.4%) |
| Total | 37,472 (100.0%) | 75,199 (100.0%) |
Health & Disability in Washoe County
Health Insurance Coverage by Age in Washoe County
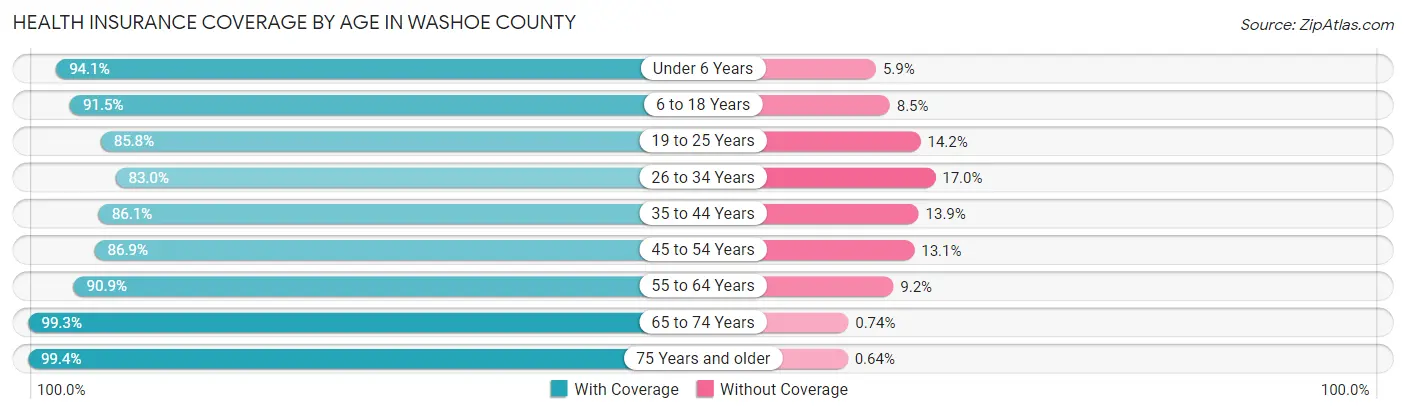
| Age Bracket | With Coverage | Without Coverage |
| Under 6 Years | 30,939 (94.1%) | 1,942 (5.9%) |
| 6 to 18 Years | 69,217 (91.5%) | 6,412 (8.5%) |
| 19 to 25 Years | 39,248 (85.8%) | 6,506 (14.2%) |
| 26 to 34 Years | 53,791 (83.0%) | 10,992 (17.0%) |
| 35 to 44 Years | 53,346 (86.1%) | 8,584 (13.9%) |
| 45 to 54 Years | 50,690 (86.9%) | 7,617 (13.1%) |
| 55 to 64 Years | 57,165 (90.8%) | 5,754 (9.1%) |
| 65 to 74 Years | 50,828 (99.3%) | 378 (0.7%) |
| 75 Years and older | 30,005 (99.4%) | 194 (0.6%) |
| Total | 435,229 (90.0%) | 48,379 (10.0%) |
Health Insurance Coverage by Citizenship Status in Washoe County
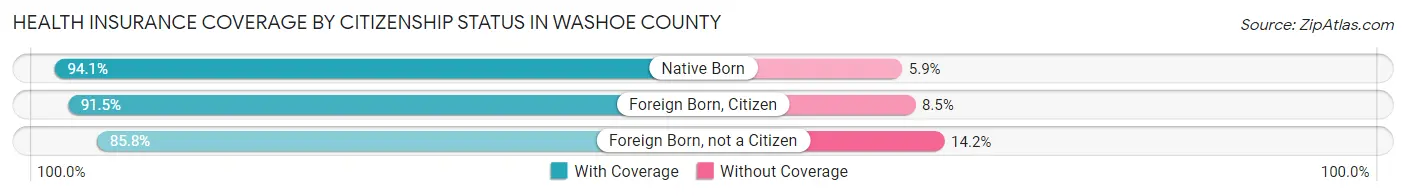
| Citizenship Status | With Coverage | Without Coverage |
| Native Born | 30,939 (94.1%) | 1,942 (5.9%) |
| Foreign Born, Citizen | 69,217 (91.5%) | 6,412 (8.5%) |
| Foreign Born, not a Citizen | 39,248 (85.8%) | 6,506 (14.2%) |
Health Insurance Coverage by Household Income in Washoe County
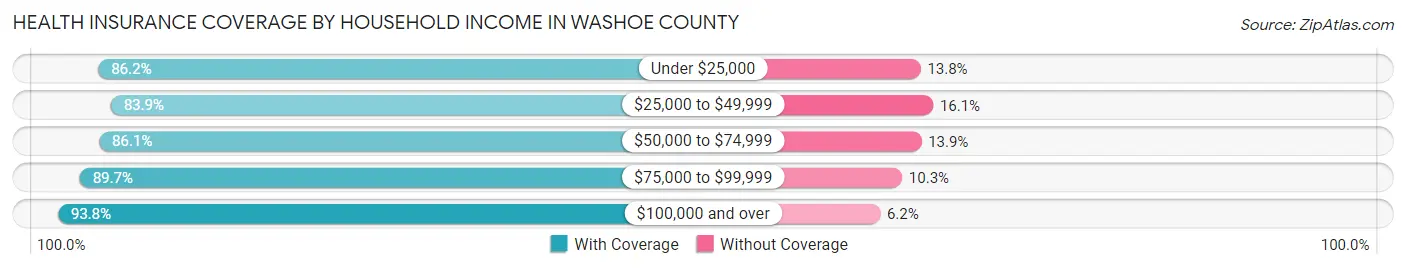
| Household Income | With Coverage | Without Coverage |
| Under $25,000 | 34,602 (86.2%) | 5,541 (13.8%) |
| $25,000 to $49,999 | 55,364 (83.9%) | 10,657 (16.1%) |
| $50,000 to $74,999 | 64,814 (86.1%) | 10,501 (13.9%) |
| $75,000 to $99,999 | 62,586 (89.7%) | 7,210 (10.3%) |
| $100,000 and over | 213,741 (93.8%) | 14,178 (6.2%) |
Public vs Private Health Insurance Coverage by Age in Washoe County
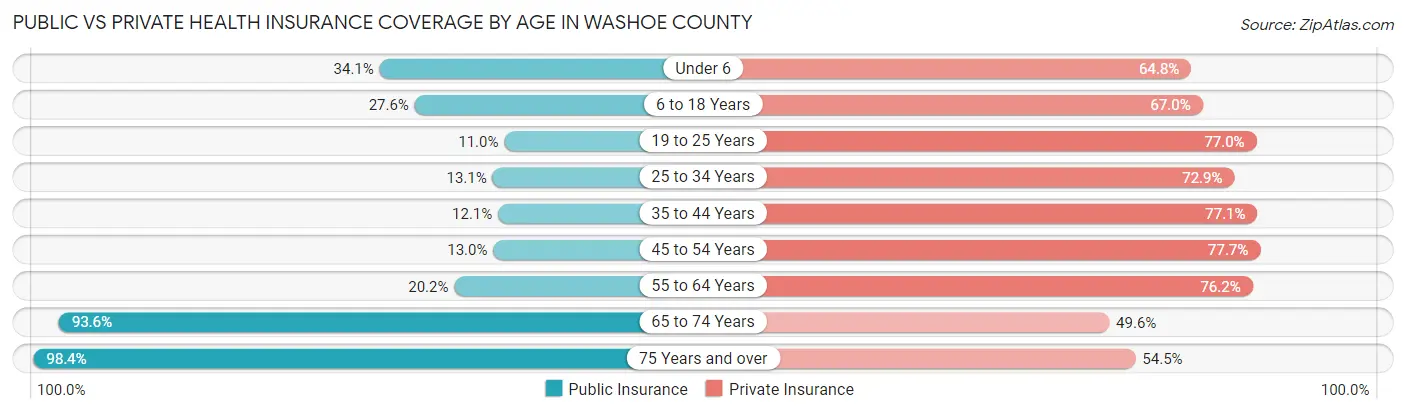
| Age Bracket | Public Insurance | Private Insurance |
| Under 6 | 11,212 (34.1%) | 21,319 (64.8%) |
| 6 to 18 Years | 20,866 (27.6%) | 50,643 (67.0%) |
| 19 to 25 Years | 5,017 (11.0%) | 35,210 (77.0%) |
| 25 to 34 Years | 8,513 (13.1%) | 47,196 (72.9%) |
| 35 to 44 Years | 7,500 (12.1%) | 47,766 (77.1%) |
| 45 to 54 Years | 7,581 (13.0%) | 45,278 (77.6%) |
| 55 to 64 Years | 12,734 (20.2%) | 47,957 (76.2%) |
| 65 to 74 Years | 47,951 (93.6%) | 25,413 (49.6%) |
| 75 Years and over | 29,708 (98.4%) | 16,457 (54.5%) |
| Total | 151,082 (31.2%) | 337,239 (69.7%) |
Disability Status by Sex by Age in Washoe County
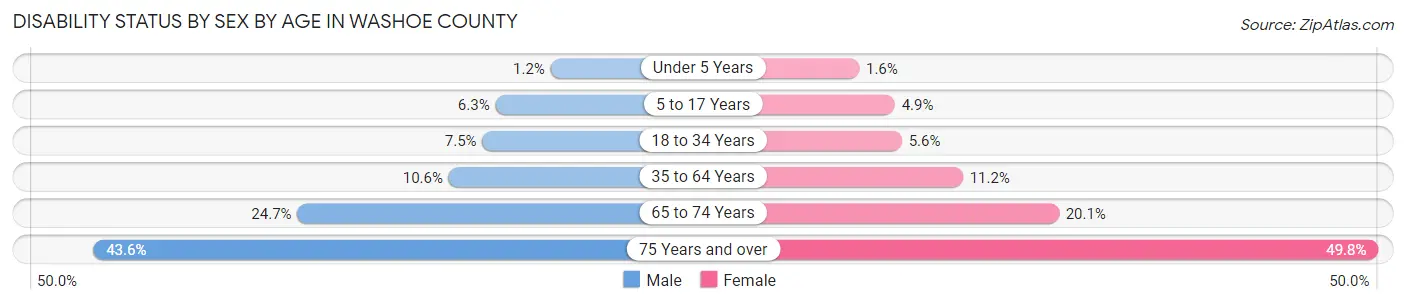
| Age Bracket | Male | Female |
| Under 5 Years | 163 (1.2%) | 209 (1.6%) |
| 5 to 17 Years | 2,451 (6.3%) | 1,809 (4.9%) |
| 18 to 34 Years | 4,513 (7.5%) | 3,131 (5.6%) |
| 35 to 64 Years | 9,945 (10.6%) | 10,053 (11.2%) |
| 65 to 74 Years | 6,169 (24.7%) | 5,278 (20.1%) |
| 75 Years and over | 6,053 (43.6%) | 8,128 (49.8%) |
Disability Class by Sex by Age in Washoe County
Disability Class: Hearing Difficulty
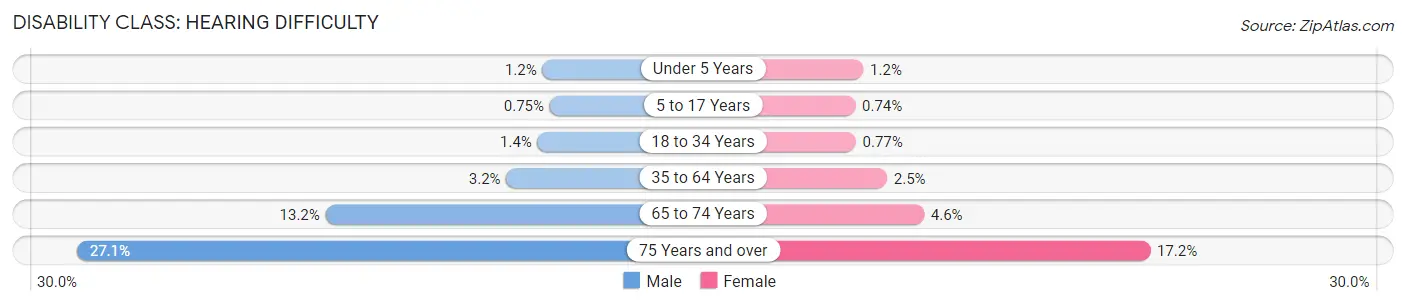
| Age Bracket | Male | Female |
| Under 5 Years | 160 (1.2%) | 156 (1.2%) |
| 5 to 17 Years | 292 (0.7%) | 273 (0.7%) |
| 18 to 34 Years | 858 (1.4%) | 435 (0.8%) |
| 35 to 64 Years | 2,965 (3.2%) | 2,252 (2.5%) |
| 65 to 74 Years | 3,310 (13.2%) | 1,198 (4.6%) |
| 75 Years and over | 3,758 (27.1%) | 2,802 (17.2%) |
Disability Class: Vision Difficulty
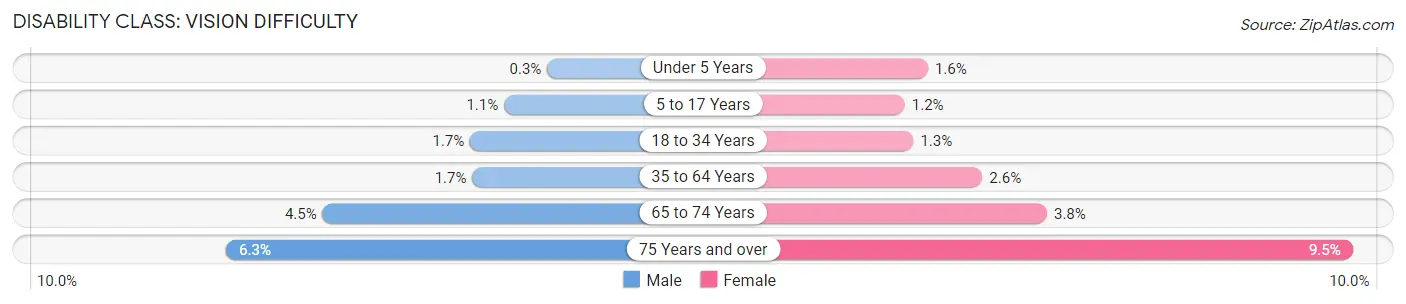
| Age Bracket | Male | Female |
| Under 5 Years | 42 (0.3%) | 209 (1.6%) |
| 5 to 17 Years | 427 (1.1%) | 431 (1.2%) |
| 18 to 34 Years | 1,039 (1.7%) | 749 (1.3%) |
| 35 to 64 Years | 1,582 (1.7%) | 2,335 (2.6%) |
| 65 to 74 Years | 1,118 (4.5%) | 998 (3.8%) |
| 75 Years and over | 868 (6.3%) | 1,548 (9.5%) |
Disability Class: Cognitive Difficulty
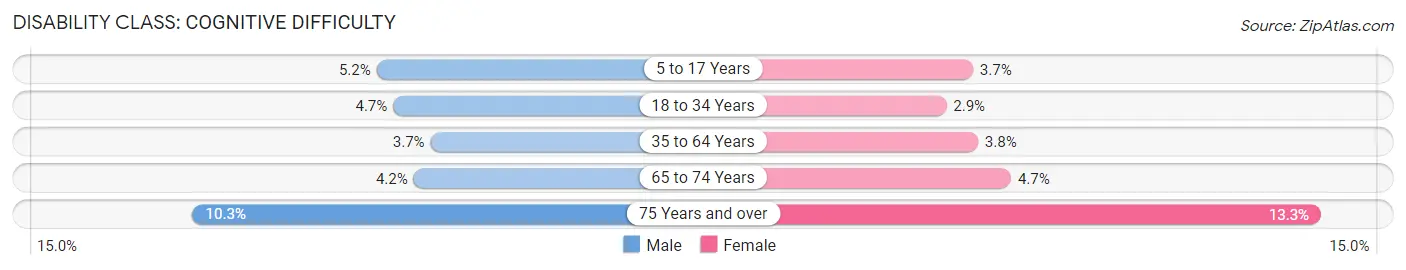
| Age Bracket | Male | Female |
| 5 to 17 Years | 2,022 (5.2%) | 1,343 (3.6%) |
| 18 to 34 Years | 2,851 (4.7%) | 1,641 (2.9%) |
| 35 to 64 Years | 3,463 (3.7%) | 3,396 (3.8%) |
| 65 to 74 Years | 1,042 (4.2%) | 1,235 (4.7%) |
| 75 Years and over | 1,431 (10.3%) | 2,178 (13.3%) |
Disability Class: Ambulatory Difficulty
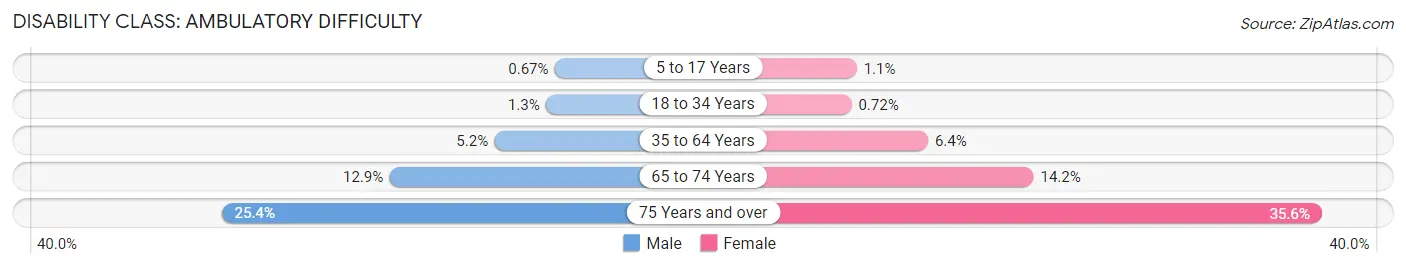
| Age Bracket | Male | Female |
| 5 to 17 Years | 261 (0.7%) | 408 (1.1%) |
| 18 to 34 Years | 792 (1.3%) | 403 (0.7%) |
| 35 to 64 Years | 4,816 (5.1%) | 5,736 (6.4%) |
| 65 to 74 Years | 3,234 (12.9%) | 3,732 (14.2%) |
| 75 Years and over | 3,520 (25.4%) | 5,817 (35.6%) |
Disability Class: Self-Care Difficulty
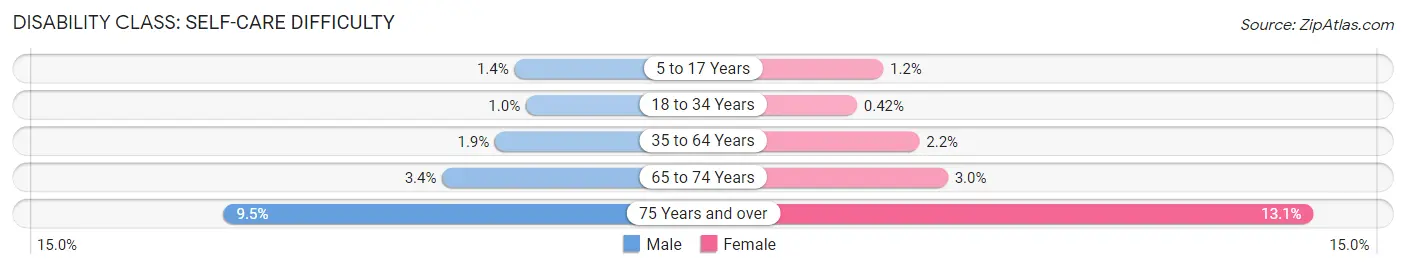
| Age Bracket | Male | Female |
| 5 to 17 Years | 530 (1.4%) | 422 (1.1%) |
| 18 to 34 Years | 625 (1.0%) | 239 (0.4%) |
| 35 to 64 Years | 1,775 (1.9%) | 1,939 (2.2%) |
| 65 to 74 Years | 842 (3.4%) | 773 (2.9%) |
| 75 Years and over | 1,312 (9.5%) | 2,144 (13.1%) |
Technology Access in Washoe County
Computing Device Access in Washoe County
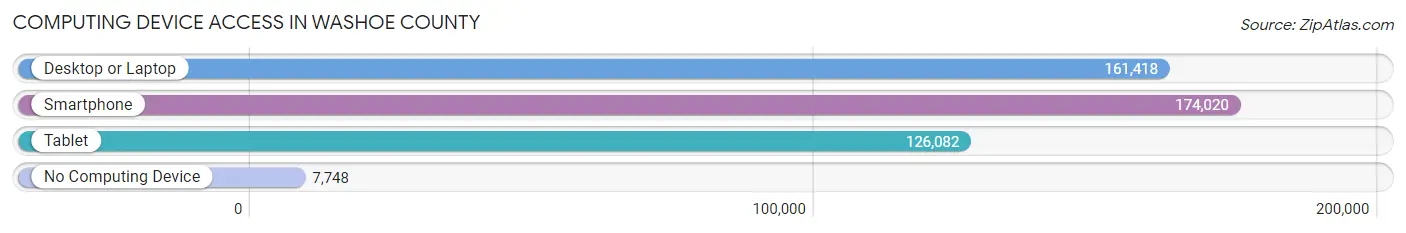
| Device Type | # Households | % Households |
| Desktop or Laptop | 161,418 | 83.9% |
| Smartphone | 174,020 | 90.4% |
| Tablet | 126,082 | 65.5% |
| No Computing Device | 7,748 | 4.0% |
| Total | 192,420 | 100.0% |
Internet Access in Washoe County
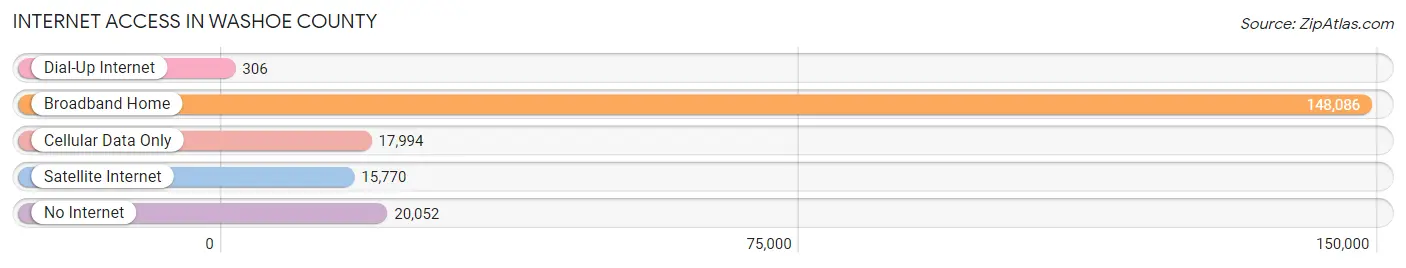
| Internet Type | # Households | % Households |
| Dial-Up Internet | 306 | 0.2% |
| Broadband Home | 148,086 | 77.0% |
| Cellular Data Only | 17,994 | 9.3% |
| Satellite Internet | 15,770 | 8.2% |
| No Internet | 20,052 | 10.4% |
| Total | 192,420 | 100.0% |
Washoe County Summary
Washoe County is located in the northwestern region of Nevada and is the second most populous county in the state. It is bordered by California to the west, Oregon to the north, and Idaho to the east. The county seat is Reno, the largest city in the county. Washoe County covers an area of 6,542 square miles and has a population of 459,124 as of 2019.
History
Washoe County was established in 1861 and named after the Washoe people, a Native American tribe that lived in the area. The county was originally part of the Utah Territory, but was later annexed to Nevada in 1864. The county was initially divided into two districts, the Reno District and the Washoe District. The Reno District was later renamed Washoe County in 1868.
The county experienced rapid growth in the late 19th and early 20th centuries due to the discovery of silver and gold in the area. This led to the establishment of several mining towns, including Virginia City, Reno, and Sparks. The county also became a popular destination for tourists, who were drawn to the area’s natural beauty and recreational opportunities.
Geography
Washoe County is located in the northwestern region of Nevada and covers an area of 6,542 square miles. The county is bordered by California to the west, Oregon to the north, and Idaho to the east. The county is divided into two distinct regions, the Sierra Nevada Mountains to the west and the Great Basin to the east. The highest point in the county is Slide Mountain, which has an elevation of 9,735 feet.
The county is home to several lakes, including Lake Tahoe, Pyramid Lake, and Washoe Lake. The Truckee River runs through the county and is a major source of water for the region. The county also contains several protected areas, including the Humboldt-Toiyabe National Forest, the Black Rock Desert-High Rock Canyon Emigrant Trails National Conservation Area, and the Pyramid Lake Indian Reservation.
Economy
Washoe County’s economy is largely driven by tourism, gaming, and manufacturing. The county is home to several casinos, including the Reno-Sparks Convention Center, the Grand Sierra Resort, and the Peppermill Casino. The county is also home to several manufacturing companies, including Tesla, Panasonic, and Apple.
The county is also home to several universities and colleges, including the University of Nevada, Reno, Truckee Meadows Community College, and Western Nevada College. The county is also home to several major employers, including the Reno-Sparks Indian Colony, the Washoe County School District, and the Washoe County Health District.
Demographics
As of 2019, Washoe County had a population of 459,124. The population is largely white (77.2%), followed by Hispanic or Latino (14.2%), Asian (4.2%), and African American (2.3%). The median household income in the county is $60,845 and the median age is 37.7.
The county is home to several Native American tribes, including the Washoe, Paiute, and Shoshone. The county also has a large immigrant population, with the largest groups coming from Mexico, India, and the Philippines.
Conclusion
Washoe County is located in the northwestern region of Nevada and is the second most populous county in the state. The county was established in 1861 and is named after the Washoe people, a Native American tribe that lived in the area. The county covers an area of 6,542 square miles and has a population of 459,124 as of 2019. The county’s economy is largely driven by tourism, gaming, and manufacturing. The county is also home to several universities and colleges, as well as several major employers. The population is largely white, followed by Hispanic or Latino, Asian, and African American. The county is also home to several Native American tribes, as well as a large immigrant population.
Common Questions
What is Per Capita Income in Washoe County?
Per Capita income in Washoe County is $44,448.
What is the Median Family Income in Washoe County?
Median Family Income in Washoe County is $98,619.
What is the Median Household income in Washoe County?
Median Household Income in Washoe County is $81,531.
What is Income or Wage Gap in Washoe County?
Income or Wage Gap in Washoe County is 23.0%.
Women in Washoe County earn 77.0 cents for every dollar earned by a man.
What is Family Income Deficit in Washoe County?
Family Income Deficit in Washoe County is $9,752.
Families that are below poverty line in Washoe County earn $9,752 less on average than the poverty threshold level.
What is Inequality or Gini Index in Washoe County?
Inequality or Gini Index in Washoe County is 0.47.
What is the Total Population of Washoe County?
Total Population of Washoe County is 486,674.
What is the Total Male Population of Washoe County?
Total Male Population of Washoe County is 247,473.
What is the Total Female Population of Washoe County?
Total Female Population of Washoe County is 239,201.
What is the Ratio of Males per 100 Females in Washoe County?
There are 103.46 Males per 100 Females in Washoe County.
What is the Ratio of Females per 100 Males in Washoe County?
There are 96.66 Females per 100 Males in Washoe County.
What is the Median Population Age in Washoe County?
Median Population Age in Washoe County is 38.6 Years.
What is the Average Family Size in Washoe County
Average Family Size in Washoe County is 3.0 People.
What is the Average Household Size in Washoe County
Average Household Size in Washoe County is 2.5 People.
How Large is the Labor Force in Washoe County?
There are 262,006 People in the Labor Forcein in Washoe County.
What is the Percentage of People in the Labor Force in Washoe County?
66.2% of People are in the Labor Force in Washoe County.
What is the Unemployment Rate in Washoe County?
Unemployment Rate in Washoe County is 5.0%.