Storey County, NV Map & Demographics
Storey County Map
Storey County Overview
$44,539
PER CAPITA INCOME
$110,426
AVG FAMILY INCOME
$86,932
AVG HOUSEHOLD INCOME
35.7%
WAGE / INCOME GAP [ % ]
64.3¢/ $1
WAGE / INCOME GAP [ $ ]
0.44
INEQUALITY / GINI INDEX
4,095
TOTAL POPULATION
2,149
MALE POPULATION
1,946
FEMALE POPULATION
110.43
MALES / 100 FEMALES
90.55
FEMALES / 100 MALES
55.7
MEDIAN AGE
3.2
AVG FAMILY SIZE
2.4
AVG HOUSEHOLD SIZE
1,472
LABOR FORCE [ PEOPLE ]
41.9%
PERCENT IN LABOR FORCE
7.0%
UNEMPLOYMENT RATE
Income in Storey County
Income Overview in Storey County
Per Capita Income in Storey County is $44,539, while median incomes of families and households are $110,426 and $86,932 respectively.
| Characteristic | Number | Measure |
| Per Capita Income | 4,095 | $44,539 |
| Median Family Income | 907 | $110,426 |
| Mean Family Income | 907 | $124,907 |
| Median Household Income | 1,692 | $86,932 |
| Mean Household Income | 1,692 | $103,654 |
| Income Deficit | 907 | $0 |
| Wage / Income Gap (%) | 4,095 | 35.68% |
| Wage / Income Gap ($) | 4,095 | 64.32¢ per $1 |
| Gini / Inequality Index | 4,095 | 0.44 |
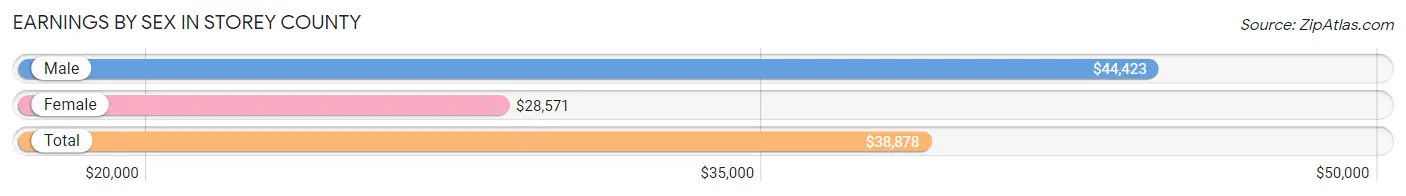
Earnings by Sex in Storey County
Average Earnings in Storey County are $38,878, $44,423 for men and $28,571 for women, a difference of 35.7%.
| Sex | Number | Average Earnings |
| Male | 1,038 (58.1%) | $44,423 |
| Female | 750 (41.9%) | $28,571 |
| Total | 1,788 (100.0%) | $38,878 |
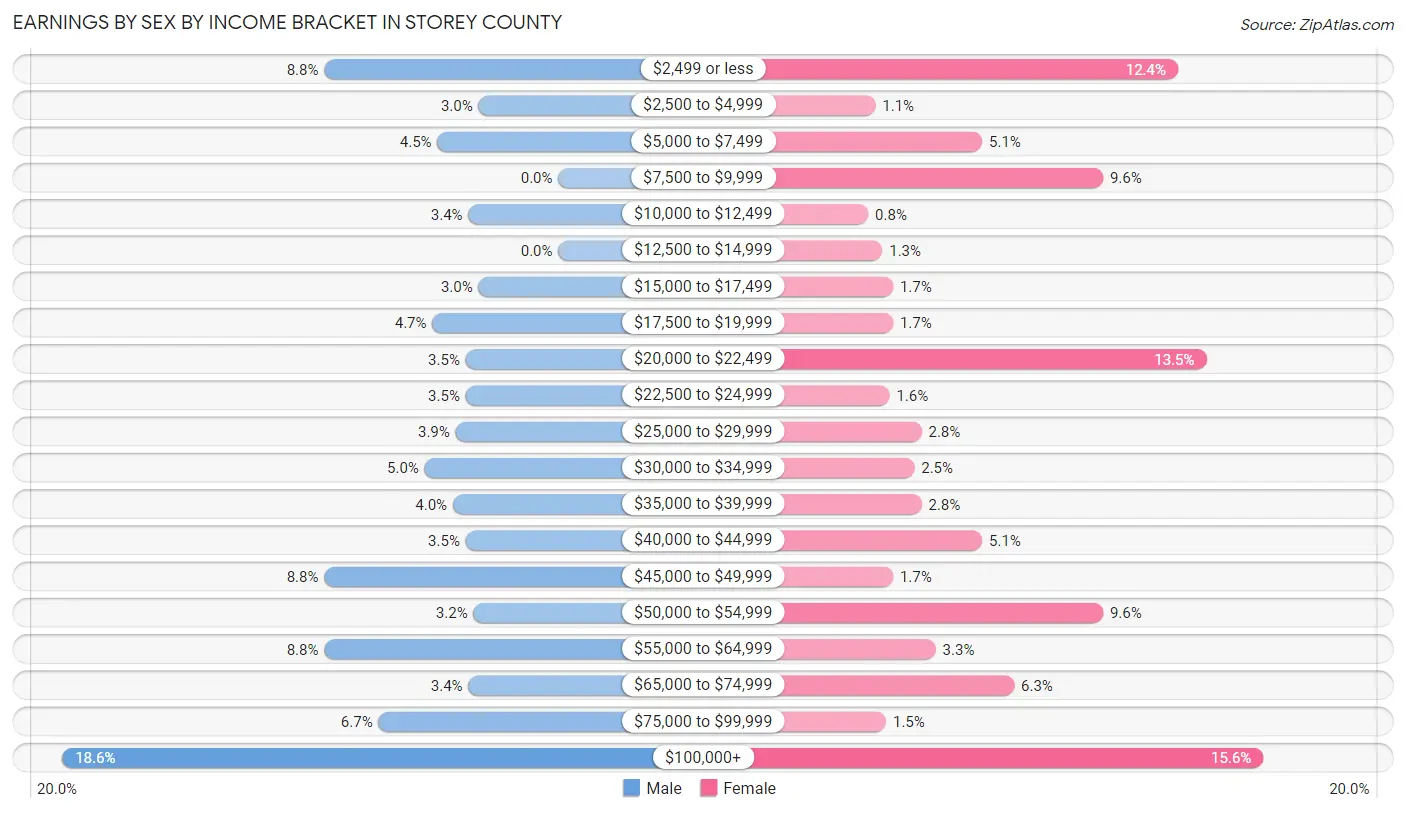
Earnings by Sex by Income Bracket in Storey County
The most common earnings brackets in Storey County are $100,000+ for men (193 | 18.6%) and $100,000+ for women (117 | 15.6%).
| Income | Male | Female |
| $2,499 or less | 91 (8.8%) | 93 (12.4%) |
| $2,500 to $4,999 | 31 (3.0%) | 8 (1.1%) |
| $5,000 to $7,499 | 47 (4.5%) | 38 (5.1%) |
| $7,500 to $9,999 | 0 (0.0%) | 72 (9.6%) |
| $10,000 to $12,499 | 35 (3.4%) | 6 (0.8%) |
| $12,500 to $14,999 | 0 (0.0%) | 10 (1.3%) |
| $15,000 to $17,499 | 31 (3.0%) | 13 (1.7%) |
| $17,500 to $19,999 | 49 (4.7%) | 13 (1.7%) |
| $20,000 to $22,499 | 36 (3.5%) | 101 (13.5%) |
| $22,500 to $24,999 | 36 (3.5%) | 12 (1.6%) |
| $25,000 to $29,999 | 40 (3.8%) | 21 (2.8%) |
| $30,000 to $34,999 | 52 (5.0%) | 19 (2.5%) |
| $35,000 to $39,999 | 41 (4.0%) | 21 (2.8%) |
| $40,000 to $44,999 | 36 (3.5%) | 38 (5.1%) |
| $45,000 to $49,999 | 91 (8.8%) | 13 (1.7%) |
| $50,000 to $54,999 | 33 (3.2%) | 72 (9.6%) |
| $55,000 to $64,999 | 91 (8.8%) | 25 (3.3%) |
| $65,000 to $74,999 | 35 (3.4%) | 47 (6.3%) |
| $75,000 to $99,999 | 70 (6.7%) | 11 (1.5%) |
| $100,000+ | 193 (18.6%) | 117 (15.6%) |
| Total | 1,038 (100.0%) | 750 (100.0%) |
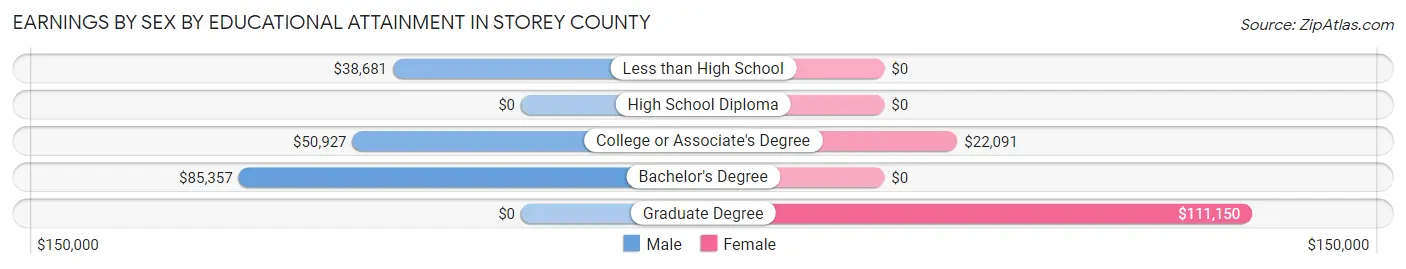
Earnings by Sex by Educational Attainment in Storey County
Average earnings in Storey County are $47,074 for men and $40,833 for women, a difference of 13.3%. Men with an educational attainment of bachelor's degree enjoy the highest average annual earnings of $85,357, while those with less than high school education earn the least with $38,681. Women with an educational attainment of graduate degree earn the most with the average annual earnings of $111,150, while those with college or associate's degree education have the smallest earnings of $22,091.
| Educational Attainment | Male Income | Female Income |
| Less than High School | $38,681 | $0 |
| High School Diploma | - | - |
| College or Associate's Degree | $50,927 | $22,091 |
| Bachelor's Degree | $85,357 | $0 |
| Graduate Degree | - | - |
| Total | $47,074 | $40,833 |
Family Income in Storey County
Family Income Brackets in Storey County
According to the Storey County family income data, there are 309 families falling into the $100,000 to $149,999 income range, which is the most common income bracket and makes up 34.1% of all families. Conversely, the less than $10,000 income bracket is the least frequent group with only 5 families (0.5%) belonging to this category.
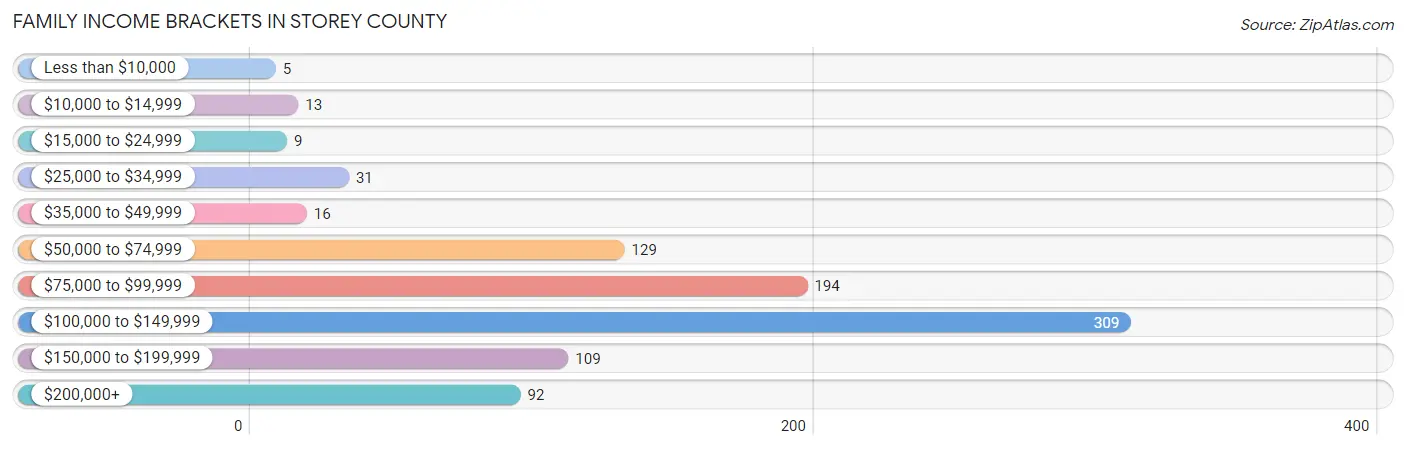
| Income Bracket | # Families | % Families |
| Less than $10,000 | 5 | 0.6% |
| $10,000 to $14,999 | 13 | 1.4% |
| $15,000 to $24,999 | 9 | 1.0% |
| $25,000 to $34,999 | 31 | 3.4% |
| $35,000 to $49,999 | 16 | 1.8% |
| $50,000 to $74,999 | 129 | 14.2% |
| $75,000 to $99,999 | 194 | 21.4% |
| $100,000 to $149,999 | 309 | 34.1% |
| $150,000 to $199,999 | 109 | 12.0% |
| $200,000+ | 92 | 10.1% |
Family Income by Famaliy Size in Storey County
4-person families (176 | 19.4%) account for the highest median family income in Storey County with $129,219 per family, while 2-person families (489 | 53.9%) have the highest median income of $60,149 per family member.
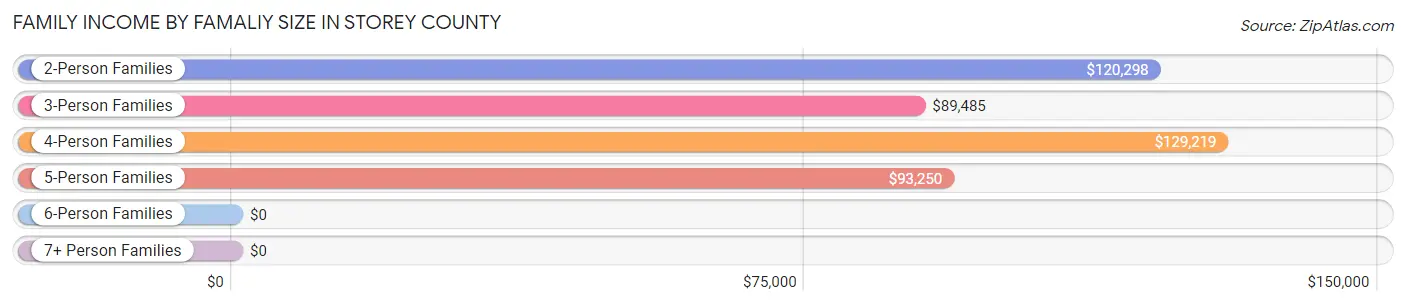
| Income Bracket | # Families | Median Income |
| 2-Person Families | 489 (53.9%) | $120,298 |
| 3-Person Families | 133 (14.7%) | $89,485 |
| 4-Person Families | 176 (19.4%) | $129,219 |
| 5-Person Families | 74 (8.2%) | $93,250 |
| 6-Person Families | 31 (3.4%) | $0 |
| 7+ Person Families | 4 (0.4%) | $0 |
| Total | 907 (100.0%) | $110,426 |
Family Income by Number of Earners in Storey County
The median family income in Storey County is $110,426, with families comprising 2 earners (267) having the highest median family income of $170,625, while families with 3+ earners (93) have the lowest median family income of $83,194, accounting for 29.4% and 10.2% of families, respectively.
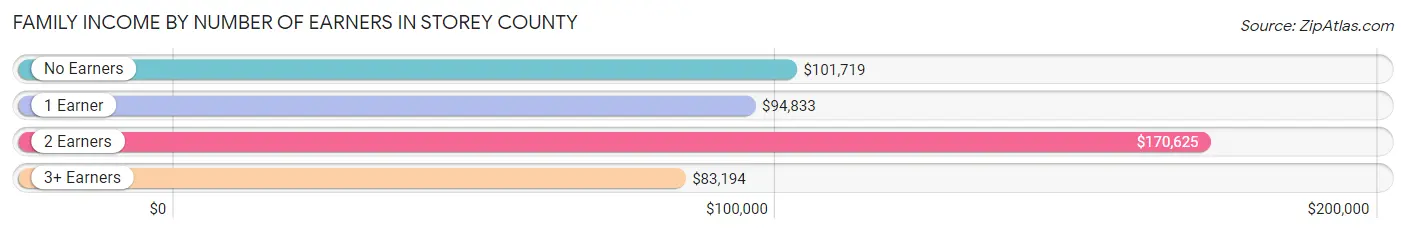
| Number of Earners | # Families | Median Income |
| No Earners | 245 (27.0%) | $101,719 |
| 1 Earner | 302 (33.3%) | $94,833 |
| 2 Earners | 267 (29.4%) | $170,625 |
| 3+ Earners | 93 (10.2%) | $83,194 |
| Total | 907 (100.0%) | $110,426 |
Household Income in Storey County
Household Income Brackets in Storey County
With 431 households falling in the category, the $100,000 to $149,999 income range is the most frequent in Storey County, accounting for 25.5% of all households. In contrast, only 51 households (3.0%) fall into the less than $10,000 income bracket, making it the least populous group.
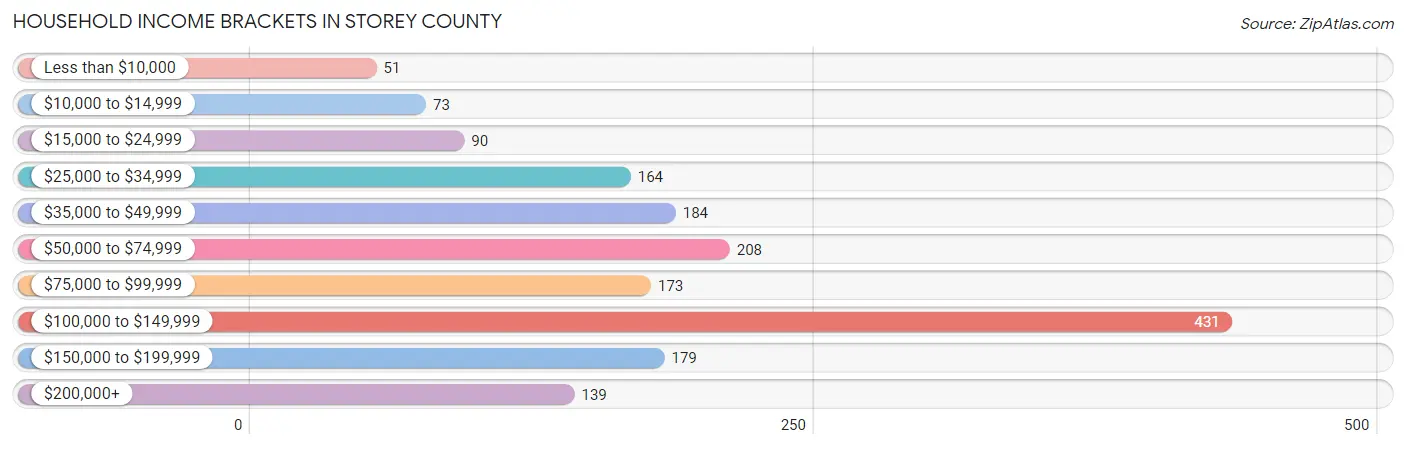
| Income Bracket | # Households | % Households |
| Less than $10,000 | 51 | 3.0% |
| $10,000 to $14,999 | 73 | 4.3% |
| $15,000 to $24,999 | 90 | 5.3% |
| $25,000 to $34,999 | 164 | 9.7% |
| $35,000 to $49,999 | 184 | 10.9% |
| $50,000 to $74,999 | 208 | 12.3% |
| $75,000 to $99,999 | 173 | 10.2% |
| $100,000 to $149,999 | 431 | 25.5% |
| $150,000 to $199,999 | 179 | 10.6% |
| $200,000+ | 139 | 8.2% |
Household Income by Householder Age in Storey County
The median household income in Storey County is $86,932, with the highest median household income of $111,667 found in the 25 to 44 years age bracket for the primary householder. A total of 194 households (11.5%) fall into this category. Meanwhile, the 15 to 24 years age bracket for the primary householder has the lowest median household income of $0, with 15 households (0.9%) in this group.
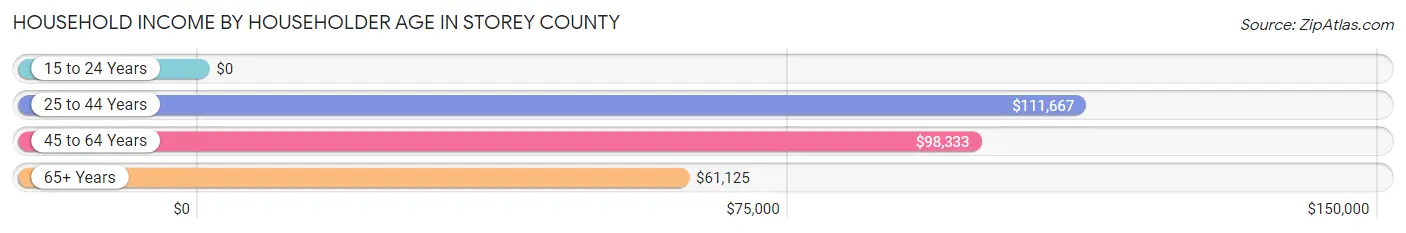
| Income Bracket | # Households | Median Income |
| 15 to 24 Years | 15 (0.9%) | $0 |
| 25 to 44 Years | 194 (11.5%) | $111,667 |
| 45 to 64 Years | 526 (31.1%) | $98,333 |
| 65+ Years | 957 (56.6%) | $61,125 |
| Total | 1,692 (100.0%) | $86,932 |
Poverty in Storey County
Income Below Poverty by Sex and Age in Storey County
With 7.9% poverty level for males and 10.4% for females among the residents of Storey County, 45 to 54 year old males and 65 to 74 year old females are the most vulnerable to poverty, with 57 males (24.7%) and 69 females (19.0%) in their respective age groups living below the poverty level.
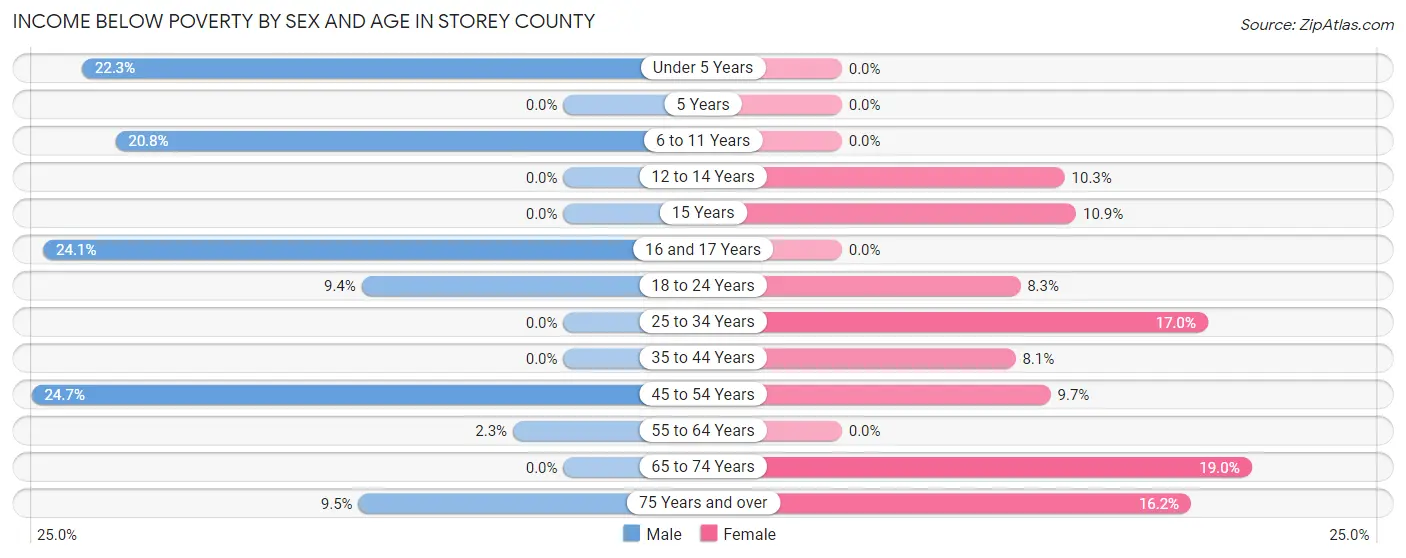
| Age Bracket | Male | Female |
| Under 5 Years | 21 (22.3%) | 0 (0.0%) |
| 5 Years | 0 (0.0%) | 0 (0.0%) |
| 6 to 11 Years | 21 (20.8%) | 0 (0.0%) |
| 12 to 14 Years | 0 (0.0%) | 6 (10.3%) |
| 15 Years | 0 (0.0%) | 5 (10.9%) |
| 16 and 17 Years | 14 (24.1%) | 0 (0.0%) |
| 18 to 24 Years | 16 (9.4%) | 12 (8.3%) |
| 25 to 34 Years | 0 (0.0%) | 18 (17.0%) |
| 35 to 44 Years | 0 (0.0%) | 10 (8.1%) |
| 45 to 54 Years | 57 (24.7%) | 19 (9.7%) |
| 55 to 64 Years | 6 (2.3%) | 0 (0.0%) |
| 65 to 74 Years | 0 (0.0%) | 69 (19.0%) |
| 75 Years and over | 33 (9.5%) | 64 (16.2%) |
| Total | 168 (7.9%) | 203 (10.4%) |
Income Above Poverty by Sex and Age in Storey County
According to the poverty statistics in Storey County, males aged 5 years and females aged under 5 years are the age groups that are most secure financially, with 100.0% of males and 100.0% of females in these age groups living above the poverty line.
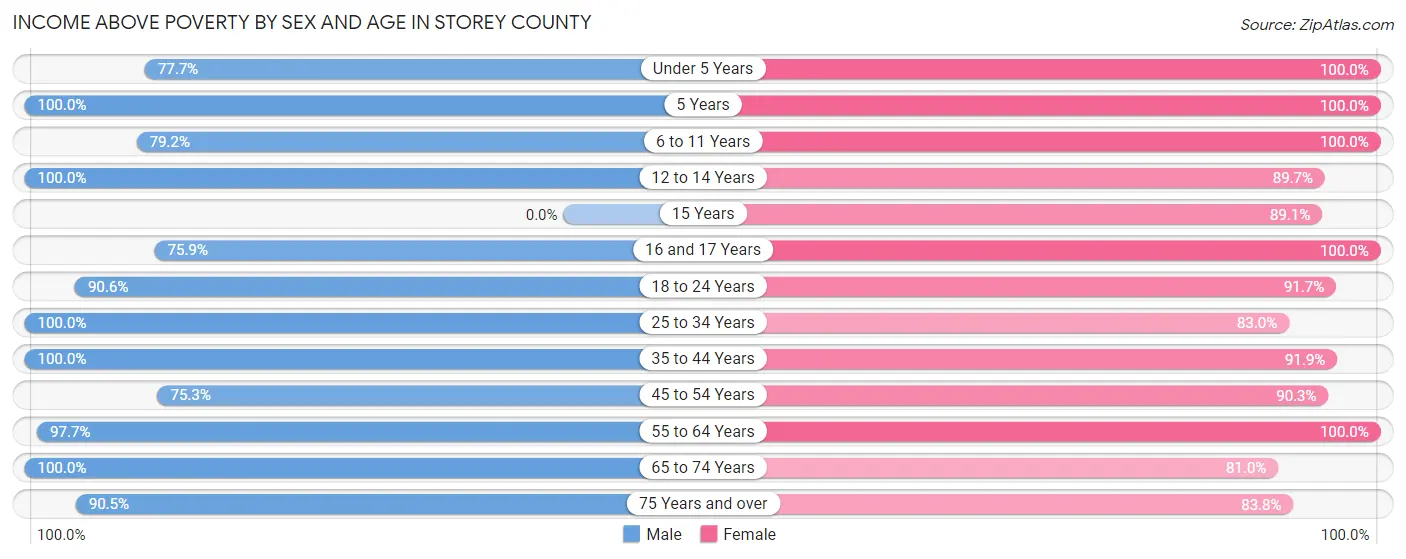
| Age Bracket | Male | Female |
| Under 5 Years | 73 (77.7%) | 70 (100.0%) |
| 5 Years | 37 (100.0%) | 24 (100.0%) |
| 6 to 11 Years | 80 (79.2%) | 106 (100.0%) |
| 12 to 14 Years | 40 (100.0%) | 52 (89.7%) |
| 15 Years | 0 (0.0%) | 41 (89.1%) |
| 16 and 17 Years | 44 (75.9%) | 24 (100.0%) |
| 18 to 24 Years | 155 (90.6%) | 133 (91.7%) |
| 25 to 34 Years | 247 (100.0%) | 88 (83.0%) |
| 35 to 44 Years | 134 (100.0%) | 114 (91.9%) |
| 45 to 54 Years | 174 (75.3%) | 177 (90.3%) |
| 55 to 64 Years | 250 (97.7%) | 289 (100.0%) |
| 65 to 74 Years | 421 (100.0%) | 294 (81.0%) |
| 75 Years and over | 314 (90.5%) | 331 (83.8%) |
| Total | 1,969 (92.1%) | 1,743 (89.6%) |
Income Below Poverty Among Married-Couple Families in Storey County
The poverty statistics for married-couple families in Storey County show that 1.1% or 8 of the total 730 families live below the poverty line. Families with 1 or 2 children have the highest poverty rate of 5.8%, comprising of 8 families. On the other hand, families with no children have the lowest poverty rate of 0.0%, which includes 0 families.
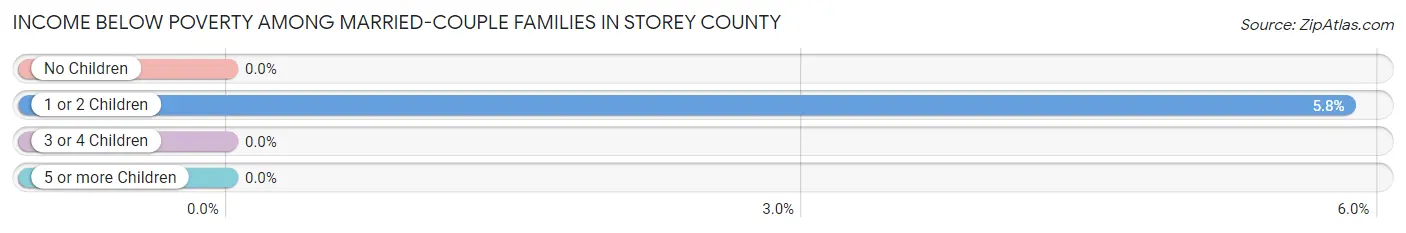
| Children | Above Poverty | Below Poverty |
| No Children | 532 (100.0%) | 0 (0.0%) |
| 1 or 2 Children | 129 (94.2%) | 8 (5.8%) |
| 3 or 4 Children | 61 (100.0%) | 0 (0.0%) |
| 5 or more Children | 0 (0.0%) | 0 (0.0%) |
| Total | 722 (98.9%) | 8 (1.1%) |
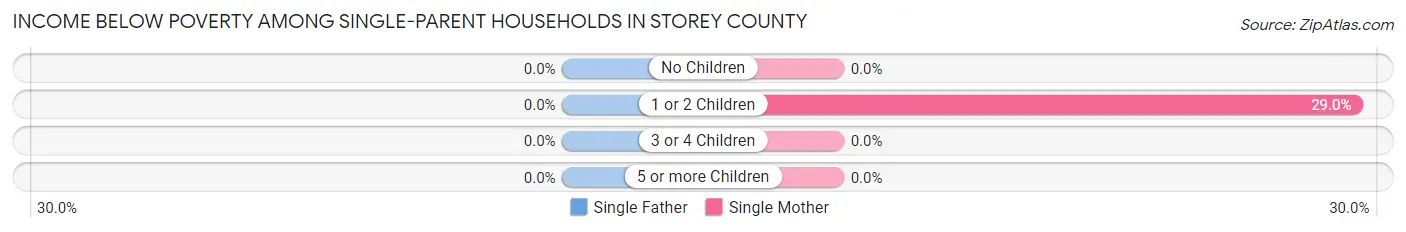
Income Below Poverty Among Single-Parent Households in Storey County
| Children | Single Father | Single Mother |
| No Children | 0 (0.0%) | 0 (0.0%) |
| 1 or 2 Children | 0 (0.0%) | 27 (29.0%) |
| 3 or 4 Children | 0 (0.0%) | 0 (0.0%) |
| 5 or more Children | 0 (0.0%) | 0 (0.0%) |
| Total | 0 (0.0%) | 27 (22.1%) |
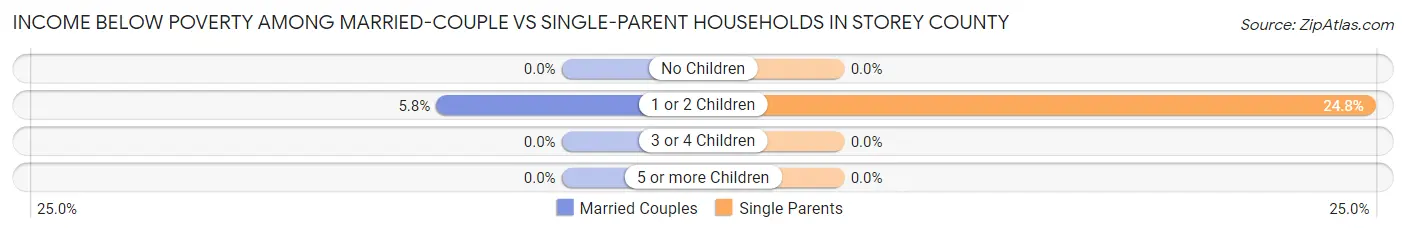
Income Below Poverty Among Married-Couple vs Single-Parent Households in Storey County
The poverty data for Storey County shows that 8 of the married-couple family households (1.1%) and 27 of the single-parent households (15.2%) are living below the poverty level. Within the married-couple family households, those with 1 or 2 children have the highest poverty rate, with 8 households (5.8%) falling below the poverty line. Among the single-parent households, those with 1 or 2 children have the highest poverty rate, with 27 household (24.8%) living below poverty.
| Children | Married-Couple Families | Single-Parent Households |
| No Children | 0 (0.0%) | 0 (0.0%) |
| 1 or 2 Children | 8 (5.8%) | 27 (24.8%) |
| 3 or 4 Children | 0 (0.0%) | 0 (0.0%) |
| 5 or more Children | 0 (0.0%) | 0 (0.0%) |
| Total | 8 (1.1%) | 27 (15.2%) |
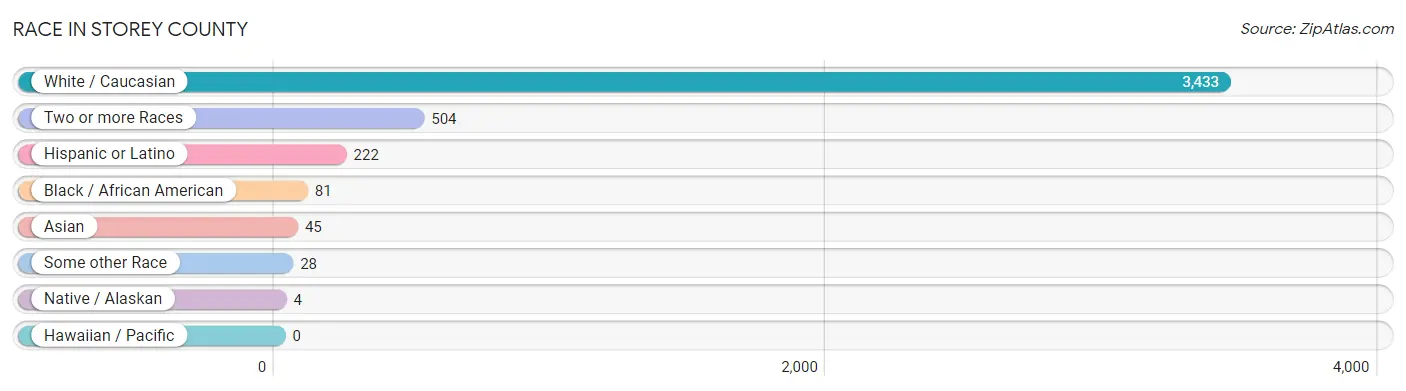
Race in Storey County
The most populous races in Storey County are White / Caucasian (3,433 | 83.8%), Two or more Races (504 | 12.3%), and Hispanic or Latino (222 | 5.4%).
| Race | # Population | % Population |
| Asian | 45 | 1.1% |
| Black / African American | 81 | 2.0% |
| Hawaiian / Pacific | 0 | 0.0% |
| Hispanic or Latino | 222 | 5.4% |
| Native / Alaskan | 4 | 0.1% |
| White / Caucasian | 3,433 | 83.8% |
| Two or more Races | 504 | 12.3% |
| Some other Race | 28 | 0.7% |
| Total | 4,095 | 100.0% |
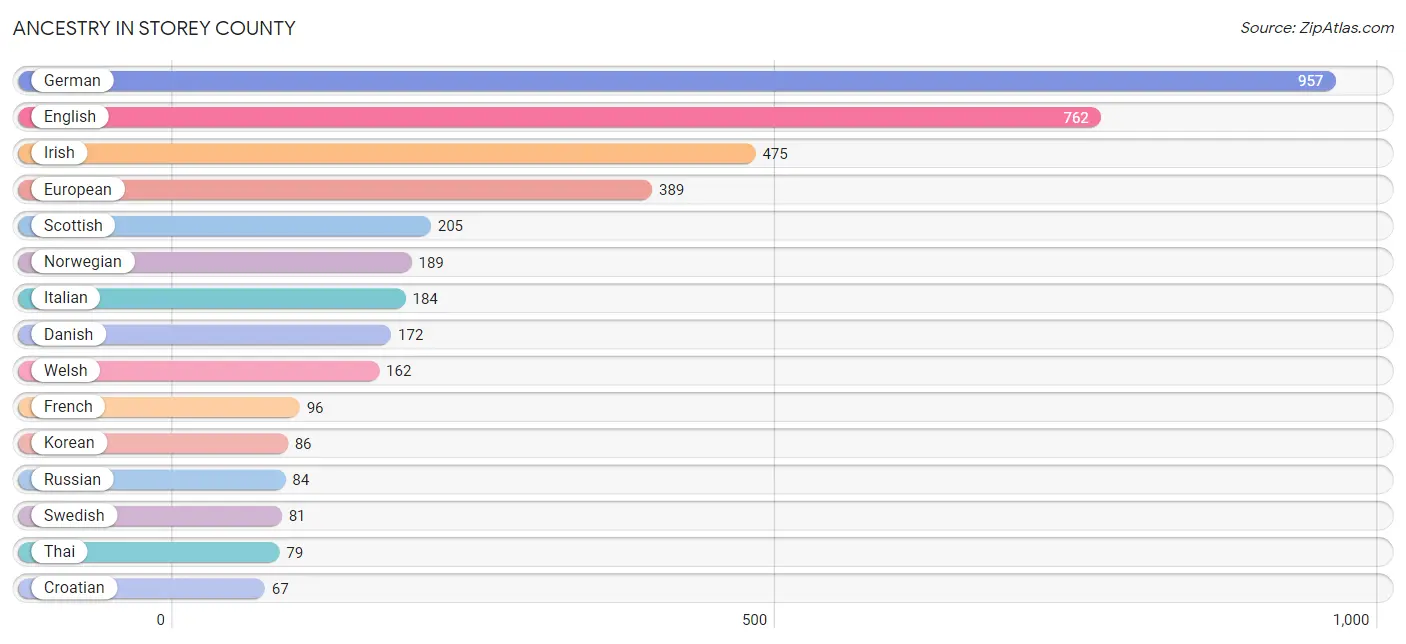
Ancestry in Storey County
The most populous ancestries reported in Storey County are German (957 | 23.4%), English (762 | 18.6%), Irish (475 | 11.6%), European (389 | 9.5%), and Scottish (205 | 5.0%), together accounting for 68.1% of all Storey County residents.
| Ancestry | # Population | % Population |
| African | 57 | 1.4% |
| American | 56 | 1.4% |
| Austrian | 10 | 0.2% |
| Bhutanese | 6 | 0.2% |
| Blackfeet | 21 | 0.5% |
| British | 23 | 0.6% |
| Canadian | 30 | 0.7% |
| Cherokee | 1 | 0.0% |
| Chippewa | 24 | 0.6% |
| Choctaw | 54 | 1.3% |
| Croatian | 67 | 1.6% |
| Czech | 28 | 0.7% |
| Czechoslovakian | 24 | 0.6% |
| Danish | 172 | 4.2% |
| Dutch | 52 | 1.3% |
| Eastern European | 23 | 0.6% |
| English | 762 | 18.6% |
| European | 389 | 9.5% |
| Finnish | 7 | 0.2% |
| French | 96 | 2.3% |
| French Canadian | 17 | 0.4% |
| German | 957 | 23.4% |
| Greek | 23 | 0.6% |
| Hungarian | 12 | 0.3% |
| Irish | 475 | 11.6% |
| Italian | 184 | 4.5% |
| Korean | 86 | 2.1% |
| Lithuanian | 13 | 0.3% |
| Mexican | 48 | 1.2% |
| Mexican American Indian | 1 | 0.0% |
| Northern European | 14 | 0.3% |
| Norwegian | 189 | 4.6% |
| Pennsylvania German | 10 | 0.2% |
| Polish | 11 | 0.3% |
| Portuguese | 12 | 0.3% |
| Puerto Rican | 59 | 1.4% |
| Romanian | 16 | 0.4% |
| Russian | 84 | 2.1% |
| Scandinavian | 22 | 0.5% |
| Scotch-Irish | 11 | 0.3% |
| Scottish | 205 | 5.0% |
| Spaniard | 36 | 0.9% |
| Subsaharan African | 57 | 1.4% |
| Swedish | 81 | 2.0% |
| Swiss | 9 | 0.2% |
| Thai | 79 | 1.9% |
| Turkish | 7 | 0.2% |
| Ukrainian | 2 | 0.1% |
| Welsh | 162 | 4.0% | View All 49 Rows |
Immigrants in Storey County
The most numerous immigrant groups reported in Storey County came from Canada (95 | 2.3%), Asia (45 | 1.1%), Central America (33 | 0.8%), Latin America (33 | 0.8%), and Mexico (33 | 0.8%), together accounting for 5.8% of all Storey County residents.
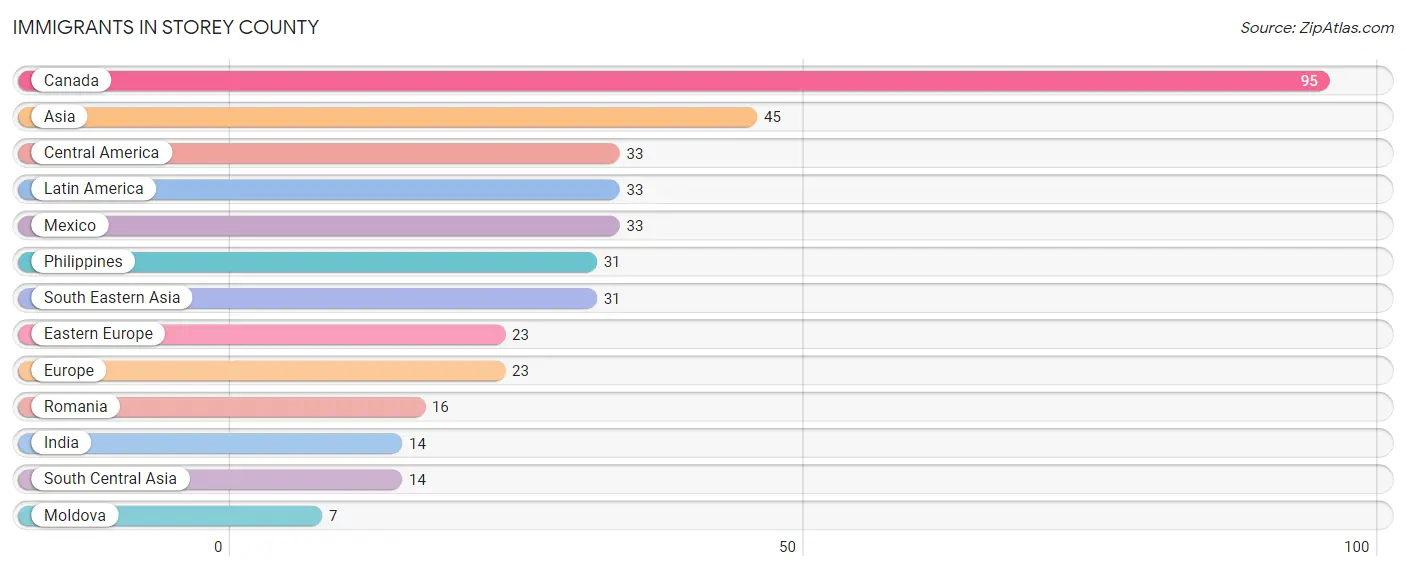
| Immigration Origin | # Population | % Population |
| Asia | 45 | 1.1% |
| Canada | 95 | 2.3% |
| Central America | 33 | 0.8% |
| Eastern Europe | 23 | 0.6% |
| Europe | 23 | 0.6% |
| India | 14 | 0.3% |
| Latin America | 33 | 0.8% |
| Mexico | 33 | 0.8% |
| Moldova | 7 | 0.2% |
| Philippines | 31 | 0.8% |
| Romania | 16 | 0.4% |
| South Central Asia | 14 | 0.3% |
| South Eastern Asia | 31 | 0.8% | View All 13 Rows |
Sex and Age in Storey County
Sex and Age in Storey County
The most populous age groups in Storey County are 70 to 74 Years (302 | 14.1%) for men and 70 to 74 Years (205 | 10.5%) for women.
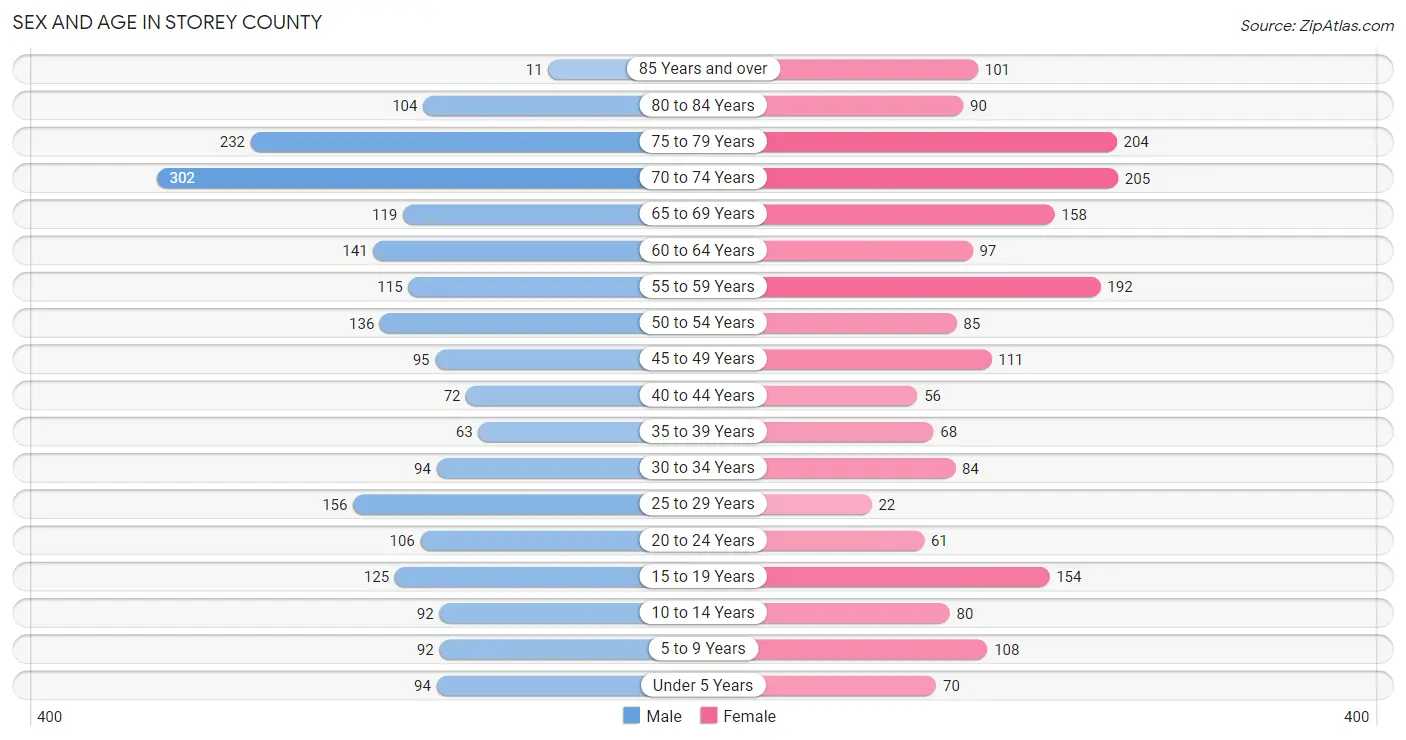
| Age Bracket | Male | Female |
| Under 5 Years | 94 (4.4%) | 70 (3.6%) |
| 5 to 9 Years | 92 (4.3%) | 108 (5.6%) |
| 10 to 14 Years | 92 (4.3%) | 80 (4.1%) |
| 15 to 19 Years | 125 (5.8%) | 154 (7.9%) |
| 20 to 24 Years | 106 (4.9%) | 61 (3.1%) |
| 25 to 29 Years | 156 (7.3%) | 22 (1.1%) |
| 30 to 34 Years | 94 (4.4%) | 84 (4.3%) |
| 35 to 39 Years | 63 (2.9%) | 68 (3.5%) |
| 40 to 44 Years | 72 (3.4%) | 56 (2.9%) |
| 45 to 49 Years | 95 (4.4%) | 111 (5.7%) |
| 50 to 54 Years | 136 (6.3%) | 85 (4.4%) |
| 55 to 59 Years | 115 (5.3%) | 192 (9.9%) |
| 60 to 64 Years | 141 (6.6%) | 97 (5.0%) |
| 65 to 69 Years | 119 (5.5%) | 158 (8.1%) |
| 70 to 74 Years | 302 (14.1%) | 205 (10.5%) |
| 75 to 79 Years | 232 (10.8%) | 204 (10.5%) |
| 80 to 84 Years | 104 (4.8%) | 90 (4.6%) |
| 85 Years and over | 11 (0.5%) | 101 (5.2%) |
| Total | 2,149 (100.0%) | 1,946 (100.0%) |
Families and Households in Storey County
Median Family Size in Storey County
The median family size in Storey County is 3.24 persons per family, with single female/mother families (122 | 13.5%) accounting for the largest median family size of 4.31 persons per family. On the other hand, married-couple families (730 | 80.5%) represent the smallest median family size with 3.04 persons per family.
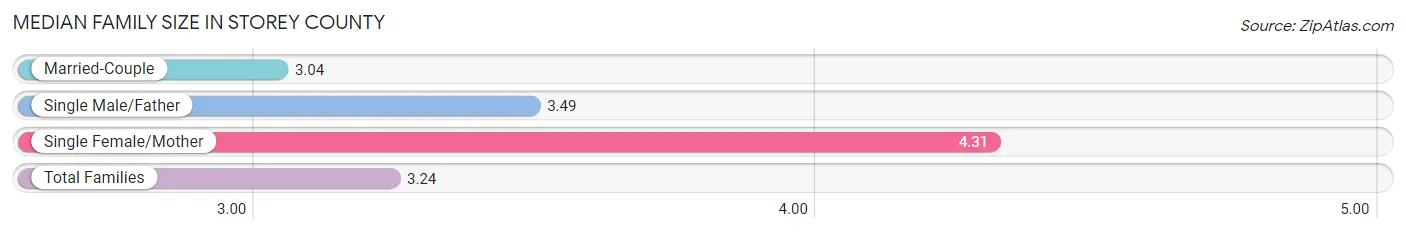
| Family Type | # Families | Family Size |
| Married-Couple | 730 (80.5%) | 3.04 |
| Single Male/Father | 55 (6.1%) | 3.49 |
| Single Female/Mother | 122 (13.5%) | 4.31 |
| Total Families | 907 (100.0%) | 3.24 |
Median Household Size in Storey County
The median household size in Storey County is 2.41 persons per household, with single female/mother households (122 | 7.2%) accounting for the largest median household size of 4.75 persons per household. non-family households (785 | 46.4%) represent the smallest median household size with 1.26 persons per household.
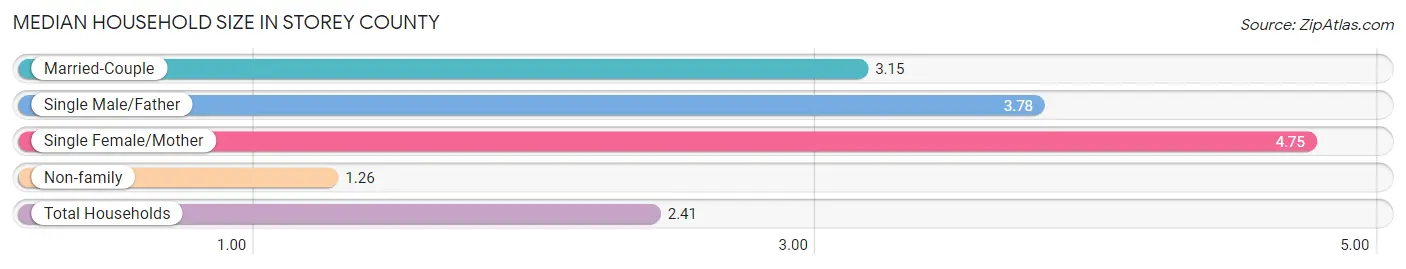
| Household Type | # Households | Household Size |
| Married-Couple | 730 (43.1%) | 3.15 |
| Single Male/Father | 55 (3.3%) | 3.78 |
| Single Female/Mother | 122 (7.2%) | 4.75 |
| Non-family | 785 (46.4%) | 1.26 |
| Total Households | 1,692 (100.0%) | 2.41 |
Household Size by Marriage Status in Storey County
Out of a total of 1,692 households in Storey County, 907 (53.6%) are family households, while 785 (46.4%) are nonfamily households. The most numerous type of family households are 2-person households, comprising 442, and the most common type of nonfamily households are 1-person households, comprising 676.
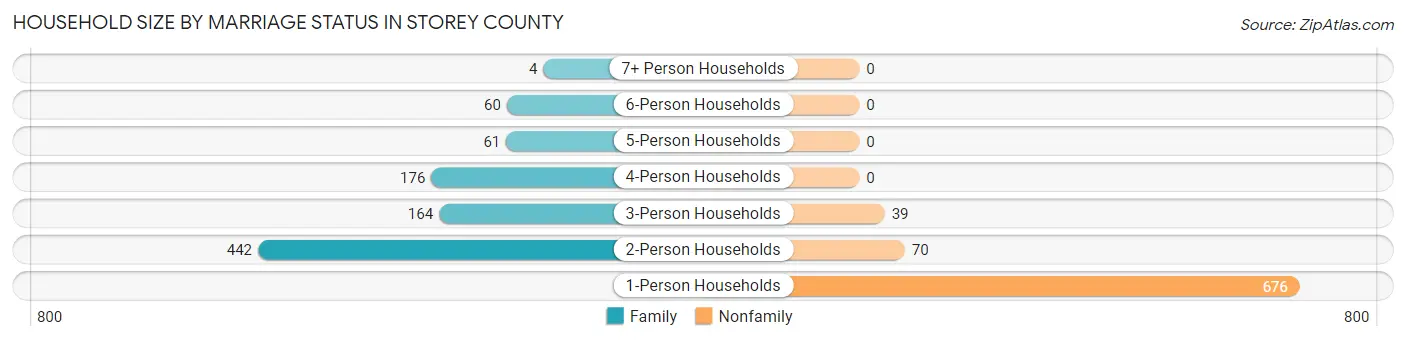
| Household Size | Family Households | Nonfamily Households |
| 1-Person Households | - | 676 (40.0%) |
| 2-Person Households | 442 (26.1%) | 70 (4.1%) |
| 3-Person Households | 164 (9.7%) | 39 (2.3%) |
| 4-Person Households | 176 (10.4%) | 0 (0.0%) |
| 5-Person Households | 61 (3.6%) | 0 (0.0%) |
| 6-Person Households | 60 (3.5%) | 0 (0.0%) |
| 7+ Person Households | 4 (0.2%) | 0 (0.0%) |
| Total | 907 (53.6%) | 785 (46.4%) |
Female Fertility in Storey County
Fertility by Age in Storey County
Average fertility rate in Storey County is 35.0 births per 1,000 women. Women in the age bracket of 20 to 34 years have the highest fertility rate with 120.0 births per 1,000 women. Women in the age bracket of 20 to 34 years acount for 100.0% of all women with births.
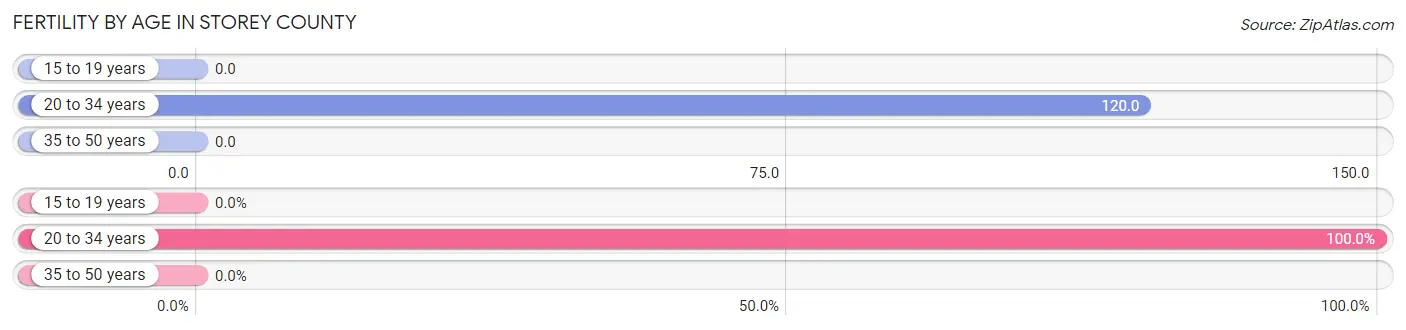
| Age Bracket | Women with Births | Births / 1,000 Women |
| 15 to 19 years | 0 (0.0%) | 0.0 |
| 20 to 34 years | 20 (100.0%) | 120.0 |
| 35 to 50 years | 0 (0.0%) | 0.0 |
| Total | 20 (100.0%) | 35.0 |
Fertility by Age by Marriage Status in Storey County
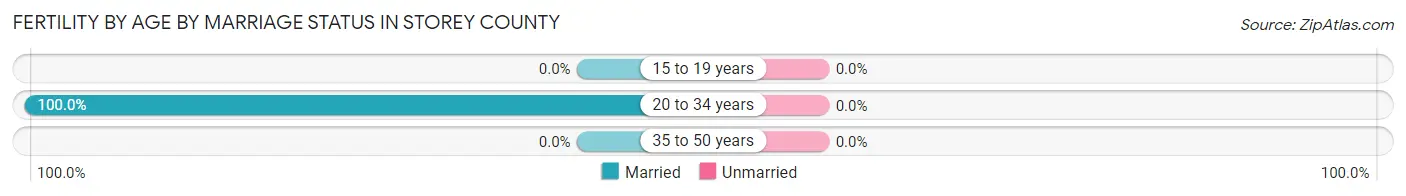
| Age Bracket | Married | Unmarried |
| 15 to 19 years | 0 (0.0%) | 0 (0.0%) |
| 20 to 34 years | 20 (100.0%) | 0 (0.0%) |
| 35 to 50 years | 0 (0.0%) | 0 (0.0%) |
| Total | 20 (100.0%) | 0 (0.0%) |
Fertility by Education in Storey County
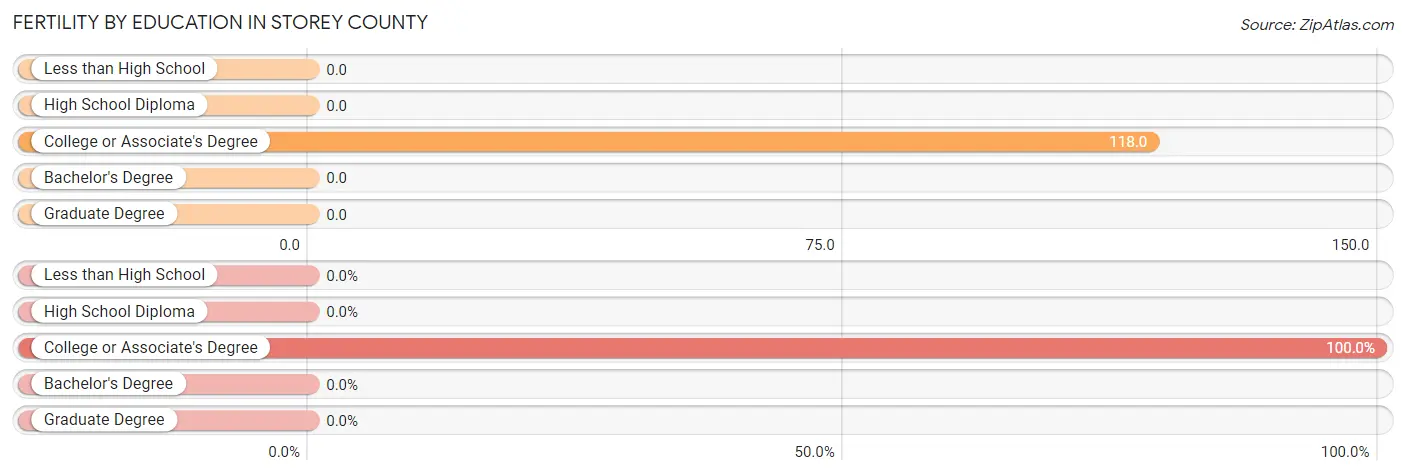
| Educational Attainment | Women with Births | Births / 1,000 Women |
| Less than High School | 0 (0.0%) | 0.0 |
| High School Diploma | 0 (0.0%) | 0.0 |
| College or Associate's Degree | 20 (100.0%) | 118.0 |
| Bachelor's Degree | 0 (0.0%) | 0.0 |
| Graduate Degree | 0 (0.0%) | 0.0 |
| Total | 20 (100.0%) | 35.0 |
Fertility by Education by Marriage Status in Storey County
| Educational Attainment | Married | Unmarried |
| Less than High School | 0 (0.0%) | 0 (0.0%) |
| High School Diploma | 0 (0.0%) | 0 (0.0%) |
| College or Associate's Degree | 20 (100.0%) | 0 (0.0%) |
| Bachelor's Degree | 0 (0.0%) | 0 (0.0%) |
| Graduate Degree | 0 (0.0%) | 0 (0.0%) |
| Total | 20 (100.0%) | 0 (0.0%) |
Employment Characteristics in Storey County
Employment by Class of Employer in Storey County
Among the 1,352 employed individuals in Storey County, private company employees (940 | 69.5%), state government employees (96 | 7.1%), and self-employed (not incorporated) (89 | 6.6%) make up the most common classes of employment.
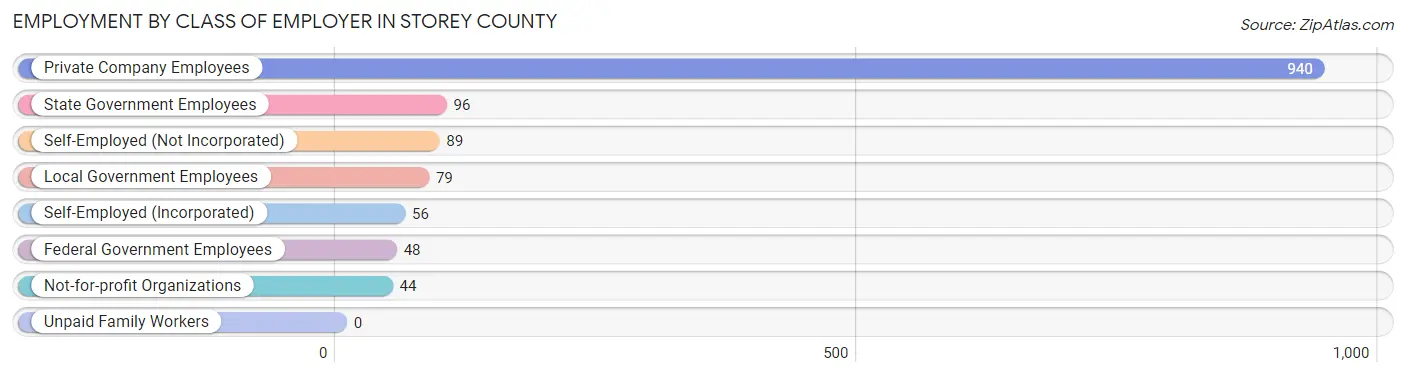
| Employer Class | # Employees | % Employees |
| Private Company Employees | 940 | 69.5% |
| Self-Employed (Incorporated) | 56 | 4.1% |
| Self-Employed (Not Incorporated) | 89 | 6.6% |
| Not-for-profit Organizations | 44 | 3.3% |
| Local Government Employees | 79 | 5.8% |
| State Government Employees | 96 | 7.1% |
| Federal Government Employees | 48 | 3.5% |
| Unpaid Family Workers | 0 | 0.0% |
| Total | 1,352 | 100.0% |
Employment Status by Age in Storey County
According to the labor force statistics for Storey County, out of the total population over 16 years of age (3,513), 41.9% or 1,472 individuals are in the labor force, with 7.0% or 103 of them unemployed. The age group with the highest labor force participation rate is 35 to 44 years, with 88.0% or 228 individuals in the labor force. Within the labor force, the 20 to 24 years age range has the highest percentage of unemployed individuals, with 53.7% or 76 of them being unemployed.
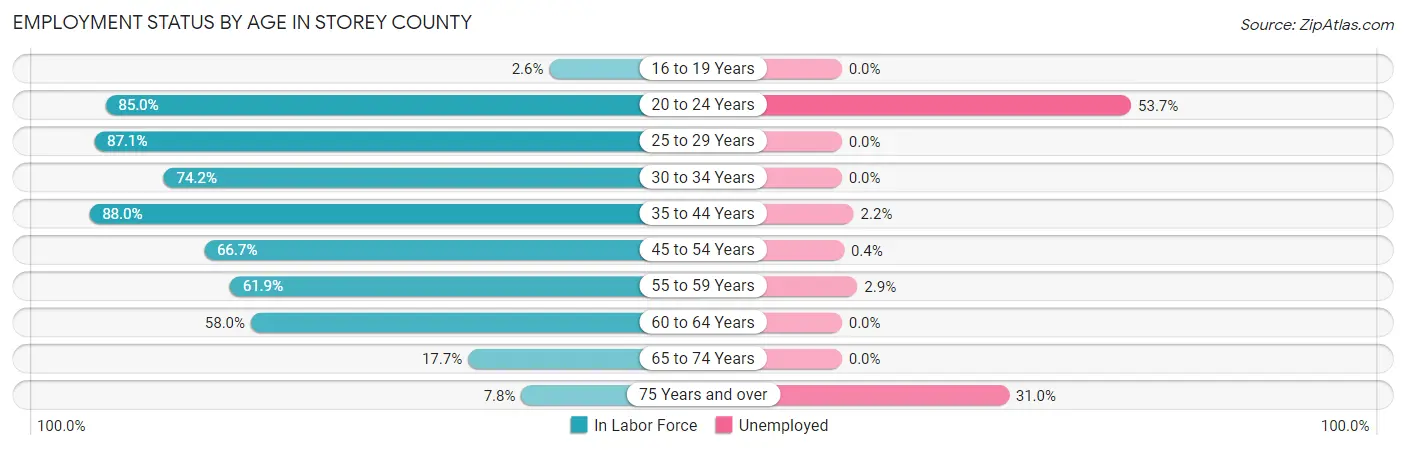
| Age Bracket | In Labor Force | Unemployed |
| 16 to 19 Years | 6 (2.6%) | 0 (0.0%) |
| 20 to 24 Years | 142 (85.0%) | 76 (53.7%) |
| 25 to 29 Years | 155 (87.1%) | 0 (0.0%) |
| 30 to 34 Years | 132 (74.2%) | 0 (0.0%) |
| 35 to 44 Years | 228 (88.0%) | 5 (2.2%) |
| 45 to 54 Years | 285 (66.7%) | 1 (0.4%) |
| 55 to 59 Years | 190 (61.9%) | 6 (2.9%) |
| 60 to 64 Years | 138 (58.0%) | 0 (0.0%) |
| 65 to 74 Years | 139 (17.7%) | 0 (0.0%) |
| 75 Years and over | 58 (7.8%) | 18 (31.0%) |
| Total | 1,472 (41.9%) | 103 (7.0%) |
Employment Status by Educational Attainment in Storey County
According to labor force statistics for Storey County, 71.1% of individuals (1,128) out of the total population between 25 and 64 years of age (1,587) are in the labor force, with 1.0% or 11 of them being unemployed. The group with the highest labor force participation rate are those with the educational attainment of bachelor's degree or higher, with 84.4% or 341 individuals in the labor force. Within the labor force, individuals with bachelor's degree or higher education have the highest percentage of unemployment, with 3.1% or 11 of them being unemployed.
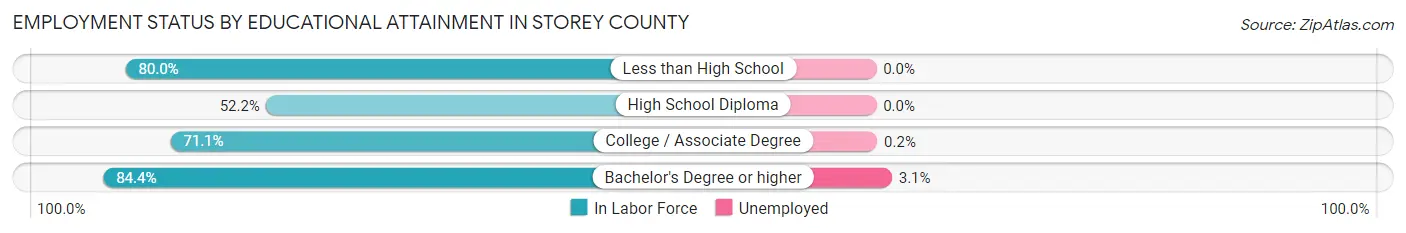
| Educational Attainment | In Labor Force | Unemployed |
| Less than High School | 68 (80.0%) | 0 (0.0%) |
| High School Diploma | 169 (52.2%) | 0 (0.0%) |
| College / Associate Degree | 550 (71.1%) | 2 (0.2%) |
| Bachelor's Degree or higher | 341 (84.4%) | 13 (3.1%) |
| Total | 1,128 (71.1%) | 16 (1.0%) |
Employment Occupations by Sex in Storey County
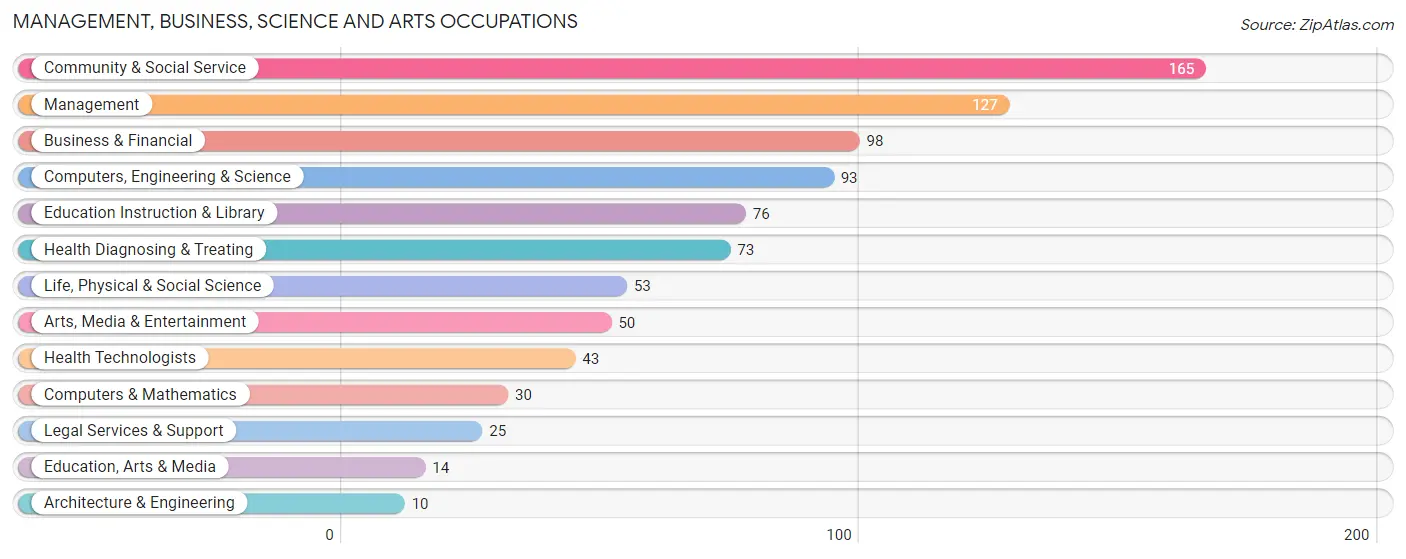
Management, Business, Science and Arts Occupations
The most common Management, Business, Science and Arts occupations in Storey County are Community & Social Service (165 | 12.3%), Management (127 | 9.5%), Business & Financial (98 | 7.3%), Computers, Engineering & Science (93 | 6.9%), and Education Instruction & Library (76 | 5.7%).
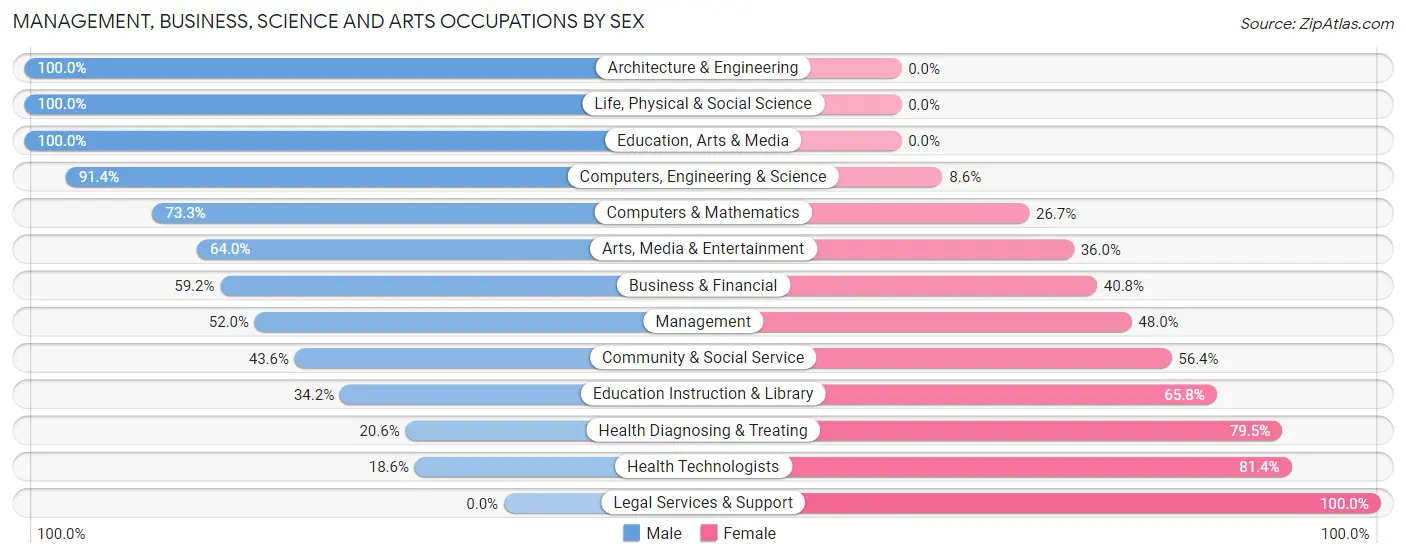
Management, Business, Science and Arts Occupations by Sex
Within the Management, Business, Science and Arts occupations in Storey County, the most male-oriented occupations are Architecture & Engineering (100.0%), Life, Physical & Social Science (100.0%), and Education, Arts & Media (100.0%), while the most female-oriented occupations are Legal Services & Support (100.0%), Health Technologists (81.4%), and Health Diagnosing & Treating (79.4%).
| Occupation | Male | Female |
| Management | 66 (52.0%) | 61 (48.0%) |
| Business & Financial | 58 (59.2%) | 40 (40.8%) |
| Computers, Engineering & Science | 85 (91.4%) | 8 (8.6%) |
| Computers & Mathematics | 22 (73.3%) | 8 (26.7%) |
| Architecture & Engineering | 10 (100.0%) | 0 (0.0%) |
| Life, Physical & Social Science | 53 (100.0%) | 0 (0.0%) |
| Community & Social Service | 72 (43.6%) | 93 (56.4%) |
| Education, Arts & Media | 14 (100.0%) | 0 (0.0%) |
| Legal Services & Support | 0 (0.0%) | 25 (100.0%) |
| Education Instruction & Library | 26 (34.2%) | 50 (65.8%) |
| Arts, Media & Entertainment | 32 (64.0%) | 18 (36.0%) |
| Health Diagnosing & Treating | 15 (20.5%) | 58 (79.4%) |
| Health Technologists | 8 (18.6%) | 35 (81.4%) |
| Total (Category) | 296 (53.2%) | 260 (46.8%) |
| Total (Overall) | 821 (61.1%) | 523 (38.9%) |
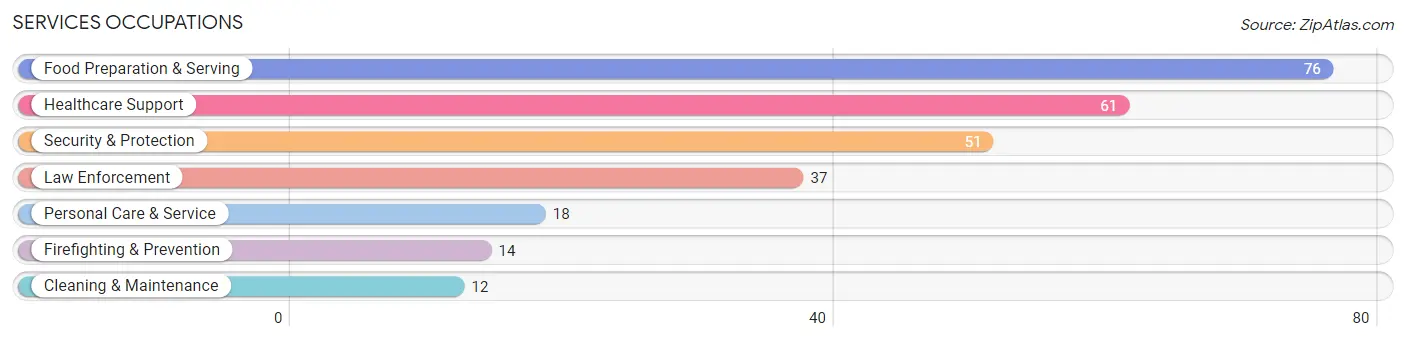
Services Occupations
The most common Services occupations in Storey County are Food Preparation & Serving (76 | 5.7%), Healthcare Support (61 | 4.5%), Security & Protection (51 | 3.8%), Law Enforcement (37 | 2.8%), and Personal Care & Service (18 | 1.3%).
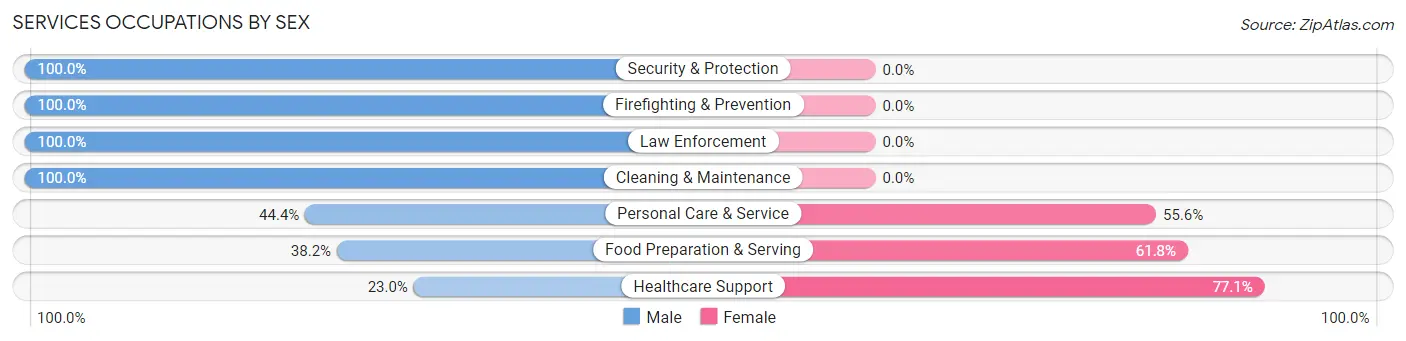
Services Occupations by Sex
Within the Services occupations in Storey County, the most male-oriented occupations are Security & Protection (100.0%), Firefighting & Prevention (100.0%), and Law Enforcement (100.0%), while the most female-oriented occupations are Healthcare Support (77.0%), Food Preparation & Serving (61.8%), and Personal Care & Service (55.6%).
| Occupation | Male | Female |
| Healthcare Support | 14 (23.0%) | 47 (77.0%) |
| Security & Protection | 51 (100.0%) | 0 (0.0%) |
| Firefighting & Prevention | 14 (100.0%) | 0 (0.0%) |
| Law Enforcement | 37 (100.0%) | 0 (0.0%) |
| Food Preparation & Serving | 29 (38.2%) | 47 (61.8%) |
| Cleaning & Maintenance | 12 (100.0%) | 0 (0.0%) |
| Personal Care & Service | 8 (44.4%) | 10 (55.6%) |
| Total (Category) | 114 (52.3%) | 104 (47.7%) |
| Total (Overall) | 821 (61.1%) | 523 (38.9%) |
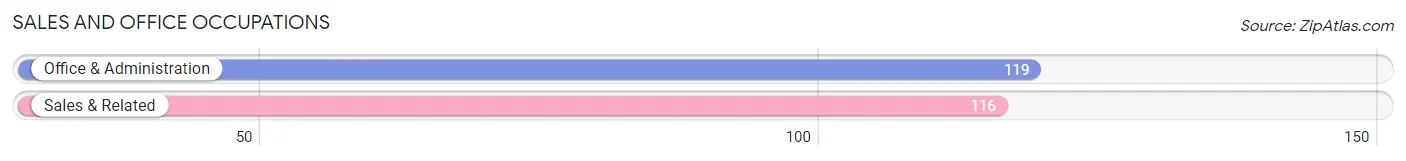
Sales and Office Occupations
The most common Sales and Office occupations in Storey County are Office & Administration (119 | 8.8%), and Sales & Related (116 | 8.6%).
Sales and Office Occupations by Sex
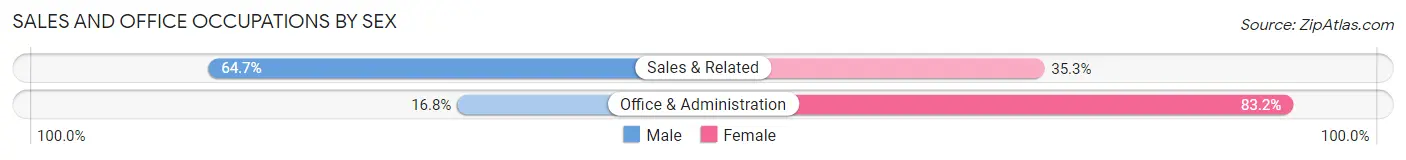
| Occupation | Male | Female |
| Sales & Related | 75 (64.7%) | 41 (35.3%) |
| Office & Administration | 20 (16.8%) | 99 (83.2%) |
| Total (Category) | 95 (40.4%) | 140 (59.6%) |
| Total (Overall) | 821 (61.1%) | 523 (38.9%) |
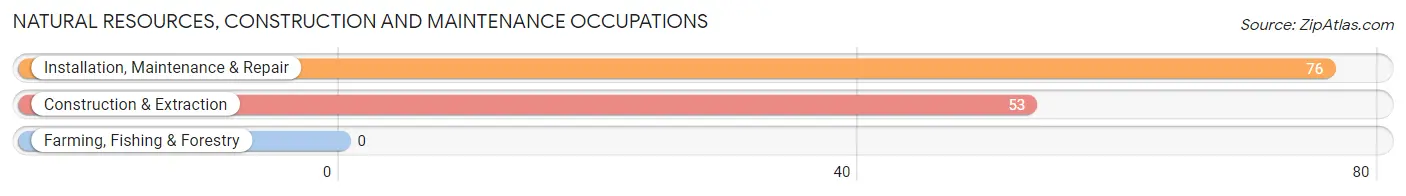
Natural Resources, Construction and Maintenance Occupations
The most common Natural Resources, Construction and Maintenance occupations in Storey County are Installation, Maintenance & Repair (76 | 5.7%), and Construction & Extraction (53 | 3.9%).
Natural Resources, Construction and Maintenance Occupations by Sex
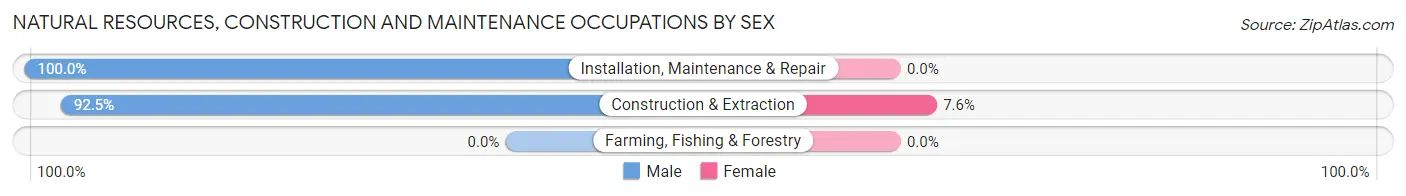
| Occupation | Male | Female |
| Farming, Fishing & Forestry | 0 (0.0%) | 0 (0.0%) |
| Construction & Extraction | 49 (92.4%) | 4 (7.5%) |
| Installation, Maintenance & Repair | 76 (100.0%) | 0 (0.0%) |
| Total (Category) | 125 (96.9%) | 4 (3.1%) |
| Total (Overall) | 821 (61.1%) | 523 (38.9%) |
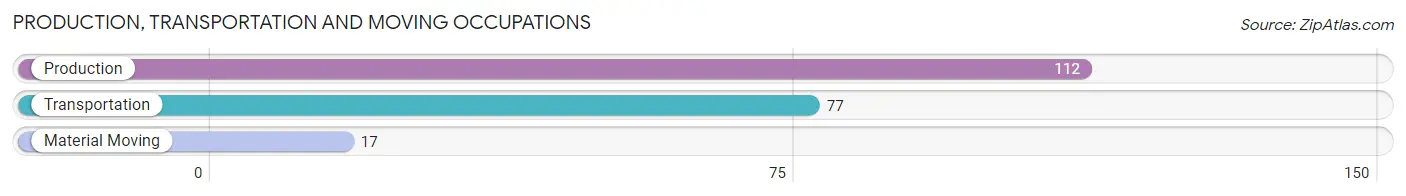
Production, Transportation and Moving Occupations
The most common Production, Transportation and Moving occupations in Storey County are Production (112 | 8.3%), Transportation (77 | 5.7%), and Material Moving (17 | 1.3%).
Production, Transportation and Moving Occupations by Sex
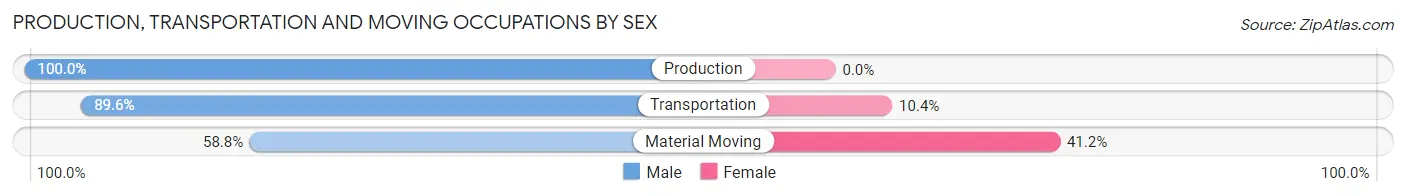
| Occupation | Male | Female |
| Production | 112 (100.0%) | 0 (0.0%) |
| Transportation | 69 (89.6%) | 8 (10.4%) |
| Material Moving | 10 (58.8%) | 7 (41.2%) |
| Total (Category) | 191 (92.7%) | 15 (7.3%) |
| Total (Overall) | 821 (61.1%) | 523 (38.9%) |
Employment Industries by Sex in Storey County
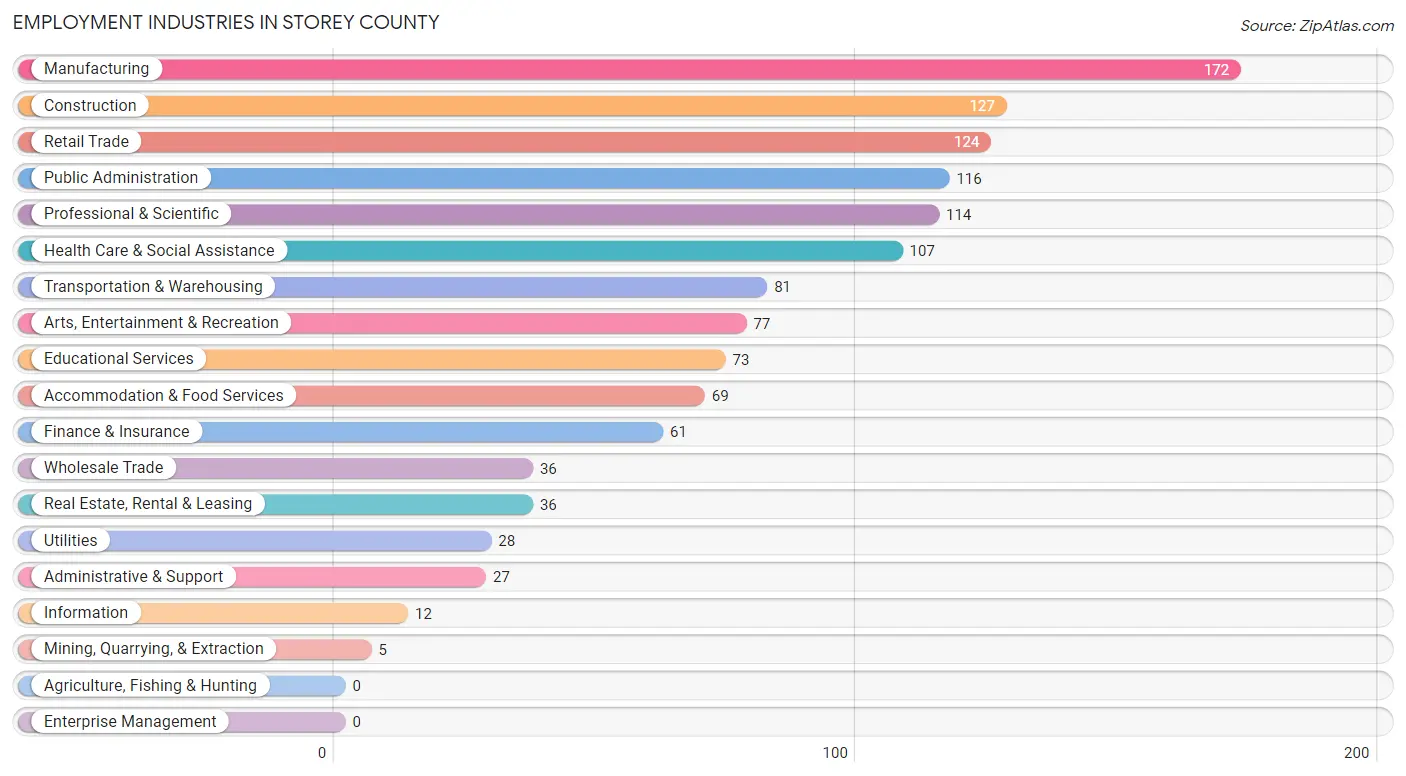
Employment Industries in Storey County
The major employment industries in Storey County include Manufacturing (172 | 12.8%), Construction (127 | 9.5%), Retail Trade (124 | 9.2%), Public Administration (116 | 8.6%), and Professional & Scientific (114 | 8.5%).
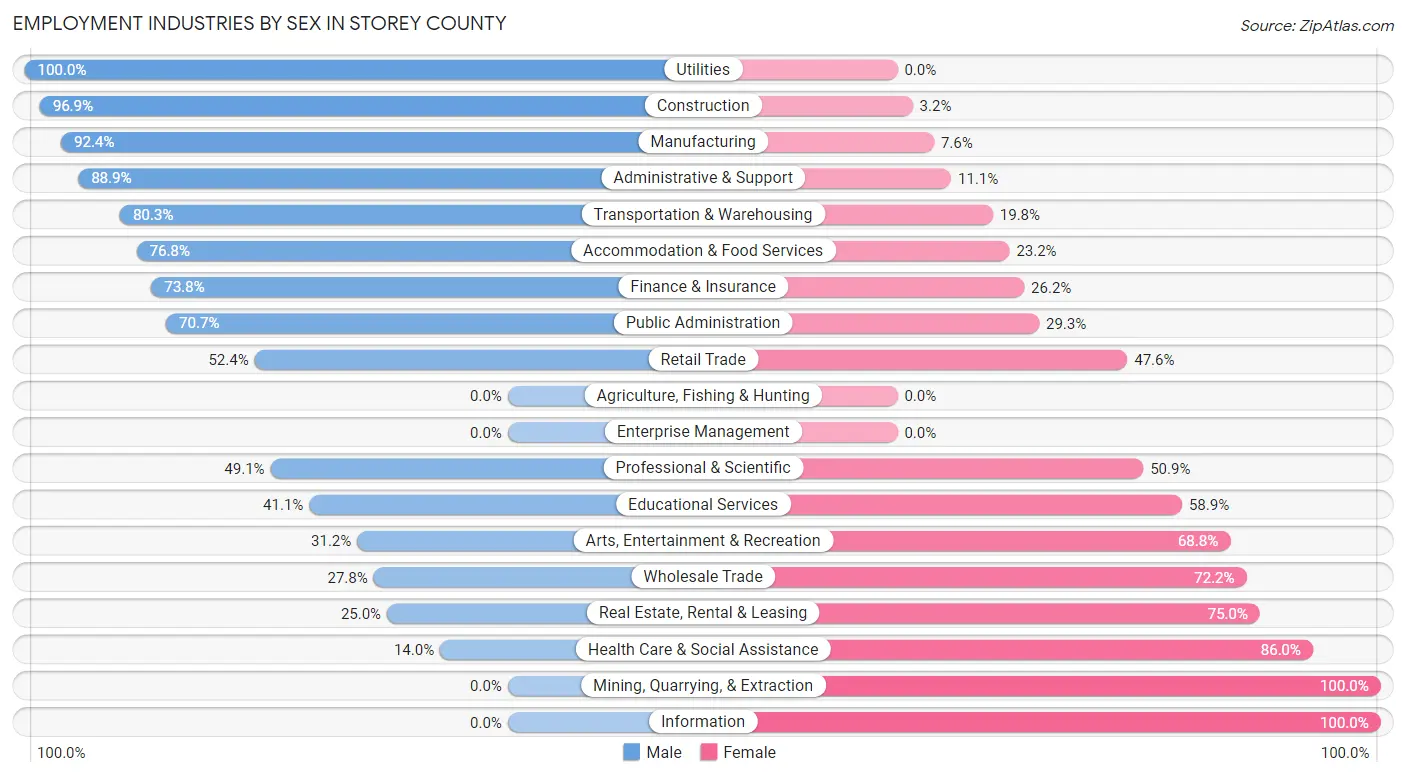
Employment Industries by Sex in Storey County
The Storey County industries that see more men than women are Utilities (100.0%), Construction (96.9%), and Manufacturing (92.4%), whereas the industries that tend to have a higher number of women are Mining, Quarrying, & Extraction (100.0%), Information (100.0%), and Health Care & Social Assistance (86.0%).
| Industry | Male | Female |
| Agriculture, Fishing & Hunting | 0 (0.0%) | 0 (0.0%) |
| Mining, Quarrying, & Extraction | 0 (0.0%) | 5 (100.0%) |
| Construction | 123 (96.9%) | 4 (3.2%) |
| Manufacturing | 159 (92.4%) | 13 (7.6%) |
| Wholesale Trade | 10 (27.8%) | 26 (72.2%) |
| Retail Trade | 65 (52.4%) | 59 (47.6%) |
| Transportation & Warehousing | 65 (80.2%) | 16 (19.8%) |
| Utilities | 28 (100.0%) | 0 (0.0%) |
| Information | 0 (0.0%) | 12 (100.0%) |
| Finance & Insurance | 45 (73.8%) | 16 (26.2%) |
| Real Estate, Rental & Leasing | 9 (25.0%) | 27 (75.0%) |
| Professional & Scientific | 56 (49.1%) | 58 (50.9%) |
| Enterprise Management | 0 (0.0%) | 0 (0.0%) |
| Administrative & Support | 24 (88.9%) | 3 (11.1%) |
| Educational Services | 30 (41.1%) | 43 (58.9%) |
| Health Care & Social Assistance | 15 (14.0%) | 92 (86.0%) |
| Arts, Entertainment & Recreation | 24 (31.2%) | 53 (68.8%) |
| Accommodation & Food Services | 53 (76.8%) | 16 (23.2%) |
| Public Administration | 82 (70.7%) | 34 (29.3%) |
| Total | 821 (61.1%) | 523 (38.9%) |
Education in Storey County
School Enrollment in Storey County
The most common levels of schooling among the 772 students in Storey County are high school (285 | 36.9%), middle school (147 | 19.0%), and elementary school (123 | 15.9%).
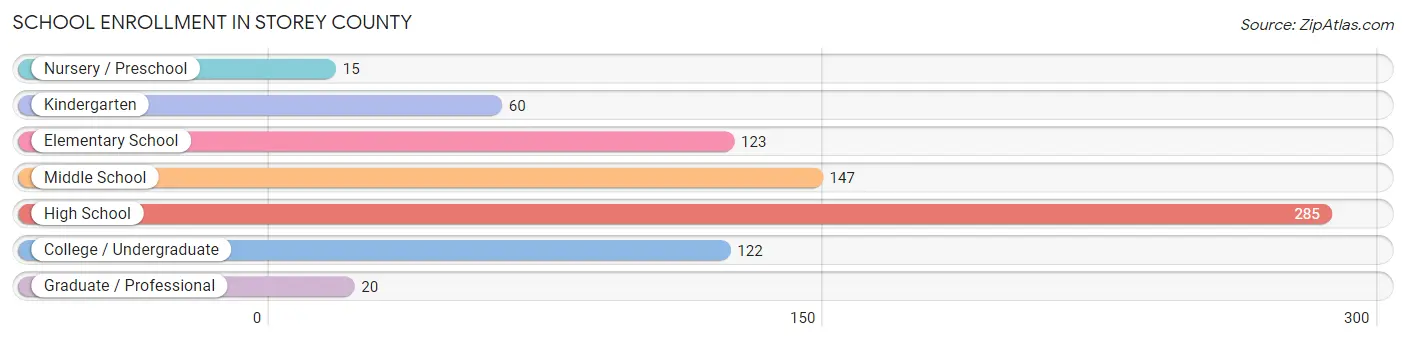
| School Level | # Students | % Students |
| Nursery / Preschool | 15 | 1.9% |
| Kindergarten | 60 | 7.8% |
| Elementary School | 123 | 15.9% |
| Middle School | 147 | 19.0% |
| High School | 285 | 36.9% |
| College / Undergraduate | 122 | 15.8% |
| Graduate / Professional | 20 | 2.6% |
| Total | 772 | 100.0% |
School Enrollment by Age by Funding Source in Storey County
Out of a total of 772 students who are enrolled in schools in Storey County, 190 (24.6%) attend a private institution, while the remaining 582 (75.4%) are enrolled in public schools. The age group of 3 to 4 year olds has the highest likelihood of being enrolled in private schools, with 8 (100.0% in the age bracket) enrolled. Conversely, the age group of 18 to 19 year olds has the lowest likelihood of being enrolled in a private school, with 151 (100.0% in the age bracket) attending a public institution.
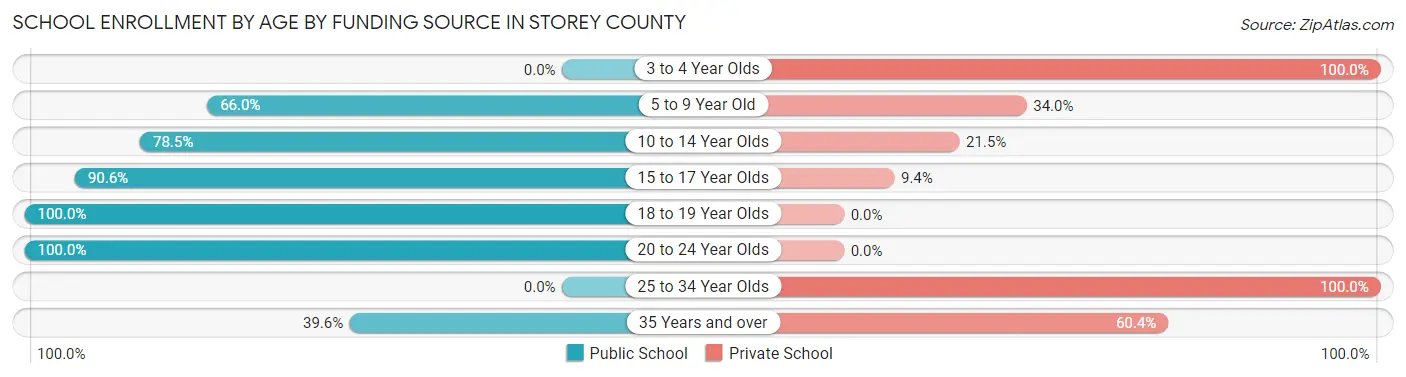
| Age Bracket | Public School | Private School |
| 3 to 4 Year Olds | 0 (0.0%) | 8 (100.0%) |
| 5 to 9 Year Old | 128 (66.0%) | 66 (34.0%) |
| 10 to 14 Year Olds | 135 (78.5%) | 37 (21.5%) |
| 15 to 17 Year Olds | 116 (90.6%) | 12 (9.4%) |
| 18 to 19 Year Olds | 151 (100.0%) | 0 (0.0%) |
| 20 to 24 Year Olds | 16 (100.0%) | 0 (0.0%) |
| 25 to 34 Year Olds | 0 (0.0%) | 12 (100.0%) |
| 35 Years and over | 36 (39.6%) | 55 (60.4%) |
| Total | 582 (75.4%) | 190 (24.6%) |
Educational Attainment by Field of Study in Storey County
Business (161 | 15.6%), social sciences (122 | 11.8%), education (114 | 11.0%), science & technology (110 | 10.6%), and physical & health sciences (103 | 10.0%) are the most common fields of study among 1,035 individuals in Storey County who have obtained a bachelor's degree or higher.
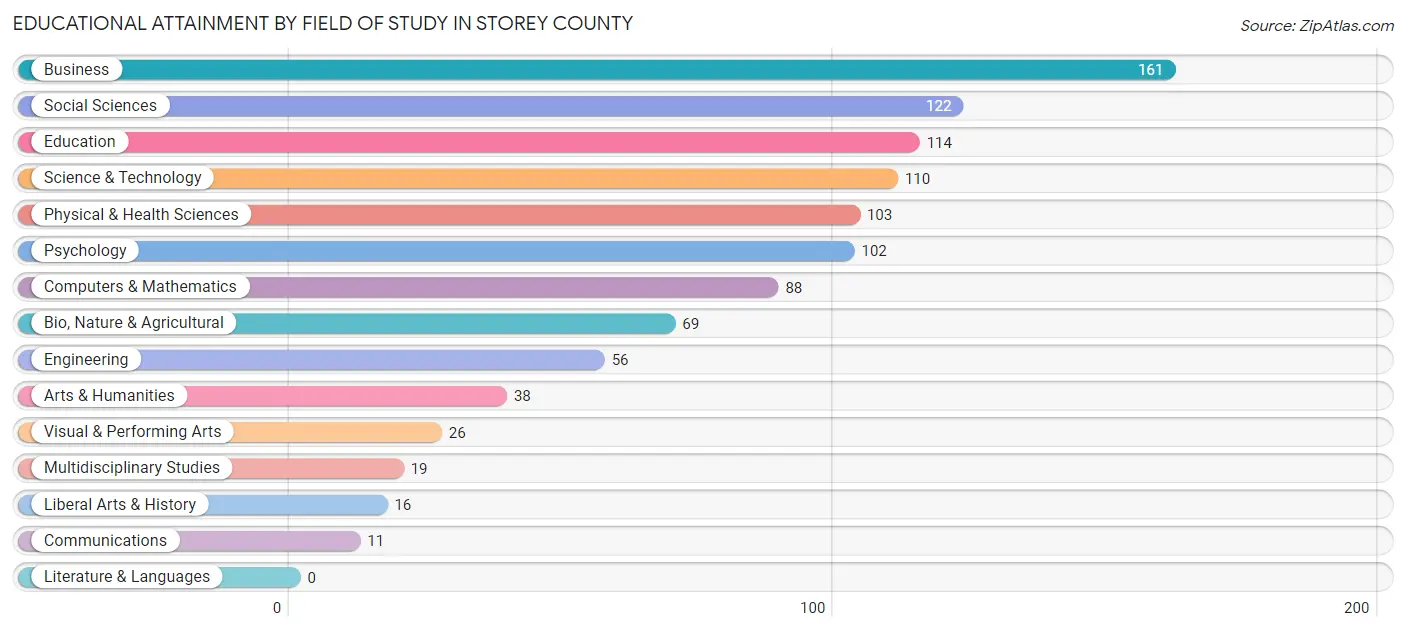
| Field of Study | # Graduates | % Graduates |
| Computers & Mathematics | 88 | 8.5% |
| Bio, Nature & Agricultural | 69 | 6.7% |
| Physical & Health Sciences | 103 | 10.0% |
| Psychology | 102 | 9.9% |
| Social Sciences | 122 | 11.8% |
| Engineering | 56 | 5.4% |
| Multidisciplinary Studies | 19 | 1.8% |
| Science & Technology | 110 | 10.6% |
| Business | 161 | 15.6% |
| Education | 114 | 11.0% |
| Literature & Languages | 0 | 0.0% |
| Liberal Arts & History | 16 | 1.5% |
| Visual & Performing Arts | 26 | 2.5% |
| Communications | 11 | 1.1% |
| Arts & Humanities | 38 | 3.7% |
| Total | 1,035 | 100.0% |
Transportation & Commute in Storey County
Vehicle Availability by Sex in Storey County
The most prevalent vehicle ownership categories in Storey County are males with 3 vehicles (251, accounting for 30.5%) and females with 3 vehicles (112, making up 48.0%).
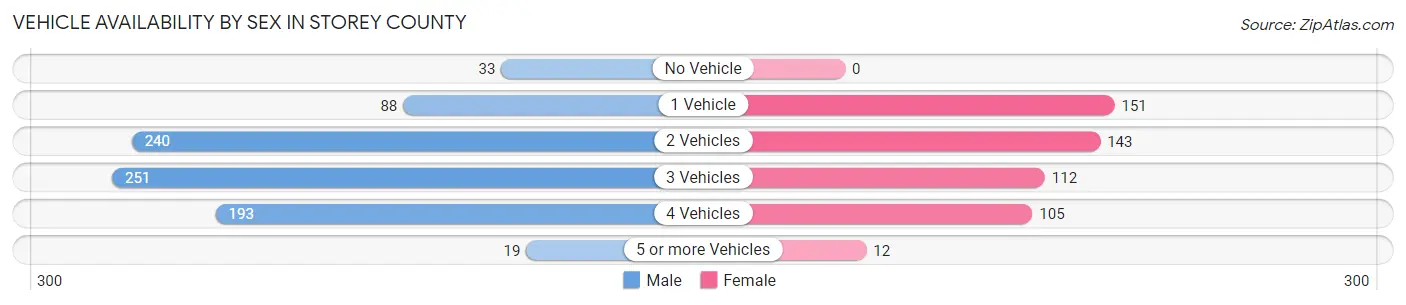
| Vehicles Available | Male | Female |
| No Vehicle | 33 (4.0%) | 0 (0.0%) |
| 1 Vehicle | 88 (10.7%) | 151 (28.9%) |
| 2 Vehicles | 240 (29.1%) | 143 (27.3%) |
| 3 Vehicles | 251 (30.5%) | 112 (21.4%) |
| 4 Vehicles | 193 (23.4%) | 105 (20.1%) |
| 5 or more Vehicles | 19 (2.3%) | 12 (2.3%) |
| Total | 824 (100.0%) | 523 (100.0%) |
Commute Time in Storey County
The most frequently occuring commute durations in Storey County are 15 to 19 minutes (229 commuters, 18.9%), 30 to 34 minutes (200 commuters, 16.5%), and 45 to 59 minutes (162 commuters, 13.4%).
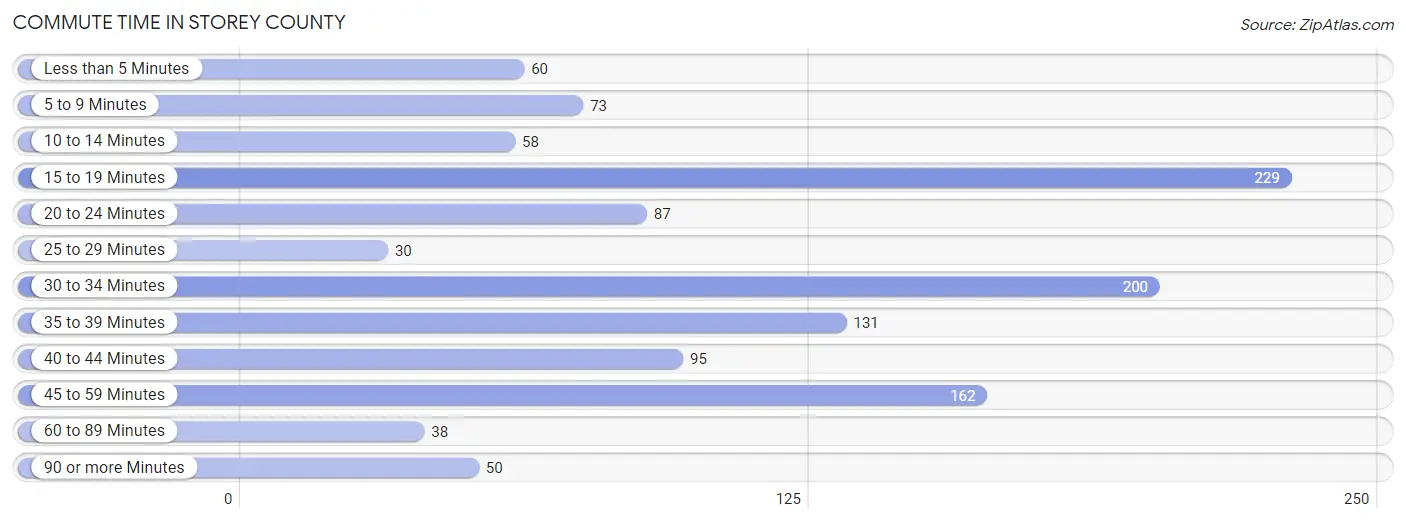
| Commute Time | # Commuters | % Commuters |
| Less than 5 Minutes | 60 | 5.0% |
| 5 to 9 Minutes | 73 | 6.0% |
| 10 to 14 Minutes | 58 | 4.8% |
| 15 to 19 Minutes | 229 | 18.9% |
| 20 to 24 Minutes | 87 | 7.2% |
| 25 to 29 Minutes | 30 | 2.5% |
| 30 to 34 Minutes | 200 | 16.5% |
| 35 to 39 Minutes | 131 | 10.8% |
| 40 to 44 Minutes | 95 | 7.8% |
| 45 to 59 Minutes | 162 | 13.4% |
| 60 to 89 Minutes | 38 | 3.1% |
| 90 or more Minutes | 50 | 4.1% |
Commute Time by Sex in Storey County
The most common commute times in Storey County are 15 to 19 minutes (145 commuters, 19.4%) for males and 30 to 34 minutes (105 commuters, 22.5%) for females.
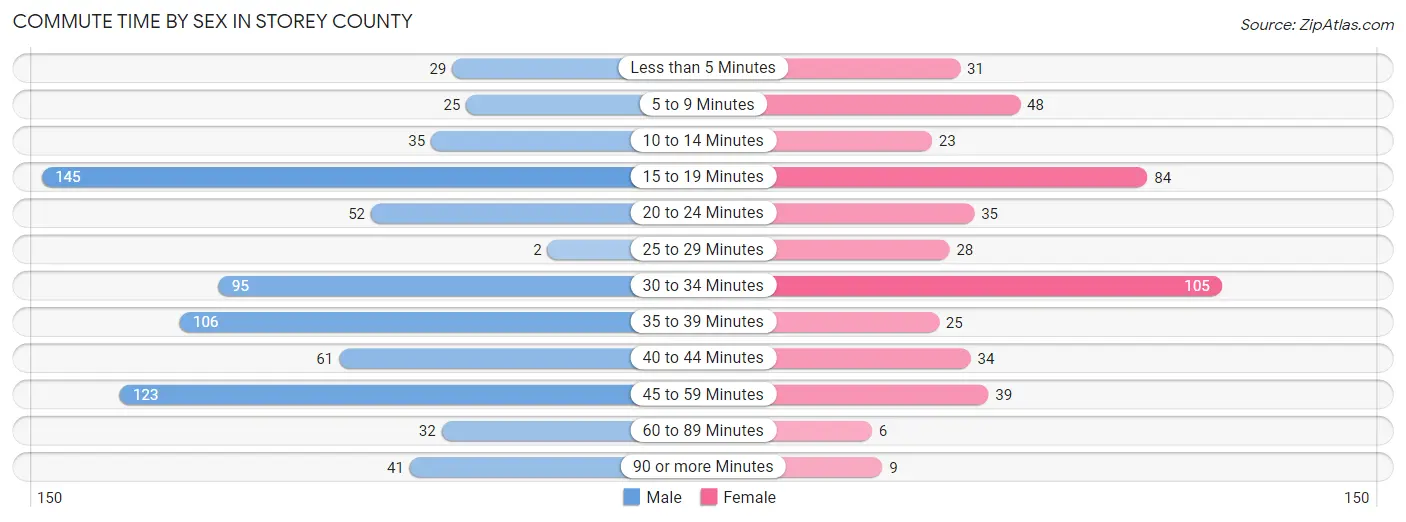
| Commute Time | Male | Female |
| Less than 5 Minutes | 29 (3.9%) | 31 (6.6%) |
| 5 to 9 Minutes | 25 (3.4%) | 48 (10.3%) |
| 10 to 14 Minutes | 35 (4.7%) | 23 (4.9%) |
| 15 to 19 Minutes | 145 (19.4%) | 84 (18.0%) |
| 20 to 24 Minutes | 52 (7.0%) | 35 (7.5%) |
| 25 to 29 Minutes | 2 (0.3%) | 28 (6.0%) |
| 30 to 34 Minutes | 95 (12.7%) | 105 (22.5%) |
| 35 to 39 Minutes | 106 (14.2%) | 25 (5.3%) |
| 40 to 44 Minutes | 61 (8.2%) | 34 (7.3%) |
| 45 to 59 Minutes | 123 (16.5%) | 39 (8.4%) |
| 60 to 89 Minutes | 32 (4.3%) | 6 (1.3%) |
| 90 or more Minutes | 41 (5.5%) | 9 (1.9%) |
Time of Departure to Work by Sex in Storey County
The most frequent times of departure to work in Storey County are 4:00 PM to 11:59 PM (123, 16.5%) for males and 7:00 AM to 7:29 AM (120, 25.7%) for females.
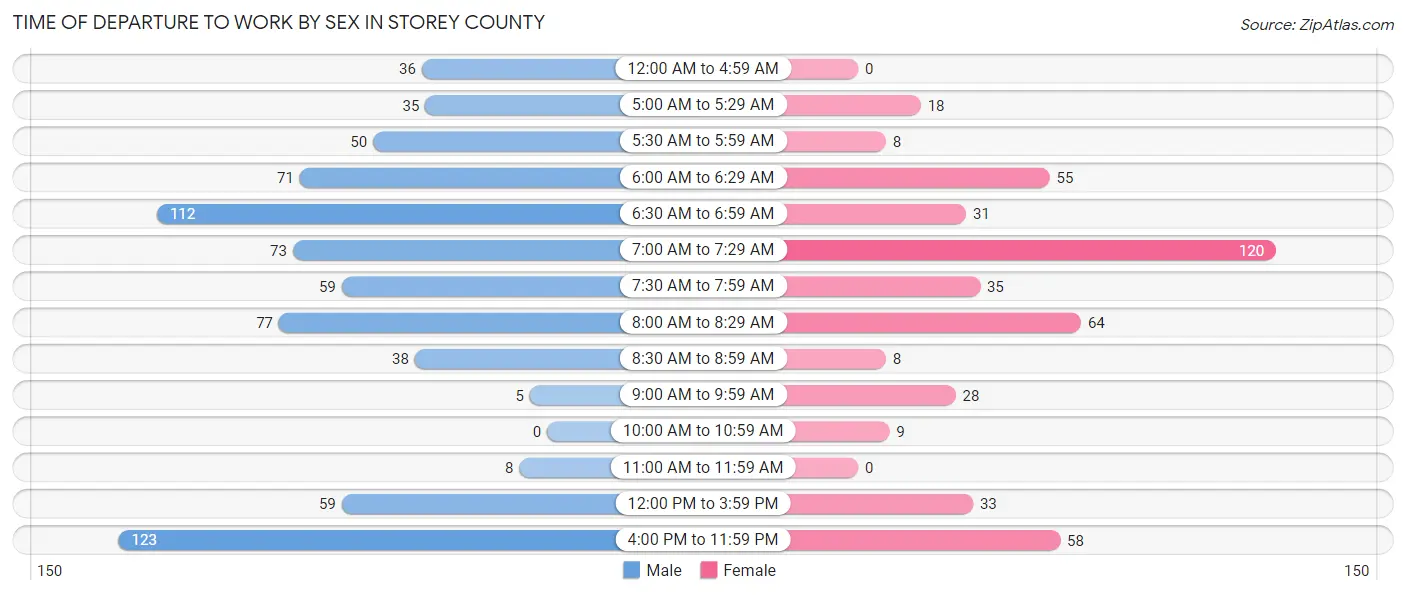
| Time of Departure | Male | Female |
| 12:00 AM to 4:59 AM | 36 (4.8%) | 0 (0.0%) |
| 5:00 AM to 5:29 AM | 35 (4.7%) | 18 (3.8%) |
| 5:30 AM to 5:59 AM | 50 (6.7%) | 8 (1.7%) |
| 6:00 AM to 6:29 AM | 71 (9.5%) | 55 (11.8%) |
| 6:30 AM to 6:59 AM | 112 (15.0%) | 31 (6.6%) |
| 7:00 AM to 7:29 AM | 73 (9.8%) | 120 (25.7%) |
| 7:30 AM to 7:59 AM | 59 (7.9%) | 35 (7.5%) |
| 8:00 AM to 8:29 AM | 77 (10.3%) | 64 (13.7%) |
| 8:30 AM to 8:59 AM | 38 (5.1%) | 8 (1.7%) |
| 9:00 AM to 9:59 AM | 5 (0.7%) | 28 (6.0%) |
| 10:00 AM to 10:59 AM | 0 (0.0%) | 9 (1.9%) |
| 11:00 AM to 11:59 AM | 8 (1.1%) | 0 (0.0%) |
| 12:00 PM to 3:59 PM | 59 (7.9%) | 33 (7.1%) |
| 4:00 PM to 11:59 PM | 123 (16.5%) | 58 (12.4%) |
| Total | 746 (100.0%) | 467 (100.0%) |
Housing Occupancy in Storey County
Occupancy by Ownership in Storey County
Of the total 1,692 dwellings in Storey County, owner-occupied units account for 1,641 (97.0%), while renter-occupied units make up 51 (3.0%).
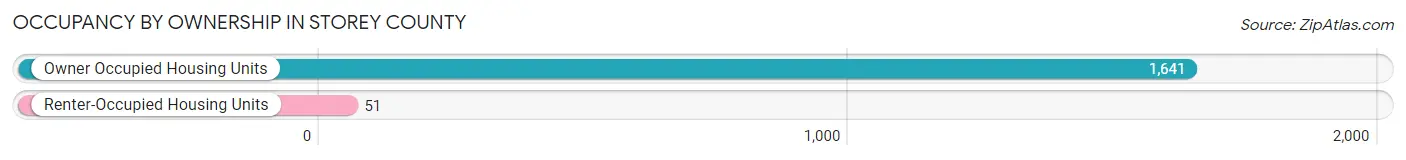
| Occupancy | # Housing Units | % Housing Units |
| Owner Occupied Housing Units | 1,641 | 97.0% |
| Renter-Occupied Housing Units | 51 | 3.0% |
| Total Occupied Housing Units | 1,692 | 100.0% |
Occupancy by Household Size in Storey County
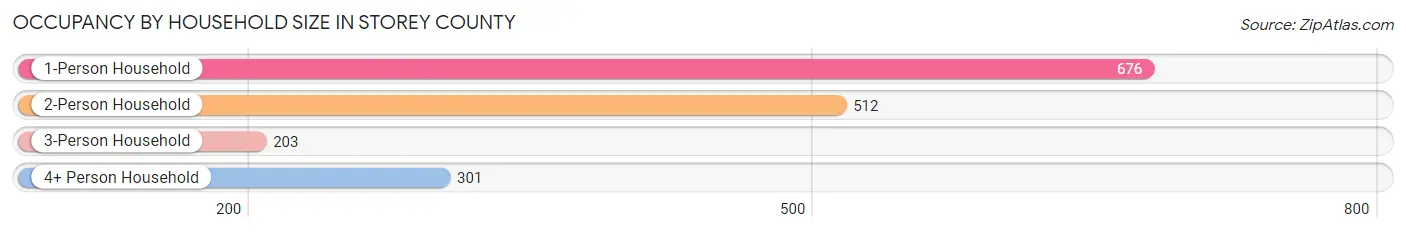
| Household Size | # Housing Units | % Housing Units |
| 1-Person Household | 676 | 40.0% |
| 2-Person Household | 512 | 30.3% |
| 3-Person Household | 203 | 12.0% |
| 4+ Person Household | 301 | 17.8% |
| Total Housing Units | 1,692 | 100.0% |
Occupancy by Ownership by Household Size in Storey County
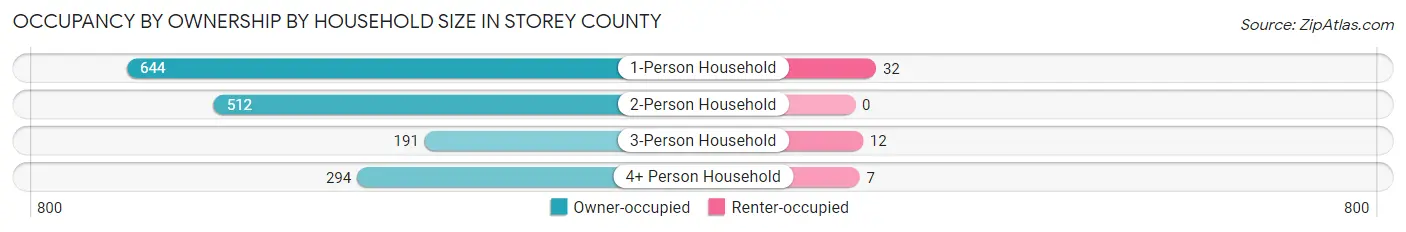
| Household Size | Owner-occupied | Renter-occupied |
| 1-Person Household | 644 (95.3%) | 32 (4.7%) |
| 2-Person Household | 512 (100.0%) | 0 (0.0%) |
| 3-Person Household | 191 (94.1%) | 12 (5.9%) |
| 4+ Person Household | 294 (97.7%) | 7 (2.3%) |
| Total Housing Units | 1,641 (97.0%) | 51 (3.0%) |
Occupancy by Educational Attainment in Storey County
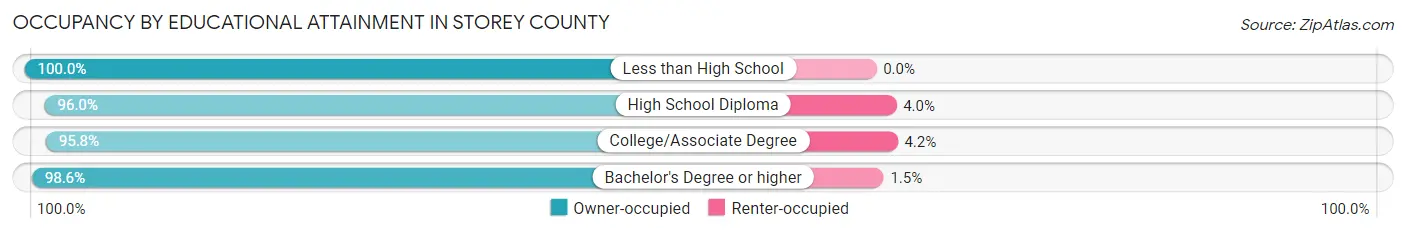
| Household Size | Owner-occupied | Renter-occupied |
| Less than High School | 61 (100.0%) | 0 (0.0%) |
| High School Diploma | 241 (96.0%) | 10 (4.0%) |
| College/Associate Degree | 726 (95.8%) | 32 (4.2%) |
| Bachelor's Degree or higher | 613 (98.6%) | 9 (1.5%) |
Occupancy by Age of Householder in Storey County
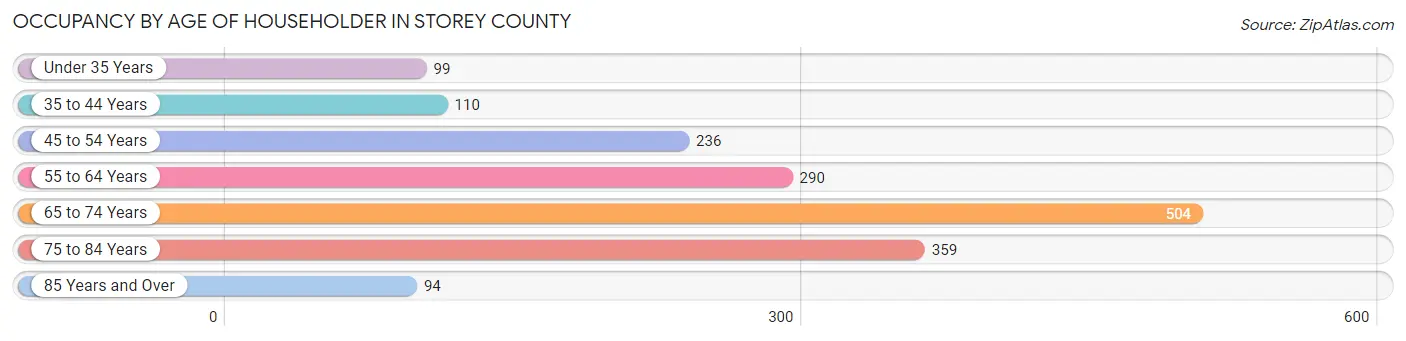
| Age Bracket | # Households | % Households |
| Under 35 Years | 99 | 5.9% |
| 35 to 44 Years | 110 | 6.5% |
| 45 to 54 Years | 236 | 14.0% |
| 55 to 64 Years | 290 | 17.1% |
| 65 to 74 Years | 504 | 29.8% |
| 75 to 84 Years | 359 | 21.2% |
| 85 Years and Over | 94 | 5.6% |
| Total | 1,692 | 100.0% |
Housing Finances in Storey County
Median Income by Occupancy in Storey County
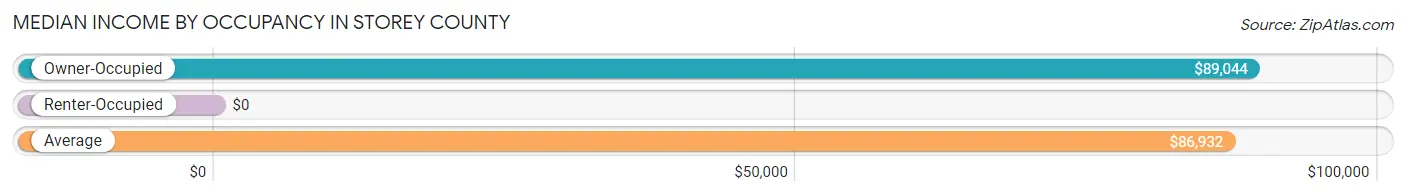
| Occupancy Type | # Households | Median Income |
| Owner-Occupied | 1,641 (97.0%) | $89,044 |
| Renter-Occupied | 51 (3.0%) | $0 |
| Average | 1,692 (100.0%) | $86,932 |
Occupancy by Householder Income Bracket in Storey County
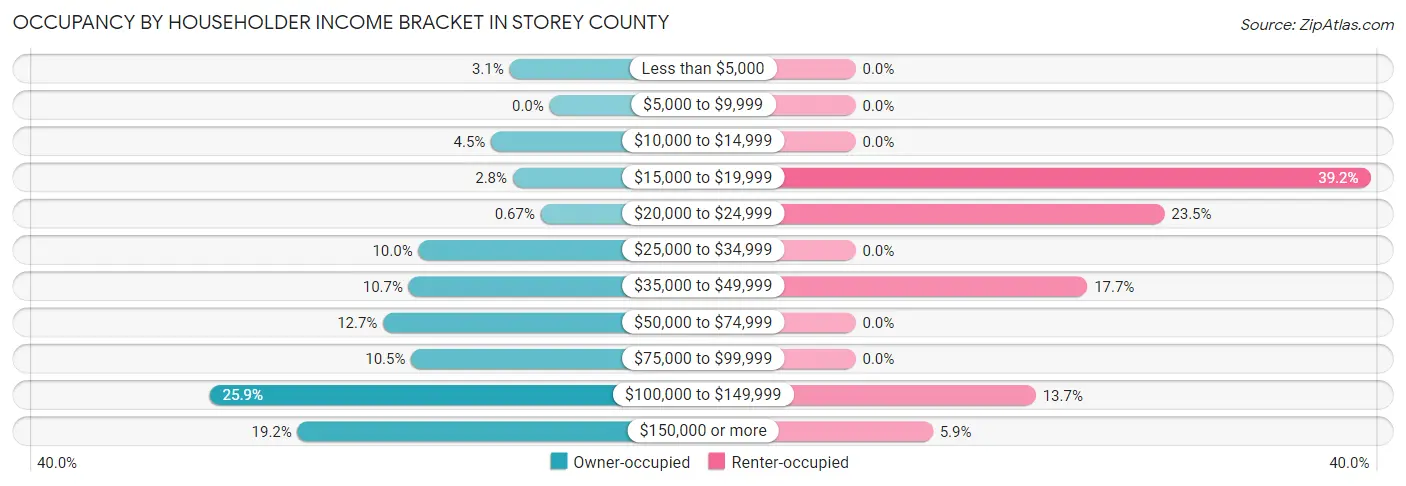
| Income Bracket | Owner-occupied | Renter-occupied |
| Less than $5,000 | 50 (3.0%) | 0 (0.0%) |
| $5,000 to $9,999 | 0 (0.0%) | 0 (0.0%) |
| $10,000 to $14,999 | 73 (4.4%) | 0 (0.0%) |
| $15,000 to $19,999 | 46 (2.8%) | 20 (39.2%) |
| $20,000 to $24,999 | 11 (0.7%) | 12 (23.5%) |
| $25,000 to $34,999 | 164 (10.0%) | 0 (0.0%) |
| $35,000 to $49,999 | 176 (10.7%) | 9 (17.6%) |
| $50,000 to $74,999 | 208 (12.7%) | 0 (0.0%) |
| $75,000 to $99,999 | 173 (10.5%) | 0 (0.0%) |
| $100,000 to $149,999 | 425 (25.9%) | 7 (13.7%) |
| $150,000 or more | 315 (19.2%) | 3 (5.9%) |
| Total | 1,641 (100.0%) | 51 (100.0%) |
Monthly Housing Cost Tiers in Storey County
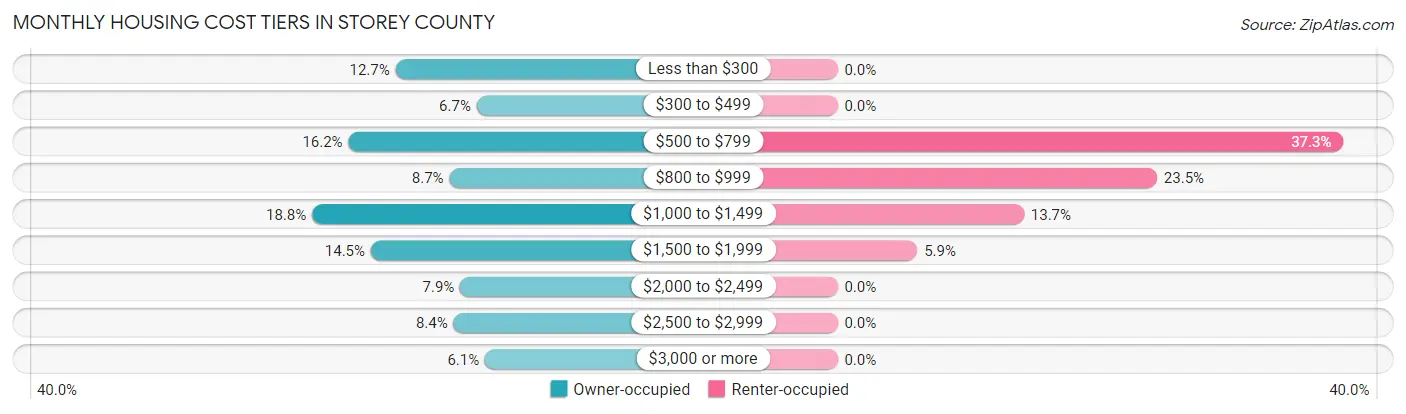
| Monthly Cost | Owner-occupied | Renter-occupied |
| Less than $300 | 208 (12.7%) | 0 (0.0%) |
| $300 to $499 | 110 (6.7%) | 0 (0.0%) |
| $500 to $799 | 265 (16.2%) | 19 (37.2%) |
| $800 to $999 | 143 (8.7%) | 12 (23.5%) |
| $1,000 to $1,499 | 309 (18.8%) | 7 (13.7%) |
| $1,500 to $1,999 | 238 (14.5%) | 3 (5.9%) |
| $2,000 to $2,499 | 130 (7.9%) | 0 (0.0%) |
| $2,500 to $2,999 | 138 (8.4%) | 0 (0.0%) |
| $3,000 or more | 100 (6.1%) | 0 (0.0%) |
| Total | 1,641 (100.0%) | 51 (100.0%) |
Physical Housing Characteristics in Storey County
Housing Structures in Storey County
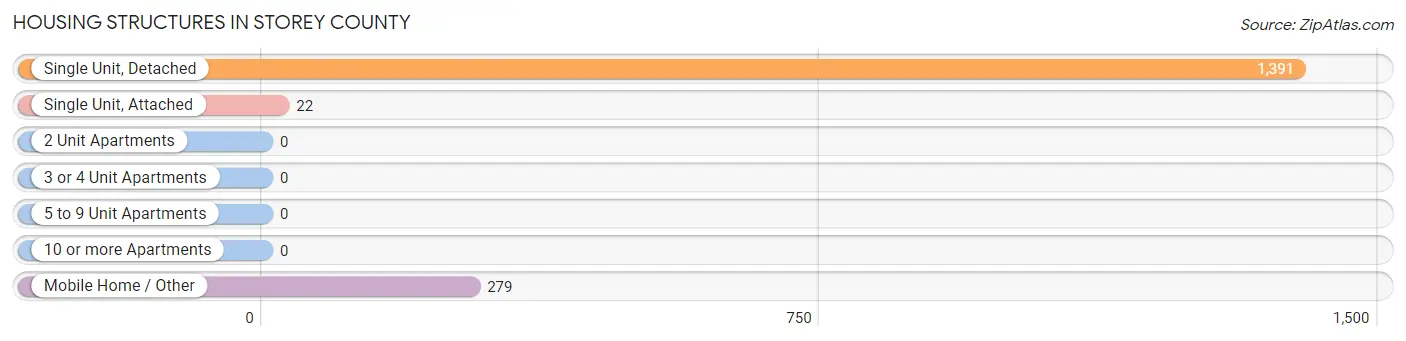
| Structure Type | # Housing Units | % Housing Units |
| Single Unit, Detached | 1,391 | 82.2% |
| Single Unit, Attached | 22 | 1.3% |
| 2 Unit Apartments | 0 | 0.0% |
| 3 or 4 Unit Apartments | 0 | 0.0% |
| 5 to 9 Unit Apartments | 0 | 0.0% |
| 10 or more Apartments | 0 | 0.0% |
| Mobile Home / Other | 279 | 16.5% |
| Total | 1,692 | 100.0% |
Housing Structures by Occupancy in Storey County
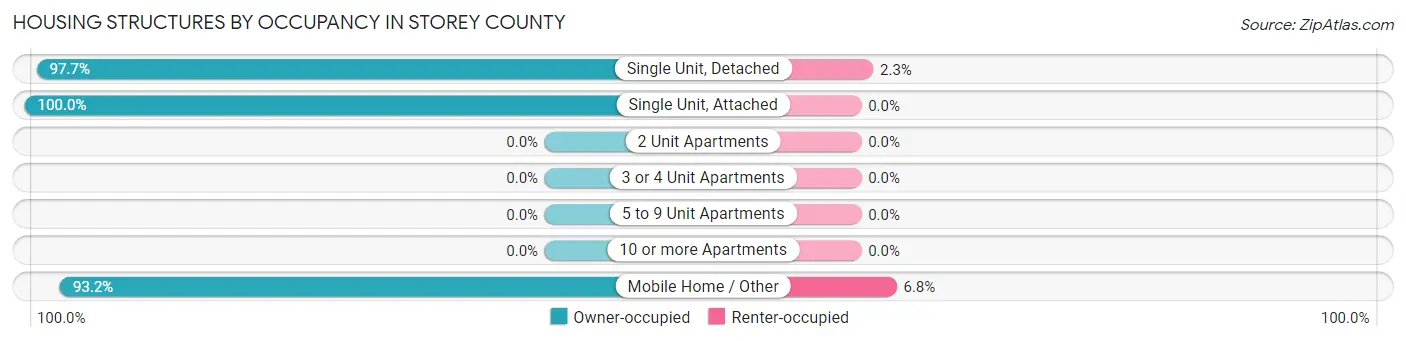
| Structure Type | Owner-occupied | Renter-occupied |
| Single Unit, Detached | 1,359 (97.7%) | 32 (2.3%) |
| Single Unit, Attached | 22 (100.0%) | 0 (0.0%) |
| 2 Unit Apartments | 0 (0.0%) | 0 (0.0%) |
| 3 or 4 Unit Apartments | 0 (0.0%) | 0 (0.0%) |
| 5 to 9 Unit Apartments | 0 (0.0%) | 0 (0.0%) |
| 10 or more Apartments | 0 (0.0%) | 0 (0.0%) |
| Mobile Home / Other | 260 (93.2%) | 19 (6.8%) |
| Total | 1,641 (97.0%) | 51 (3.0%) |
Housing Structures by Number of Rooms in Storey County
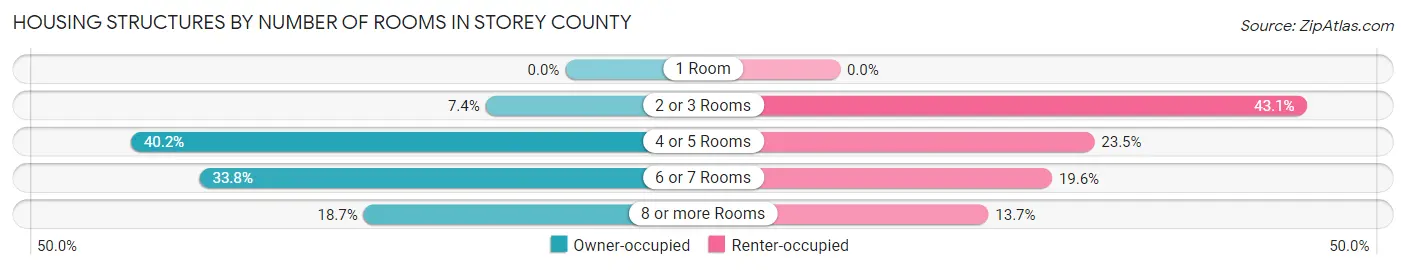
| Number of Rooms | Owner-occupied | Renter-occupied |
| 1 Room | 0 (0.0%) | 0 (0.0%) |
| 2 or 3 Rooms | 121 (7.4%) | 22 (43.1%) |
| 4 or 5 Rooms | 659 (40.2%) | 12 (23.5%) |
| 6 or 7 Rooms | 555 (33.8%) | 10 (19.6%) |
| 8 or more Rooms | 306 (18.6%) | 7 (13.7%) |
| Total | 1,641 (100.0%) | 51 (100.0%) |
Housing Structure by Heating Type in Storey County
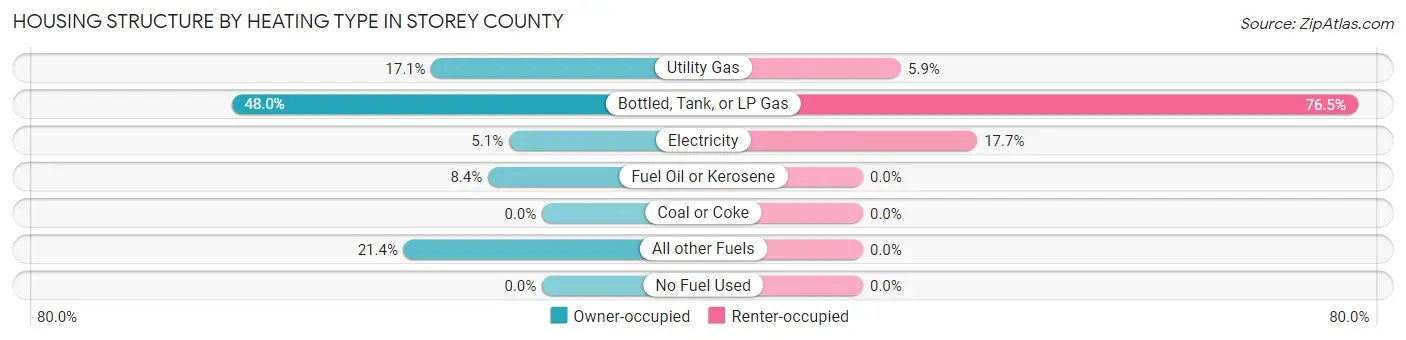
| Heating Type | Owner-occupied | Renter-occupied |
| Utility Gas | 281 (17.1%) | 3 (5.9%) |
| Bottled, Tank, or LP Gas | 788 (48.0%) | 39 (76.5%) |
| Electricity | 84 (5.1%) | 9 (17.6%) |
| Fuel Oil or Kerosene | 137 (8.4%) | 0 (0.0%) |
| Coal or Coke | 0 (0.0%) | 0 (0.0%) |
| All other Fuels | 351 (21.4%) | 0 (0.0%) |
| No Fuel Used | 0 (0.0%) | 0 (0.0%) |
| Total | 1,641 (100.0%) | 51 (100.0%) |
Household Vehicle Usage in Storey County
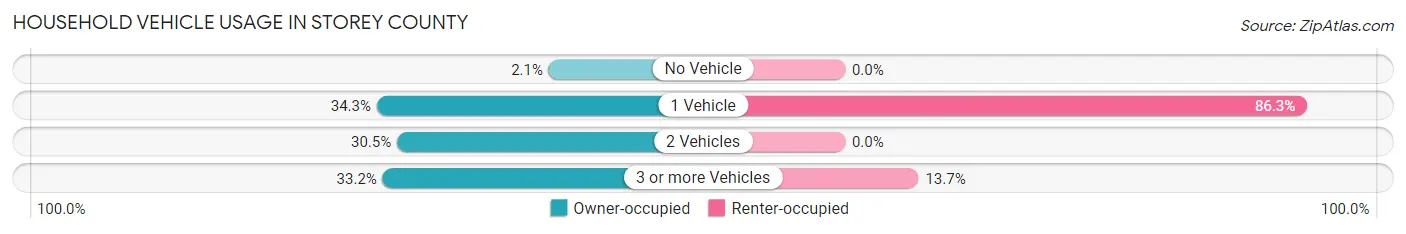
| Vehicles per Household | Owner-occupied | Renter-occupied |
| No Vehicle | 35 (2.1%) | 0 (0.0%) |
| 1 Vehicle | 562 (34.3%) | 44 (86.3%) |
| 2 Vehicles | 500 (30.5%) | 0 (0.0%) |
| 3 or more Vehicles | 544 (33.2%) | 7 (13.7%) |
| Total | 1,641 (100.0%) | 51 (100.0%) |
Real Estate & Mortgages in Storey County
Real Estate and Mortgage Overview in Storey County
| Characteristic | Without Mortgage | With Mortgage |
| Housing Units | 532 | 1,109 |
| Median Property Value | $294,200 | $299,000 |
| Median Household Income | - | - |
| Monthly Housing Costs | $417 | $100 |
| Real Estate Taxes | $1,454 | $21 |
Property Value by Mortgage Status in Storey County
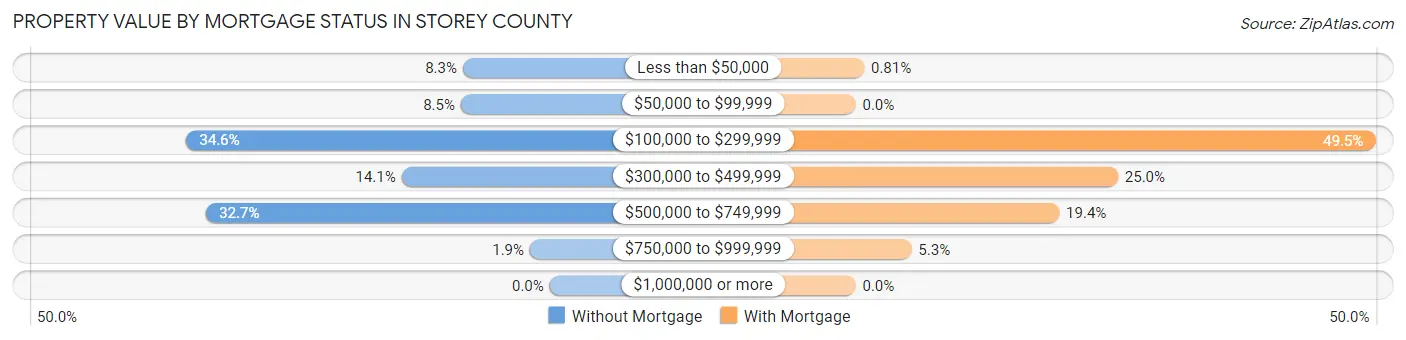
| Property Value | Without Mortgage | With Mortgage |
| Less than $50,000 | 44 (8.3%) | 9 (0.8%) |
| $50,000 to $99,999 | 45 (8.5%) | 0 (0.0%) |
| $100,000 to $299,999 | 184 (34.6%) | 549 (49.5%) |
| $300,000 to $499,999 | 75 (14.1%) | 277 (25.0%) |
| $500,000 to $749,999 | 174 (32.7%) | 215 (19.4%) |
| $750,000 to $999,999 | 10 (1.9%) | 59 (5.3%) |
| $1,000,000 or more | 0 (0.0%) | 0 (0.0%) |
| Total | 532 (100.0%) | 1,109 (100.0%) |
Household Income by Mortgage Status in Storey County
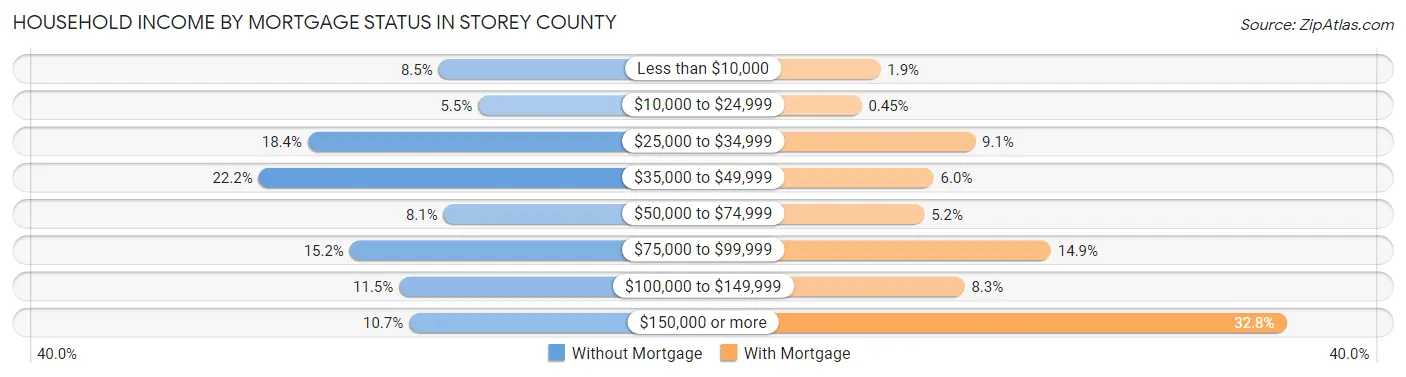
| Household Income | Without Mortgage | With Mortgage |
| Less than $10,000 | 45 (8.5%) | 21 (1.9%) |
| $10,000 to $24,999 | 29 (5.4%) | 5 (0.4%) |
| $25,000 to $34,999 | 98 (18.4%) | 101 (9.1%) |
| $35,000 to $49,999 | 118 (22.2%) | 66 (5.9%) |
| $50,000 to $74,999 | 43 (8.1%) | 58 (5.2%) |
| $75,000 to $99,999 | 81 (15.2%) | 165 (14.9%) |
| $100,000 to $149,999 | 61 (11.5%) | 92 (8.3%) |
| $150,000 or more | 57 (10.7%) | 364 (32.8%) |
| Total | 532 (100.0%) | 1,109 (100.0%) |
Property Value to Household Income Ratio in Storey County
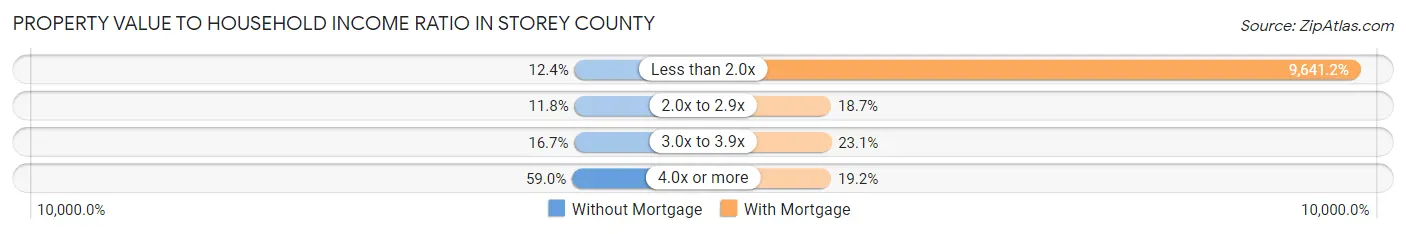
| Value-to-Income Ratio | Without Mortgage | With Mortgage |
| Less than 2.0x | 66 (12.4%) | 106,921 (9,641.2%) |
| 2.0x to 2.9x | 63 (11.8%) | 207 (18.7%) |
| 3.0x to 3.9x | 89 (16.7%) | 256 (23.1%) |
| 4.0x or more | 314 (59.0%) | 213 (19.2%) |
| Total | 532 (100.0%) | 1,109 (100.0%) |
Real Estate Taxes by Mortgage Status in Storey County
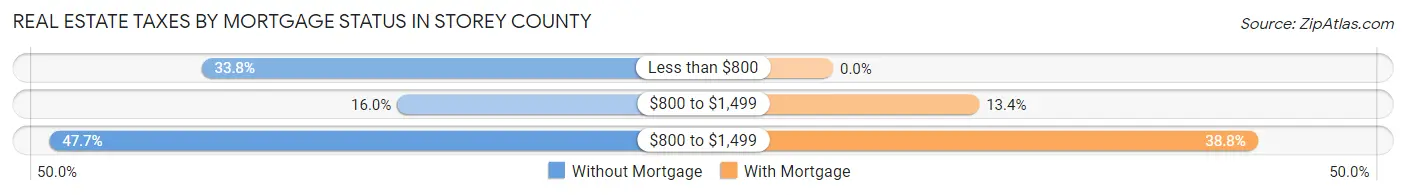
| Property Taxes | Without Mortgage | With Mortgage |
| Less than $800 | 180 (33.8%) | 0 (0.0%) |
| $800 to $1,499 | 85 (16.0%) | 148 (13.4%) |
| $800 to $1,499 | 254 (47.7%) | 430 (38.8%) |
| Total | 532 (100.0%) | 1,109 (100.0%) |
Health & Disability in Storey County
Health Insurance Coverage by Age in Storey County
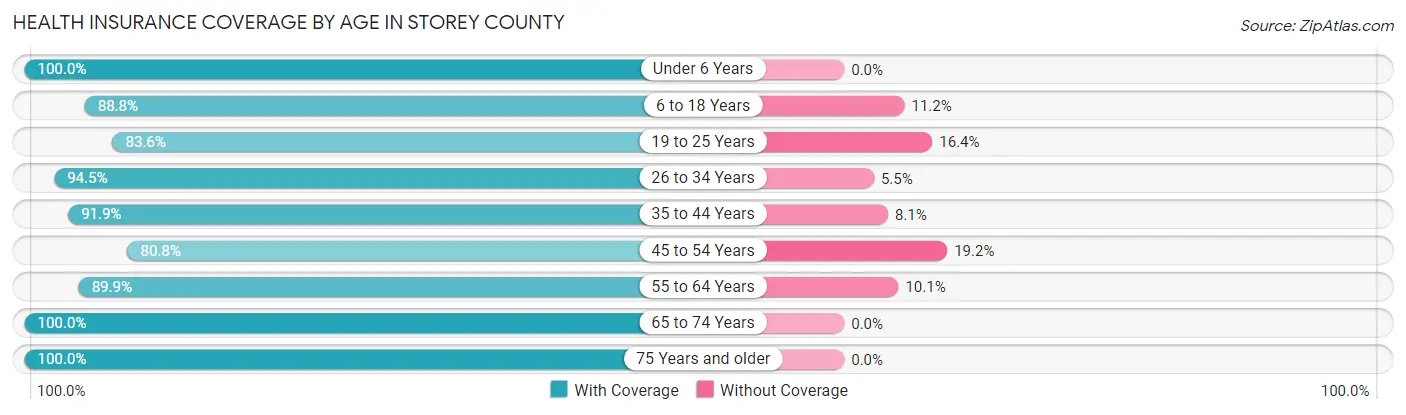
| Age Bracket | With Coverage | Without Coverage |
| Under 6 Years | 225 (100.0%) | 0 (0.0%) |
| 6 to 18 Years | 514 (88.8%) | 65 (11.2%) |
| 19 to 25 Years | 224 (83.6%) | 44 (16.4%) |
| 26 to 34 Years | 239 (94.5%) | 14 (5.5%) |
| 35 to 44 Years | 237 (91.9%) | 21 (8.1%) |
| 45 to 54 Years | 345 (80.8%) | 82 (19.2%) |
| 55 to 64 Years | 472 (89.9%) | 53 (10.1%) |
| 65 to 74 Years | 784 (100.0%) | 0 (0.0%) |
| 75 Years and older | 742 (100.0%) | 0 (0.0%) |
| Total | 3,782 (93.1%) | 279 (6.9%) |
Health Insurance Coverage by Citizenship Status in Storey County
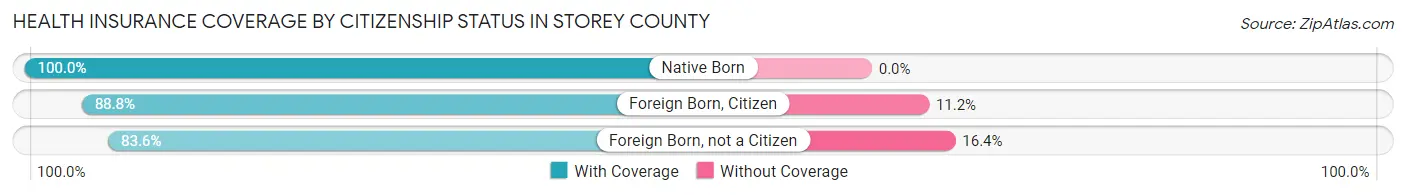
| Citizenship Status | With Coverage | Without Coverage |
| Native Born | 225 (100.0%) | 0 (0.0%) |
| Foreign Born, Citizen | 514 (88.8%) | 65 (11.2%) |
| Foreign Born, not a Citizen | 224 (83.6%) | 44 (16.4%) |
Health Insurance Coverage by Household Income in Storey County
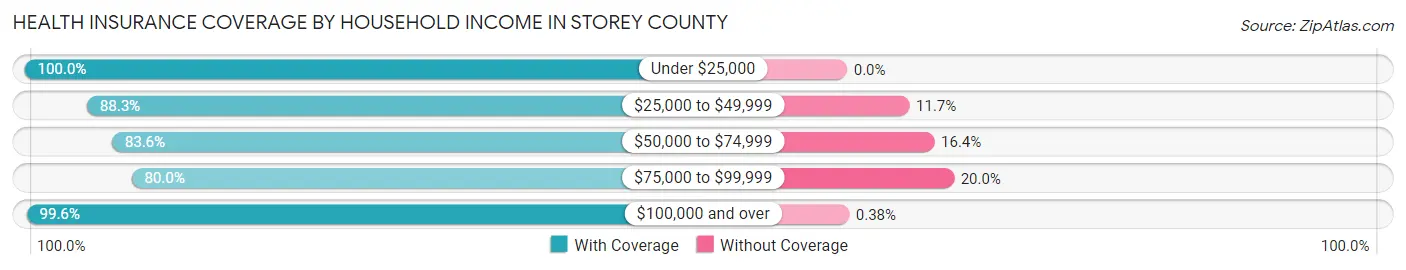
| Household Income | With Coverage | Without Coverage |
| Under $25,000 | 267 (100.0%) | 0 (0.0%) |
| $25,000 to $49,999 | 416 (88.3%) | 55 (11.7%) |
| $50,000 to $74,999 | 501 (83.6%) | 98 (16.4%) |
| $75,000 to $99,999 | 471 (80.0%) | 118 (20.0%) |
| $100,000 and over | 2,112 (99.6%) | 8 (0.4%) |
Public vs Private Health Insurance Coverage by Age in Storey County
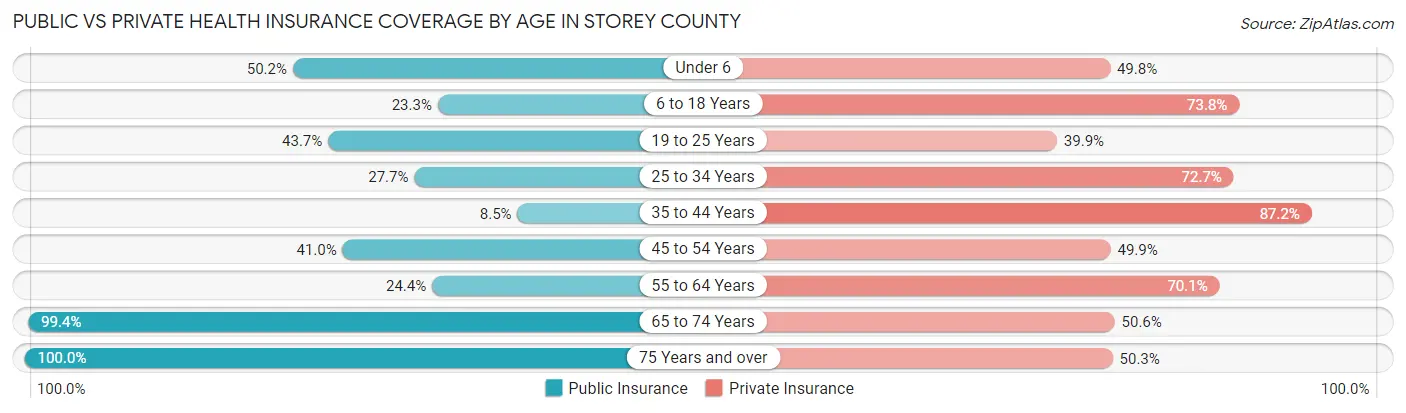
| Age Bracket | Public Insurance | Private Insurance |
| Under 6 | 113 (50.2%) | 112 (49.8%) |
| 6 to 18 Years | 135 (23.3%) | 427 (73.8%) |
| 19 to 25 Years | 117 (43.7%) | 107 (39.9%) |
| 25 to 34 Years | 70 (27.7%) | 184 (72.7%) |
| 35 to 44 Years | 22 (8.5%) | 225 (87.2%) |
| 45 to 54 Years | 175 (41.0%) | 213 (49.9%) |
| 55 to 64 Years | 128 (24.4%) | 368 (70.1%) |
| 65 to 74 Years | 779 (99.4%) | 397 (50.6%) |
| 75 Years and over | 742 (100.0%) | 373 (50.3%) |
| Total | 2,281 (56.2%) | 2,406 (59.3%) |
Disability Status by Sex by Age in Storey County
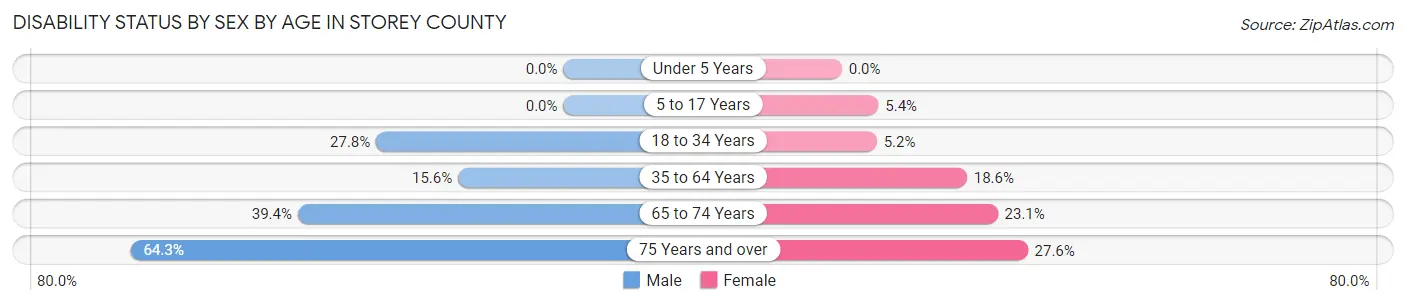
| Age Bracket | Male | Female |
| Under 5 Years | 0 (0.0%) | 0 (0.0%) |
| 5 to 17 Years | 0 (0.0%) | 14 (5.4%) |
| 18 to 34 Years | 114 (27.8%) | 13 (5.2%) |
| 35 to 64 Years | 94 (15.6%) | 113 (18.6%) |
| 65 to 74 Years | 166 (39.4%) | 84 (23.1%) |
| 75 Years and over | 223 (64.3%) | 109 (27.6%) |
Disability Class by Sex by Age in Storey County
Disability Class: Hearing Difficulty
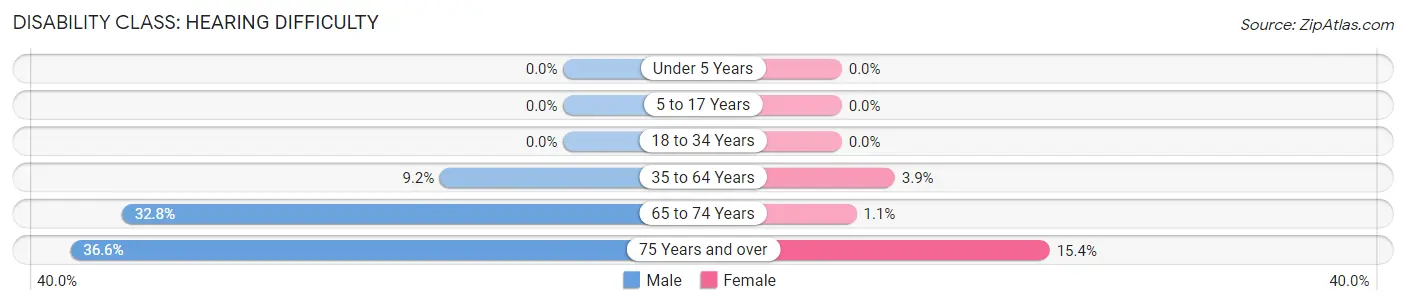
| Age Bracket | Male | Female |
| Under 5 Years | 0 (0.0%) | 0 (0.0%) |
| 5 to 17 Years | 0 (0.0%) | 0 (0.0%) |
| 18 to 34 Years | 0 (0.0%) | 0 (0.0%) |
| 35 to 64 Years | 55 (9.1%) | 24 (3.9%) |
| 65 to 74 Years | 138 (32.8%) | 4 (1.1%) |
| 75 Years and over | 127 (36.6%) | 61 (15.4%) |
Disability Class: Vision Difficulty
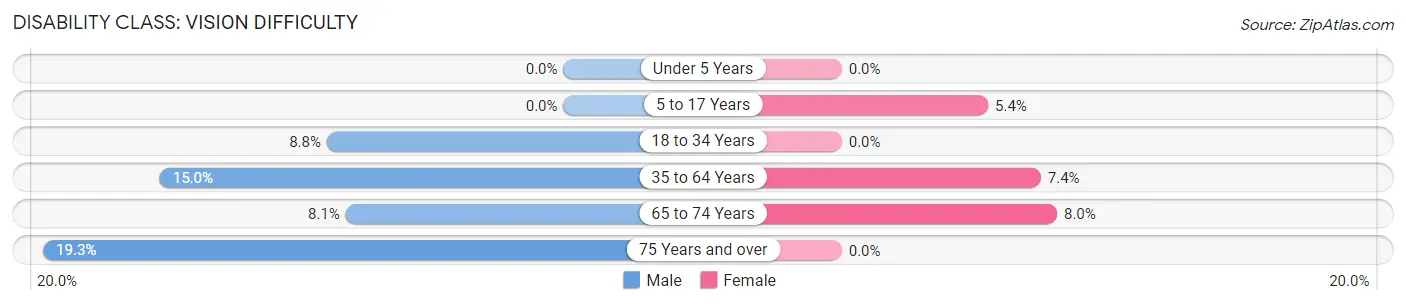
| Age Bracket | Male | Female |
| Under 5 Years | 0 (0.0%) | 0 (0.0%) |
| 5 to 17 Years | 0 (0.0%) | 14 (5.4%) |
| 18 to 34 Years | 36 (8.8%) | 0 (0.0%) |
| 35 to 64 Years | 90 (15.0%) | 45 (7.4%) |
| 65 to 74 Years | 34 (8.1%) | 29 (8.0%) |
| 75 Years and over | 67 (19.3%) | 0 (0.0%) |
Disability Class: Cognitive Difficulty
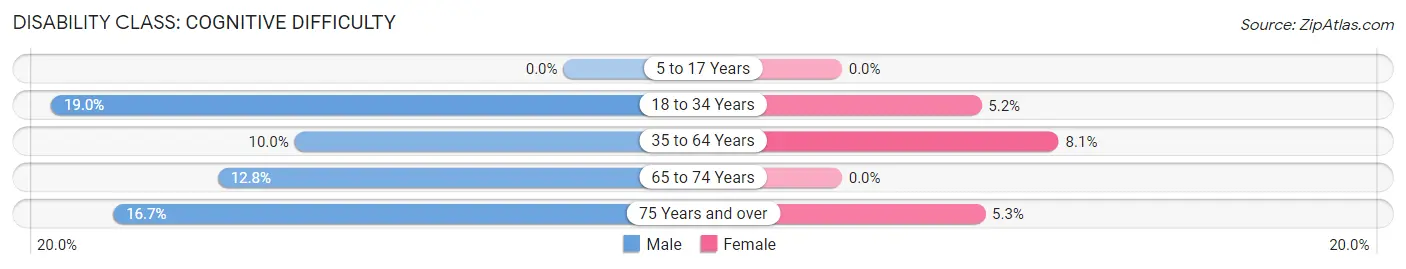
| Age Bracket | Male | Female |
| 5 to 17 Years | 0 (0.0%) | 0 (0.0%) |
| 18 to 34 Years | 78 (19.0%) | 13 (5.2%) |
| 35 to 64 Years | 60 (10.0%) | 49 (8.1%) |
| 65 to 74 Years | 54 (12.8%) | 0 (0.0%) |
| 75 Years and over | 58 (16.7%) | 21 (5.3%) |
Disability Class: Ambulatory Difficulty
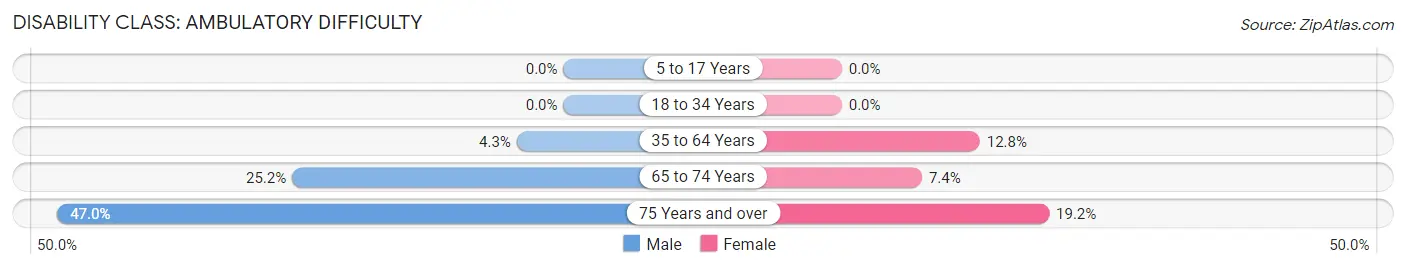
| Age Bracket | Male | Female |
| 5 to 17 Years | 0 (0.0%) | 0 (0.0%) |
| 18 to 34 Years | 0 (0.0%) | 0 (0.0%) |
| 35 to 64 Years | 26 (4.3%) | 78 (12.8%) |
| 65 to 74 Years | 106 (25.2%) | 27 (7.4%) |
| 75 Years and over | 163 (47.0%) | 76 (19.2%) |
Disability Class: Self-Care Difficulty
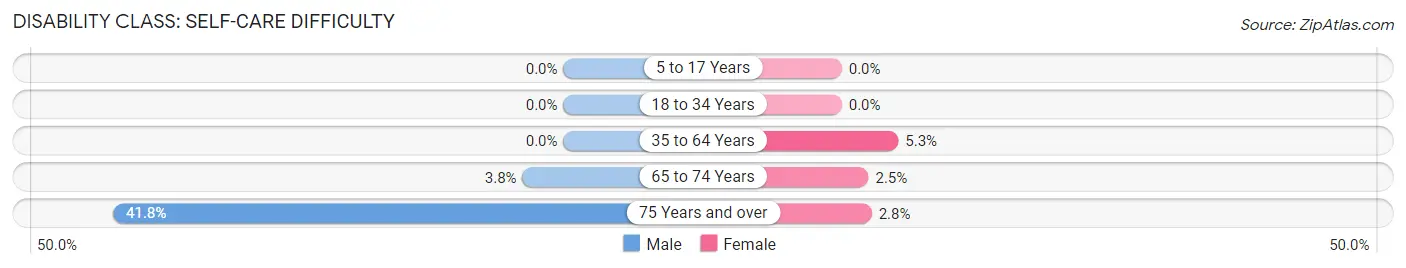
| Age Bracket | Male | Female |
| 5 to 17 Years | 0 (0.0%) | 0 (0.0%) |
| 18 to 34 Years | 0 (0.0%) | 0 (0.0%) |
| 35 to 64 Years | 0 (0.0%) | 32 (5.2%) |
| 65 to 74 Years | 16 (3.8%) | 9 (2.5%) |
| 75 Years and over | 145 (41.8%) | 11 (2.8%) |
Technology Access in Storey County
Computing Device Access in Storey County
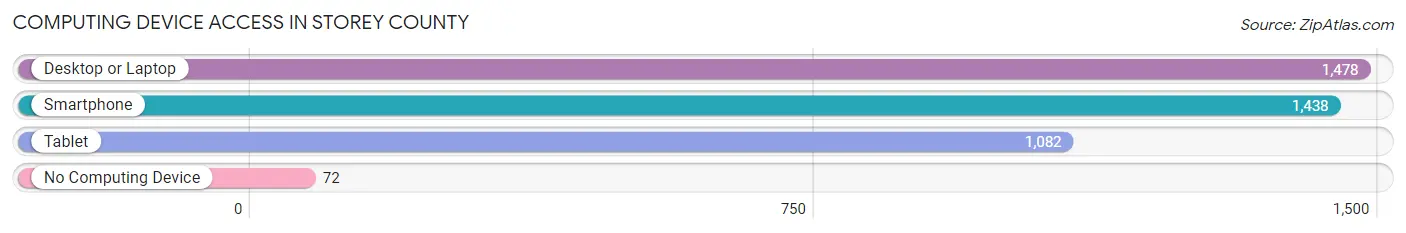
| Device Type | # Households | % Households |
| Desktop or Laptop | 1,478 | 87.4% |
| Smartphone | 1,438 | 85.0% |
| Tablet | 1,082 | 63.9% |
| No Computing Device | 72 | 4.3% |
| Total | 1,692 | 100.0% |
Internet Access in Storey County
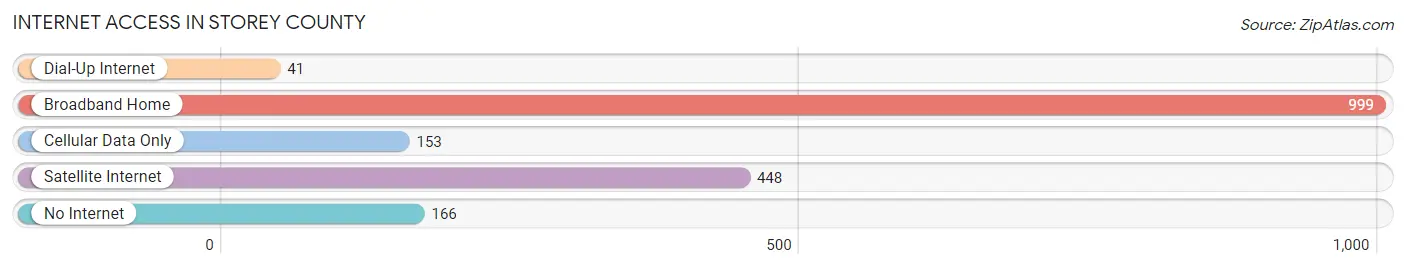
| Internet Type | # Households | % Households |
| Dial-Up Internet | 41 | 2.4% |
| Broadband Home | 999 | 59.0% |
| Cellular Data Only | 153 | 9.0% |
| Satellite Internet | 448 | 26.5% |
| No Internet | 166 | 9.8% |
| Total | 1,692 | 100.0% |
Storey County Summary
Story County, Nevada is located in the northwestern part of the state, and is bordered by Elko County to the north, Humboldt County to the east, and Pershing County to the south. The county seat is Lovelock, and the largest city is Winnemucca. The county was established in 1861 and named after Captain James W. Story, a Union Army officer who was killed in the Civil War.
Geography
Story County covers an area of 4,912 square miles, making it the fourth largest county in Nevada. The county is mostly flat, with some rolling hills in the north and east. The Humboldt River runs through the county, and there are several small lakes and reservoirs. The county is mostly desert, with some sagebrush and grasslands. The highest point in the county is Pilot Peak, which rises to an elevation of 8,918 feet.
Climate
Story County has a semi-arid climate, with hot summers and cold winters. The average high temperature in July is 92°F, and the average low temperature in January is 19°F. The average annual precipitation is 8.5 inches, with most of it falling in the winter months.
Economy
Story County’s economy is largely based on mining and agriculture. The county is home to several gold and silver mines, as well as copper and lead mines. Agriculture is also important to the county’s economy, with hay, alfalfa, and wheat being the main crops. Livestock production is also important, with cattle and sheep being the main animals raised.
Demographics
As of the 2010 census, Story County had a population of 4,936. The population is mostly white (86.3%), with smaller percentages of Hispanic (7.2%), Native American (3.2%), and Asian (1.2%) residents. The median household income is $45,813, and the median age is 39.7 years.
Conclusion
Story County, Nevada is a large, mostly rural county located in the northwestern part of the state. The county is mostly desert, with some rolling hills in the north and east. The economy is largely based on mining and agriculture, and the population is mostly white. The county is home to several gold and silver mines, as well as hay, alfalfa, and wheat farms.
Common Questions
What is Per Capita Income in Storey County?
Per Capita income in Storey County is $44,539.
What is the Median Family Income in Storey County?
Median Family Income in Storey County is $110,426.
What is the Median Household income in Storey County?
Median Household Income in Storey County is $86,932.
What is Income or Wage Gap in Storey County?
Income or Wage Gap in Storey County is 35.7%.
Women in Storey County earn 64.3 cents for every dollar earned by a man.
What is Inequality or Gini Index in Storey County?
Inequality or Gini Index in Storey County is 0.44.
What is the Total Population of Storey County?
Total Population of Storey County is 4,095.
What is the Total Male Population of Storey County?
Total Male Population of Storey County is 2,149.
What is the Total Female Population of Storey County?
Total Female Population of Storey County is 1,946.
What is the Ratio of Males per 100 Females in Storey County?
There are 110.43 Males per 100 Females in Storey County.
What is the Ratio of Females per 100 Males in Storey County?
There are 90.55 Females per 100 Males in Storey County.
What is the Median Population Age in Storey County?
Median Population Age in Storey County is 55.7 Years.
What is the Average Family Size in Storey County
Average Family Size in Storey County is 3.2 People.
What is the Average Household Size in Storey County
Average Household Size in Storey County is 2.4 People.
How Large is the Labor Force in Storey County?
There are 1,472 People in the Labor Forcein in Storey County.
What is the Percentage of People in the Labor Force in Storey County?
41.9% of People are in the Labor Force in Storey County.
What is the Unemployment Rate in Storey County?
Unemployment Rate in Storey County is 7.0%.