Pershing County, NV Map & Demographics
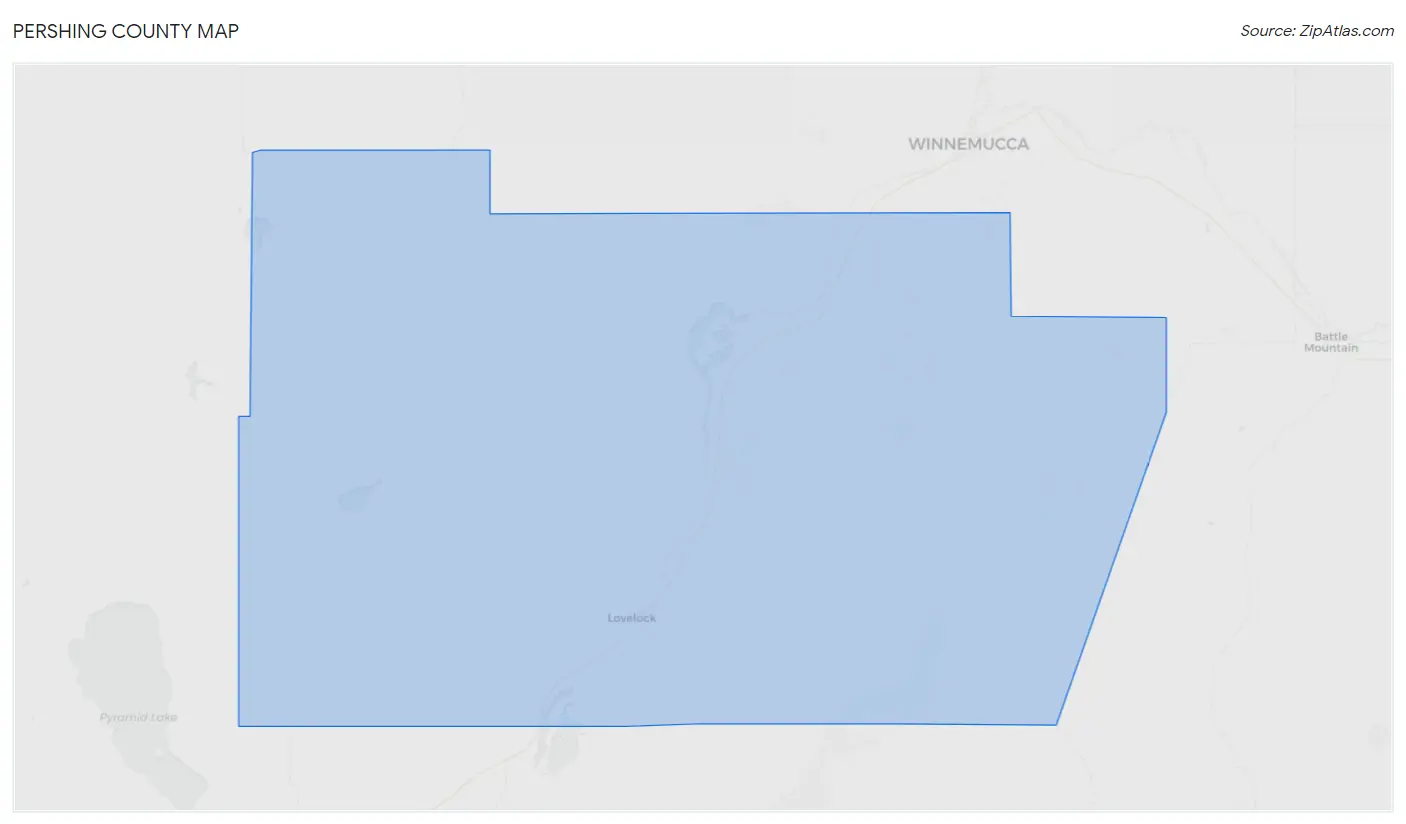
Pershing County Map
Pershing County Overview
$25,896
PER CAPITA INCOME
$92,031
AVG FAMILY INCOME
$66,304
AVG HOUSEHOLD INCOME
57.7%
WAGE / INCOME GAP [ % ]
42.3¢/ $1
WAGE / INCOME GAP [ $ ]
0.40
INEQUALITY / GINI INDEX
6,587
TOTAL POPULATION
4,293
MALE POPULATION
2,294
FEMALE POPULATION
187.14
MALES / 100 FEMALES
53.44
FEMALES / 100 MALES
40.4
MEDIAN AGE
3.2
AVG FAMILY SIZE
2.5
AVG HOUSEHOLD SIZE
2,224
LABOR FORCE [ PEOPLE ]
40.0%
PERCENT IN LABOR FORCE
8.5%
UNEMPLOYMENT RATE
Pershing County Area Codes
Income in Pershing County
Income Overview in Pershing County
Per Capita Income in Pershing County is $25,896, while median incomes of families and households are $92,031 and $66,304 respectively.
| Characteristic | Number | Measure |
| Per Capita Income | 6,587 | $25,896 |
| Median Family Income | 1,289 | $92,031 |
| Mean Family Income | 1,289 | $96,184 |
| Median Household Income | 1,886 | $66,304 |
| Mean Household Income | 1,886 | $77,979 |
| Income Deficit | 1,289 | $0 |
| Wage / Income Gap (%) | 6,587 | 57.67% |
| Wage / Income Gap ($) | 6,587 | 42.33¢ per $1 |
| Gini / Inequality Index | 6,587 | 0.40 |
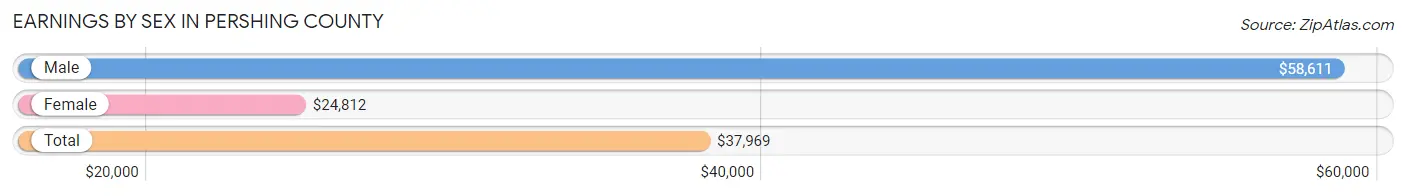
Earnings by Sex in Pershing County
Average Earnings in Pershing County are $37,969, $58,611 for men and $24,812 for women, a difference of 57.7%.
| Sex | Number | Average Earnings |
| Male | 1,702 (63.1%) | $58,611 |
| Female | 993 (36.8%) | $24,812 |
| Total | 2,695 (100.0%) | $37,969 |
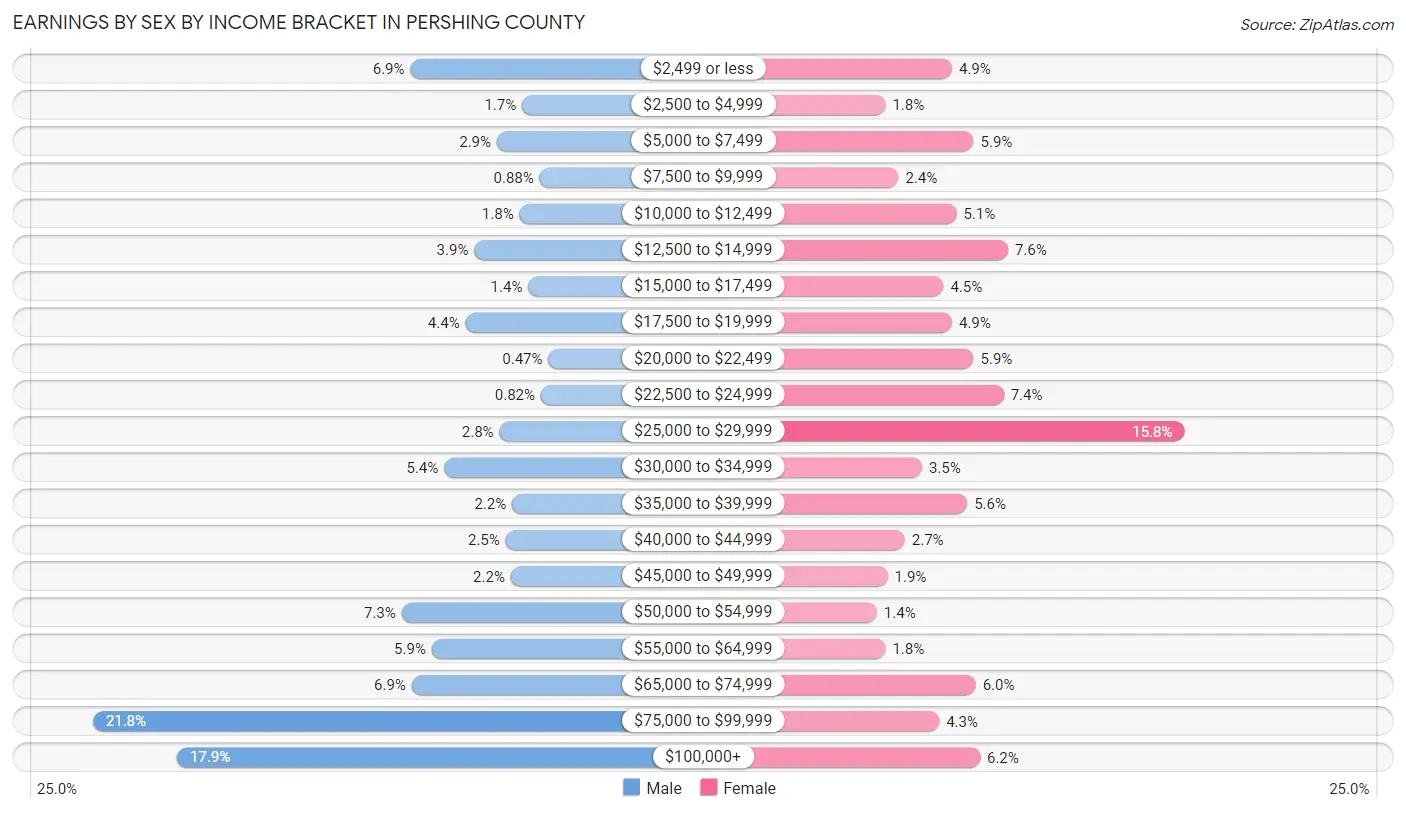
Earnings by Sex by Income Bracket in Pershing County
The most common earnings brackets in Pershing County are $75,000 to $99,999 for men (371 | 21.8%) and $25,000 to $29,999 for women (157 | 15.8%).
| Income | Male | Female |
| $2,499 or less | 118 (6.9%) | 49 (4.9%) |
| $2,500 to $4,999 | 29 (1.7%) | 18 (1.8%) |
| $5,000 to $7,499 | 49 (2.9%) | 59 (5.9%) |
| $7,500 to $9,999 | 15 (0.9%) | 24 (2.4%) |
| $10,000 to $12,499 | 31 (1.8%) | 51 (5.1%) |
| $12,500 to $14,999 | 67 (3.9%) | 75 (7.5%) |
| $15,000 to $17,499 | 24 (1.4%) | 45 (4.5%) |
| $17,500 to $19,999 | 74 (4.3%) | 49 (4.9%) |
| $20,000 to $22,499 | 8 (0.5%) | 59 (5.9%) |
| $22,500 to $24,999 | 14 (0.8%) | 73 (7.3%) |
| $25,000 to $29,999 | 47 (2.8%) | 157 (15.8%) |
| $30,000 to $34,999 | 91 (5.3%) | 35 (3.5%) |
| $35,000 to $39,999 | 37 (2.2%) | 56 (5.6%) |
| $40,000 to $44,999 | 42 (2.5%) | 27 (2.7%) |
| $45,000 to $49,999 | 38 (2.2%) | 19 (1.9%) |
| $50,000 to $54,999 | 125 (7.3%) | 14 (1.4%) |
| $55,000 to $64,999 | 101 (5.9%) | 18 (1.8%) |
| $65,000 to $74,999 | 117 (6.9%) | 60 (6.0%) |
| $75,000 to $99,999 | 371 (21.8%) | 43 (4.3%) |
| $100,000+ | 304 (17.9%) | 62 (6.2%) |
| Total | 1,702 (100.0%) | 993 (100.0%) |
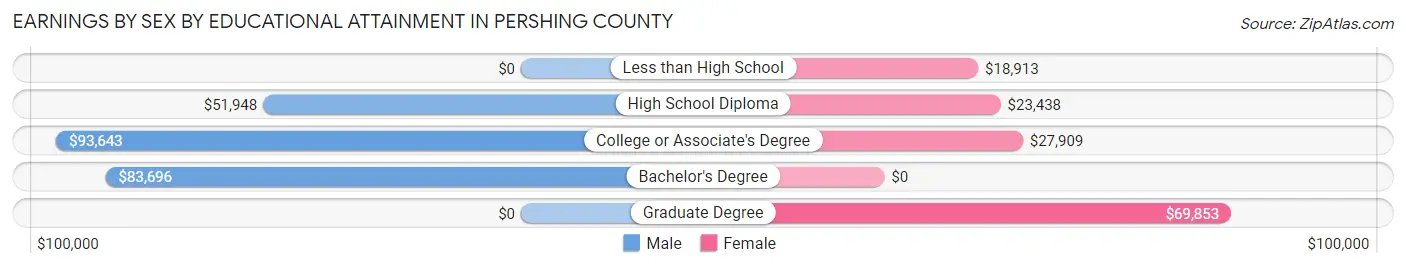
Earnings by Sex by Educational Attainment in Pershing County
Average earnings in Pershing County are $63,155 for men and $26,109 for women, a difference of 58.7%. Men with an educational attainment of college or associate's degree enjoy the highest average annual earnings of $93,643, while those with high school diploma education earn the least with $51,948. Women with an educational attainment of graduate degree earn the most with the average annual earnings of $69,853, while those with less than high school education have the smallest earnings of $18,913.
| Educational Attainment | Male Income | Female Income |
| Less than High School | - | - |
| High School Diploma | $51,948 | $23,438 |
| College or Associate's Degree | $93,643 | $27,909 |
| Bachelor's Degree | $83,696 | $0 |
| Graduate Degree | - | - |
| Total | $63,155 | $26,109 |
Family Income in Pershing County
Family Income Brackets in Pershing County
According to the Pershing County family income data, there are 373 families falling into the $100,000 to $149,999 income range, which is the most common income bracket and makes up 28.9% of all families.
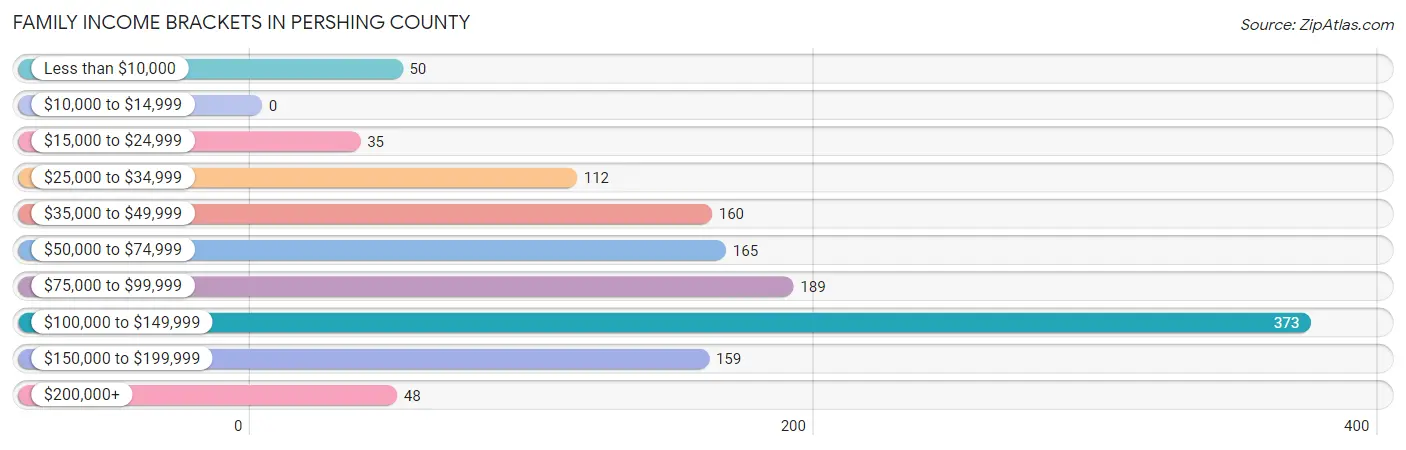
| Income Bracket | # Families | % Families |
| Less than $10,000 | 50 | 3.9% |
| $10,000 to $14,999 | 0 | 0.0% |
| $15,000 to $24,999 | 35 | 2.7% |
| $25,000 to $34,999 | 112 | 8.7% |
| $35,000 to $49,999 | 160 | 12.4% |
| $50,000 to $74,999 | 165 | 12.8% |
| $75,000 to $99,999 | 189 | 14.7% |
| $100,000 to $149,999 | 373 | 28.9% |
| $150,000 to $199,999 | 159 | 12.3% |
| $200,000+ | 48 | 3.7% |
Family Income by Famaliy Size in Pershing County
6-person families (141 | 10.9%) account for the highest median family income in Pershing County with $131,553 per family, while 2-person families (667 | 51.7%) have the highest median income of $45,017 per family member.
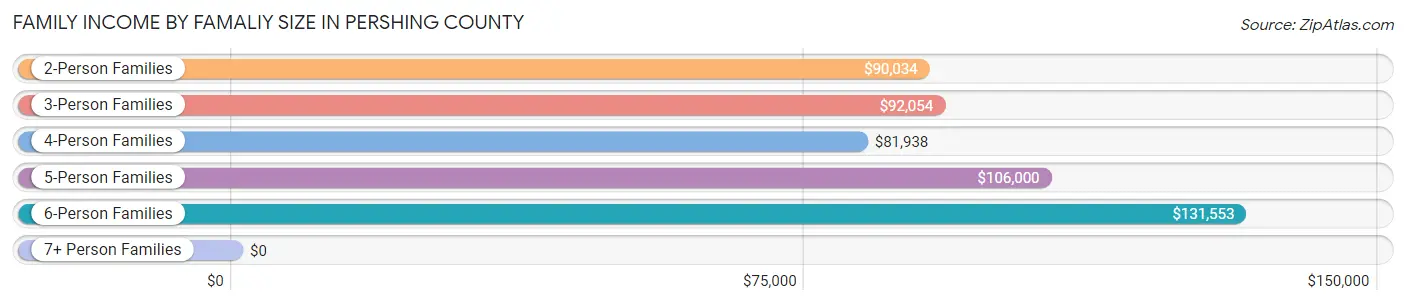
| Income Bracket | # Families | Median Income |
| 2-Person Families | 667 (51.7%) | $90,034 |
| 3-Person Families | 257 (19.9%) | $92,054 |
| 4-Person Families | 149 (11.6%) | $81,938 |
| 5-Person Families | 70 (5.4%) | $106,000 |
| 6-Person Families | 141 (10.9%) | $131,553 |
| 7+ Person Families | 5 (0.4%) | $0 |
| Total | 1,289 (100.0%) | $92,031 |
Family Income by Number of Earners in Pershing County
The median family income in Pershing County is $92,031, with families comprising 2 earners (449) having the highest median family income of $129,332, while families with no earners (283) have the lowest median family income of $43,199, accounting for 34.8% and 22.0% of families, respectively.
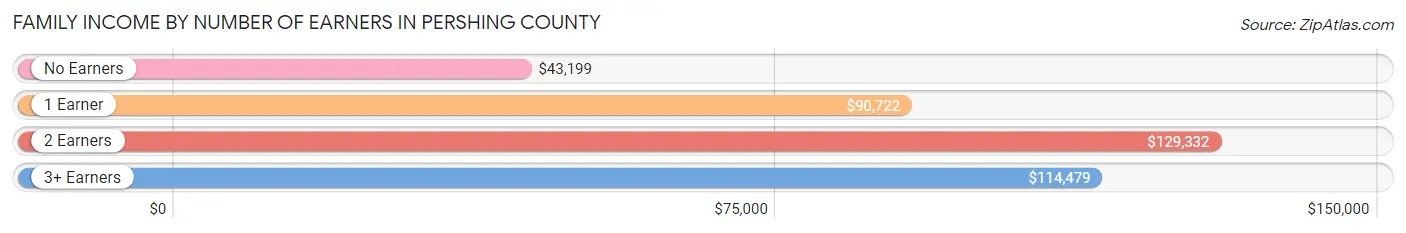
| Number of Earners | # Families | Median Income |
| No Earners | 283 (22.0%) | $43,199 |
| 1 Earner | 428 (33.2%) | $90,722 |
| 2 Earners | 449 (34.8%) | $129,332 |
| 3+ Earners | 129 (10.0%) | $114,479 |
| Total | 1,289 (100.0%) | $92,031 |
Household Income in Pershing County
Household Income Brackets in Pershing County
With 383 households falling in the category, the $100,000 to $149,999 income range is the most frequent in Pershing County, accounting for 20.3% of all households. In contrast, only 41 households (2.2%) fall into the $10,000 to $14,999 income bracket, making it the least populous group.
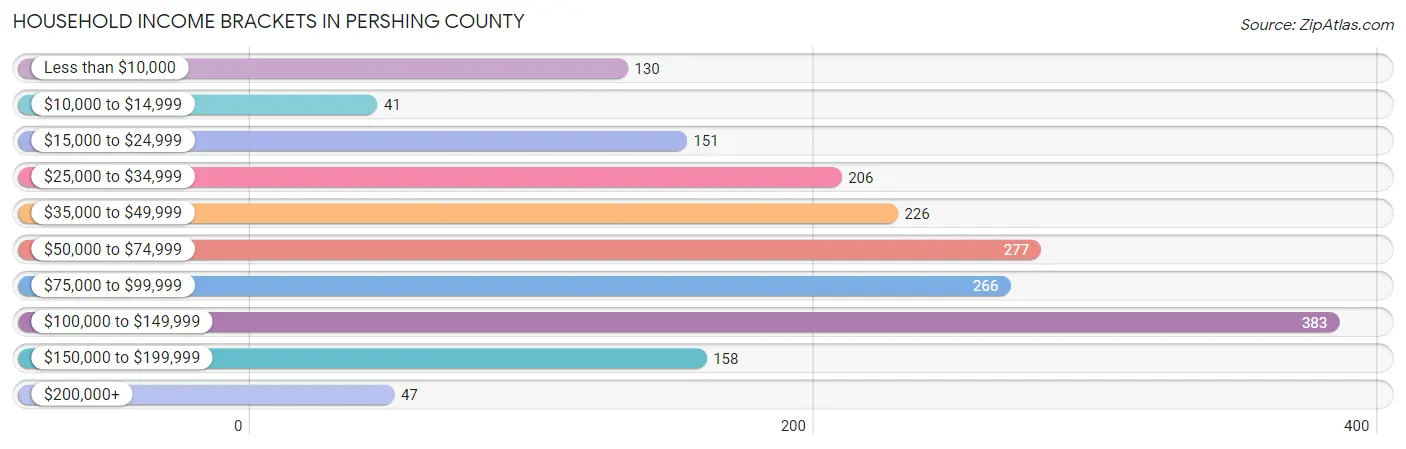
| Income Bracket | # Households | % Households |
| Less than $10,000 | 130 | 6.9% |
| $10,000 to $14,999 | 41 | 2.2% |
| $15,000 to $24,999 | 151 | 8.0% |
| $25,000 to $34,999 | 206 | 10.9% |
| $35,000 to $49,999 | 226 | 12.0% |
| $50,000 to $74,999 | 277 | 14.7% |
| $75,000 to $99,999 | 266 | 14.1% |
| $100,000 to $149,999 | 383 | 20.3% |
| $150,000 to $199,999 | 158 | 8.4% |
| $200,000+ | 47 | 2.5% |
Household Income by Householder Age in Pershing County
The median household income in Pershing County is $66,304, with the highest median household income of $99,015 found in the 25 to 44 years age bracket for the primary householder. A total of 606 households (32.1%) fall into this category. Meanwhile, the 65+ years age bracket for the primary householder has the lowest median household income of $43,008, with 618 households (32.8%) in this group.
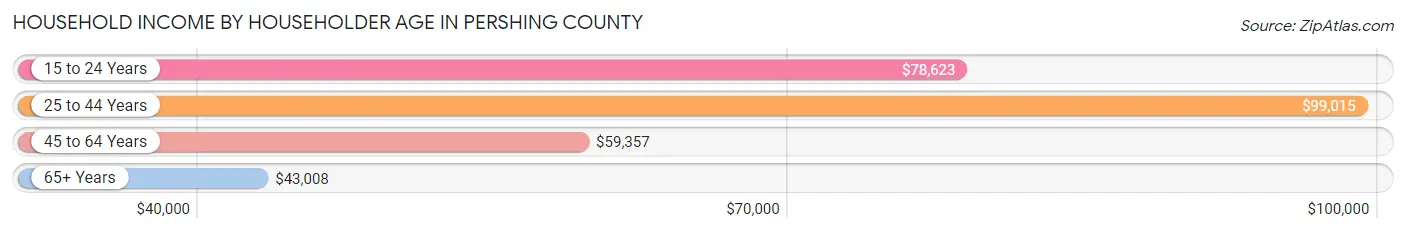
| Income Bracket | # Households | Median Income |
| 15 to 24 Years | 76 (4.0%) | $78,623 |
| 25 to 44 Years | 606 (32.1%) | $99,015 |
| 45 to 64 Years | 586 (31.1%) | $59,357 |
| 65+ Years | 618 (32.8%) | $43,008 |
| Total | 1,886 (100.0%) | $66,304 |
Poverty in Pershing County
Income Below Poverty by Sex and Age in Pershing County
With 9.3% poverty level for males and 10.4% for females among the residents of Pershing County, 75 year old and over males and 16 and 17 year old females are the most vulnerable to poverty, with 53 males (24.1%) and 4 females (50.0%) in their respective age groups living below the poverty level.
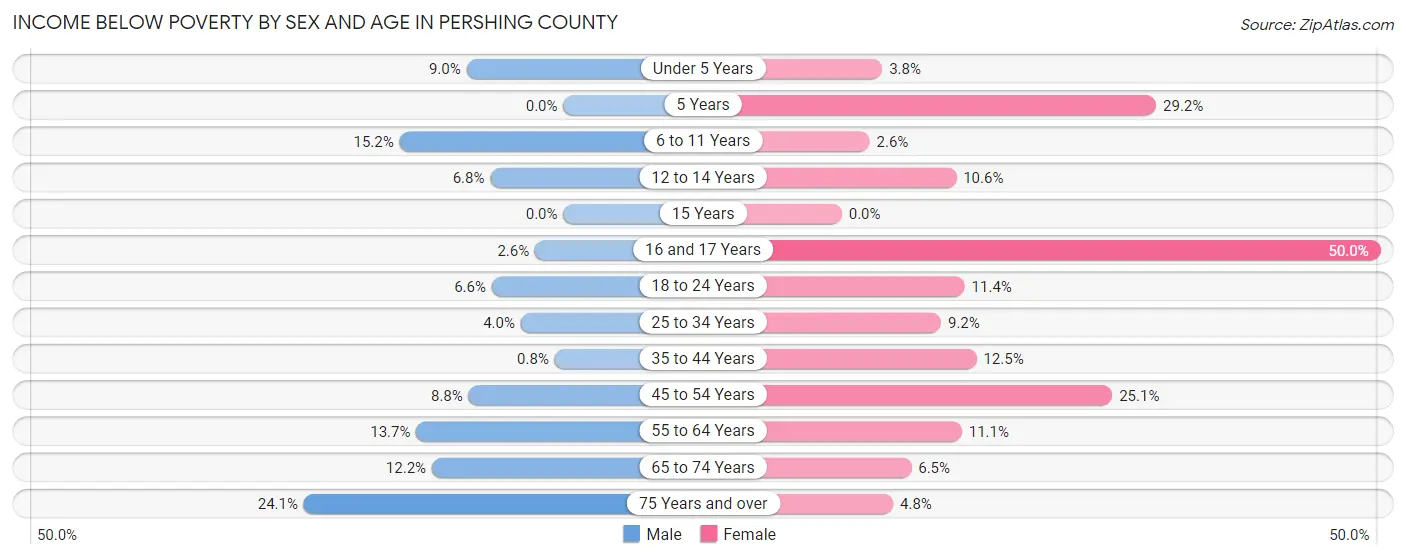
| Age Bracket | Male | Female |
| Under 5 Years | 15 (9.0%) | 6 (3.7%) |
| 5 Years | 0 (0.0%) | 7 (29.2%) |
| 6 to 11 Years | 31 (15.2%) | 5 (2.6%) |
| 12 to 14 Years | 8 (6.8%) | 12 (10.6%) |
| 15 Years | 0 (0.0%) | 0 (0.0%) |
| 16 and 17 Years | 2 (2.6%) | 4 (50.0%) |
| 18 to 24 Years | 16 (6.6%) | 13 (11.4%) |
| 25 to 34 Years | 13 (4.0%) | 34 (9.2%) |
| 35 to 44 Years | 3 (0.8%) | 31 (12.5%) |
| 45 to 54 Years | 16 (8.8%) | 62 (25.1%) |
| 55 to 64 Years | 43 (13.7%) | 37 (11.1%) |
| 65 to 74 Years | 36 (12.2%) | 16 (6.5%) |
| 75 Years and over | 53 (24.1%) | 9 (4.8%) |
| Total | 236 (9.3%) | 236 (10.4%) |
Income Above Poverty by Sex and Age in Pershing County
According to the poverty statistics in Pershing County, males aged 5 years and females aged 15 years are the age groups that are most secure financially, with 100.0% of males and 100.0% of females in these age groups living above the poverty line.
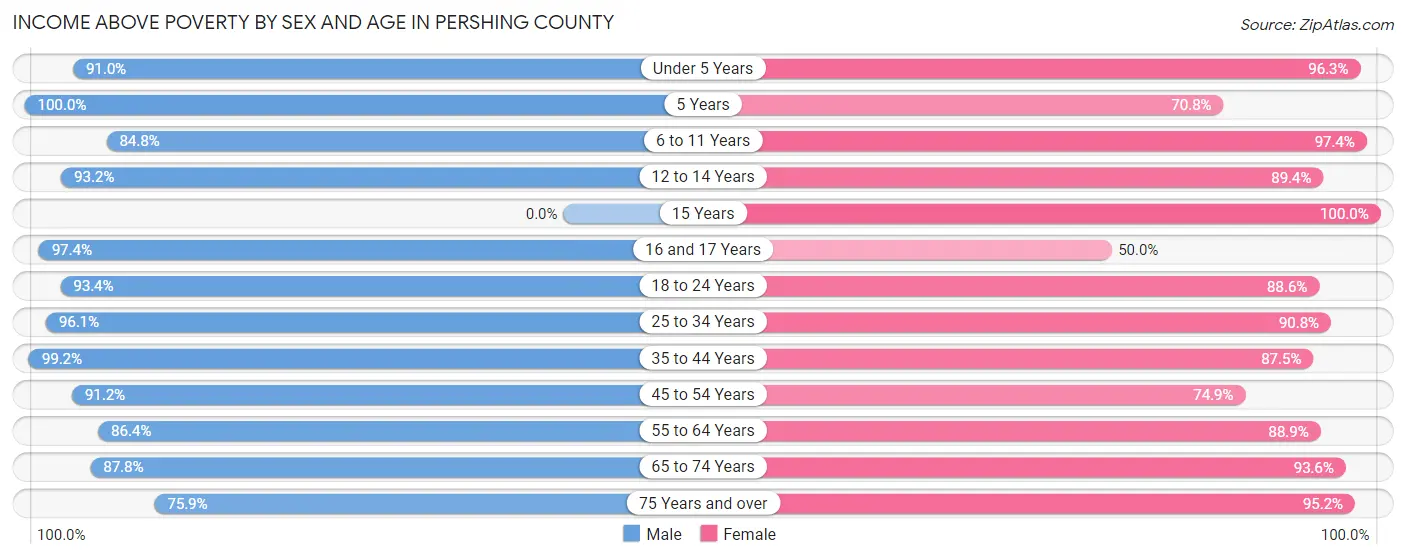
| Age Bracket | Male | Female |
| Under 5 Years | 152 (91.0%) | 154 (96.3%) |
| 5 Years | 15 (100.0%) | 17 (70.8%) |
| 6 to 11 Years | 173 (84.8%) | 189 (97.4%) |
| 12 to 14 Years | 110 (93.2%) | 101 (89.4%) |
| 15 Years | 0 (0.0%) | 24 (100.0%) |
| 16 and 17 Years | 74 (97.4%) | 4 (50.0%) |
| 18 to 24 Years | 225 (93.4%) | 101 (88.6%) |
| 25 to 34 Years | 316 (96.1%) | 335 (90.8%) |
| 35 to 44 Years | 372 (99.2%) | 217 (87.5%) |
| 45 to 54 Years | 166 (91.2%) | 185 (74.9%) |
| 55 to 64 Years | 272 (86.4%) | 295 (88.9%) |
| 65 to 74 Years | 259 (87.8%) | 232 (93.5%) |
| 75 Years and over | 167 (75.9%) | 180 (95.2%) |
| Total | 2,301 (90.7%) | 2,034 (89.6%) |
Income Below Poverty Among Married-Couple Families in Pershing County
The poverty statistics for married-couple families in Pershing County show that 2.0% or 22 of the total 1,095 families live below the poverty line. Families with 1 or 2 children have the highest poverty rate of 3.1%, comprising of 7 families. On the other hand, families with no children have the lowest poverty rate of 1.4%, which includes 10 families.
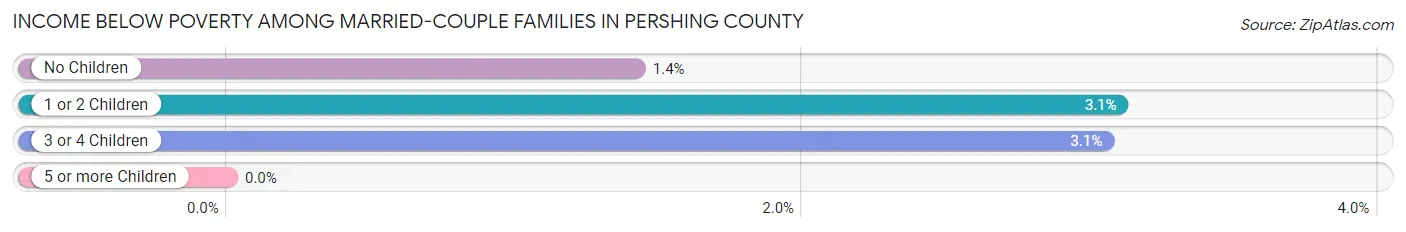
| Children | Above Poverty | Below Poverty |
| No Children | 695 (98.6%) | 10 (1.4%) |
| 1 or 2 Children | 219 (96.9%) | 7 (3.1%) |
| 3 or 4 Children | 159 (97.0%) | 5 (3.0%) |
| 5 or more Children | 0 (0.0%) | 0 (0.0%) |
| Total | 1,073 (98.0%) | 22 (2.0%) |
Income Below Poverty Among Single-Parent Households in Pershing County
According to the poverty data in Pershing County, 9.4% or 6 single-father households and 29.2% or 38 single-mother households are living below the poverty line. Among single-father households, those with 1 or 2 children have the highest poverty rate, with 6 households (35.3%) experiencing poverty. Likewise, among single-mother households, those with no children have the highest poverty rate, with 20 households (76.9%) falling below the poverty line.
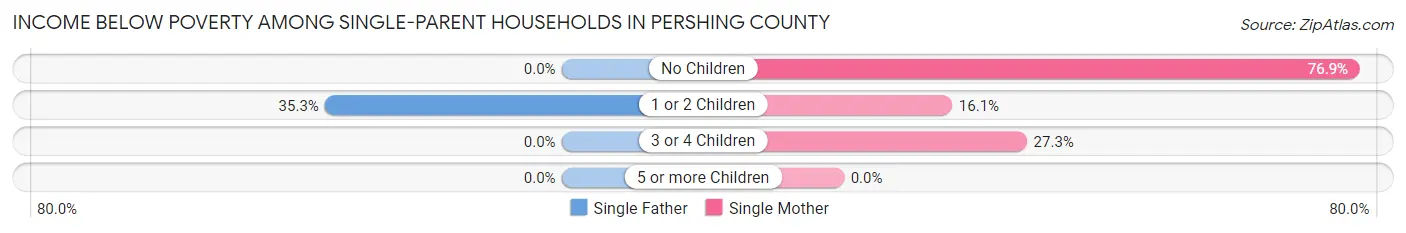
| Children | Single Father | Single Mother |
| No Children | 0 (0.0%) | 20 (76.9%) |
| 1 or 2 Children | 6 (35.3%) | 15 (16.1%) |
| 3 or 4 Children | 0 (0.0%) | 3 (27.3%) |
| 5 or more Children | 0 (0.0%) | 0 (0.0%) |
| Total | 6 (9.4%) | 38 (29.2%) |
Income Below Poverty Among Married-Couple vs Single-Parent Households in Pershing County
The poverty data for Pershing County shows that 22 of the married-couple family households (2.0%) and 44 of the single-parent households (22.7%) are living below the poverty level. Within the married-couple family households, those with 1 or 2 children have the highest poverty rate, with 7 households (3.1%) falling below the poverty line. Among the single-parent households, those with no children have the highest poverty rate, with 20 household (27.4%) living below poverty.
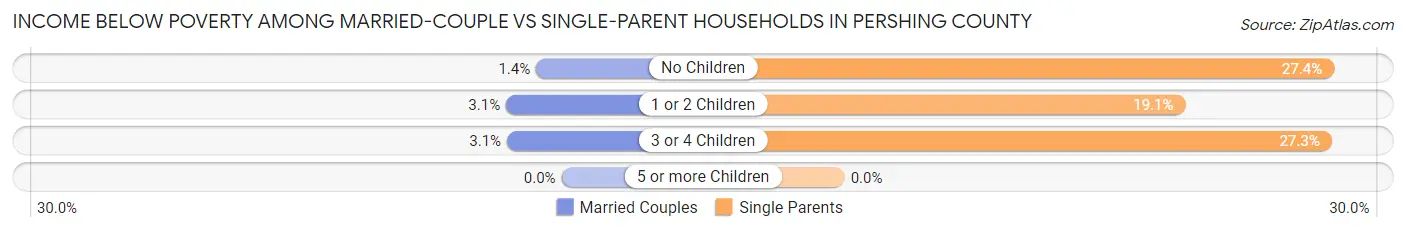
| Children | Married-Couple Families | Single-Parent Households |
| No Children | 10 (1.4%) | 20 (27.4%) |
| 1 or 2 Children | 7 (3.1%) | 21 (19.1%) |
| 3 or 4 Children | 5 (3.0%) | 3 (27.3%) |
| 5 or more Children | 0 (0.0%) | 0 (0.0%) |
| Total | 22 (2.0%) | 44 (22.7%) |
Race in Pershing County
The most populous races in Pershing County are White / Caucasian (4,880 | 74.1%), Hispanic or Latino (1,622 | 24.6%), and Two or more Races (569 | 8.6%).
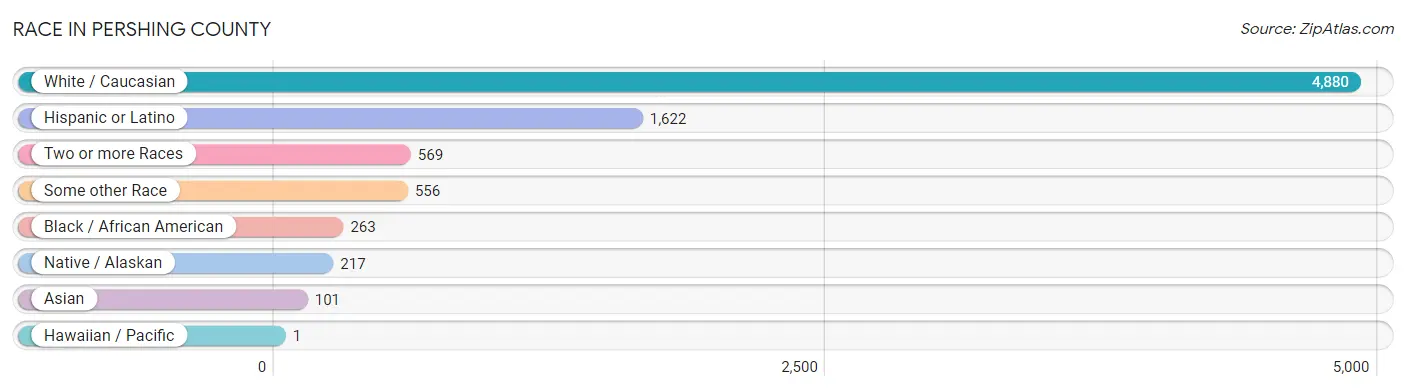
| Race | # Population | % Population |
| Asian | 101 | 1.5% |
| Black / African American | 263 | 4.0% |
| Hawaiian / Pacific | 1 | 0.0% |
| Hispanic or Latino | 1,622 | 24.6% |
| Native / Alaskan | 217 | 3.3% |
| White / Caucasian | 4,880 | 74.1% |
| Two or more Races | 569 | 8.6% |
| Some other Race | 556 | 8.4% |
| Total | 6,587 | 100.0% |
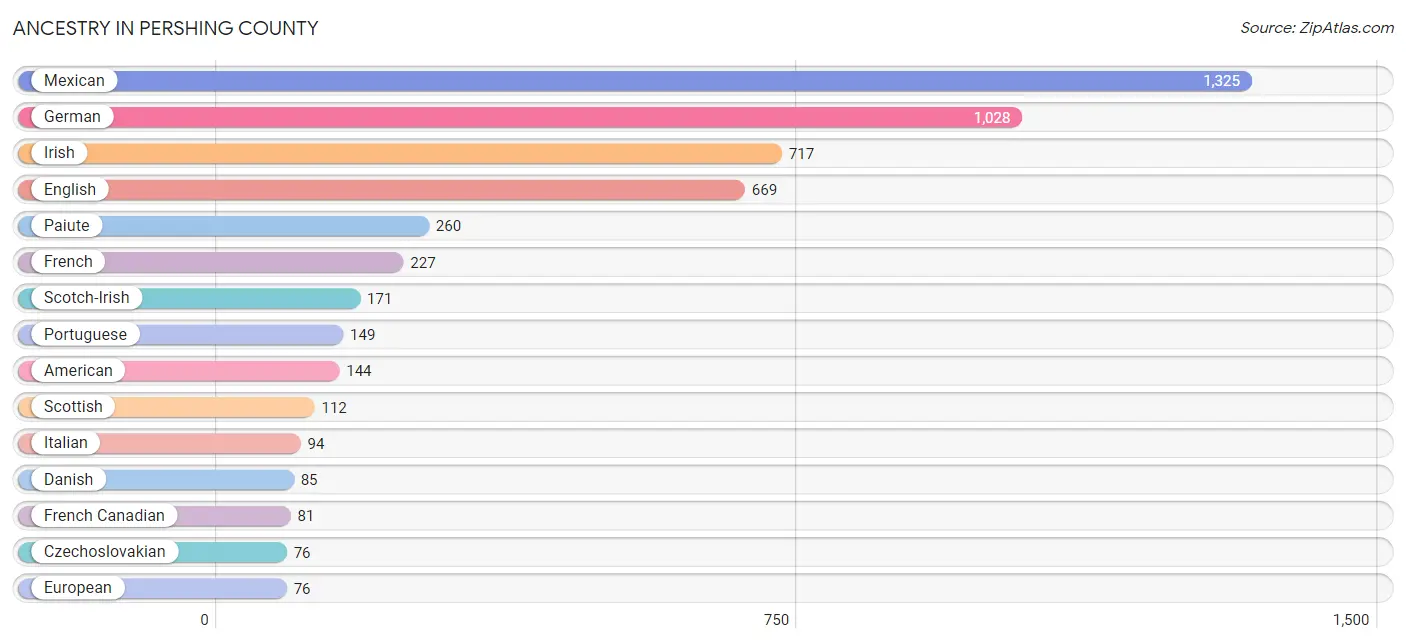
Ancestry in Pershing County
The most populous ancestries reported in Pershing County are Mexican (1,325 | 20.1%), German (1,028 | 15.6%), Irish (717 | 10.9%), English (669 | 10.2%), and Paiute (260 | 4.0%), together accounting for 60.7% of all Pershing County residents.
| Ancestry | # Population | % Population |
| African | 8 | 0.1% |
| American | 144 | 2.2% |
| Arab | 14 | 0.2% |
| Armenian | 5 | 0.1% |
| British | 18 | 0.3% |
| Central American | 27 | 0.4% |
| Central American Indian | 10 | 0.2% |
| Cherokee | 14 | 0.2% |
| Choctaw | 5 | 0.1% |
| Colville | 17 | 0.3% |
| Croatian | 53 | 0.8% |
| Czechoslovakian | 76 | 1.1% |
| Danish | 85 | 1.3% |
| Dominican | 4 | 0.1% |
| Dutch | 35 | 0.5% |
| Eastern European | 8 | 0.1% |
| English | 669 | 10.2% |
| European | 76 | 1.1% |
| Finnish | 15 | 0.2% |
| French | 227 | 3.5% |
| French Canadian | 81 | 1.2% |
| German | 1,028 | 15.6% |
| Guatemalan | 4 | 0.1% |
| Honduran | 8 | 0.1% |
| Indian (Asian) | 48 | 0.7% |
| Irish | 717 | 10.9% |
| Italian | 94 | 1.4% |
| Korean | 60 | 0.9% |
| Lebanese | 8 | 0.1% |
| Mexican | 1,325 | 20.1% |
| Navajo | 2 | 0.0% |
| Nicaraguan | 7 | 0.1% |
| Norwegian | 19 | 0.3% |
| Paiute | 260 | 4.0% |
| Pennsylvania German | 12 | 0.2% |
| Pima | 7 | 0.1% |
| Polish | 34 | 0.5% |
| Portuguese | 149 | 2.3% |
| Puerto Rican | 43 | 0.6% |
| Puget Sound Salish | 13 | 0.2% |
| Romanian | 9 | 0.1% |
| Russian | 31 | 0.5% |
| Salvadoran | 8 | 0.1% |
| Samoan | 1 | 0.0% |
| Scandinavian | 14 | 0.2% |
| Scotch-Irish | 171 | 2.6% |
| Scottish | 112 | 1.7% |
| Shoshone | 33 | 0.5% |
| Spaniard | 27 | 0.4% |
| Spanish | 7 | 0.1% |
| Subsaharan African | 8 | 0.1% |
| Swedish | 57 | 0.9% |
| Thai | 1 | 0.0% |
| Ukrainian | 18 | 0.3% |
| Welsh | 10 | 0.2% |
| Yaqui | 4 | 0.1% | View All 56 Rows |
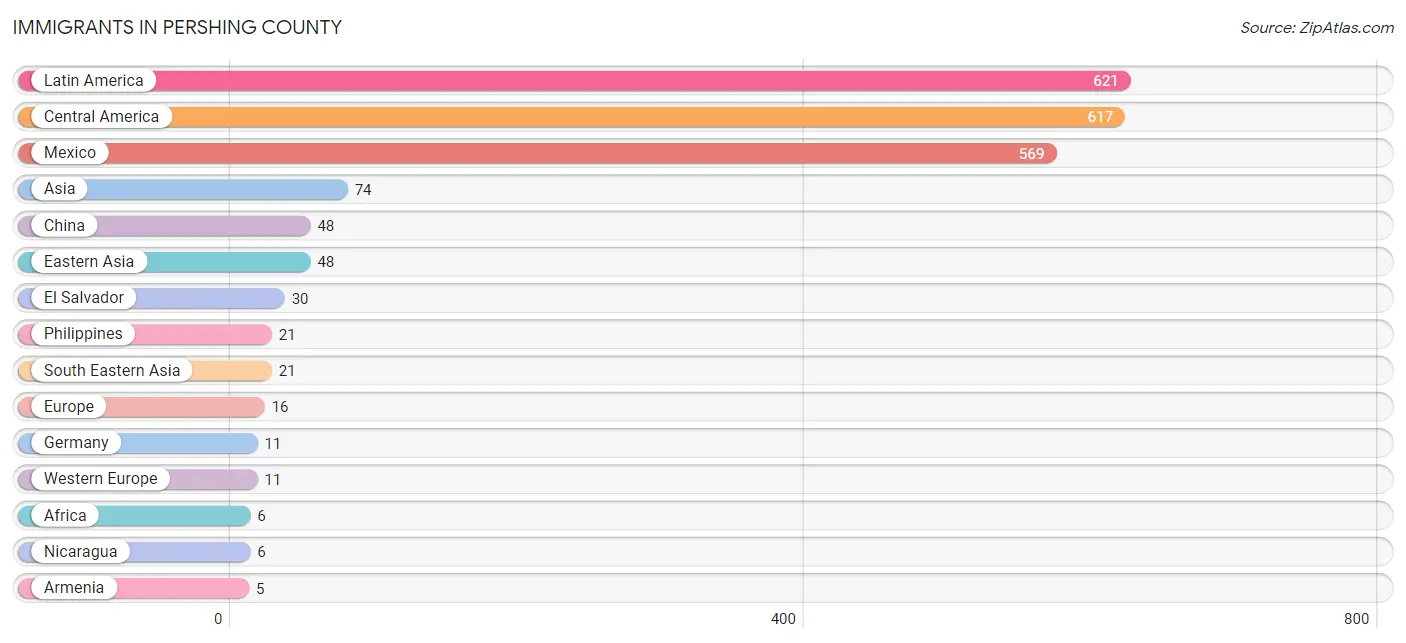
Immigrants in Pershing County
The most numerous immigrant groups reported in Pershing County came from Latin America (621 | 9.4%), Central America (617 | 9.4%), Mexico (569 | 8.6%), Asia (74 | 1.1%), and China (48 | 0.7%), together accounting for 29.3% of all Pershing County residents.
| Immigration Origin | # Population | % Population |
| Africa | 6 | 0.1% |
| Armenia | 5 | 0.1% |
| Asia | 74 | 1.1% |
| Cameroon | 4 | 0.1% |
| Caribbean | 4 | 0.1% |
| Central America | 617 | 9.4% |
| China | 48 | 0.7% |
| Dominican Republic | 4 | 0.1% |
| Eastern Asia | 48 | 0.7% |
| El Salvador | 30 | 0.5% |
| Europe | 16 | 0.2% |
| Germany | 11 | 0.2% |
| Guatemala | 4 | 0.1% |
| Honduras | 4 | 0.1% |
| Latin America | 621 | 9.4% |
| Mexico | 569 | 8.6% |
| Middle Africa | 4 | 0.1% |
| Nicaragua | 6 | 0.1% |
| Northern Europe | 5 | 0.1% |
| Panama | 4 | 0.1% |
| Philippines | 21 | 0.3% |
| South Eastern Asia | 21 | 0.3% |
| Western Asia | 5 | 0.1% |
| Western Europe | 11 | 0.2% | View All 24 Rows |
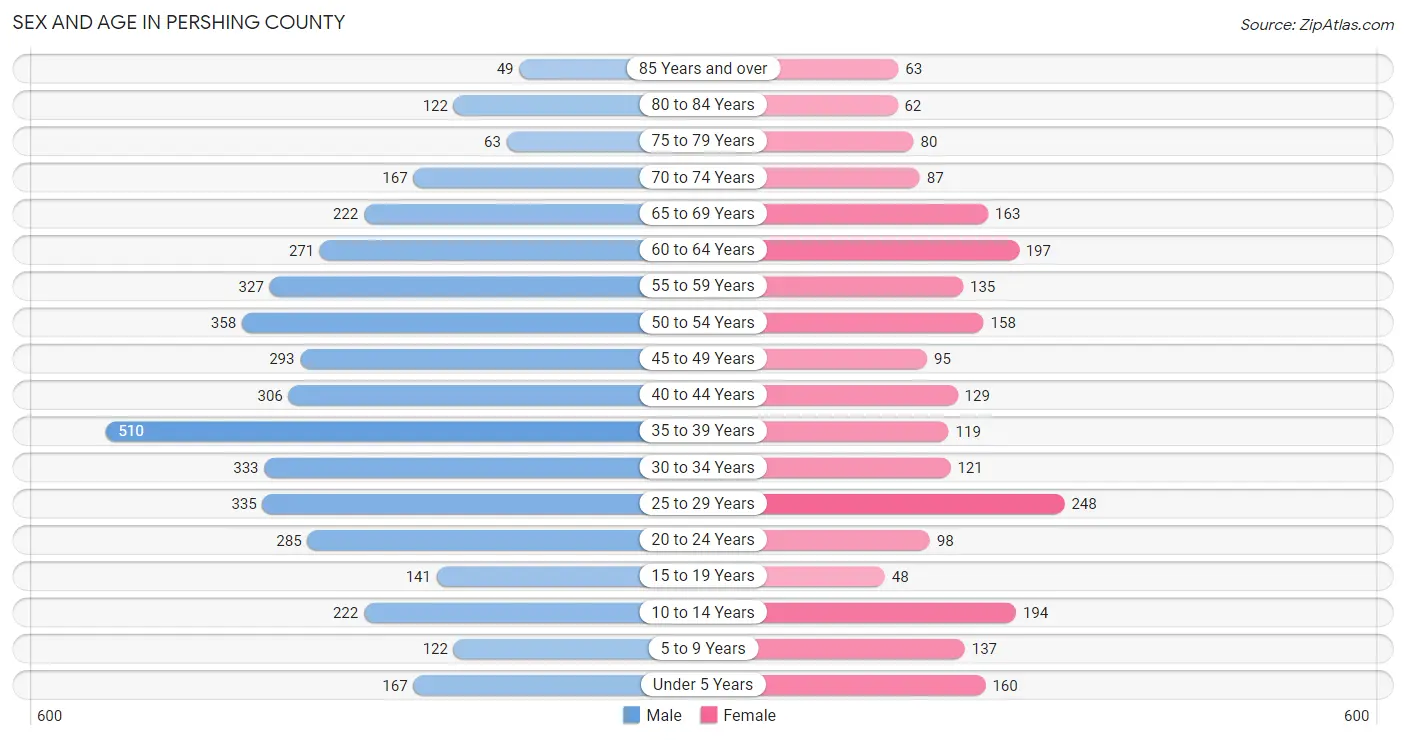
Sex and Age in Pershing County
Sex and Age in Pershing County
The most populous age groups in Pershing County are 35 to 39 Years (510 | 11.9%) for men and 25 to 29 Years (248 | 10.8%) for women.
| Age Bracket | Male | Female |
| Under 5 Years | 167 (3.9%) | 160 (7.0%) |
| 5 to 9 Years | 122 (2.8%) | 137 (6.0%) |
| 10 to 14 Years | 222 (5.2%) | 194 (8.5%) |
| 15 to 19 Years | 141 (3.3%) | 48 (2.1%) |
| 20 to 24 Years | 285 (6.6%) | 98 (4.3%) |
| 25 to 29 Years | 335 (7.8%) | 248 (10.8%) |
| 30 to 34 Years | 333 (7.8%) | 121 (5.3%) |
| 35 to 39 Years | 510 (11.9%) | 119 (5.2%) |
| 40 to 44 Years | 306 (7.1%) | 129 (5.6%) |
| 45 to 49 Years | 293 (6.8%) | 95 (4.1%) |
| 50 to 54 Years | 358 (8.3%) | 158 (6.9%) |
| 55 to 59 Years | 327 (7.6%) | 135 (5.9%) |
| 60 to 64 Years | 271 (6.3%) | 197 (8.6%) |
| 65 to 69 Years | 222 (5.2%) | 163 (7.1%) |
| 70 to 74 Years | 167 (3.9%) | 87 (3.8%) |
| 75 to 79 Years | 63 (1.5%) | 80 (3.5%) |
| 80 to 84 Years | 122 (2.8%) | 62 (2.7%) |
| 85 Years and over | 49 (1.1%) | 63 (2.8%) |
| Total | 4,293 (100.0%) | 2,294 (100.0%) |
Families and Households in Pershing County
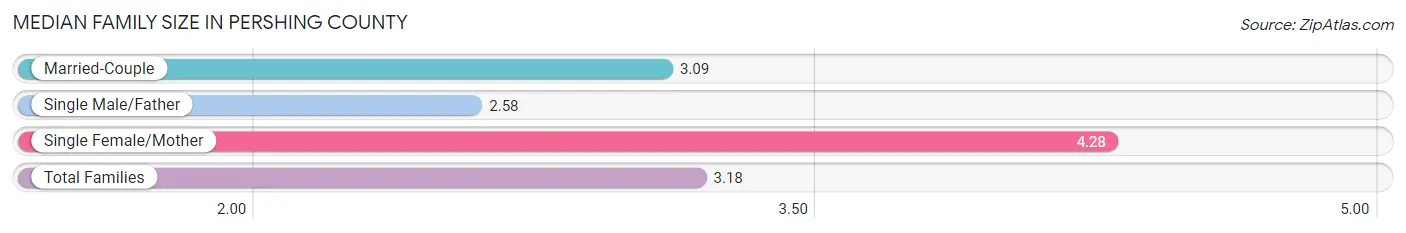
Median Family Size in Pershing County
The median family size in Pershing County is 3.18 persons per family, with single female/mother families (130 | 10.1%) accounting for the largest median family size of 4.28 persons per family. On the other hand, single male/father families (64 | 5.0%) represent the smallest median family size with 2.58 persons per family.
| Family Type | # Families | Family Size |
| Married-Couple | 1,095 (85.0%) | 3.09 |
| Single Male/Father | 64 (5.0%) | 2.58 |
| Single Female/Mother | 130 (10.1%) | 4.28 |
| Total Families | 1,289 (100.0%) | 3.18 |
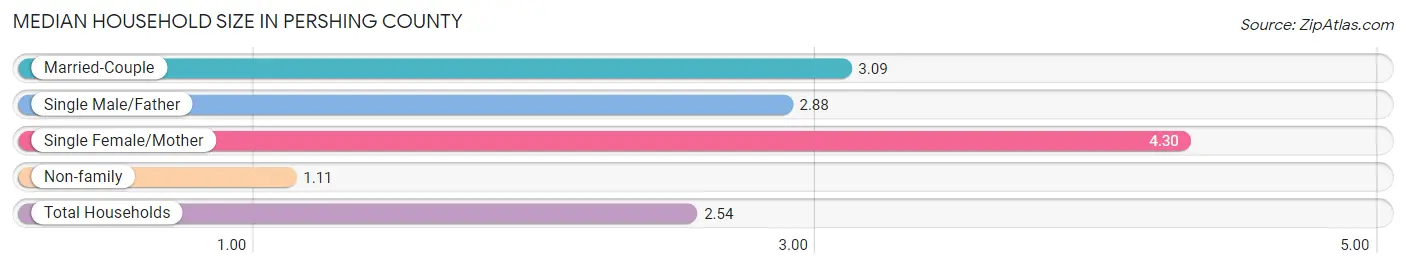
Median Household Size in Pershing County
The median household size in Pershing County is 2.54 persons per household, with single female/mother households (130 | 6.9%) accounting for the largest median household size of 4.3 persons per household. non-family households (597 | 31.7%) represent the smallest median household size with 1.11 persons per household.
| Household Type | # Households | Household Size |
| Married-Couple | 1,095 (58.1%) | 3.09 |
| Single Male/Father | 64 (3.4%) | 2.88 |
| Single Female/Mother | 130 (6.9%) | 4.30 |
| Non-family | 597 (31.7%) | 1.11 |
| Total Households | 1,886 (100.0%) | 2.54 |
Household Size by Marriage Status in Pershing County
Out of a total of 1,886 households in Pershing County, 1,289 (68.3%) are family households, while 597 (31.7%) are nonfamily households. The most numerous type of family households are 2-person households, comprising 662, and the most common type of nonfamily households are 1-person households, comprising 529.
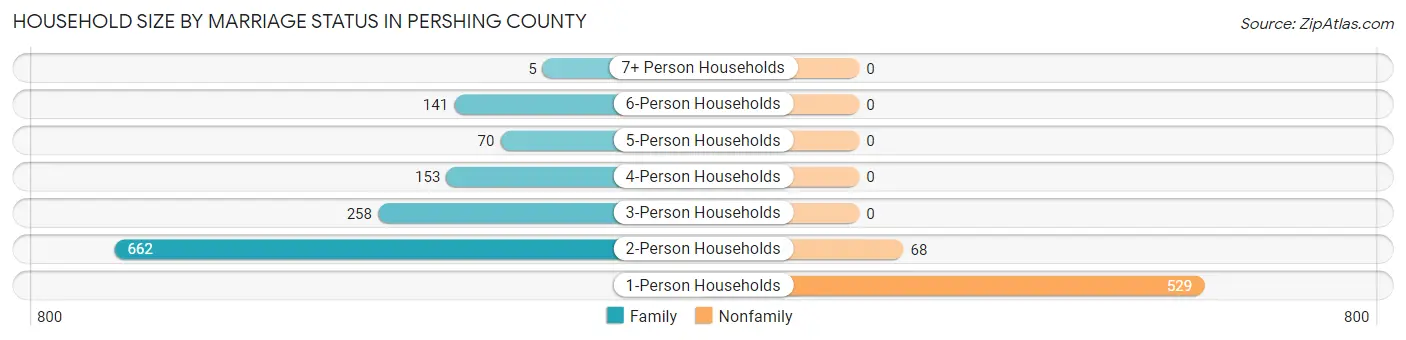
| Household Size | Family Households | Nonfamily Households |
| 1-Person Households | - | 529 (28.1%) |
| 2-Person Households | 662 (35.1%) | 68 (3.6%) |
| 3-Person Households | 258 (13.7%) | 0 (0.0%) |
| 4-Person Households | 153 (8.1%) | 0 (0.0%) |
| 5-Person Households | 70 (3.7%) | 0 (0.0%) |
| 6-Person Households | 141 (7.5%) | 0 (0.0%) |
| 7+ Person Households | 5 (0.3%) | 0 (0.0%) |
| Total | 1,289 (68.3%) | 597 (31.7%) |
Female Fertility in Pershing County
Fertility by Age in Pershing County
Average fertility rate in Pershing County is 28.0 births per 1,000 women. Women in the age bracket of 20 to 34 years have the highest fertility rate with 45.0 births per 1,000 women. Women in the age bracket of 20 to 34 years acount for 80.8% of all women with births.
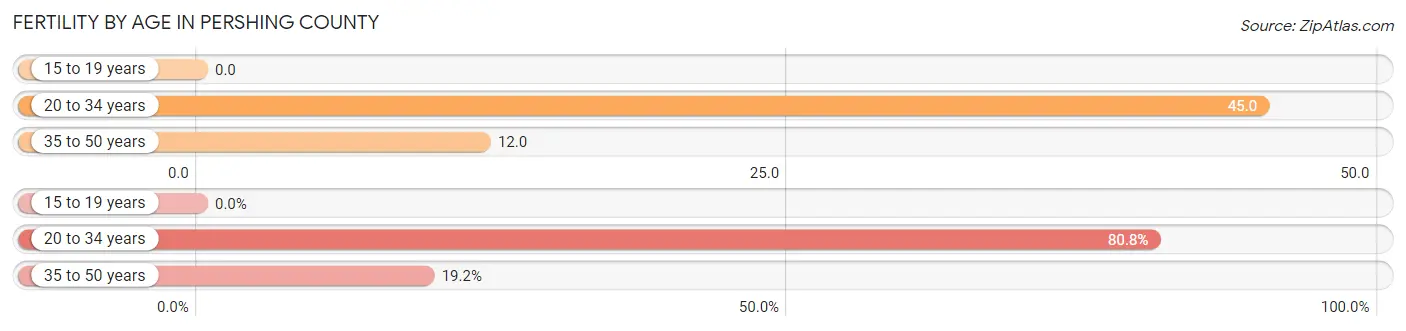
| Age Bracket | Women with Births | Births / 1,000 Women |
| 15 to 19 years | 0 (0.0%) | 0.0 |
| 20 to 34 years | 21 (80.8%) | 45.0 |
| 35 to 50 years | 5 (19.2%) | 12.0 |
| Total | 26 (100.0%) | 28.0 |
Fertility by Age by Marriage Status in Pershing County
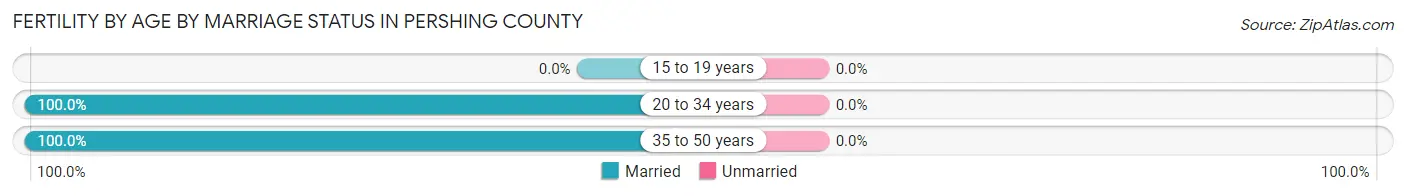
| Age Bracket | Married | Unmarried |
| 15 to 19 years | 0 (0.0%) | 0 (0.0%) |
| 20 to 34 years | 21 (100.0%) | 0 (0.0%) |
| 35 to 50 years | 5 (100.0%) | 0 (0.0%) |
| Total | 26 (100.0%) | 0 (0.0%) |
Fertility by Education in Pershing County
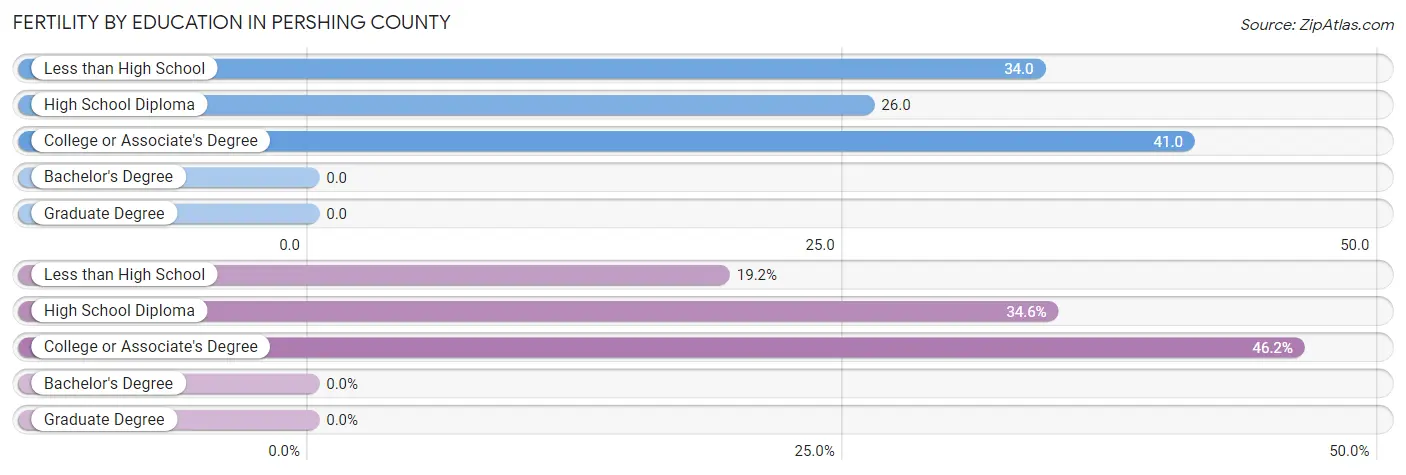
| Educational Attainment | Women with Births | Births / 1,000 Women |
| Less than High School | 5 (19.2%) | 34.0 |
| High School Diploma | 9 (34.6%) | 26.0 |
| College or Associate's Degree | 12 (46.2%) | 41.0 |
| Bachelor's Degree | 0 (0.0%) | 0.0 |
| Graduate Degree | 0 (0.0%) | 0.0 |
| Total | 26 (100.0%) | 28.0 |
Fertility by Education by Marriage Status in Pershing County
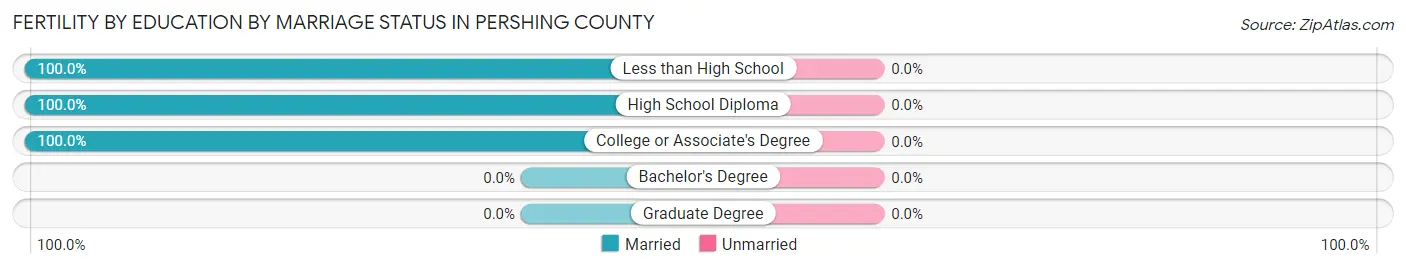
| Educational Attainment | Married | Unmarried |
| Less than High School | 5 (100.0%) | 0 (0.0%) |
| High School Diploma | 9 (100.0%) | 0 (0.0%) |
| College or Associate's Degree | 12 (100.0%) | 0 (0.0%) |
| Bachelor's Degree | 0 (0.0%) | 0 (0.0%) |
| Graduate Degree | 0 (0.0%) | 0 (0.0%) |
| Total | 26 (100.0%) | 0 (0.0%) |
Employment Characteristics in Pershing County
Employment by Class of Employer in Pershing County
Among the 1,993 employed individuals in Pershing County, private company employees (1,353 | 67.9%), state government employees (191 | 9.6%), and local government employees (171 | 8.6%) make up the most common classes of employment.
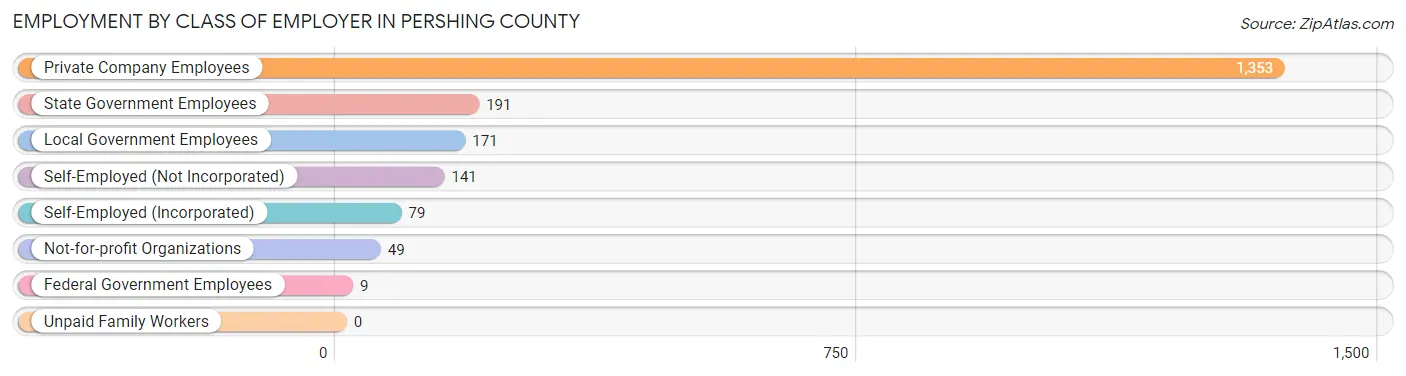
| Employer Class | # Employees | % Employees |
| Private Company Employees | 1,353 | 67.9% |
| Self-Employed (Incorporated) | 79 | 4.0% |
| Self-Employed (Not Incorporated) | 141 | 7.1% |
| Not-for-profit Organizations | 49 | 2.5% |
| Local Government Employees | 171 | 8.6% |
| State Government Employees | 191 | 9.6% |
| Federal Government Employees | 9 | 0.4% |
| Unpaid Family Workers | 0 | 0.0% |
| Total | 1,993 | 100.0% |
Employment Status by Age in Pershing County
According to the labor force statistics for Pershing County, out of the total population over 16 years of age (5,561), 40.0% or 2,224 individuals are in the labor force, with 8.5% or 189 of them unemployed. The age group with the highest labor force participation rate is 25 to 29 years, with 60.9% or 355 individuals in the labor force. Within the labor force, the 16 to 19 years age range has the highest percentage of unemployed individuals, with 34.8% or 23 of them being unemployed.
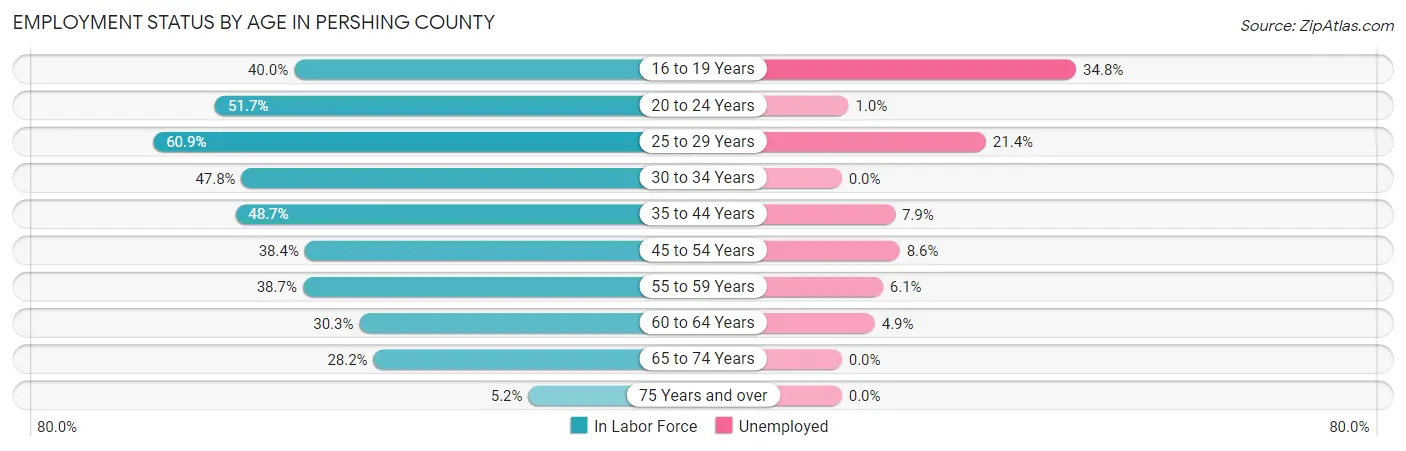
| Age Bracket | In Labor Force | Unemployed |
| 16 to 19 Years | 66 (40.0%) | 23 (34.8%) |
| 20 to 24 Years | 198 (51.7%) | 2 (1.0%) |
| 25 to 29 Years | 355 (60.9%) | 76 (21.4%) |
| 30 to 34 Years | 217 (47.8%) | 0 (0.0%) |
| 35 to 44 Years | 518 (48.7%) | 41 (7.9%) |
| 45 to 54 Years | 347 (38.4%) | 30 (8.6%) |
| 55 to 59 Years | 179 (38.7%) | 11 (6.1%) |
| 60 to 64 Years | 142 (30.3%) | 7 (4.9%) |
| 65 to 74 Years | 180 (28.2%) | 0 (0.0%) |
| 75 Years and over | 23 (5.2%) | 0 (0.0%) |
| Total | 2,224 (40.0%) | 189 (8.5%) |
Employment Status by Educational Attainment in Pershing County
According to labor force statistics for Pershing County, 44.7% of individuals (1,759) out of the total population between 25 and 64 years of age (3,935) are in the labor force, with 9.4% or 165 of them being unemployed. The group with the highest labor force participation rate are those with the educational attainment of bachelor's degree or higher, with 69.9% or 237 individuals in the labor force. Within the labor force, individuals with less than high school education have the highest percentage of unemployment, with 21.6% or 48 of them being unemployed.
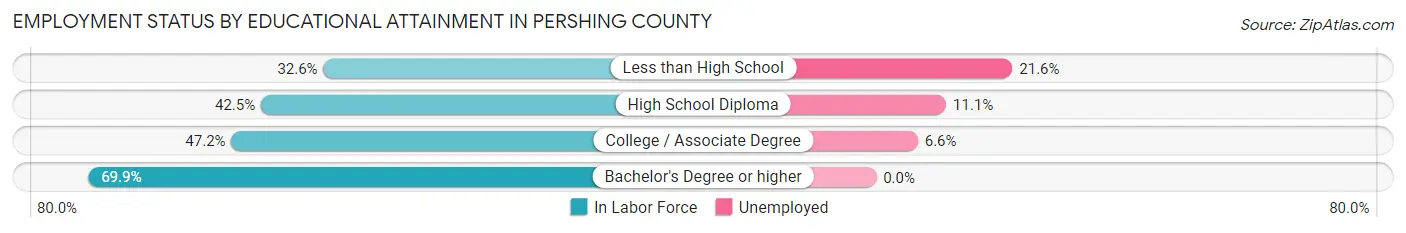
| Educational Attainment | In Labor Force | Unemployed |
| Less than High School | 222 (32.6%) | 147 (21.6%) |
| High School Diploma | 705 (42.5%) | 184 (11.1%) |
| College / Associate Degree | 594 (47.2%) | 83 (6.6%) |
| Bachelor's Degree or higher | 237 (69.9%) | 0 (0.0%) |
| Total | 1,759 (44.7%) | 370 (9.4%) |
Employment Occupations by Sex in Pershing County
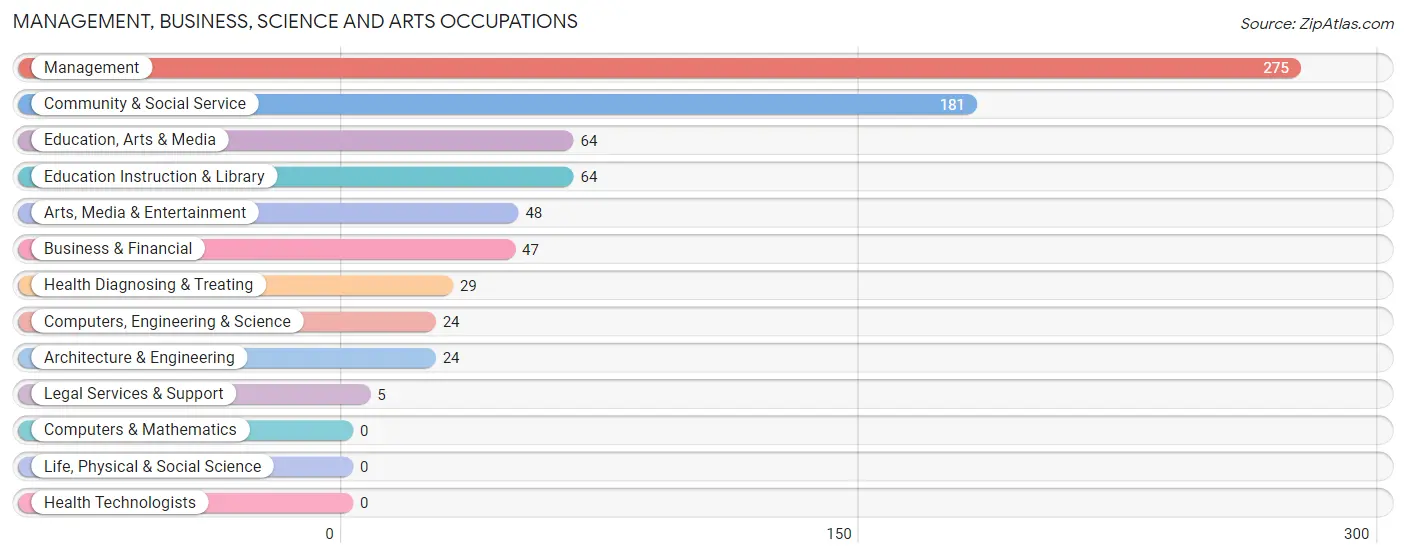
Management, Business, Science and Arts Occupations
The most common Management, Business, Science and Arts occupations in Pershing County are Management (275 | 13.5%), Community & Social Service (181 | 8.9%), Education, Arts & Media (64 | 3.1%), Education Instruction & Library (64 | 3.1%), and Arts, Media & Entertainment (48 | 2.4%).
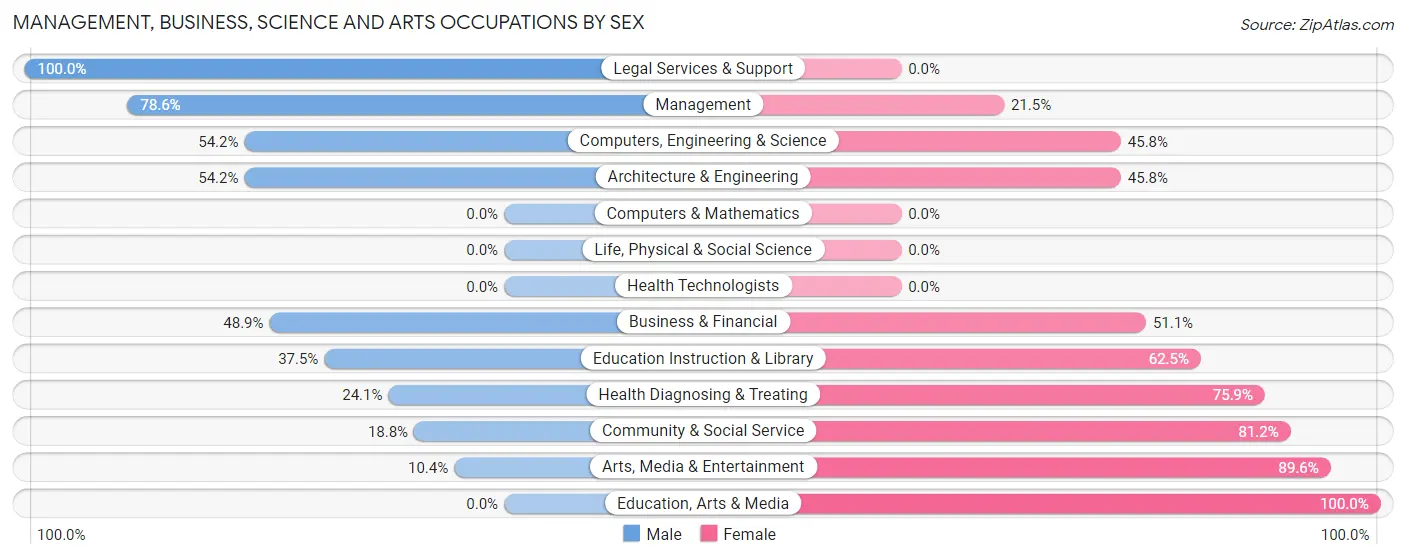
Management, Business, Science and Arts Occupations by Sex
Within the Management, Business, Science and Arts occupations in Pershing County, the most male-oriented occupations are Legal Services & Support (100.0%), Management (78.5%), and Computers, Engineering & Science (54.2%), while the most female-oriented occupations are Education, Arts & Media (100.0%), Arts, Media & Entertainment (89.6%), and Community & Social Service (81.2%).
| Occupation | Male | Female |
| Management | 216 (78.5%) | 59 (21.4%) |
| Business & Financial | 23 (48.9%) | 24 (51.1%) |
| Computers, Engineering & Science | 13 (54.2%) | 11 (45.8%) |
| Computers & Mathematics | 0 (0.0%) | 0 (0.0%) |
| Architecture & Engineering | 13 (54.2%) | 11 (45.8%) |
| Life, Physical & Social Science | 0 (0.0%) | 0 (0.0%) |
| Community & Social Service | 34 (18.8%) | 147 (81.2%) |
| Education, Arts & Media | 0 (0.0%) | 64 (100.0%) |
| Legal Services & Support | 5 (100.0%) | 0 (0.0%) |
| Education Instruction & Library | 24 (37.5%) | 40 (62.5%) |
| Arts, Media & Entertainment | 5 (10.4%) | 43 (89.6%) |
| Health Diagnosing & Treating | 7 (24.1%) | 22 (75.9%) |
| Health Technologists | 0 (0.0%) | 0 (0.0%) |
| Total (Category) | 293 (52.7%) | 263 (47.3%) |
| Total (Overall) | 1,190 (58.5%) | 845 (41.5%) |
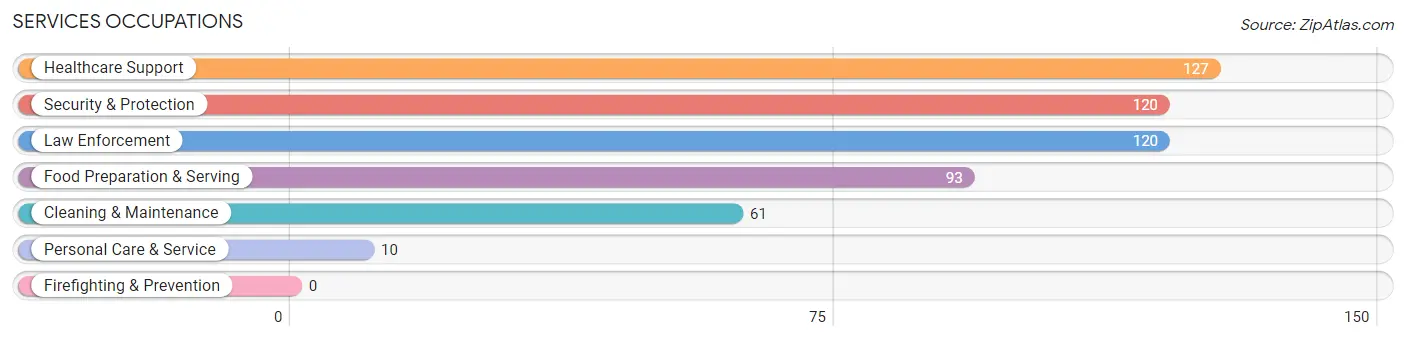
Services Occupations
The most common Services occupations in Pershing County are Healthcare Support (127 | 6.2%), Security & Protection (120 | 5.9%), Law Enforcement (120 | 5.9%), Food Preparation & Serving (93 | 4.6%), and Cleaning & Maintenance (61 | 3.0%).
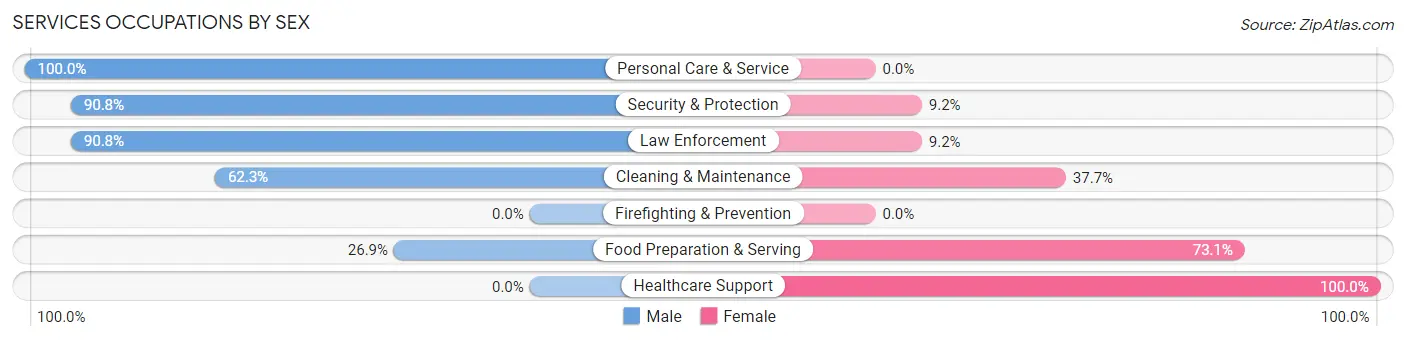
Services Occupations by Sex
Within the Services occupations in Pershing County, the most male-oriented occupations are Personal Care & Service (100.0%), Security & Protection (90.8%), and Law Enforcement (90.8%), while the most female-oriented occupations are Healthcare Support (100.0%), Food Preparation & Serving (73.1%), and Cleaning & Maintenance (37.7%).
| Occupation | Male | Female |
| Healthcare Support | 0 (0.0%) | 127 (100.0%) |
| Security & Protection | 109 (90.8%) | 11 (9.2%) |
| Firefighting & Prevention | 0 (0.0%) | 0 (0.0%) |
| Law Enforcement | 109 (90.8%) | 11 (9.2%) |
| Food Preparation & Serving | 25 (26.9%) | 68 (73.1%) |
| Cleaning & Maintenance | 38 (62.3%) | 23 (37.7%) |
| Personal Care & Service | 10 (100.0%) | 0 (0.0%) |
| Total (Category) | 182 (44.3%) | 229 (55.7%) |
| Total (Overall) | 1,190 (58.5%) | 845 (41.5%) |
Sales and Office Occupations
The most common Sales and Office occupations in Pershing County are Sales & Related (140 | 6.9%), and Office & Administration (122 | 6.0%).
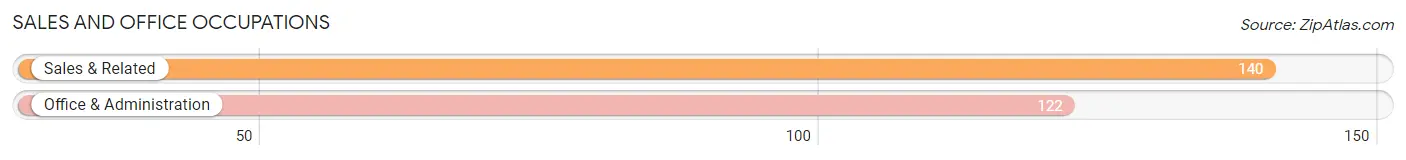
Sales and Office Occupations by Sex
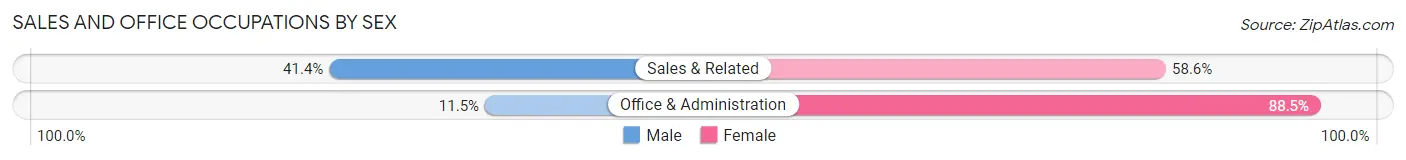
| Occupation | Male | Female |
| Sales & Related | 58 (41.4%) | 82 (58.6%) |
| Office & Administration | 14 (11.5%) | 108 (88.5%) |
| Total (Category) | 72 (27.5%) | 190 (72.5%) |
| Total (Overall) | 1,190 (58.5%) | 845 (41.5%) |
Natural Resources, Construction and Maintenance Occupations
The most common Natural Resources, Construction and Maintenance occupations in Pershing County are Construction & Extraction (401 | 19.7%), Installation, Maintenance & Repair (109 | 5.4%), and Farming, Fishing & Forestry (20 | 1.0%).
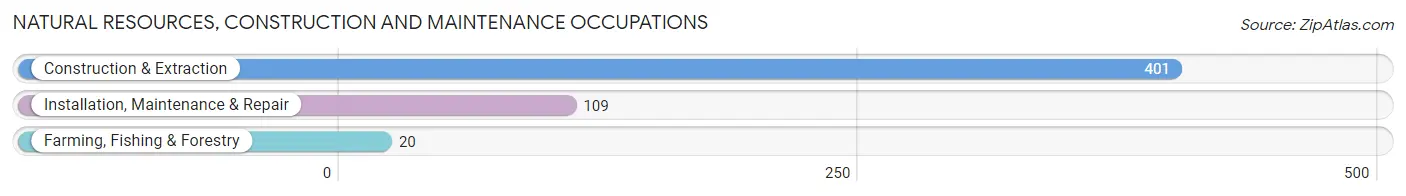
Natural Resources, Construction and Maintenance Occupations by Sex
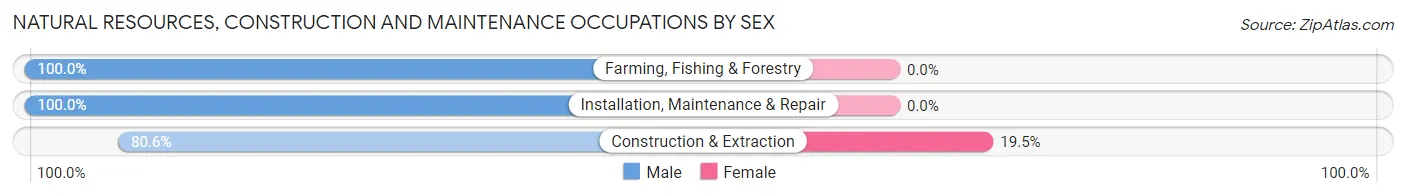
| Occupation | Male | Female |
| Farming, Fishing & Forestry | 20 (100.0%) | 0 (0.0%) |
| Construction & Extraction | 323 (80.5%) | 78 (19.5%) |
| Installation, Maintenance & Repair | 109 (100.0%) | 0 (0.0%) |
| Total (Category) | 452 (85.3%) | 78 (14.7%) |
| Total (Overall) | 1,190 (58.5%) | 845 (41.5%) |
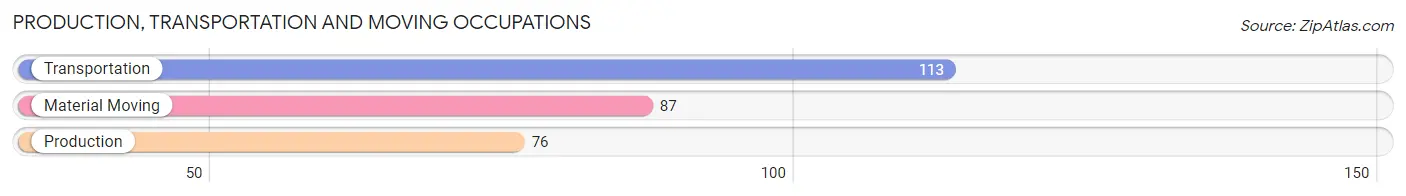
Production, Transportation and Moving Occupations
The most common Production, Transportation and Moving occupations in Pershing County are Transportation (113 | 5.6%), Material Moving (87 | 4.3%), and Production (76 | 3.7%).
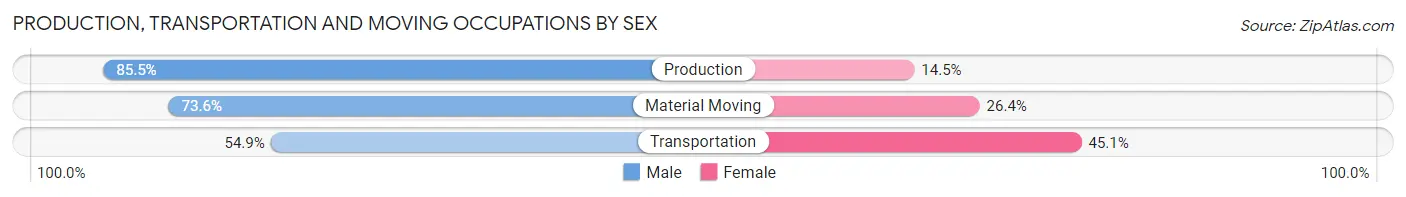
Production, Transportation and Moving Occupations by Sex
| Occupation | Male | Female |
| Production | 65 (85.5%) | 11 (14.5%) |
| Transportation | 62 (54.9%) | 51 (45.1%) |
| Material Moving | 64 (73.6%) | 23 (26.4%) |
| Total (Category) | 191 (69.2%) | 85 (30.8%) |
| Total (Overall) | 1,190 (58.5%) | 845 (41.5%) |
Employment Industries by Sex in Pershing County
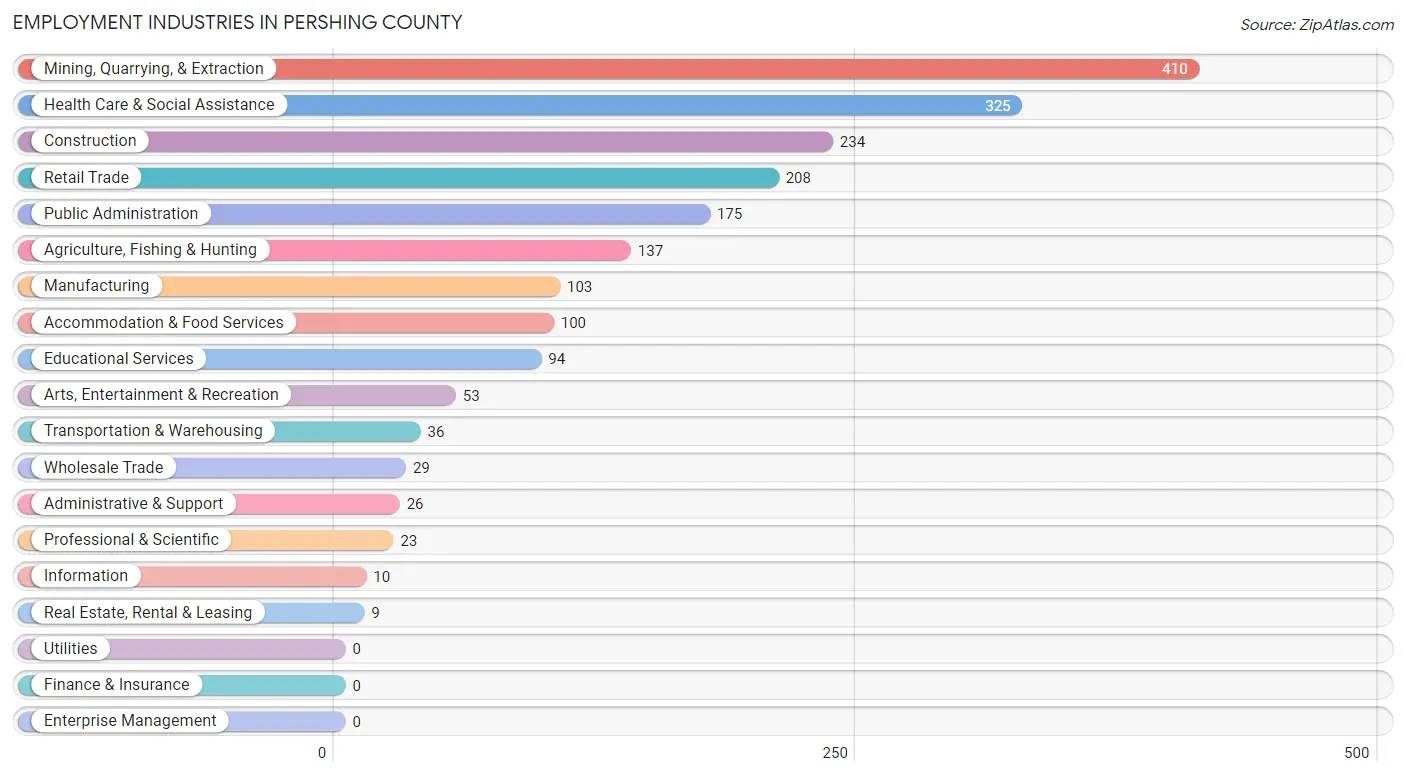
Employment Industries in Pershing County
The major employment industries in Pershing County include Mining, Quarrying, & Extraction (410 | 20.2%), Health Care & Social Assistance (325 | 16.0%), Construction (234 | 11.5%), Retail Trade (208 | 10.2%), and Public Administration (175 | 8.6%).
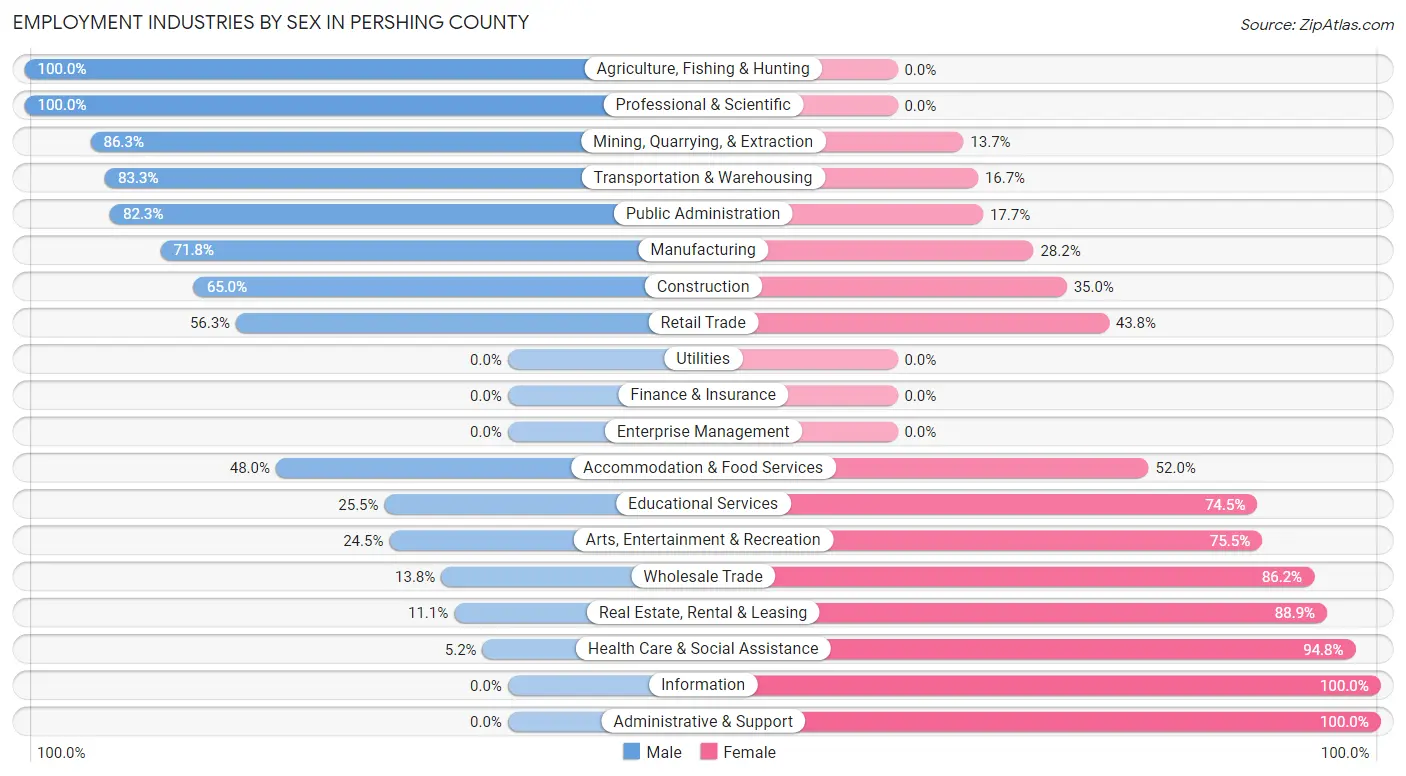
Employment Industries by Sex in Pershing County
The Pershing County industries that see more men than women are Agriculture, Fishing & Hunting (100.0%), Professional & Scientific (100.0%), and Mining, Quarrying, & Extraction (86.3%), whereas the industries that tend to have a higher number of women are Information (100.0%), Administrative & Support (100.0%), and Health Care & Social Assistance (94.8%).
| Industry | Male | Female |
| Agriculture, Fishing & Hunting | 137 (100.0%) | 0 (0.0%) |
| Mining, Quarrying, & Extraction | 354 (86.3%) | 56 (13.7%) |
| Construction | 152 (65.0%) | 82 (35.0%) |
| Manufacturing | 74 (71.8%) | 29 (28.2%) |
| Wholesale Trade | 4 (13.8%) | 25 (86.2%) |
| Retail Trade | 117 (56.2%) | 91 (43.8%) |
| Transportation & Warehousing | 30 (83.3%) | 6 (16.7%) |
| Utilities | 0 (0.0%) | 0 (0.0%) |
| Information | 0 (0.0%) | 10 (100.0%) |
| Finance & Insurance | 0 (0.0%) | 0 (0.0%) |
| Real Estate, Rental & Leasing | 1 (11.1%) | 8 (88.9%) |
| Professional & Scientific | 23 (100.0%) | 0 (0.0%) |
| Enterprise Management | 0 (0.0%) | 0 (0.0%) |
| Administrative & Support | 0 (0.0%) | 26 (100.0%) |
| Educational Services | 24 (25.5%) | 70 (74.5%) |
| Health Care & Social Assistance | 17 (5.2%) | 308 (94.8%) |
| Arts, Entertainment & Recreation | 13 (24.5%) | 40 (75.5%) |
| Accommodation & Food Services | 48 (48.0%) | 52 (52.0%) |
| Public Administration | 144 (82.3%) | 31 (17.7%) |
| Total | 1,190 (58.5%) | 845 (41.5%) |
Education in Pershing County
School Enrollment in Pershing County
The most common levels of schooling among the 1,207 students in Pershing County are middle school (338 | 28.0%), high school (323 | 26.8%), and elementary school (245 | 20.3%).
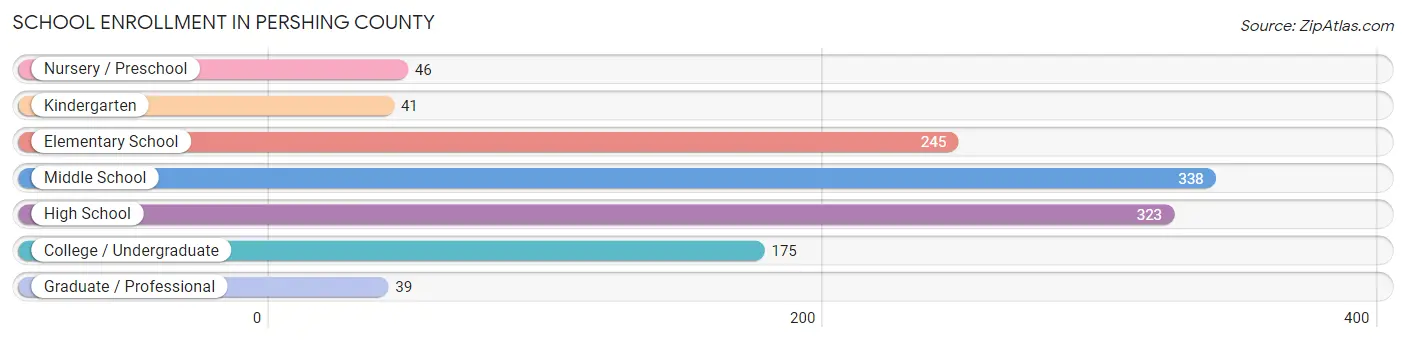
| School Level | # Students | % Students |
| Nursery / Preschool | 46 | 3.8% |
| Kindergarten | 41 | 3.4% |
| Elementary School | 245 | 20.3% |
| Middle School | 338 | 28.0% |
| High School | 323 | 26.8% |
| College / Undergraduate | 175 | 14.5% |
| Graduate / Professional | 39 | 3.2% |
| Total | 1,207 | 100.0% |
School Enrollment by Age by Funding Source in Pershing County
Out of a total of 1,207 students who are enrolled in schools in Pershing County, 53 (4.4%) attend a private institution, while the remaining 1,154 (95.6%) are enrolled in public schools. The age group of 3 to 4 year olds has the highest likelihood of being enrolled in private schools, with 30 (65.2% in the age bracket) enrolled. Conversely, the age group of 15 to 17 year olds has the lowest likelihood of being enrolled in a private school, with 110 (100.0% in the age bracket) attending a public institution.
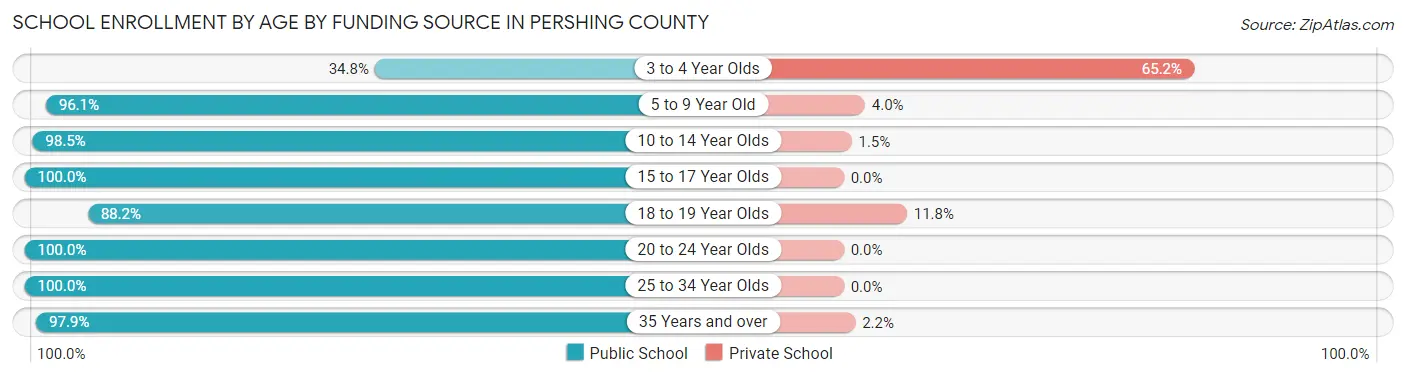
| Age Bracket | Public School | Private School |
| 3 to 4 Year Olds | 16 (34.8%) | 30 (65.2%) |
| 5 to 9 Year Old | 219 (96.1%) | 9 (4.0%) |
| 10 to 14 Year Olds | 405 (98.5%) | 6 (1.5%) |
| 15 to 17 Year Olds | 110 (100.0%) | 0 (0.0%) |
| 18 to 19 Year Olds | 30 (88.2%) | 4 (11.8%) |
| 20 to 24 Year Olds | 52 (100.0%) | 0 (0.0%) |
| 25 to 34 Year Olds | 140 (100.0%) | 0 (0.0%) |
| 35 Years and over | 182 (97.9%) | 4 (2.1%) |
| Total | 1,154 (95.6%) | 53 (4.4%) |
Educational Attainment by Field of Study in Pershing County
Education (87 | 16.2%), physical & health sciences (60 | 11.2%), science & technology (60 | 11.2%), engineering (57 | 10.6%), and bio, nature & agricultural (51 | 9.5%) are the most common fields of study among 537 individuals in Pershing County who have obtained a bachelor's degree or higher.
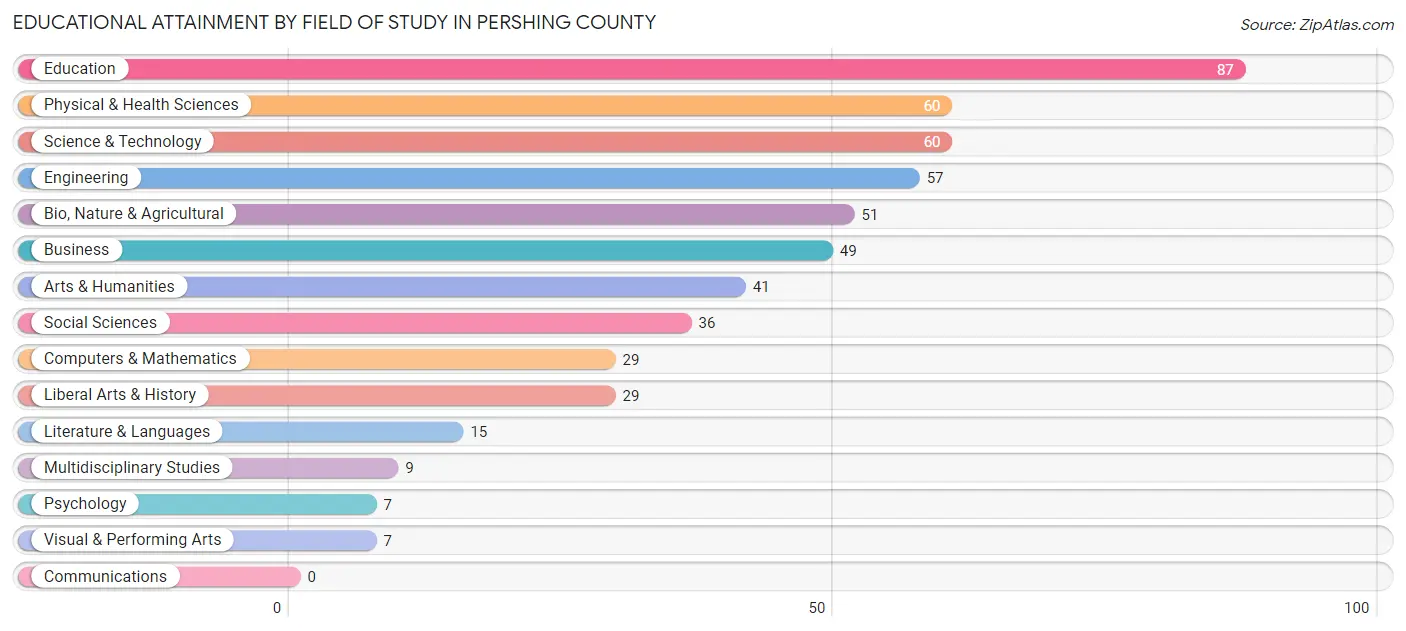
| Field of Study | # Graduates | % Graduates |
| Computers & Mathematics | 29 | 5.4% |
| Bio, Nature & Agricultural | 51 | 9.5% |
| Physical & Health Sciences | 60 | 11.2% |
| Psychology | 7 | 1.3% |
| Social Sciences | 36 | 6.7% |
| Engineering | 57 | 10.6% |
| Multidisciplinary Studies | 9 | 1.7% |
| Science & Technology | 60 | 11.2% |
| Business | 49 | 9.1% |
| Education | 87 | 16.2% |
| Literature & Languages | 15 | 2.8% |
| Liberal Arts & History | 29 | 5.4% |
| Visual & Performing Arts | 7 | 1.3% |
| Communications | 0 | 0.0% |
| Arts & Humanities | 41 | 7.6% |
| Total | 537 | 100.0% |
Transportation & Commute in Pershing County
Vehicle Availability by Sex in Pershing County
The most prevalent vehicle ownership categories in Pershing County are males with 2 vehicles (279, accounting for 23.9%) and females with 2 vehicles (138, making up 34.0%).
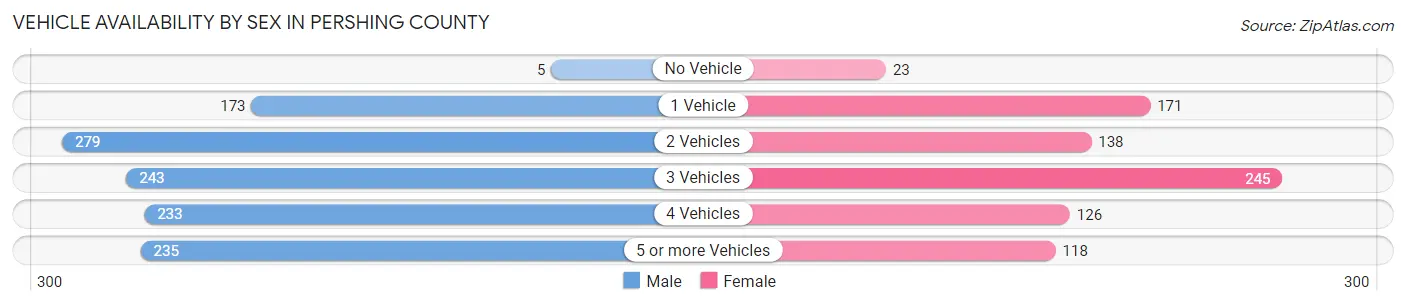
| Vehicles Available | Male | Female |
| No Vehicle | 5 (0.4%) | 23 (2.8%) |
| 1 Vehicle | 173 (14.8%) | 171 (20.8%) |
| 2 Vehicles | 279 (23.9%) | 138 (16.8%) |
| 3 Vehicles | 243 (20.8%) | 245 (29.8%) |
| 4 Vehicles | 233 (20.0%) | 126 (15.3%) |
| 5 or more Vehicles | 235 (20.1%) | 118 (14.4%) |
| Total | 1,168 (100.0%) | 821 (100.0%) |
Commute Time in Pershing County
The most frequently occuring commute durations in Pershing County are 10 to 14 minutes (363 commuters, 20.0%), 5 to 9 minutes (303 commuters, 16.7%), and 60 to 89 minutes (244 commuters, 13.4%).
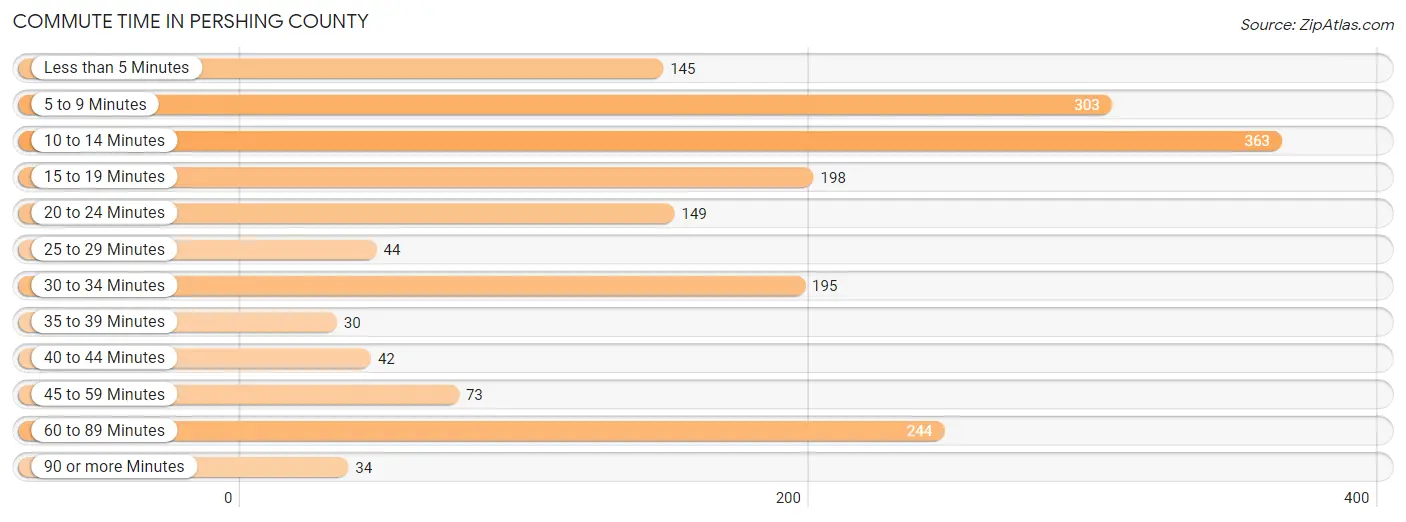
| Commute Time | # Commuters | % Commuters |
| Less than 5 Minutes | 145 | 8.0% |
| 5 to 9 Minutes | 303 | 16.7% |
| 10 to 14 Minutes | 363 | 20.0% |
| 15 to 19 Minutes | 198 | 10.9% |
| 20 to 24 Minutes | 149 | 8.2% |
| 25 to 29 Minutes | 44 | 2.4% |
| 30 to 34 Minutes | 195 | 10.7% |
| 35 to 39 Minutes | 30 | 1.7% |
| 40 to 44 Minutes | 42 | 2.3% |
| 45 to 59 Minutes | 73 | 4.0% |
| 60 to 89 Minutes | 244 | 13.4% |
| 90 or more Minutes | 34 | 1.9% |
Commute Time by Sex in Pershing County
The most common commute times in Pershing County are 10 to 14 minutes (190 commuters, 18.2%) for males and 10 to 14 minutes (173 commuters, 22.3%) for females.
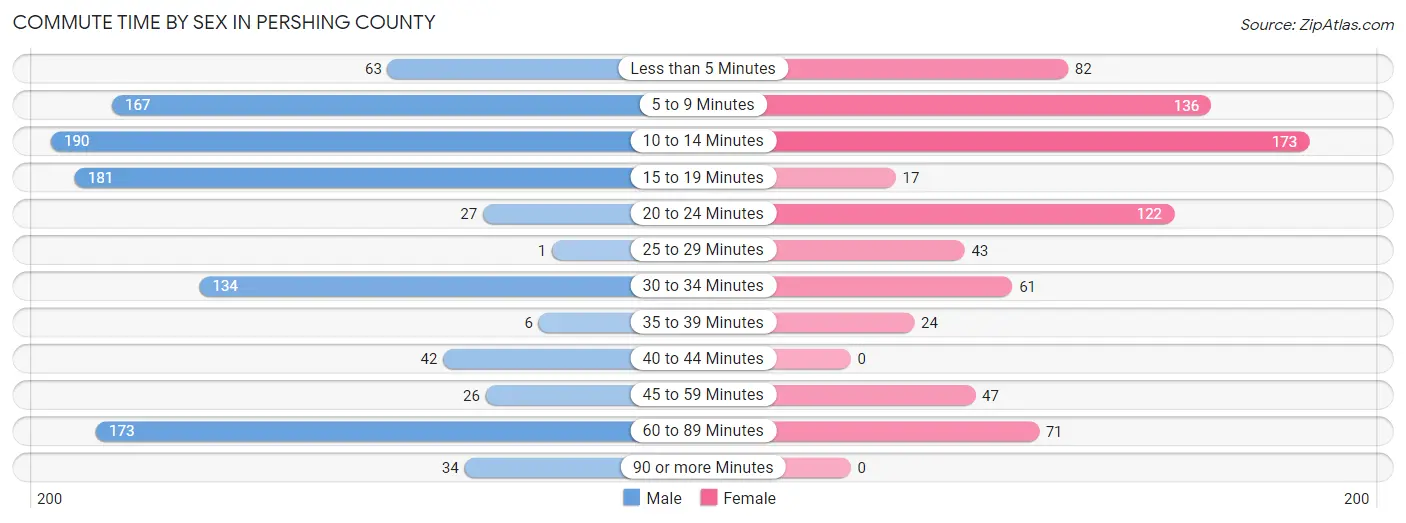
| Commute Time | Male | Female |
| Less than 5 Minutes | 63 (6.0%) | 82 (10.6%) |
| 5 to 9 Minutes | 167 (16.0%) | 136 (17.5%) |
| 10 to 14 Minutes | 190 (18.2%) | 173 (22.3%) |
| 15 to 19 Minutes | 181 (17.3%) | 17 (2.2%) |
| 20 to 24 Minutes | 27 (2.6%) | 122 (15.7%) |
| 25 to 29 Minutes | 1 (0.1%) | 43 (5.5%) |
| 30 to 34 Minutes | 134 (12.8%) | 61 (7.9%) |
| 35 to 39 Minutes | 6 (0.6%) | 24 (3.1%) |
| 40 to 44 Minutes | 42 (4.0%) | 0 (0.0%) |
| 45 to 59 Minutes | 26 (2.5%) | 47 (6.1%) |
| 60 to 89 Minutes | 173 (16.6%) | 71 (9.1%) |
| 90 or more Minutes | 34 (3.3%) | 0 (0.0%) |
Time of Departure to Work by Sex in Pershing County
The most frequent times of departure to work in Pershing County are 12:00 AM to 4:59 AM (359, 34.4%) for males and 7:00 AM to 7:29 AM (193, 24.9%) for females.
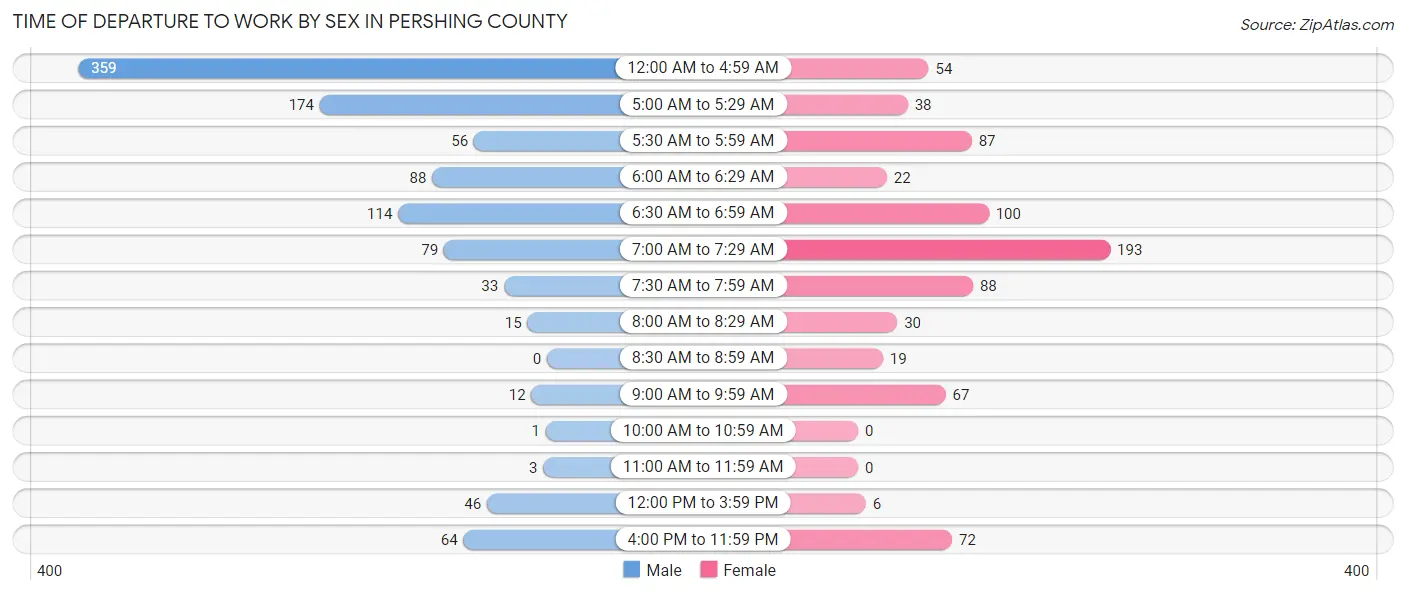
| Time of Departure | Male | Female |
| 12:00 AM to 4:59 AM | 359 (34.4%) | 54 (7.0%) |
| 5:00 AM to 5:29 AM | 174 (16.7%) | 38 (4.9%) |
| 5:30 AM to 5:59 AM | 56 (5.4%) | 87 (11.2%) |
| 6:00 AM to 6:29 AM | 88 (8.4%) | 22 (2.8%) |
| 6:30 AM to 6:59 AM | 114 (10.9%) | 100 (12.9%) |
| 7:00 AM to 7:29 AM | 79 (7.6%) | 193 (24.9%) |
| 7:30 AM to 7:59 AM | 33 (3.2%) | 88 (11.3%) |
| 8:00 AM to 8:29 AM | 15 (1.4%) | 30 (3.9%) |
| 8:30 AM to 8:59 AM | 0 (0.0%) | 19 (2.5%) |
| 9:00 AM to 9:59 AM | 12 (1.1%) | 67 (8.6%) |
| 10:00 AM to 10:59 AM | 1 (0.1%) | 0 (0.0%) |
| 11:00 AM to 11:59 AM | 3 (0.3%) | 0 (0.0%) |
| 12:00 PM to 3:59 PM | 46 (4.4%) | 6 (0.8%) |
| 4:00 PM to 11:59 PM | 64 (6.1%) | 72 (9.3%) |
| Total | 1,044 (100.0%) | 776 (100.0%) |
Housing Occupancy in Pershing County
Occupancy by Ownership in Pershing County
Of the total 1,886 dwellings in Pershing County, owner-occupied units account for 1,377 (73.0%), while renter-occupied units make up 509 (27.0%).
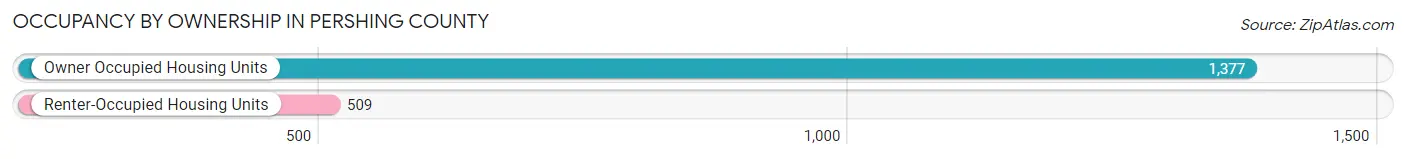
| Occupancy | # Housing Units | % Housing Units |
| Owner Occupied Housing Units | 1,377 | 73.0% |
| Renter-Occupied Housing Units | 509 | 27.0% |
| Total Occupied Housing Units | 1,886 | 100.0% |
Occupancy by Household Size in Pershing County
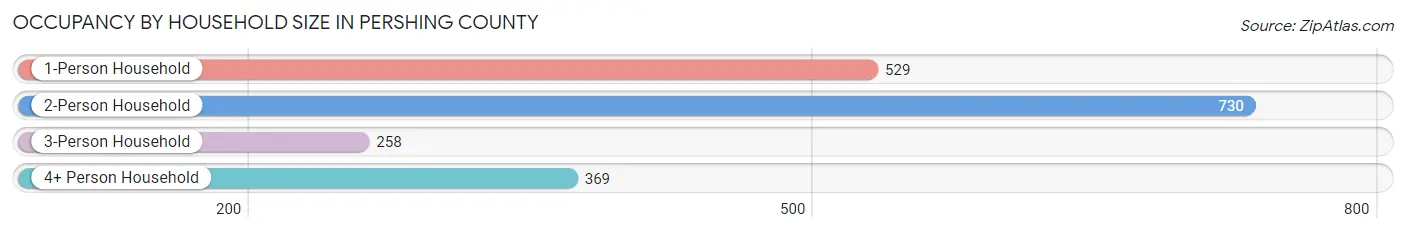
| Household Size | # Housing Units | % Housing Units |
| 1-Person Household | 529 | 28.1% |
| 2-Person Household | 730 | 38.7% |
| 3-Person Household | 258 | 13.7% |
| 4+ Person Household | 369 | 19.6% |
| Total Housing Units | 1,886 | 100.0% |
Occupancy by Ownership by Household Size in Pershing County
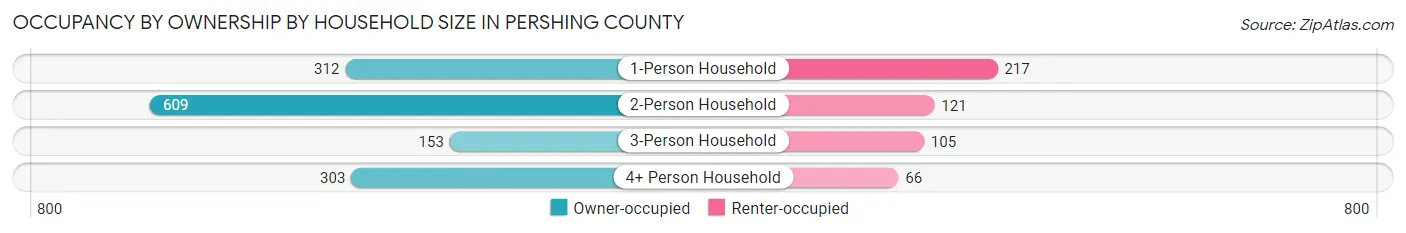
| Household Size | Owner-occupied | Renter-occupied |
| 1-Person Household | 312 (59.0%) | 217 (41.0%) |
| 2-Person Household | 609 (83.4%) | 121 (16.6%) |
| 3-Person Household | 153 (59.3%) | 105 (40.7%) |
| 4+ Person Household | 303 (82.1%) | 66 (17.9%) |
| Total Housing Units | 1,377 (73.0%) | 509 (27.0%) |
Occupancy by Educational Attainment in Pershing County
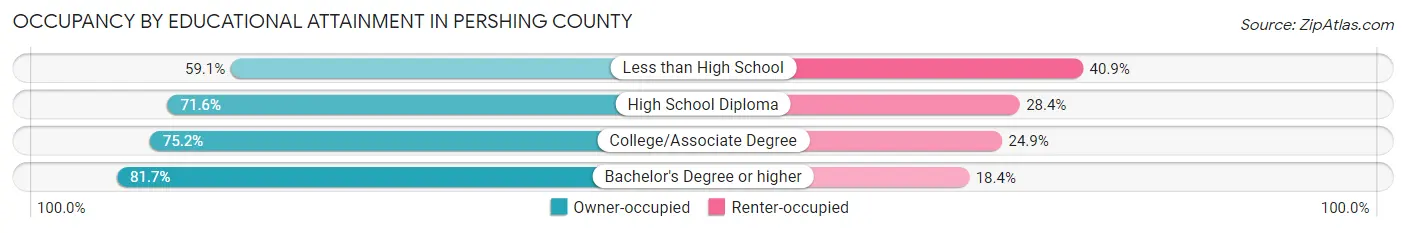
| Household Size | Owner-occupied | Renter-occupied |
| Less than High School | 114 (59.1%) | 79 (40.9%) |
| High School Diploma | 543 (71.6%) | 215 (28.4%) |
| College/Associate Degree | 502 (75.1%) | 166 (24.8%) |
| Bachelor's Degree or higher | 218 (81.7%) | 49 (18.3%) |
Occupancy by Age of Householder in Pershing County
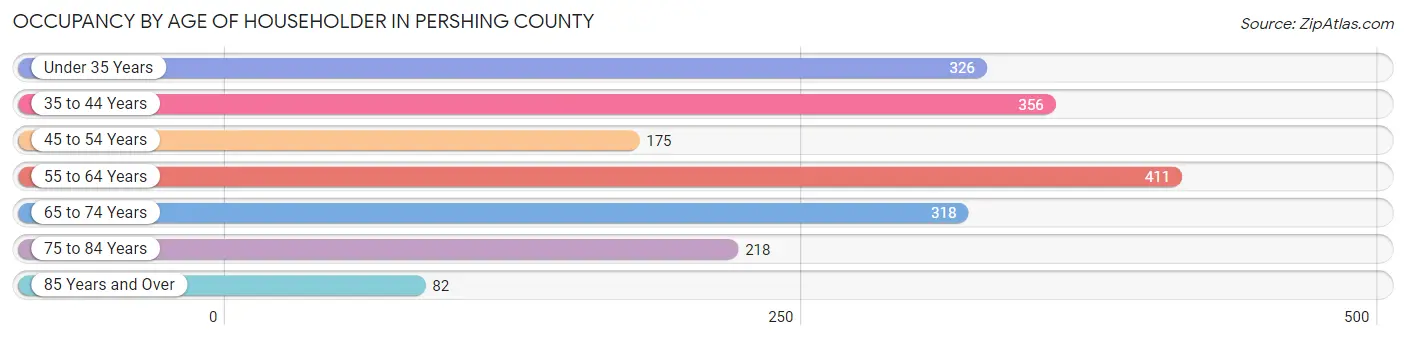
| Age Bracket | # Households | % Households |
| Under 35 Years | 326 | 17.3% |
| 35 to 44 Years | 356 | 18.9% |
| 45 to 54 Years | 175 | 9.3% |
| 55 to 64 Years | 411 | 21.8% |
| 65 to 74 Years | 318 | 16.9% |
| 75 to 84 Years | 218 | 11.6% |
| 85 Years and Over | 82 | 4.3% |
| Total | 1,886 | 100.0% |
Housing Finances in Pershing County
Median Income by Occupancy in Pershing County
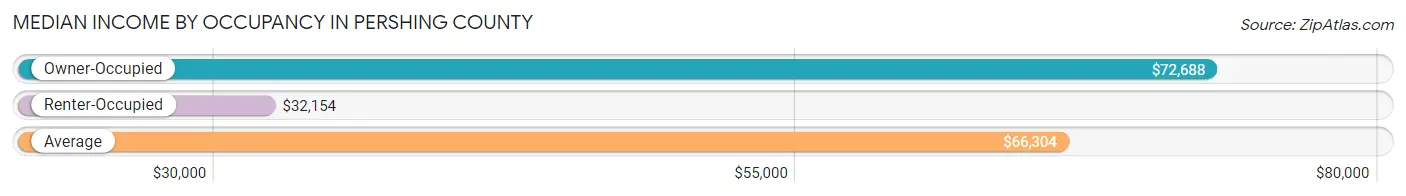
| Occupancy Type | # Households | Median Income |
| Owner-Occupied | 1,377 (73.0%) | $72,688 |
| Renter-Occupied | 509 (27.0%) | $32,154 |
| Average | 1,886 (100.0%) | $66,304 |
Occupancy by Householder Income Bracket in Pershing County
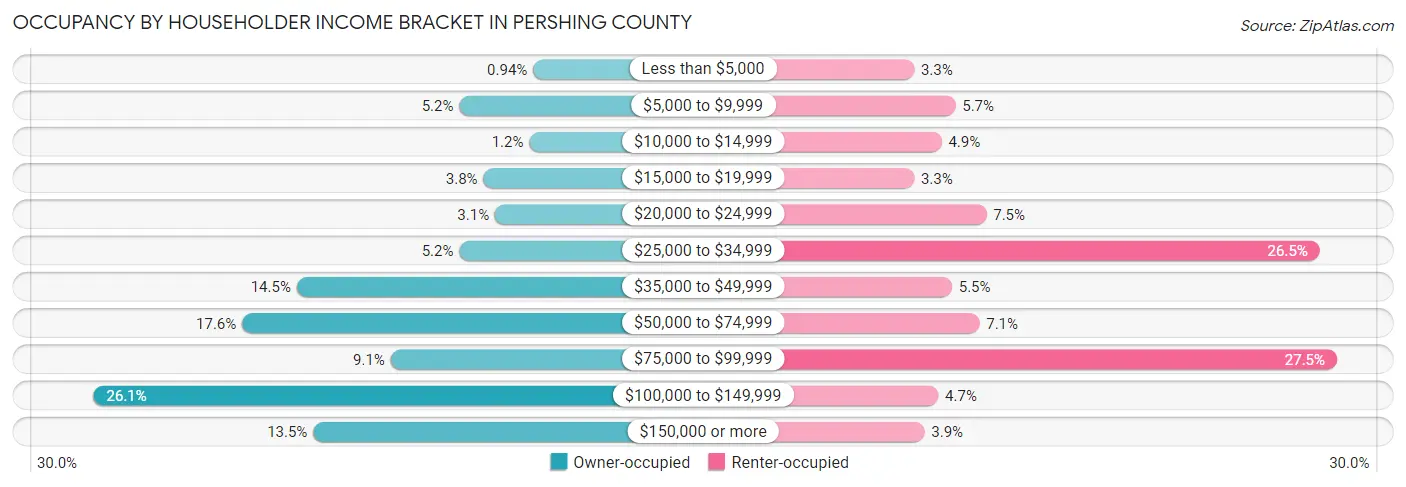
| Income Bracket | Owner-occupied | Renter-occupied |
| Less than $5,000 | 13 (0.9%) | 17 (3.3%) |
| $5,000 to $9,999 | 71 (5.2%) | 29 (5.7%) |
| $10,000 to $14,999 | 16 (1.2%) | 25 (4.9%) |
| $15,000 to $19,999 | 52 (3.8%) | 17 (3.3%) |
| $20,000 to $24,999 | 43 (3.1%) | 38 (7.5%) |
| $25,000 to $34,999 | 71 (5.2%) | 135 (26.5%) |
| $35,000 to $49,999 | 199 (14.4%) | 28 (5.5%) |
| $50,000 to $74,999 | 242 (17.6%) | 36 (7.1%) |
| $75,000 to $99,999 | 125 (9.1%) | 140 (27.5%) |
| $100,000 to $149,999 | 359 (26.1%) | 24 (4.7%) |
| $150,000 or more | 186 (13.5%) | 20 (3.9%) |
| Total | 1,377 (100.0%) | 509 (100.0%) |
Monthly Housing Cost Tiers in Pershing County
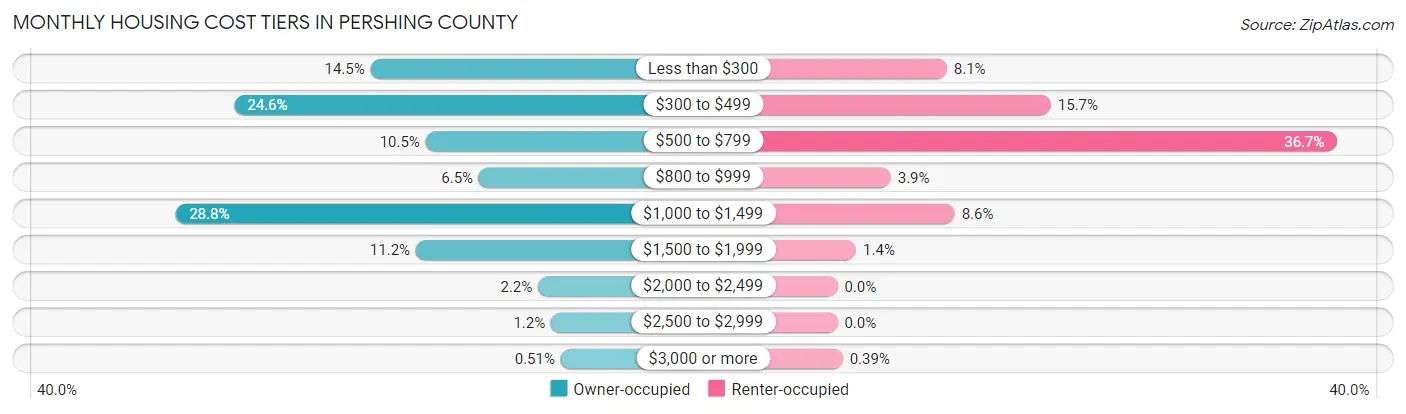
| Monthly Cost | Owner-occupied | Renter-occupied |
| Less than $300 | 200 (14.5%) | 41 (8.1%) |
| $300 to $499 | 338 (24.5%) | 80 (15.7%) |
| $500 to $799 | 144 (10.5%) | 187 (36.7%) |
| $800 to $999 | 90 (6.5%) | 20 (3.9%) |
| $1,000 to $1,499 | 397 (28.8%) | 44 (8.6%) |
| $1,500 to $1,999 | 154 (11.2%) | 7 (1.4%) |
| $2,000 to $2,499 | 30 (2.2%) | 0 (0.0%) |
| $2,500 to $2,999 | 17 (1.2%) | 0 (0.0%) |
| $3,000 or more | 7 (0.5%) | 2 (0.4%) |
| Total | 1,377 (100.0%) | 509 (100.0%) |
Physical Housing Characteristics in Pershing County
Housing Structures in Pershing County
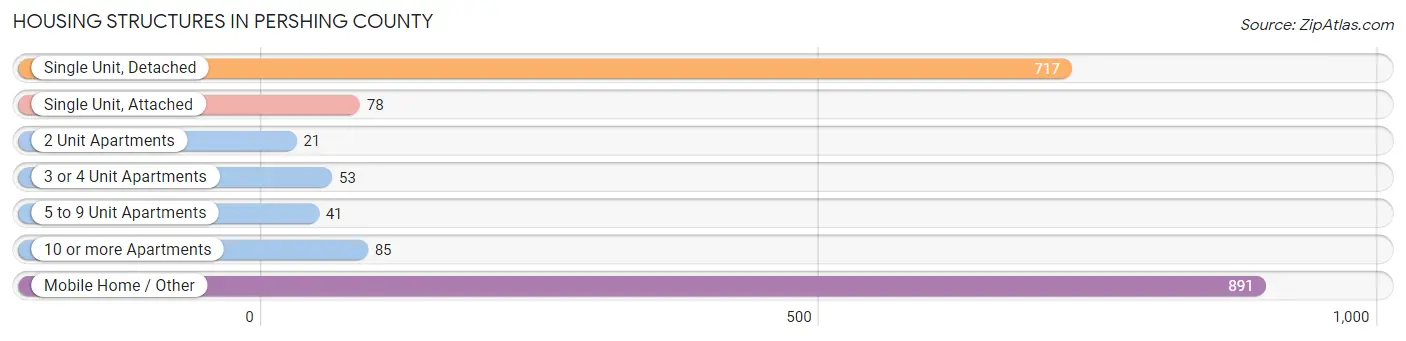
| Structure Type | # Housing Units | % Housing Units |
| Single Unit, Detached | 717 | 38.0% |
| Single Unit, Attached | 78 | 4.1% |
| 2 Unit Apartments | 21 | 1.1% |
| 3 or 4 Unit Apartments | 53 | 2.8% |
| 5 to 9 Unit Apartments | 41 | 2.2% |
| 10 or more Apartments | 85 | 4.5% |
| Mobile Home / Other | 891 | 47.2% |
| Total | 1,886 | 100.0% |
Housing Structures by Occupancy in Pershing County
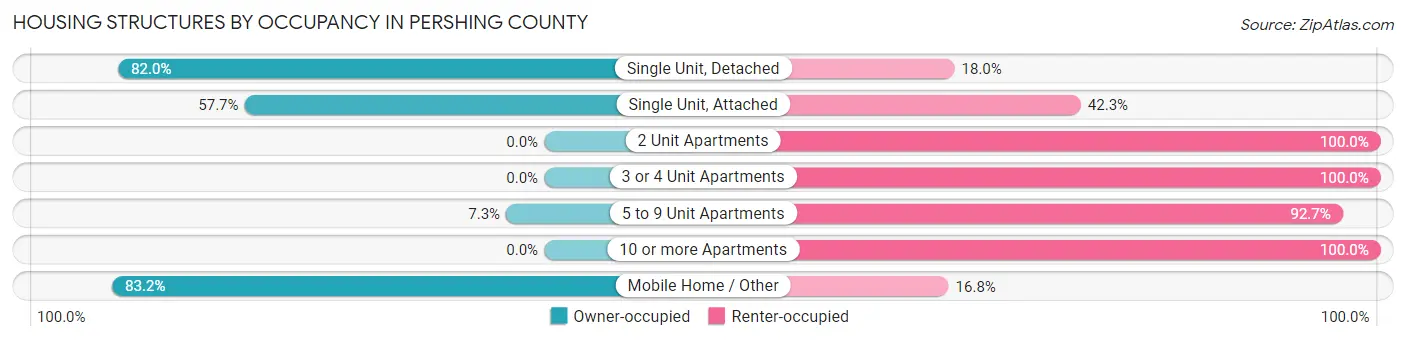
| Structure Type | Owner-occupied | Renter-occupied |
| Single Unit, Detached | 588 (82.0%) | 129 (18.0%) |
| Single Unit, Attached | 45 (57.7%) | 33 (42.3%) |
| 2 Unit Apartments | 0 (0.0%) | 21 (100.0%) |
| 3 or 4 Unit Apartments | 0 (0.0%) | 53 (100.0%) |
| 5 to 9 Unit Apartments | 3 (7.3%) | 38 (92.7%) |
| 10 or more Apartments | 0 (0.0%) | 85 (100.0%) |
| Mobile Home / Other | 741 (83.2%) | 150 (16.8%) |
| Total | 1,377 (73.0%) | 509 (27.0%) |
Housing Structures by Number of Rooms in Pershing County
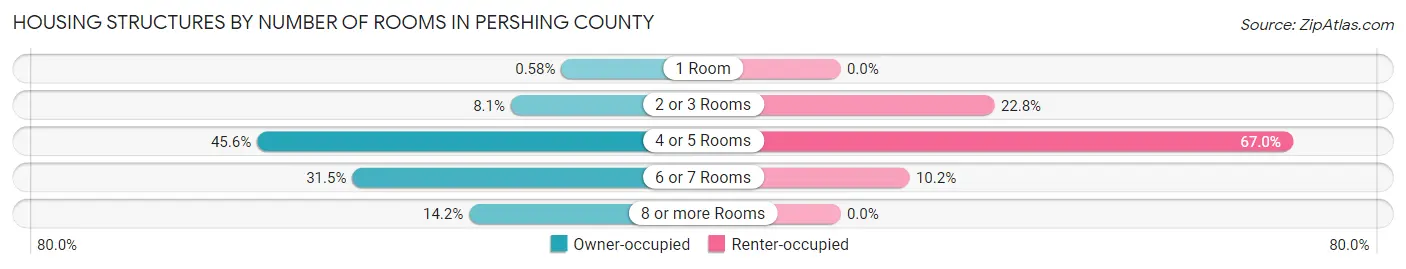
| Number of Rooms | Owner-occupied | Renter-occupied |
| 1 Room | 8 (0.6%) | 0 (0.0%) |
| 2 or 3 Rooms | 111 (8.1%) | 116 (22.8%) |
| 4 or 5 Rooms | 628 (45.6%) | 341 (67.0%) |
| 6 or 7 Rooms | 434 (31.5%) | 52 (10.2%) |
| 8 or more Rooms | 196 (14.2%) | 0 (0.0%) |
| Total | 1,377 (100.0%) | 509 (100.0%) |
Housing Structure by Heating Type in Pershing County
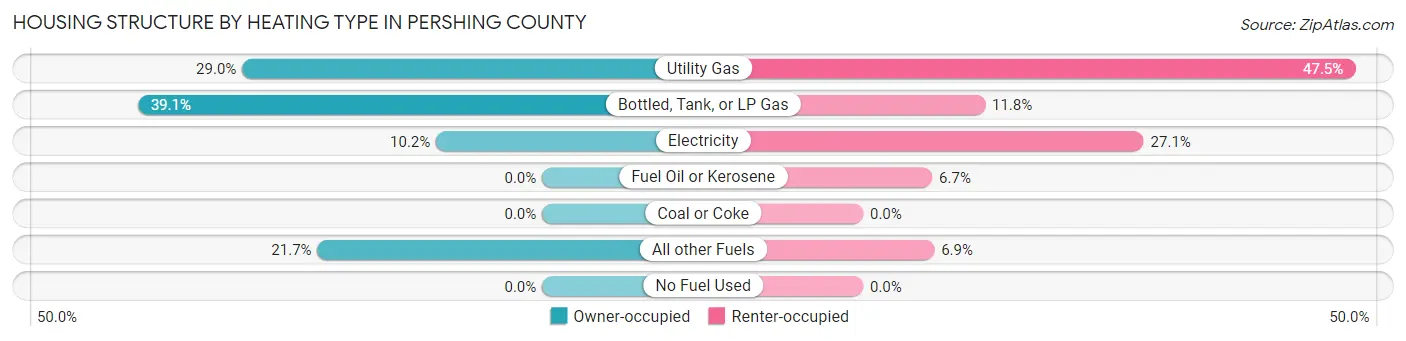
| Heating Type | Owner-occupied | Renter-occupied |
| Utility Gas | 399 (29.0%) | 242 (47.5%) |
| Bottled, Tank, or LP Gas | 538 (39.1%) | 60 (11.8%) |
| Electricity | 141 (10.2%) | 138 (27.1%) |
| Fuel Oil or Kerosene | 0 (0.0%) | 34 (6.7%) |
| Coal or Coke | 0 (0.0%) | 0 (0.0%) |
| All other Fuels | 299 (21.7%) | 35 (6.9%) |
| No Fuel Used | 0 (0.0%) | 0 (0.0%) |
| Total | 1,377 (100.0%) | 509 (100.0%) |
Household Vehicle Usage in Pershing County
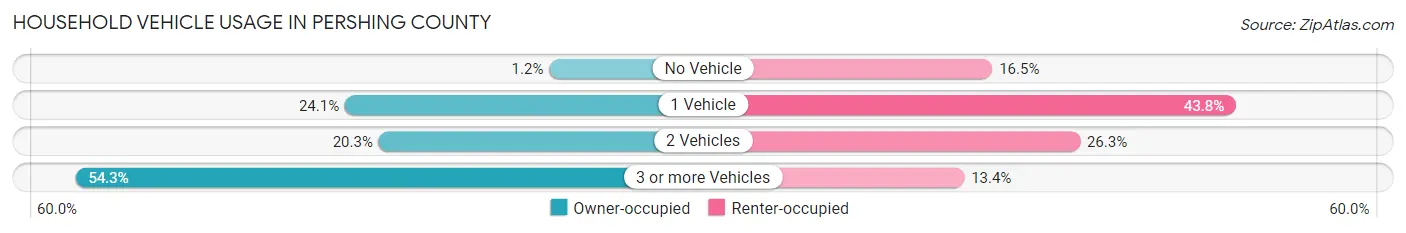
| Vehicles per Household | Owner-occupied | Renter-occupied |
| No Vehicle | 17 (1.2%) | 84 (16.5%) |
| 1 Vehicle | 332 (24.1%) | 223 (43.8%) |
| 2 Vehicles | 280 (20.3%) | 134 (26.3%) |
| 3 or more Vehicles | 748 (54.3%) | 68 (13.4%) |
| Total | 1,377 (100.0%) | 509 (100.0%) |
Real Estate & Mortgages in Pershing County
Real Estate and Mortgage Overview in Pershing County
| Characteristic | Without Mortgage | With Mortgage |
| Housing Units | 678 | 699 |
| Median Property Value | $98,800 | $221,300 |
| Median Household Income | $44,538 | $130 |
| Monthly Housing Costs | $369 | $7 |
| Real Estate Taxes | $861 | $12 |
Property Value by Mortgage Status in Pershing County
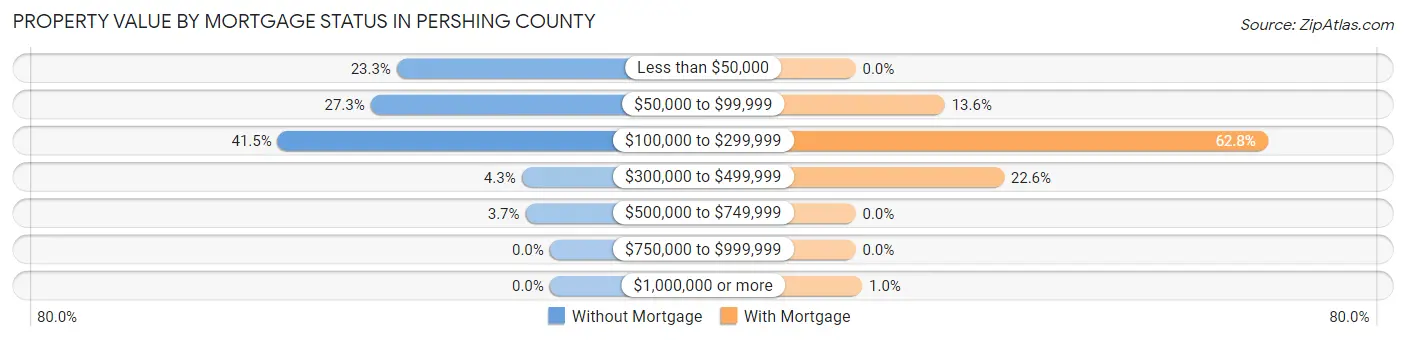
| Property Value | Without Mortgage | With Mortgage |
| Less than $50,000 | 158 (23.3%) | 0 (0.0%) |
| $50,000 to $99,999 | 185 (27.3%) | 95 (13.6%) |
| $100,000 to $299,999 | 281 (41.4%) | 439 (62.8%) |
| $300,000 to $499,999 | 29 (4.3%) | 158 (22.6%) |
| $500,000 to $749,999 | 25 (3.7%) | 0 (0.0%) |
| $750,000 to $999,999 | 0 (0.0%) | 0 (0.0%) |
| $1,000,000 or more | 0 (0.0%) | 7 (1.0%) |
| Total | 678 (100.0%) | 699 (100.0%) |
Household Income by Mortgage Status in Pershing County
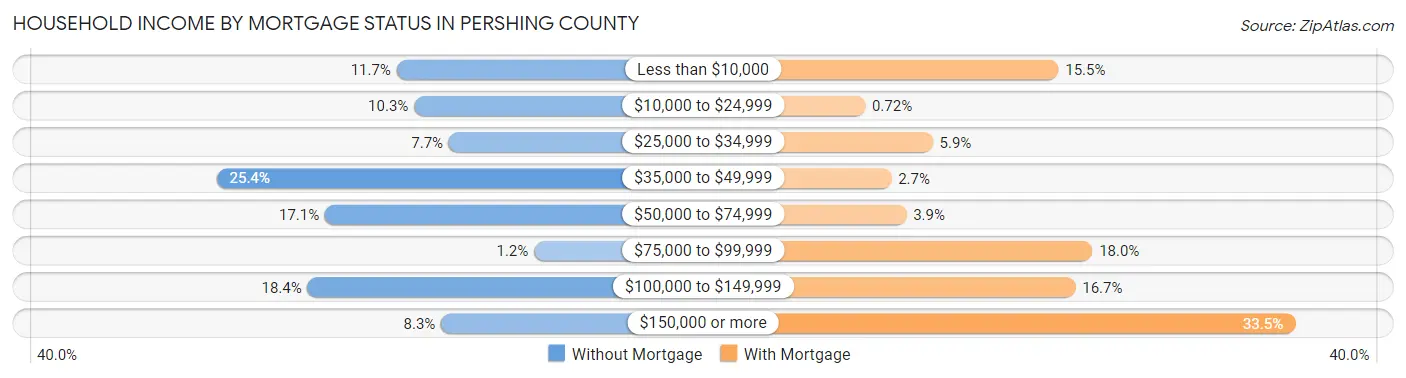
| Household Income | Without Mortgage | With Mortgage |
| Less than $10,000 | 79 (11.7%) | 108 (15.4%) |
| $10,000 to $24,999 | 70 (10.3%) | 5 (0.7%) |
| $25,000 to $34,999 | 52 (7.7%) | 41 (5.9%) |
| $35,000 to $49,999 | 172 (25.4%) | 19 (2.7%) |
| $50,000 to $74,999 | 116 (17.1%) | 27 (3.9%) |
| $75,000 to $99,999 | 8 (1.2%) | 126 (18.0%) |
| $100,000 to $149,999 | 125 (18.4%) | 117 (16.7%) |
| $150,000 or more | 56 (8.3%) | 234 (33.5%) |
| Total | 678 (100.0%) | 699 (100.0%) |
Property Value to Household Income Ratio in Pershing County

| Value-to-Income Ratio | Without Mortgage | With Mortgage |
| Less than 2.0x | 279 (41.1%) | 100,518 (14,380.3%) |
| 2.0x to 2.9x | 102 (15.0%) | 271 (38.8%) |
| 3.0x to 3.9x | 43 (6.3%) | 258 (36.9%) |
| 4.0x or more | 246 (36.3%) | 79 (11.3%) |
| Total | 678 (100.0%) | 699 (100.0%) |
Real Estate Taxes by Mortgage Status in Pershing County
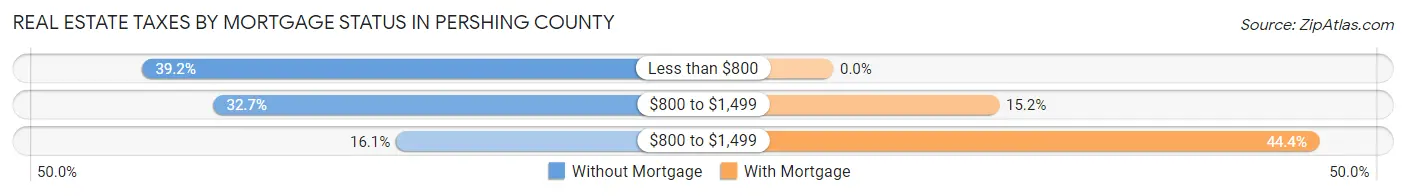
| Property Taxes | Without Mortgage | With Mortgage |
| Less than $800 | 266 (39.2%) | 0 (0.0%) |
| $800 to $1,499 | 222 (32.7%) | 106 (15.2%) |
| $800 to $1,499 | 109 (16.1%) | 310 (44.4%) |
| Total | 678 (100.0%) | 699 (100.0%) |
Health & Disability in Pershing County
Health Insurance Coverage by Age in Pershing County
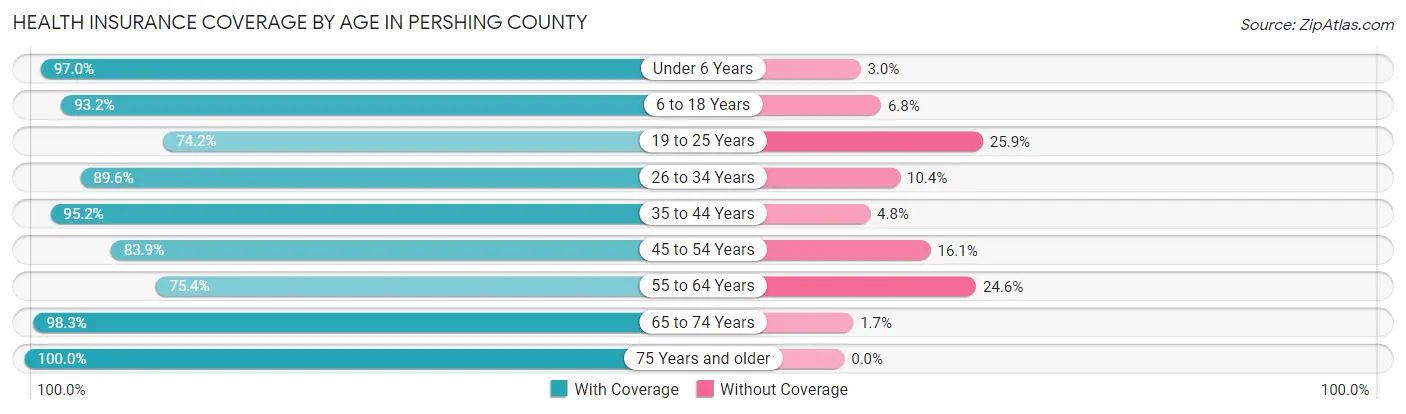
| Age Bracket | With Coverage | Without Coverage |
| Under 6 Years | 355 (97.0%) | 11 (3.0%) |
| 6 to 18 Years | 708 (93.2%) | 52 (6.8%) |
| 19 to 25 Years | 307 (74.2%) | 107 (25.9%) |
| 26 to 34 Years | 552 (89.6%) | 64 (10.4%) |
| 35 to 44 Years | 593 (95.2%) | 30 (4.8%) |
| 45 to 54 Years | 360 (83.9%) | 69 (16.1%) |
| 55 to 64 Years | 488 (75.4%) | 159 (24.6%) |
| 65 to 74 Years | 534 (98.3%) | 9 (1.7%) |
| 75 Years and older | 409 (100.0%) | 0 (0.0%) |
| Total | 4,306 (89.6%) | 501 (10.4%) |
Health Insurance Coverage by Citizenship Status in Pershing County
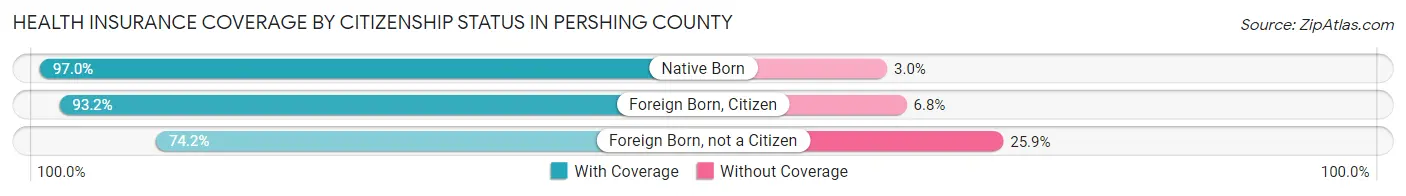
| Citizenship Status | With Coverage | Without Coverage |
| Native Born | 355 (97.0%) | 11 (3.0%) |
| Foreign Born, Citizen | 708 (93.2%) | 52 (6.8%) |
| Foreign Born, not a Citizen | 307 (74.2%) | 107 (25.9%) |
Health Insurance Coverage by Household Income in Pershing County
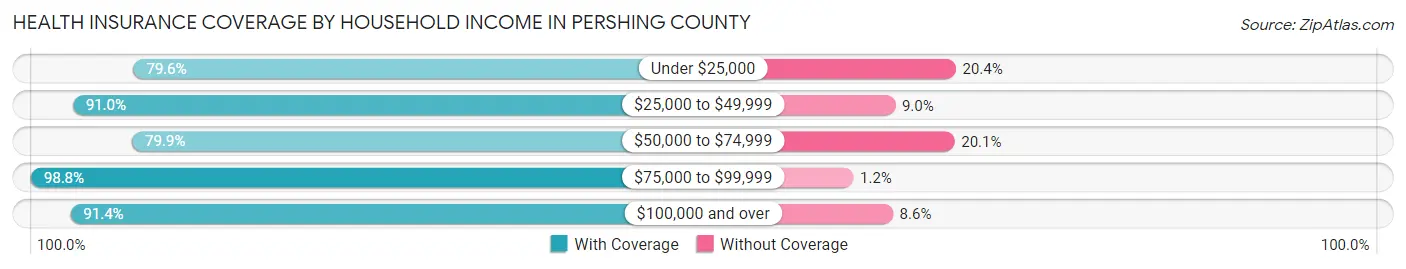
| Household Income | With Coverage | Without Coverage |
| Under $25,000 | 387 (79.6%) | 99 (20.4%) |
| $25,000 to $49,999 | 786 (91.0%) | 78 (9.0%) |
| $50,000 to $74,999 | 591 (79.9%) | 149 (20.1%) |
| $75,000 to $99,999 | 752 (98.8%) | 9 (1.2%) |
| $100,000 and over | 1,766 (91.4%) | 166 (8.6%) |
Public vs Private Health Insurance Coverage by Age in Pershing County
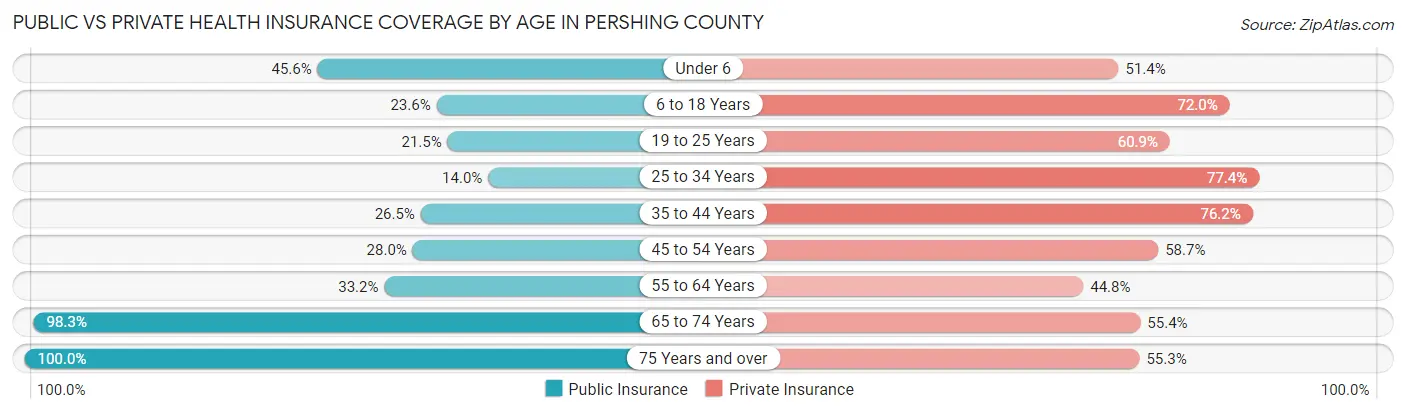
| Age Bracket | Public Insurance | Private Insurance |
| Under 6 | 167 (45.6%) | 188 (51.4%) |
| 6 to 18 Years | 179 (23.5%) | 547 (72.0%) |
| 19 to 25 Years | 89 (21.5%) | 252 (60.9%) |
| 25 to 34 Years | 86 (14.0%) | 477 (77.4%) |
| 35 to 44 Years | 165 (26.5%) | 475 (76.2%) |
| 45 to 54 Years | 120 (28.0%) | 252 (58.7%) |
| 55 to 64 Years | 215 (33.2%) | 290 (44.8%) |
| 65 to 74 Years | 534 (98.3%) | 301 (55.4%) |
| 75 Years and over | 409 (100.0%) | 226 (55.3%) |
| Total | 1,964 (40.9%) | 3,008 (62.6%) |
Disability Status by Sex by Age in Pershing County
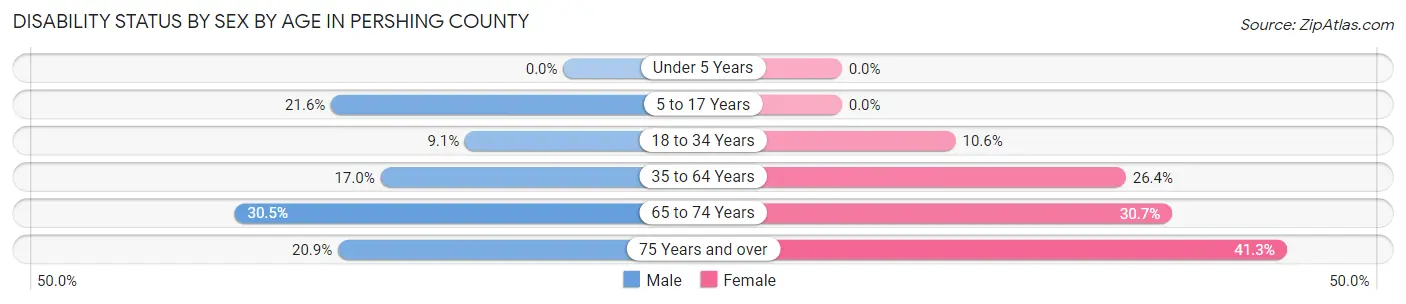
| Age Bracket | Male | Female |
| Under 5 Years | 0 (0.0%) | 0 (0.0%) |
| 5 to 17 Years | 89 (21.5%) | 0 (0.0%) |
| 18 to 34 Years | 52 (9.1%) | 51 (10.6%) |
| 35 to 64 Years | 148 (17.0%) | 218 (26.4%) |
| 65 to 74 Years | 90 (30.5%) | 76 (30.6%) |
| 75 Years and over | 46 (20.9%) | 78 (41.3%) |
Disability Class by Sex by Age in Pershing County
Disability Class: Hearing Difficulty
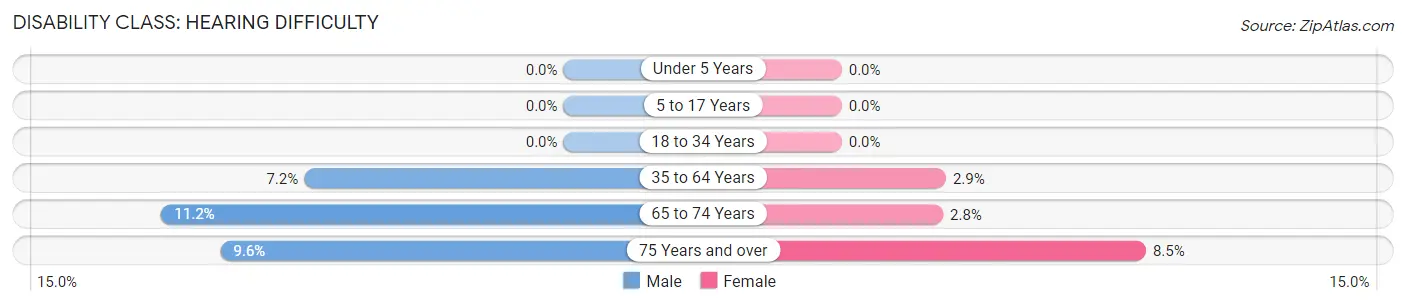
| Age Bracket | Male | Female |
| Under 5 Years | 0 (0.0%) | 0 (0.0%) |
| 5 to 17 Years | 0 (0.0%) | 0 (0.0%) |
| 18 to 34 Years | 0 (0.0%) | 0 (0.0%) |
| 35 to 64 Years | 63 (7.2%) | 24 (2.9%) |
| 65 to 74 Years | 33 (11.2%) | 7 (2.8%) |
| 75 Years and over | 21 (9.6%) | 16 (8.5%) |
Disability Class: Vision Difficulty
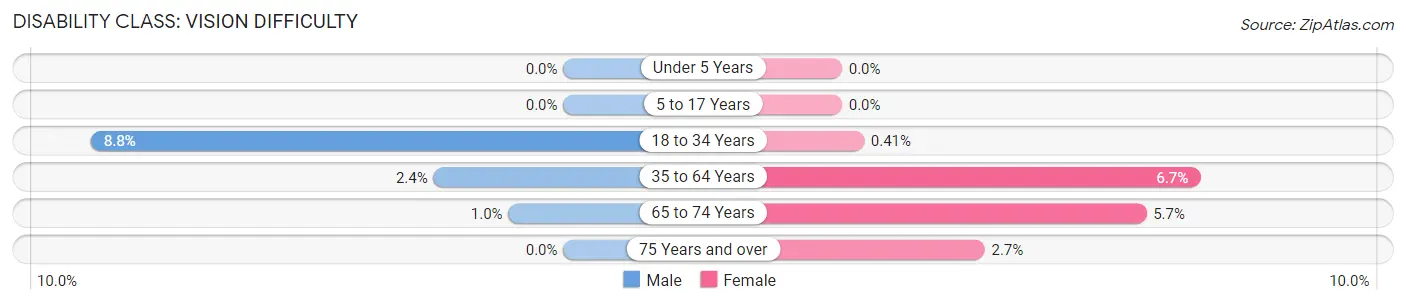
| Age Bracket | Male | Female |
| Under 5 Years | 0 (0.0%) | 0 (0.0%) |
| 5 to 17 Years | 0 (0.0%) | 0 (0.0%) |
| 18 to 34 Years | 50 (8.8%) | 2 (0.4%) |
| 35 to 64 Years | 21 (2.4%) | 55 (6.7%) |
| 65 to 74 Years | 3 (1.0%) | 14 (5.7%) |
| 75 Years and over | 0 (0.0%) | 5 (2.6%) |
Disability Class: Cognitive Difficulty
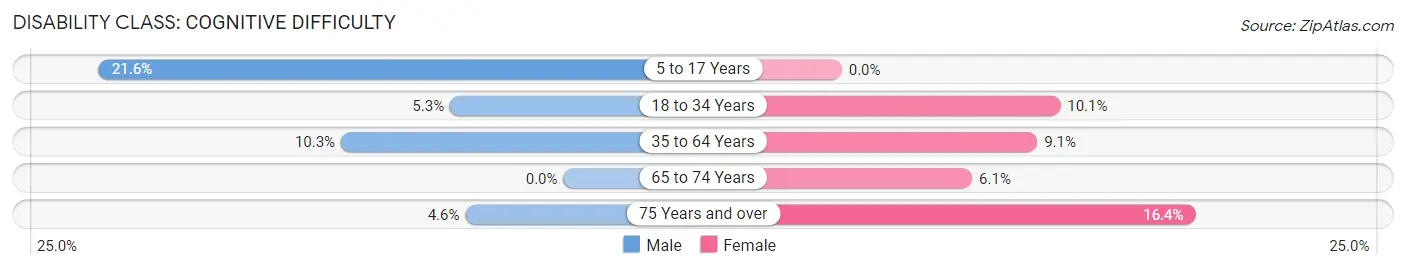
| Age Bracket | Male | Female |
| 5 to 17 Years | 89 (21.5%) | 0 (0.0%) |
| 18 to 34 Years | 30 (5.3%) | 49 (10.1%) |
| 35 to 64 Years | 90 (10.3%) | 75 (9.1%) |
| 65 to 74 Years | 0 (0.0%) | 15 (6.0%) |
| 75 Years and over | 10 (4.5%) | 31 (16.4%) |
Disability Class: Ambulatory Difficulty
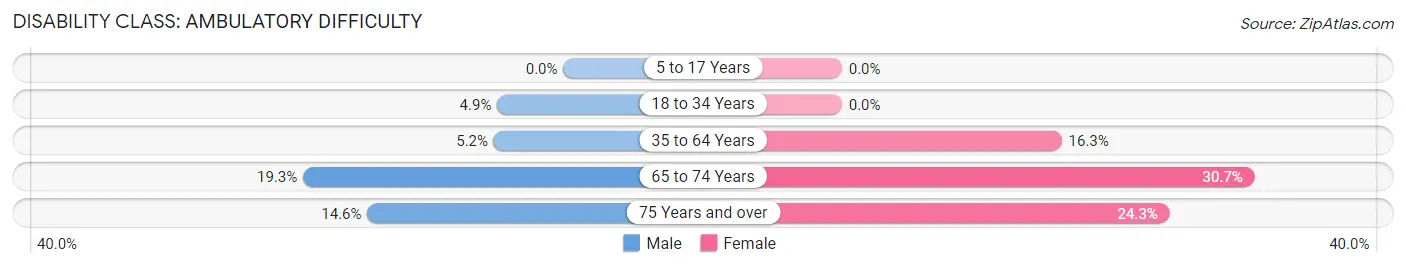
| Age Bracket | Male | Female |
| 5 to 17 Years | 0 (0.0%) | 0 (0.0%) |
| 18 to 34 Years | 28 (4.9%) | 0 (0.0%) |
| 35 to 64 Years | 45 (5.2%) | 135 (16.3%) |
| 65 to 74 Years | 57 (19.3%) | 76 (30.6%) |
| 75 Years and over | 32 (14.5%) | 46 (24.3%) |
Disability Class: Self-Care Difficulty
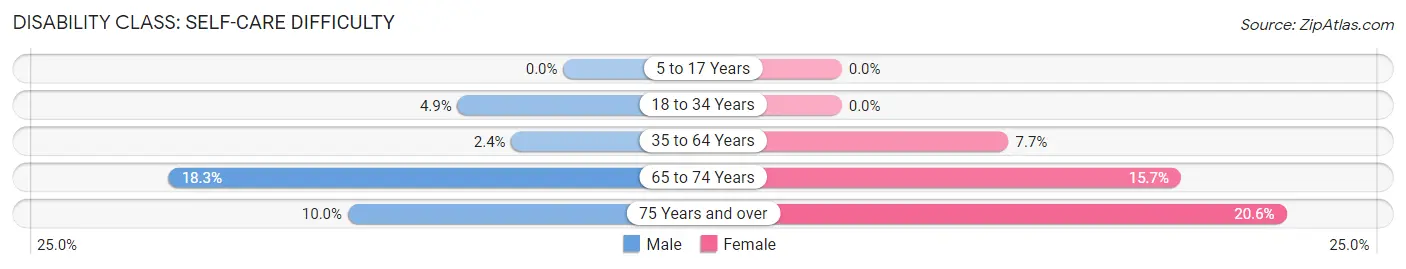
| Age Bracket | Male | Female |
| 5 to 17 Years | 0 (0.0%) | 0 (0.0%) |
| 18 to 34 Years | 28 (4.9%) | 0 (0.0%) |
| 35 to 64 Years | 21 (2.4%) | 64 (7.7%) |
| 65 to 74 Years | 54 (18.3%) | 39 (15.7%) |
| 75 Years and over | 22 (10.0%) | 39 (20.6%) |
Technology Access in Pershing County
Computing Device Access in Pershing County
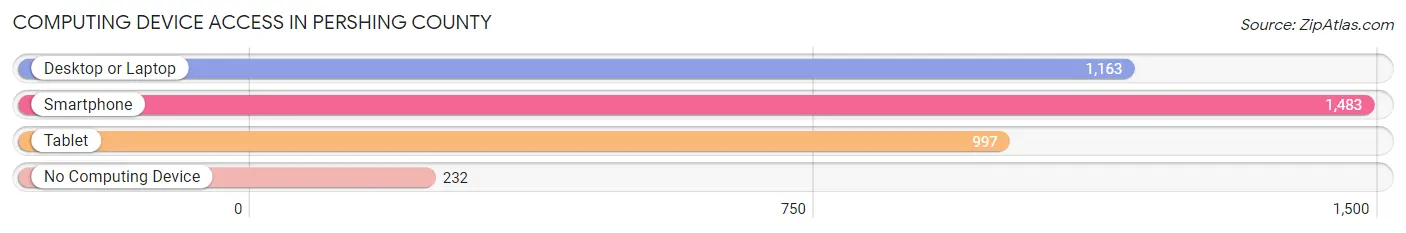
| Device Type | # Households | % Households |
| Desktop or Laptop | 1,163 | 61.7% |
| Smartphone | 1,483 | 78.6% |
| Tablet | 997 | 52.9% |
| No Computing Device | 232 | 12.3% |
| Total | 1,886 | 100.0% |
Internet Access in Pershing County
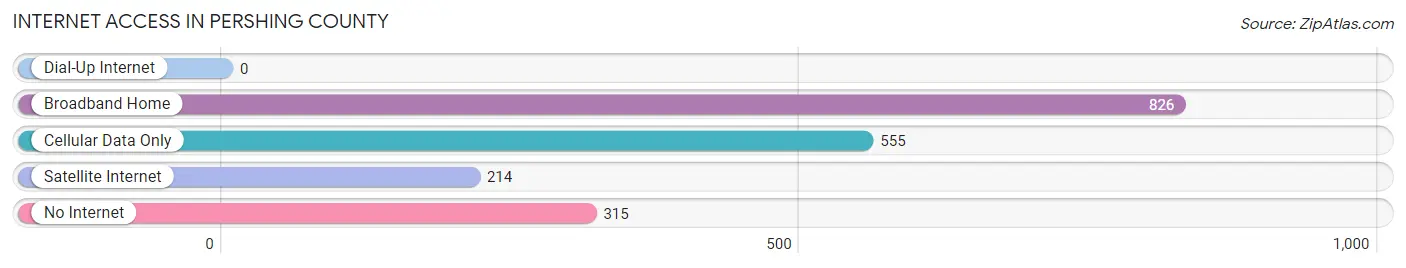
| Internet Type | # Households | % Households |
| Dial-Up Internet | 0 | 0.0% |
| Broadband Home | 826 | 43.8% |
| Cellular Data Only | 555 | 29.4% |
| Satellite Internet | 214 | 11.4% |
| No Internet | 315 | 16.7% |
| Total | 1,886 | 100.0% |
Pershing County Summary
Introduction
Pershing County is located in the northwestern corner of Nevada, and is bordered by Humboldt County to the north, Lander County to the east, Churchill County to the south, and Washoe County to the west. The county seat is Lovelock, and the largest city is Winnemucca. The county was named after General John J. Pershing, who served in the United States Army during World War I.
History
The area that is now Pershing County was originally inhabited by the Northern Paiute and Western Shoshone Native American tribes. The first non-Native American settlers arrived in the area in the 1860s, and the county was officially established in 1919.
The county was initially an agricultural area, with the main crops being wheat, alfalfa, and hay. In the early 20th century, the county began to develop its mining industry, with gold, silver, and copper being the main minerals mined. The county also became a major producer of wool, and the town of Lovelock was known as the “Wool Capital of the World”.
In the 1950s, the county began to develop its tourism industry, with the opening of the Lovelock Cave National Monument in 1957. The county also became a major producer of gypsum, and the town of Imlay became the “Gypsum Capital of the World”.
Geography
Pershing County covers an area of 4,738 square miles, making it the fourth largest county in Nevada. The county is located in the Great Basin region of the state, and is mostly made up of desert and semi-arid shrubland. The county is home to several mountain ranges, including the Santa Rosa Range, the Humboldt Range, and the Toiyabe Range.
The county is home to several rivers, including the Humboldt River, the Quinn River, and the Reese River. The county also contains several lakes, including Rye Patch Reservoir, Rye Patch State Recreation Area, and the Lovelock Wildlife Management Area.
Economy
The economy of Pershing County is largely based on mining, agriculture, and tourism. The county is home to several gold, silver, and copper mines, as well as several gypsum mines. The county is also a major producer of wool, and the town of Lovelock is known as the “Wool Capital of the World”.
The county is also home to several agricultural operations, with the main crops being wheat, alfalfa, and hay. The county is also home to several tourist attractions, including the Lovelock Cave National Monument, the Rye Patch State Recreation Area, and the Lovelock Wildlife Management Area.
Demographics
As of the 2010 census, the population of Pershing County was 6,753. The population is largely made up of White (83.3%), Hispanic or Latino (9.2%), and Native American (3.2%) individuals. The median household income in the county is $45,945, and the median age is 39.7 years.
Conclusion
Pershing County is located in the northwestern corner of Nevada, and is bordered by Humboldt County to the north, Lander County to the east, Churchill County to the south, and Washoe County to the west. The county was named after General John J. Pershing, who served in the United States Army during World War I. The economy of Pershing County is largely based on mining, agriculture, and tourism, and the population is largely made up of White (83.3%), Hispanic or Latino (9.2%), and Native American (3.2%) individuals. The county is home to several tourist attractions, including the Lovelock Cave National Monument, the Rye Patch State Recreation Area, and the Lovelock Wildlife Management Area.
Common Questions
What is Per Capita Income in Pershing County?
Per Capita income in Pershing County is $25,896.
What is the Median Family Income in Pershing County?
Median Family Income in Pershing County is $92,031.
What is the Median Household income in Pershing County?
Median Household Income in Pershing County is $66,304.
What is Income or Wage Gap in Pershing County?
Income or Wage Gap in Pershing County is 57.7%.
Women in Pershing County earn 42.3 cents for every dollar earned by a man.
What is Inequality or Gini Index in Pershing County?
Inequality or Gini Index in Pershing County is 0.40.
What is the Total Population of Pershing County?
Total Population of Pershing County is 6,587.
What is the Total Male Population of Pershing County?
Total Male Population of Pershing County is 4,293.
What is the Total Female Population of Pershing County?
Total Female Population of Pershing County is 2,294.
What is the Ratio of Males per 100 Females in Pershing County?
There are 187.14 Males per 100 Females in Pershing County.
What is the Ratio of Females per 100 Males in Pershing County?
There are 53.44 Females per 100 Males in Pershing County.
What is the Median Population Age in Pershing County?
Median Population Age in Pershing County is 40.4 Years.
What is the Average Family Size in Pershing County
Average Family Size in Pershing County is 3.2 People.
What is the Average Household Size in Pershing County
Average Household Size in Pershing County is 2.5 People.
How Large is the Labor Force in Pershing County?
There are 2,224 People in the Labor Forcein in Pershing County.
What is the Percentage of People in the Labor Force in Pershing County?
40.0% of People are in the Labor Force in Pershing County.
What is the Unemployment Rate in Pershing County?
Unemployment Rate in Pershing County is 8.5%.