Mineral County, NV Map & Demographics
Mineral County Map
Mineral County Overview
$26,662
PER CAPITA INCOME
$57,417
AVG FAMILY INCOME
$46,625
AVG HOUSEHOLD INCOME
41.5%
WAGE / INCOME GAP [ % ]
58.5¢/ $1
WAGE / INCOME GAP [ $ ]
$8,753
FAMILY INCOME DEFICIT
0.44
INEQUALITY / GINI INDEX
4,568
TOTAL POPULATION
2,124
MALE POPULATION
2,444
FEMALE POPULATION
86.91
MALES / 100 FEMALES
115.07
FEMALES / 100 MALES
39.8
MEDIAN AGE
3.1
AVG FAMILY SIZE
2.4
AVG HOUSEHOLD SIZE
1,776
LABOR FORCE [ PEOPLE ]
47.5%
PERCENT IN LABOR FORCE
5.8%
UNEMPLOYMENT RATE
Mineral County Area Codes
Income in Mineral County
Income Overview in Mineral County
Per Capita Income in Mineral County is $26,662, while median incomes of families and households are $57,417 and $46,625 respectively.
| Characteristic | Number | Measure |
| Per Capita Income | 4,568 | $26,662 |
| Median Family Income | 1,055 | $57,417 |
| Mean Family Income | 1,055 | $73,056 |
| Median Household Income | 1,881 | $46,625 |
| Mean Household Income | 1,881 | $61,148 |
| Income Deficit | 1,055 | $8,753 |
| Wage / Income Gap (%) | 4,568 | 41.52% |
| Wage / Income Gap ($) | 4,568 | 58.48¢ per $1 |
| Gini / Inequality Index | 4,568 | 0.44 |
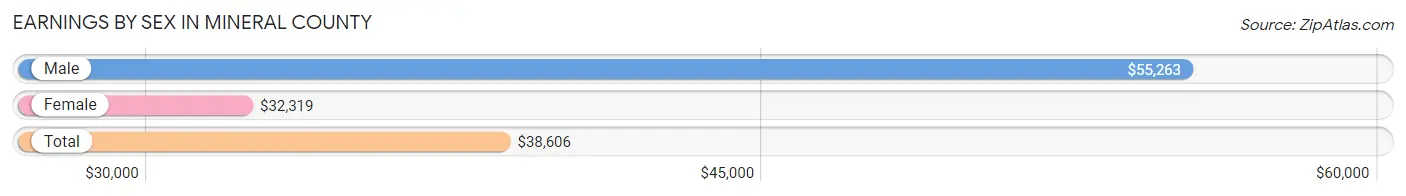
Earnings by Sex in Mineral County
Average Earnings in Mineral County are $38,606, $55,263 for men and $32,319 for women, a difference of 41.5%.
| Sex | Number | Average Earnings |
| Male | 910 (49.3%) | $55,263 |
| Female | 937 (50.7%) | $32,319 |
| Total | 1,847 (100.0%) | $38,606 |
Earnings by Sex by Income Bracket in Mineral County
The most common earnings brackets in Mineral County are $75,000 to $99,999 for men (151 | 16.6%) and $2,500 to $4,999 for women (209 | 22.3%).
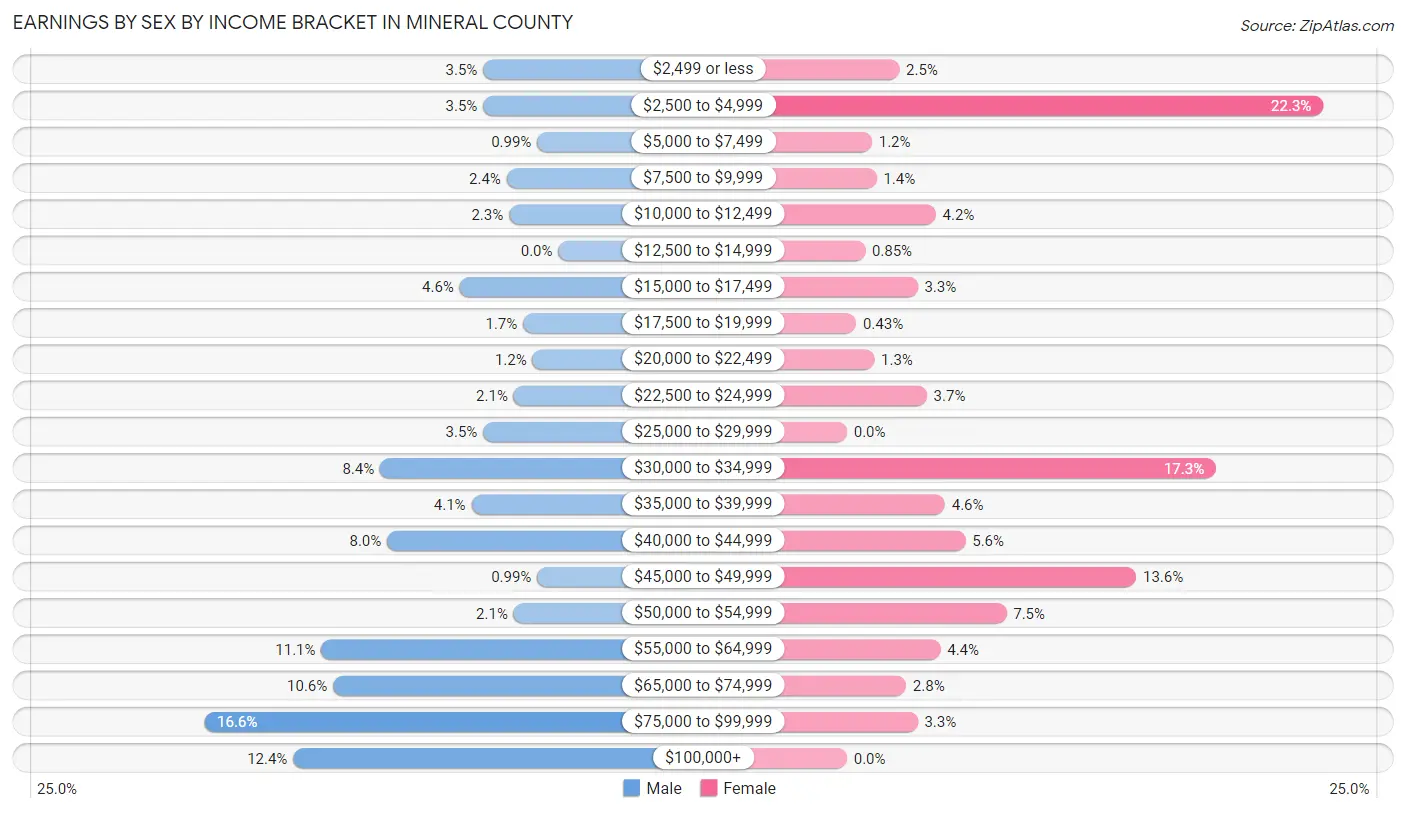
| Income | Male | Female |
| $2,499 or less | 32 (3.5%) | 23 (2.5%) |
| $2,500 to $4,999 | 32 (3.5%) | 209 (22.3%) |
| $5,000 to $7,499 | 9 (1.0%) | 11 (1.2%) |
| $7,500 to $9,999 | 22 (2.4%) | 13 (1.4%) |
| $10,000 to $12,499 | 21 (2.3%) | 39 (4.2%) |
| $12,500 to $14,999 | 0 (0.0%) | 8 (0.9%) |
| $15,000 to $17,499 | 42 (4.6%) | 31 (3.3%) |
| $17,500 to $19,999 | 15 (1.7%) | 4 (0.4%) |
| $20,000 to $22,499 | 11 (1.2%) | 12 (1.3%) |
| $22,500 to $24,999 | 19 (2.1%) | 35 (3.7%) |
| $25,000 to $29,999 | 32 (3.5%) | 0 (0.0%) |
| $30,000 to $34,999 | 76 (8.4%) | 162 (17.3%) |
| $35,000 to $39,999 | 37 (4.1%) | 43 (4.6%) |
| $40,000 to $44,999 | 73 (8.0%) | 52 (5.6%) |
| $45,000 to $49,999 | 9 (1.0%) | 127 (13.6%) |
| $50,000 to $54,999 | 19 (2.1%) | 70 (7.5%) |
| $55,000 to $64,999 | 101 (11.1%) | 41 (4.4%) |
| $65,000 to $74,999 | 96 (10.5%) | 26 (2.8%) |
| $75,000 to $99,999 | 151 (16.6%) | 31 (3.3%) |
| $100,000+ | 113 (12.4%) | 0 (0.0%) |
| Total | 910 (100.0%) | 937 (100.0%) |
Earnings by Sex by Educational Attainment in Mineral County
Average earnings in Mineral County are $56,491 for men and $35,987 for women, a difference of 36.3%. Men with an educational attainment of bachelor's degree enjoy the highest average annual earnings of $78,217, while those with high school diploma education earn the least with $50,882. Women with an educational attainment of bachelor's degree earn the most with the average annual earnings of $47,950, while those with less than high school education have the smallest earnings of $31,458.
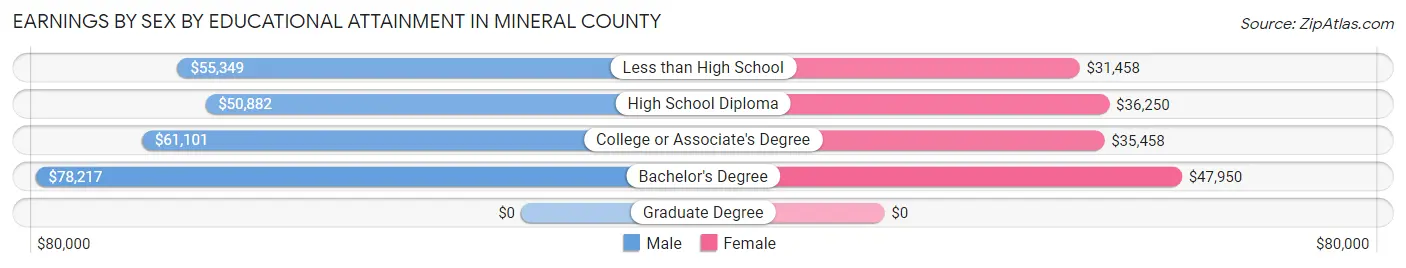
| Educational Attainment | Male Income | Female Income |
| Less than High School | $55,349 | $31,458 |
| High School Diploma | $50,882 | $36,250 |
| College or Associate's Degree | $61,101 | $35,458 |
| Bachelor's Degree | $78,217 | $47,950 |
| Graduate Degree | - | - |
| Total | $56,491 | $35,987 |
Family Income in Mineral County
Family Income Brackets in Mineral County
According to the Mineral County family income data, there are 293 families falling into the $50,000 to $74,999 income range, which is the most common income bracket and makes up 27.8% of all families. Conversely, the $150,000 to $199,999 income bracket is the least frequent group with only 25 families (2.4%) belonging to this category.
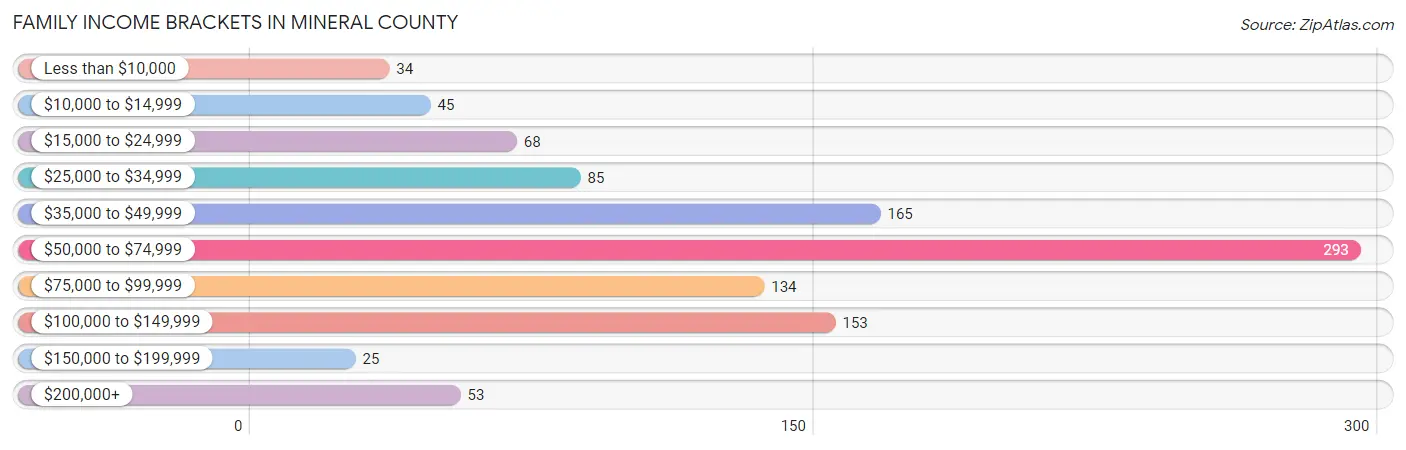
| Income Bracket | # Families | % Families |
| Less than $10,000 | 34 | 3.2% |
| $10,000 to $14,999 | 45 | 4.3% |
| $15,000 to $24,999 | 68 | 6.4% |
| $25,000 to $34,999 | 85 | 8.1% |
| $35,000 to $49,999 | 165 | 15.6% |
| $50,000 to $74,999 | 293 | 27.8% |
| $75,000 to $99,999 | 134 | 12.7% |
| $100,000 to $149,999 | 153 | 14.5% |
| $150,000 to $199,999 | 25 | 2.4% |
| $200,000+ | 53 | 5.0% |
Family Income by Famaliy Size in Mineral County
4-person families (173 | 16.4%) account for the highest median family income in Mineral County with $95,208 per family, while 2-person families (602 | 57.1%) have the highest median income of $29,546 per family member.
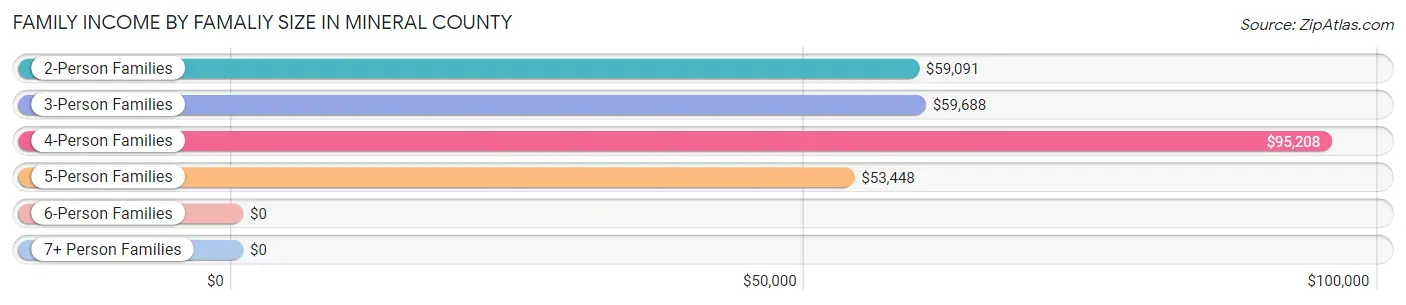
| Income Bracket | # Families | Median Income |
| 2-Person Families | 602 (57.1%) | $59,091 |
| 3-Person Families | 143 (13.6%) | $59,688 |
| 4-Person Families | 173 (16.4%) | $95,208 |
| 5-Person Families | 91 (8.6%) | $53,448 |
| 6-Person Families | 43 (4.1%) | $0 |
| 7+ Person Families | 3 (0.3%) | $0 |
| Total | 1,055 (100.0%) | $57,417 |
Family Income by Number of Earners in Mineral County
The median family income in Mineral County is $57,417, with families comprising 3+ earners (23) having the highest median family income of $175,446, while families with 1 earner (423) have the lowest median family income of $46,813, accounting for 2.2% and 40.1% of families, respectively.
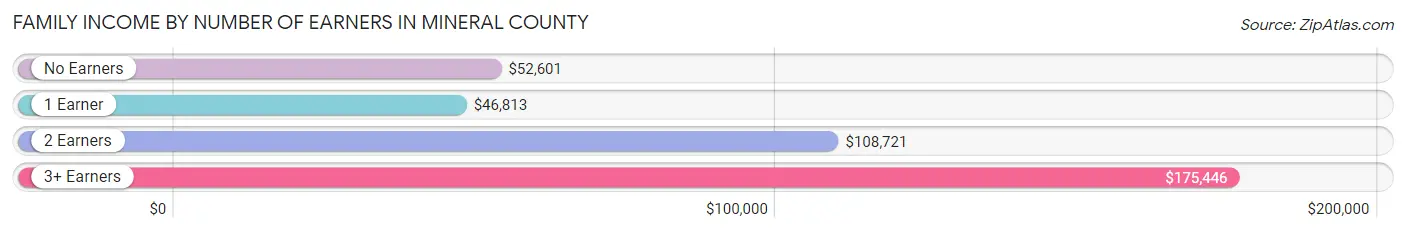
| Number of Earners | # Families | Median Income |
| No Earners | 301 (28.5%) | $52,601 |
| 1 Earner | 423 (40.1%) | $46,813 |
| 2 Earners | 308 (29.2%) | $108,721 |
| 3+ Earners | 23 (2.2%) | $175,446 |
| Total | 1,055 (100.0%) | $57,417 |
Household Income in Mineral County
Household Income Brackets in Mineral County
With 325 households falling in the category, the $50,000 to $74,999 income range is the most frequent in Mineral County, accounting for 17.3% of all households. In contrast, only 19 households (1.0%) fall into the $150,000 to $199,999 income bracket, making it the least populous group.
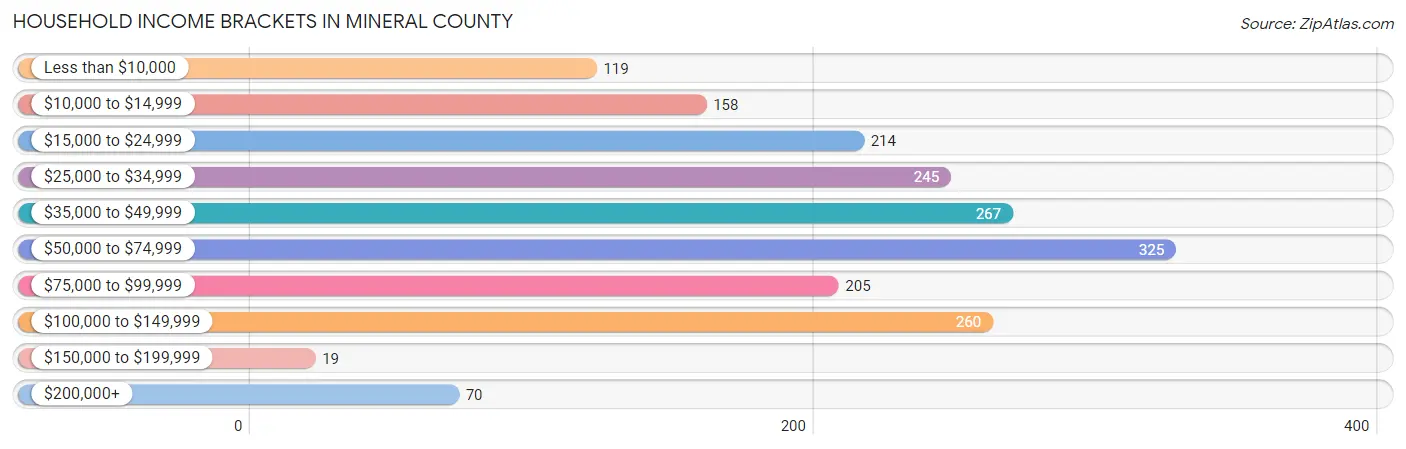
| Income Bracket | # Households | % Households |
| Less than $10,000 | 119 | 6.3% |
| $10,000 to $14,999 | 158 | 8.4% |
| $15,000 to $24,999 | 214 | 11.4% |
| $25,000 to $34,999 | 245 | 13.0% |
| $35,000 to $49,999 | 267 | 14.2% |
| $50,000 to $74,999 | 325 | 17.3% |
| $75,000 to $99,999 | 205 | 10.9% |
| $100,000 to $149,999 | 260 | 13.8% |
| $150,000 to $199,999 | 19 | 1.0% |
| $200,000+ | 70 | 3.7% |
Household Income by Householder Age in Mineral County
The median household income in Mineral County is $46,625, with the highest median household income of $66,310 found in the 25 to 44 years age bracket for the primary householder. A total of 572 households (30.4%) fall into this category. Meanwhile, the 15 to 24 years age bracket for the primary householder has the lowest median household income of $0, with 4 households (0.2%) in this group.
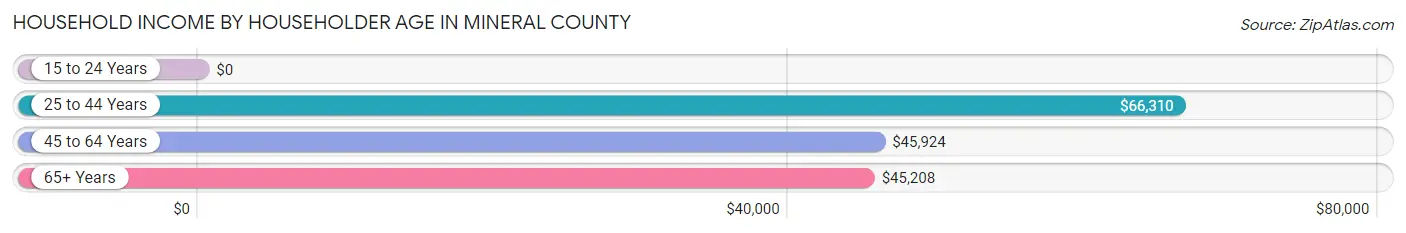
| Income Bracket | # Households | Median Income |
| 15 to 24 Years | 4 (0.2%) | $0 |
| 25 to 44 Years | 572 (30.4%) | $66,310 |
| 45 to 64 Years | 507 (27.0%) | $45,924 |
| 65+ Years | 798 (42.4%) | $45,208 |
| Total | 1,881 (100.0%) | $46,625 |
Poverty in Mineral County
Income Below Poverty by Sex and Age in Mineral County
With 19.2% poverty level for males and 17.8% for females among the residents of Mineral County, 5 year old males and 15 year old females are the most vulnerable to poverty, with 18 males (100.0%) and 10 females (66.7%) in their respective age groups living below the poverty level.
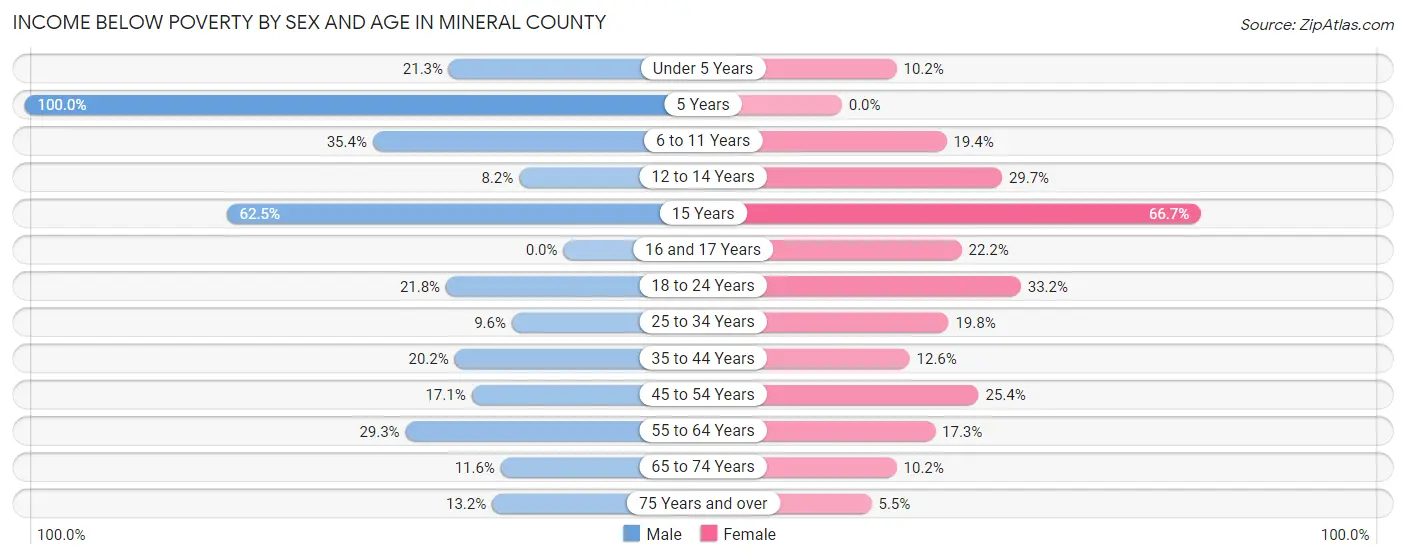
| Age Bracket | Male | Female |
| Under 5 Years | 34 (21.2%) | 13 (10.2%) |
| 5 Years | 18 (100.0%) | 0 (0.0%) |
| 6 to 11 Years | 46 (35.4%) | 41 (19.4%) |
| 12 to 14 Years | 6 (8.2%) | 22 (29.7%) |
| 15 Years | 5 (62.5%) | 10 (66.7%) |
| 16 and 17 Years | 0 (0.0%) | 12 (22.2%) |
| 18 to 24 Years | 17 (21.8%) | 107 (33.2%) |
| 25 to 34 Years | 22 (9.6%) | 60 (19.8%) |
| 35 to 44 Years | 64 (20.2%) | 35 (12.6%) |
| 45 to 54 Years | 30 (17.1%) | 33 (25.4%) |
| 55 to 64 Years | 85 (29.3%) | 31 (17.3%) |
| 65 to 74 Years | 30 (11.6%) | 55 (10.2%) |
| 75 Years and over | 43 (13.2%) | 9 (5.5%) |
| Total | 400 (19.2%) | 428 (17.8%) |
Income Above Poverty by Sex and Age in Mineral County
According to the poverty statistics in Mineral County, males aged 16 and 17 years and females aged 5 years are the age groups that are most secure financially, with 100.0% of males and 100.0% of females in these age groups living above the poverty line.
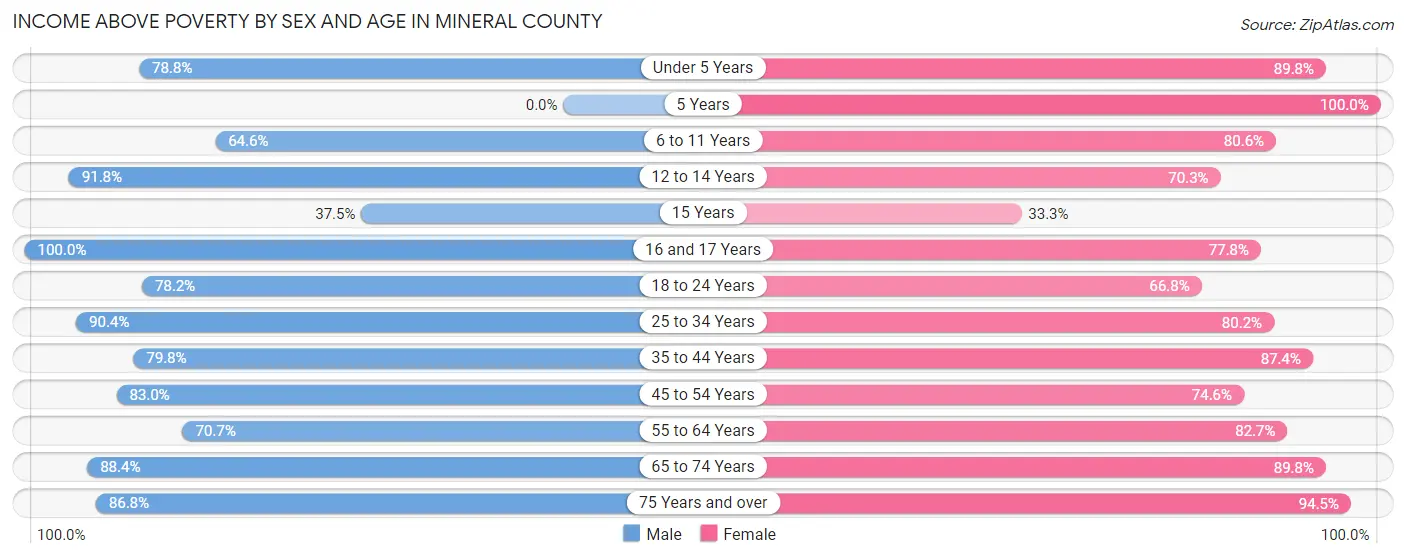
| Age Bracket | Male | Female |
| Under 5 Years | 126 (78.7%) | 115 (89.8%) |
| 5 Years | 0 (0.0%) | 3 (100.0%) |
| 6 to 11 Years | 84 (64.6%) | 170 (80.6%) |
| 12 to 14 Years | 67 (91.8%) | 52 (70.3%) |
| 15 Years | 3 (37.5%) | 5 (33.3%) |
| 16 and 17 Years | 18 (100.0%) | 42 (77.8%) |
| 18 to 24 Years | 61 (78.2%) | 215 (66.8%) |
| 25 to 34 Years | 208 (90.4%) | 243 (80.2%) |
| 35 to 44 Years | 253 (79.8%) | 243 (87.4%) |
| 45 to 54 Years | 146 (83.0%) | 97 (74.6%) |
| 55 to 64 Years | 205 (70.7%) | 148 (82.7%) |
| 65 to 74 Years | 228 (88.4%) | 486 (89.8%) |
| 75 Years and over | 282 (86.8%) | 154 (94.5%) |
| Total | 1,681 (80.8%) | 1,973 (82.2%) |
Income Below Poverty Among Married-Couple Families in Mineral County
The poverty statistics for married-couple families in Mineral County show that 12.4% or 81 of the total 654 families live below the poverty line. Families with 3 or 4 children have the highest poverty rate of 60.0%, comprising of 18 families. On the other hand, families with 1 or 2 children have the lowest poverty rate of 2.8%, which includes 5 families.
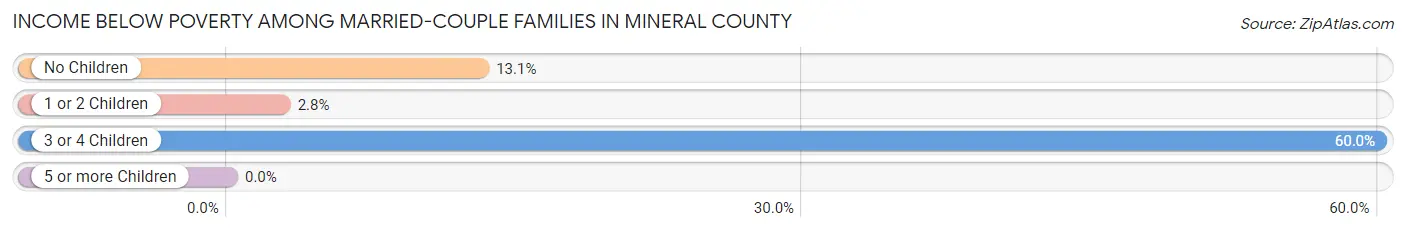
| Children | Above Poverty | Below Poverty |
| No Children | 384 (86.9%) | 58 (13.1%) |
| 1 or 2 Children | 177 (97.3%) | 5 (2.8%) |
| 3 or 4 Children | 12 (40.0%) | 18 (60.0%) |
| 5 or more Children | 0 (0.0%) | 0 (0.0%) |
| Total | 573 (87.6%) | 81 (12.4%) |
Income Below Poverty Among Single-Parent Households in Mineral County
According to the poverty data in Mineral County, 21.2% or 39 single-father households and 14.3% or 31 single-mother households are living below the poverty line. Among single-father households, those with 3 or 4 children have the highest poverty rate, with 15 households (68.2%) experiencing poverty. Likewise, among single-mother households, those with 5 or more children have the highest poverty rate, with 6 households (100.0%) falling below the poverty line.
| Children | Single Father | Single Mother |
| No Children | 1 (11.1%) | 4 (12.5%) |
| 1 or 2 Children | 23 (15.0%) | 15 (9.7%) |
| 3 or 4 Children | 15 (68.2%) | 6 (24.0%) |
| 5 or more Children | 0 (0.0%) | 6 (100.0%) |
| Total | 39 (21.2%) | 31 (14.3%) |
Income Below Poverty Among Married-Couple vs Single-Parent Households in Mineral County
The poverty data for Mineral County shows that 81 of the married-couple family households (12.4%) and 70 of the single-parent households (17.5%) are living below the poverty level. Within the married-couple family households, those with 3 or 4 children have the highest poverty rate, with 18 households (60.0%) falling below the poverty line. Among the single-parent households, those with 5 or more children have the highest poverty rate, with 6 household (100.0%) living below poverty.
| Children | Married-Couple Families | Single-Parent Households |
| No Children | 58 (13.1%) | 5 (12.2%) |
| 1 or 2 Children | 5 (2.8%) | 38 (12.4%) |
| 3 or 4 Children | 18 (60.0%) | 21 (44.7%) |
| 5 or more Children | 0 (0.0%) | 6 (100.0%) |
| Total | 81 (12.4%) | 70 (17.5%) |
Race in Mineral County
The most populous races in Mineral County are White / Caucasian (2,965 | 64.9%), Native / Alaskan (978 | 21.4%), and Hispanic or Latino (862 | 18.9%).
| Race | # Population | % Population |
| Asian | 0 | 0.0% |
| Black / African American | 194 | 4.3% |
| Hawaiian / Pacific | 0 | 0.0% |
| Hispanic or Latino | 862 | 18.9% |
| Native / Alaskan | 978 | 21.4% |
| White / Caucasian | 2,965 | 64.9% |
| Two or more Races | 292 | 6.4% |
| Some other Race | 139 | 3.0% |
| Total | 4,568 | 100.0% |
Ancestry in Mineral County
The most populous ancestries reported in Mineral County are Paiute (865 | 18.9%), Mexican (628 | 13.8%), English (598 | 13.1%), German (581 | 12.7%), and Irish (482 | 10.5%), together accounting for 69.1% of all Mineral County residents.
| Ancestry | # Population | % Population |
| African | 7 | 0.2% |
| American | 257 | 5.6% |
| Apache | 32 | 0.7% |
| Basque | 17 | 0.4% |
| Belgian | 24 | 0.5% |
| British | 24 | 0.5% |
| Celtic | 16 | 0.4% |
| Cherokee | 20 | 0.4% |
| Chippewa | 6 | 0.1% |
| Cree | 18 | 0.4% |
| Creek | 3 | 0.1% |
| Crow | 11 | 0.2% |
| Czech | 26 | 0.6% |
| Danish | 2 | 0.0% |
| Dutch | 148 | 3.2% |
| English | 598 | 13.1% |
| European | 77 | 1.7% |
| French | 62 | 1.4% |
| French American Indian | 15 | 0.3% |
| French Canadian | 6 | 0.1% |
| German | 581 | 12.7% |
| Greek | 6 | 0.1% |
| Irish | 482 | 10.5% |
| Italian | 229 | 5.0% |
| Korean | 1 | 0.0% |
| Mexican | 628 | 13.8% |
| Norwegian | 53 | 1.2% |
| Paiute | 865 | 18.9% |
| Peruvian | 79 | 1.7% |
| Polish | 6 | 0.1% |
| Portuguese | 32 | 0.7% |
| Pueblo | 4 | 0.1% |
| Puerto Rican | 36 | 0.8% |
| Russian | 16 | 0.4% |
| Scandinavian | 5 | 0.1% |
| Scotch-Irish | 2 | 0.0% |
| Scottish | 173 | 3.8% |
| Shoshone | 12 | 0.3% |
| Sioux | 30 | 0.7% |
| Slavic | 13 | 0.3% |
| South American | 79 | 1.7% |
| Spaniard | 28 | 0.6% |
| Spanish | 59 | 1.3% |
| Subsaharan African | 7 | 0.2% |
| Swedish | 95 | 2.1% |
| Thai | 1 | 0.0% |
| Tohono O'Odham | 6 | 0.1% |
| Welsh | 2 | 0.0% | View All 48 Rows |
Immigrants in Mineral County
The most numerous immigrant groups reported in Mineral County came from Latin America (99 | 2.2%), Central America (85 | 1.9%), Mexico (85 | 1.9%), Peru (14 | 0.3%), and South America (14 | 0.3%), together accounting for 6.5% of all Mineral County residents.
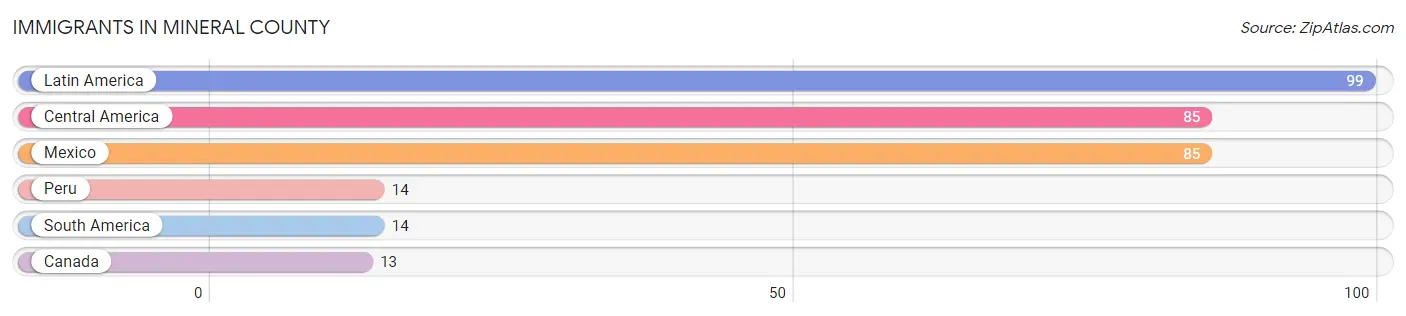
| Immigration Origin | # Population | % Population |
| Canada | 13 | 0.3% |
| Central America | 85 | 1.9% |
| Latin America | 99 | 2.2% |
| Mexico | 85 | 1.9% |
| Peru | 14 | 0.3% |
| South America | 14 | 0.3% | View All 6 Rows |
Sex and Age in Mineral County
Sex and Age in Mineral County
The most populous age groups in Mineral County are 75 to 79 Years (267 | 12.6%) for men and 65 to 69 Years (279 | 11.4%) for women.
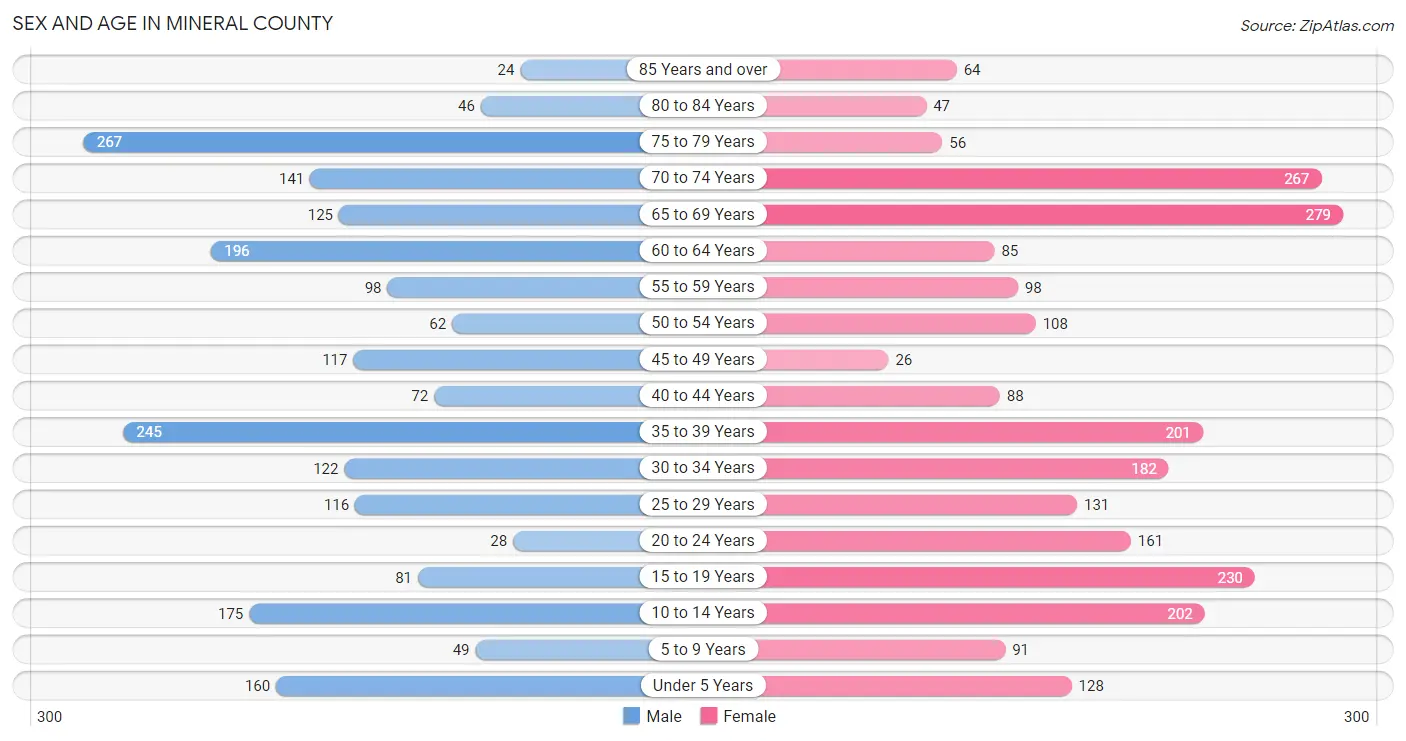
| Age Bracket | Male | Female |
| Under 5 Years | 160 (7.5%) | 128 (5.2%) |
| 5 to 9 Years | 49 (2.3%) | 91 (3.7%) |
| 10 to 14 Years | 175 (8.2%) | 202 (8.3%) |
| 15 to 19 Years | 81 (3.8%) | 230 (9.4%) |
| 20 to 24 Years | 28 (1.3%) | 161 (6.6%) |
| 25 to 29 Years | 116 (5.5%) | 131 (5.4%) |
| 30 to 34 Years | 122 (5.7%) | 182 (7.4%) |
| 35 to 39 Years | 245 (11.5%) | 201 (8.2%) |
| 40 to 44 Years | 72 (3.4%) | 88 (3.6%) |
| 45 to 49 Years | 117 (5.5%) | 26 (1.1%) |
| 50 to 54 Years | 62 (2.9%) | 108 (4.4%) |
| 55 to 59 Years | 98 (4.6%) | 98 (4.0%) |
| 60 to 64 Years | 196 (9.2%) | 85 (3.5%) |
| 65 to 69 Years | 125 (5.9%) | 279 (11.4%) |
| 70 to 74 Years | 141 (6.6%) | 267 (10.9%) |
| 75 to 79 Years | 267 (12.6%) | 56 (2.3%) |
| 80 to 84 Years | 46 (2.2%) | 47 (1.9%) |
| 85 Years and over | 24 (1.1%) | 64 (2.6%) |
| Total | 2,124 (100.0%) | 2,444 (100.0%) |
Families and Households in Mineral County
Median Family Size in Mineral County
The median family size in Mineral County is 3.12 persons per family, with single female/mother families (217 | 20.6%) accounting for the largest median family size of 4.12 persons per family. On the other hand, married-couple families (654 | 62.0%) represent the smallest median family size with 2.82 persons per family.
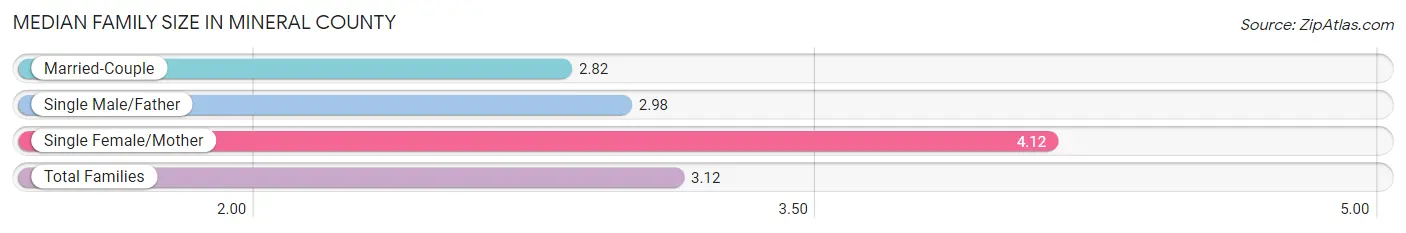
| Family Type | # Families | Family Size |
| Married-Couple | 654 (62.0%) | 2.82 |
| Single Male/Father | 184 (17.4%) | 2.98 |
| Single Female/Mother | 217 (20.6%) | 4.12 |
| Total Families | 1,055 (100.0%) | 3.12 |
Median Household Size in Mineral County
The median household size in Mineral County is 2.38 persons per household, with single female/mother households (217 | 11.5%) accounting for the largest median household size of 4.26 persons per household. non-family households (826 | 43.9%) represent the smallest median household size with 1.15 persons per household.
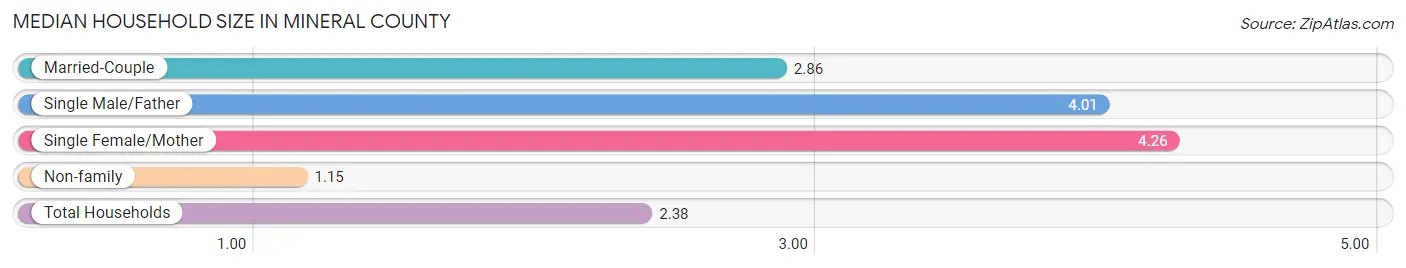
| Household Type | # Households | Household Size |
| Married-Couple | 654 (34.8%) | 2.86 |
| Single Male/Father | 184 (9.8%) | 4.01 |
| Single Female/Mother | 217 (11.5%) | 4.26 |
| Non-family | 826 (43.9%) | 1.15 |
| Total Households | 1,881 (100.0%) | 2.38 |
Household Size by Marriage Status in Mineral County
Out of a total of 1,881 households in Mineral County, 1,055 (56.1%) are family households, while 826 (43.9%) are nonfamily households. The most numerous type of family households are 2-person households, comprising 511, and the most common type of nonfamily households are 1-person households, comprising 740.
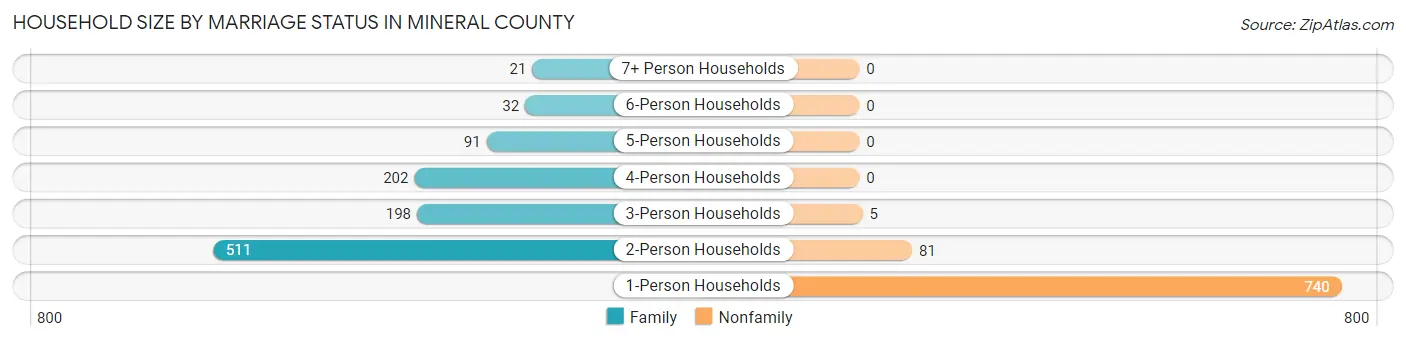
| Household Size | Family Households | Nonfamily Households |
| 1-Person Households | - | 740 (39.3%) |
| 2-Person Households | 511 (27.2%) | 81 (4.3%) |
| 3-Person Households | 198 (10.5%) | 5 (0.3%) |
| 4-Person Households | 202 (10.7%) | 0 (0.0%) |
| 5-Person Households | 91 (4.8%) | 0 (0.0%) |
| 6-Person Households | 32 (1.7%) | 0 (0.0%) |
| 7+ Person Households | 21 (1.1%) | 0 (0.0%) |
| Total | 1,055 (56.1%) | 826 (43.9%) |
Female Fertility in Mineral County
Fertility by Age in Mineral County
Average fertility rate in Mineral County is 89.0 births per 1,000 women. Women in the age bracket of 15 to 19 years have the highest fertility rate with 309.0 births per 1,000 women. Women in the age bracket of 15 to 19 years acount for 78.0% of all women with births.
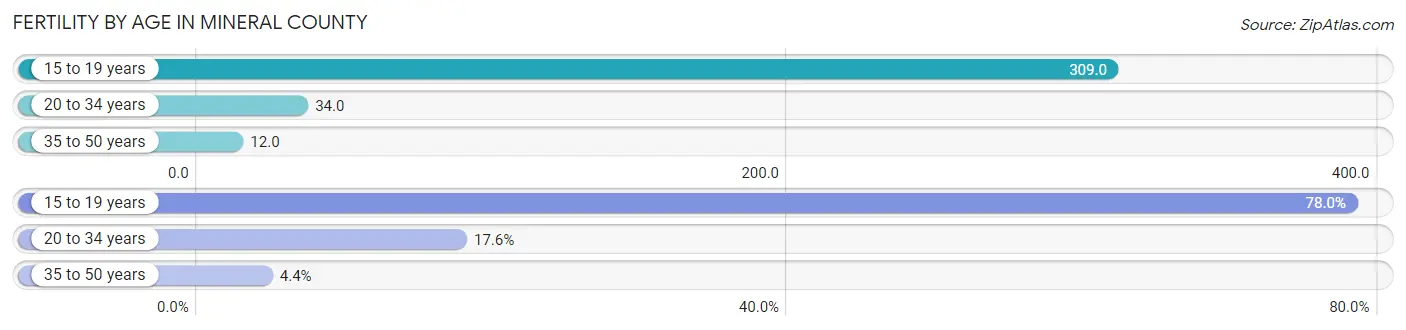
| Age Bracket | Women with Births | Births / 1,000 Women |
| 15 to 19 years | 71 (78.0%) | 309.0 |
| 20 to 34 years | 16 (17.6%) | 34.0 |
| 35 to 50 years | 4 (4.4%) | 12.0 |
| Total | 91 (100.0%) | 89.0 |
Fertility by Age by Marriage Status in Mineral County
4.4% of women with births (91) in Mineral County are married. The highest percentage of unmarried women with births falls into 15 to 19 years age bracket with 100.0% of them unmarried at the time of birth, while the lowest percentage of unmarried women with births belong to 35 to 50 years age bracket with 0.0% of them unmarried.
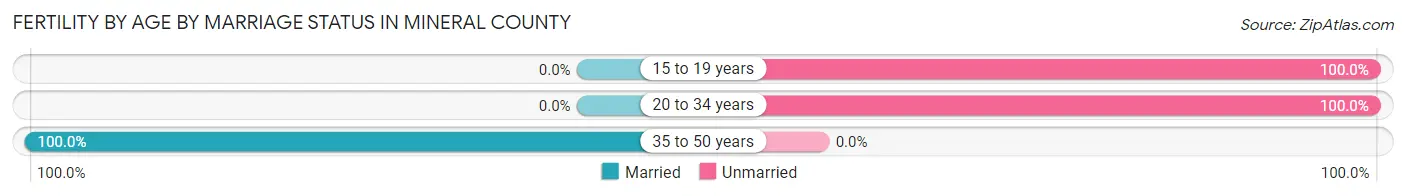
| Age Bracket | Married | Unmarried |
| 15 to 19 years | 0 (0.0%) | 71 (100.0%) |
| 20 to 34 years | 0 (0.0%) | 16 (100.0%) |
| 35 to 50 years | 4 (100.0%) | 0 (0.0%) |
| Total | 4 (4.4%) | 87 (95.6%) |
Fertility by Education in Mineral County
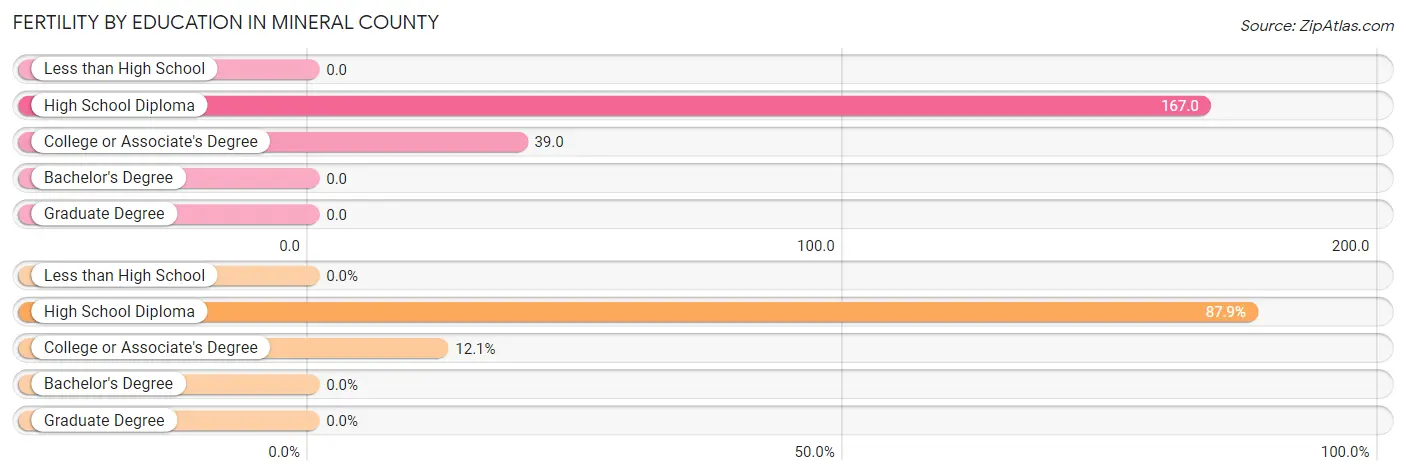
| Educational Attainment | Women with Births | Births / 1,000 Women |
| Less than High School | 0 (0.0%) | 0.0 |
| High School Diploma | 80 (87.9%) | 167.0 |
| College or Associate's Degree | 11 (12.1%) | 39.0 |
| Bachelor's Degree | 0 (0.0%) | 0.0 |
| Graduate Degree | 0 (0.0%) | 0.0 |
| Total | 91 (100.0%) | 89.0 |
Fertility by Education by Marriage Status in Mineral County
95.6% of women with births in Mineral County are unmarried. Women with the educational attainment of college or associate's degree are most likely to be married with 36.4% of them married at childbirth, while women with the educational attainment of high school diploma are least likely to be married with 100.0% of them unmarried at childbirth.
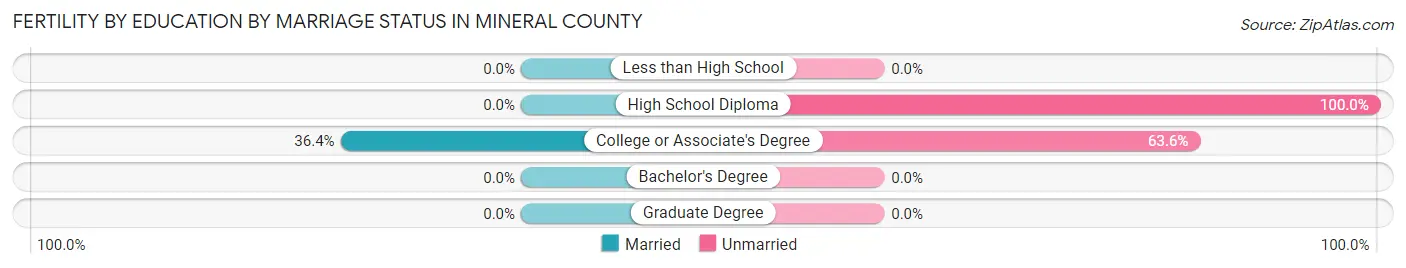
| Educational Attainment | Married | Unmarried |
| Less than High School | 0 (0.0%) | 0 (0.0%) |
| High School Diploma | 0 (0.0%) | 80 (100.0%) |
| College or Associate's Degree | 4 (36.4%) | 7 (63.6%) |
| Bachelor's Degree | 0 (0.0%) | 0 (0.0%) |
| Graduate Degree | 0 (0.0%) | 0 (0.0%) |
| Total | 4 (4.4%) | 87 (95.6%) |
Employment Characteristics in Mineral County
Employment by Class of Employer in Mineral County
Among the 1,648 employed individuals in Mineral County, private company employees (880 | 53.4%), local government employees (327 | 19.8%), and federal government employees (301 | 18.3%) make up the most common classes of employment.
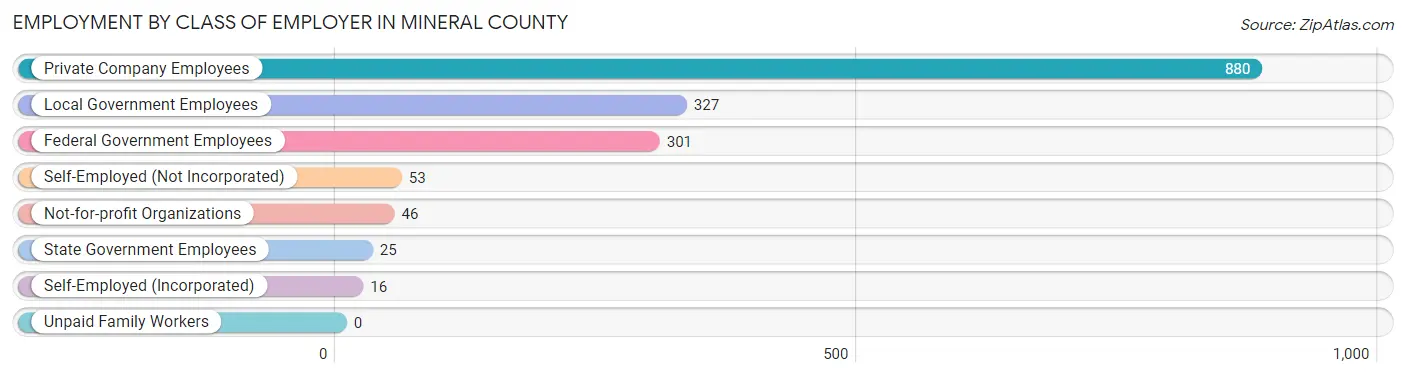
| Employer Class | # Employees | % Employees |
| Private Company Employees | 880 | 53.4% |
| Self-Employed (Incorporated) | 16 | 1.0% |
| Self-Employed (Not Incorporated) | 53 | 3.2% |
| Not-for-profit Organizations | 46 | 2.8% |
| Local Government Employees | 327 | 19.8% |
| State Government Employees | 25 | 1.5% |
| Federal Government Employees | 301 | 18.3% |
| Unpaid Family Workers | 0 | 0.0% |
| Total | 1,648 | 100.0% |
Employment Status by Age in Mineral County
According to the labor force statistics for Mineral County, out of the total population over 16 years of age (3,738), 47.5% or 1,776 individuals are in the labor force, with 5.8% or 103 of them unemployed. The age group with the highest labor force participation rate is 20 to 24 years, with 95.2% or 180 individuals in the labor force. Within the labor force, the 16 to 19 years age range has the highest percentage of unemployed individuals, with 17.6% or 12 of them being unemployed.
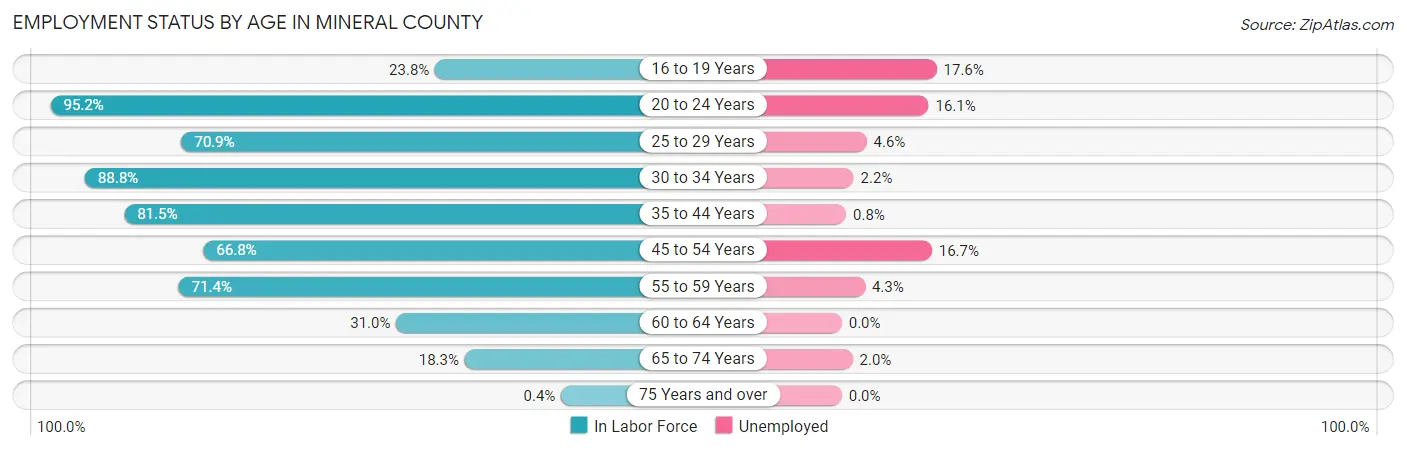
| Age Bracket | In Labor Force | Unemployed |
| 16 to 19 Years | 68 (23.8%) | 12 (17.6%) |
| 20 to 24 Years | 180 (95.2%) | 29 (16.1%) |
| 25 to 29 Years | 175 (70.9%) | 8 (4.6%) |
| 30 to 34 Years | 270 (88.8%) | 6 (2.2%) |
| 35 to 44 Years | 494 (81.5%) | 4 (0.8%) |
| 45 to 54 Years | 209 (66.8%) | 35 (16.7%) |
| 55 to 59 Years | 140 (71.4%) | 6 (4.3%) |
| 60 to 64 Years | 87 (31.0%) | 0 (0.0%) |
| 65 to 74 Years | 149 (18.3%) | 3 (2.0%) |
| 75 Years and over | 2 (0.4%) | 0 (0.0%) |
| Total | 1,776 (47.5%) | 103 (5.8%) |
Employment Status by Educational Attainment in Mineral County
According to labor force statistics for Mineral County, 70.6% of individuals (1,375) out of the total population between 25 and 64 years of age (1,947) are in the labor force, with 4.3% or 59 of them being unemployed. The group with the highest labor force participation rate are those with the educational attainment of bachelor's degree or higher, with 82.2% or 212 individuals in the labor force. Within the labor force, individuals with less than high school education have the highest percentage of unemployment, with 10.8% or 14 of them being unemployed.
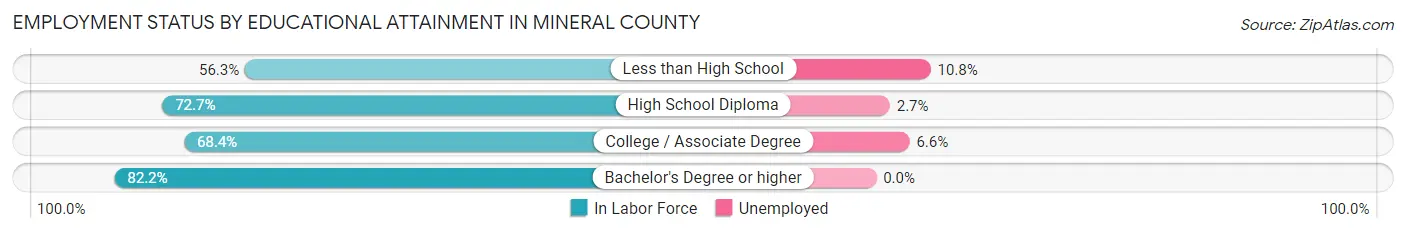
| Educational Attainment | In Labor Force | Unemployed |
| Less than High School | 130 (56.3%) | 25 (10.8%) |
| High School Diploma | 595 (72.7%) | 22 (2.7%) |
| College / Associate Degree | 438 (68.4%) | 42 (6.6%) |
| Bachelor's Degree or higher | 212 (82.2%) | 0 (0.0%) |
| Total | 1,375 (70.6%) | 84 (4.3%) |
Employment Occupations by Sex in Mineral County
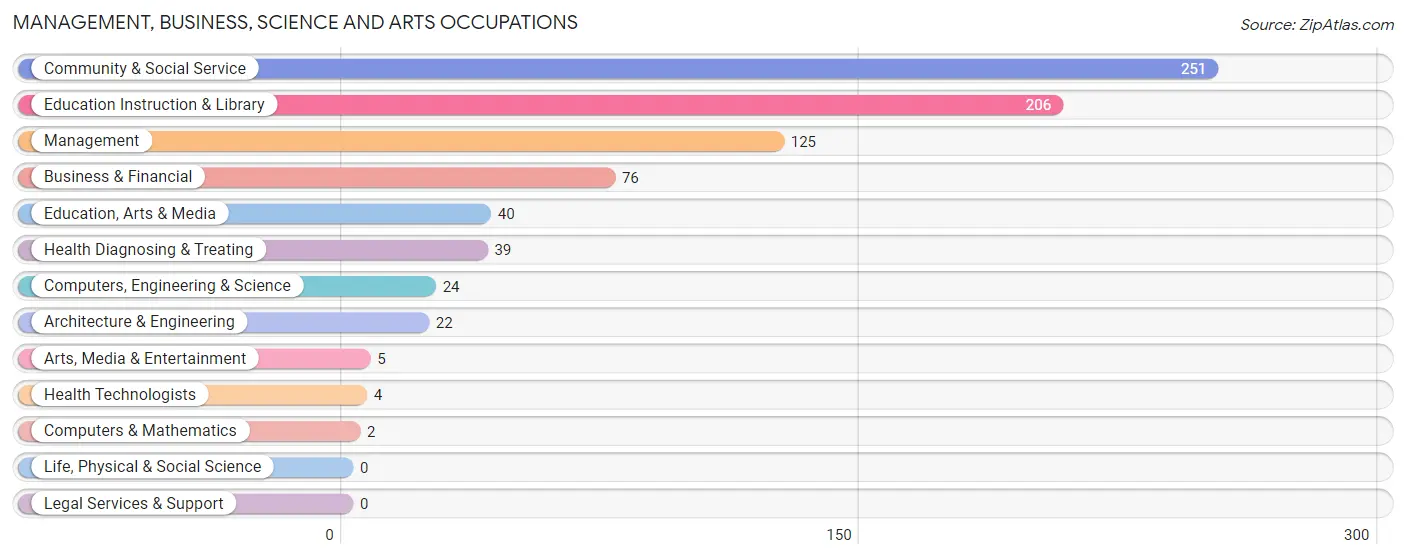
Management, Business, Science and Arts Occupations
The most common Management, Business, Science and Arts occupations in Mineral County are Community & Social Service (251 | 15.0%), Education Instruction & Library (206 | 12.3%), Management (125 | 7.5%), Business & Financial (76 | 4.5%), and Education, Arts & Media (40 | 2.4%).
Management, Business, Science and Arts Occupations by Sex
Within the Management, Business, Science and Arts occupations in Mineral County, the most male-oriented occupations are Architecture & Engineering (100.0%), Arts, Media & Entertainment (100.0%), and Computers, Engineering & Science (91.7%), while the most female-oriented occupations are Computers & Mathematics (100.0%), Health Diagnosing & Treating (100.0%), and Health Technologists (100.0%).
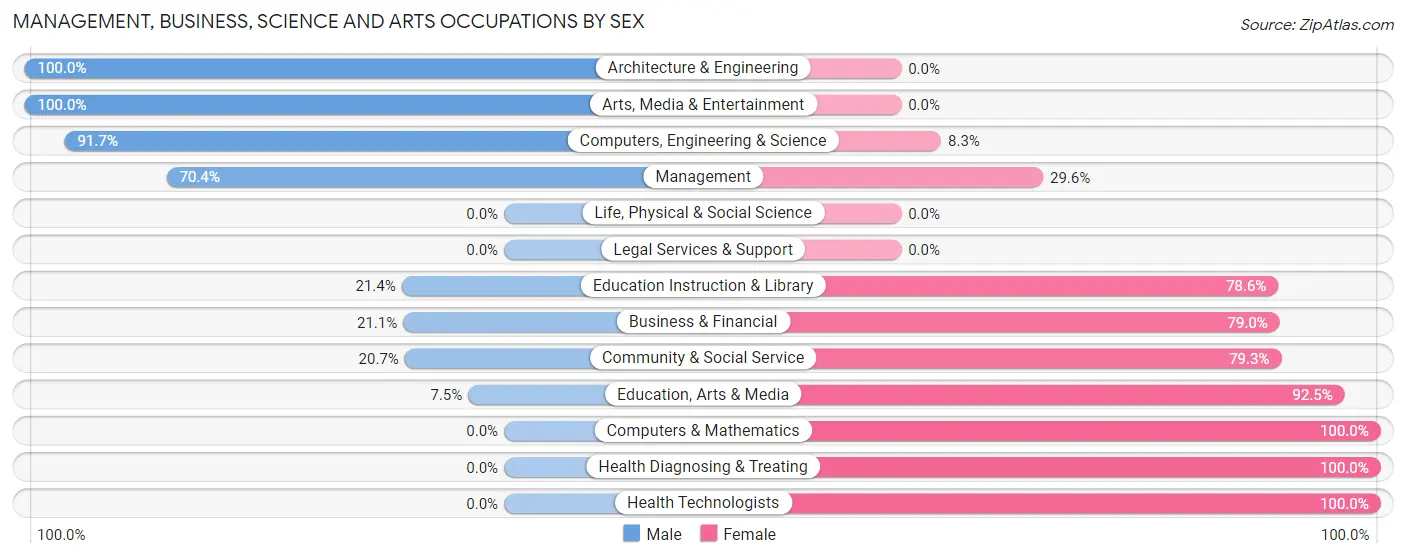
| Occupation | Male | Female |
| Management | 88 (70.4%) | 37 (29.6%) |
| Business & Financial | 16 (21.0%) | 60 (78.9%) |
| Computers, Engineering & Science | 22 (91.7%) | 2 (8.3%) |
| Computers & Mathematics | 0 (0.0%) | 2 (100.0%) |
| Architecture & Engineering | 22 (100.0%) | 0 (0.0%) |
| Life, Physical & Social Science | 0 (0.0%) | 0 (0.0%) |
| Community & Social Service | 52 (20.7%) | 199 (79.3%) |
| Education, Arts & Media | 3 (7.5%) | 37 (92.5%) |
| Legal Services & Support | 0 (0.0%) | 0 (0.0%) |
| Education Instruction & Library | 44 (21.4%) | 162 (78.6%) |
| Arts, Media & Entertainment | 5 (100.0%) | 0 (0.0%) |
| Health Diagnosing & Treating | 0 (0.0%) | 39 (100.0%) |
| Health Technologists | 0 (0.0%) | 4 (100.0%) |
| Total (Category) | 178 (34.6%) | 337 (65.4%) |
| Total (Overall) | 841 (50.3%) | 830 (49.7%) |
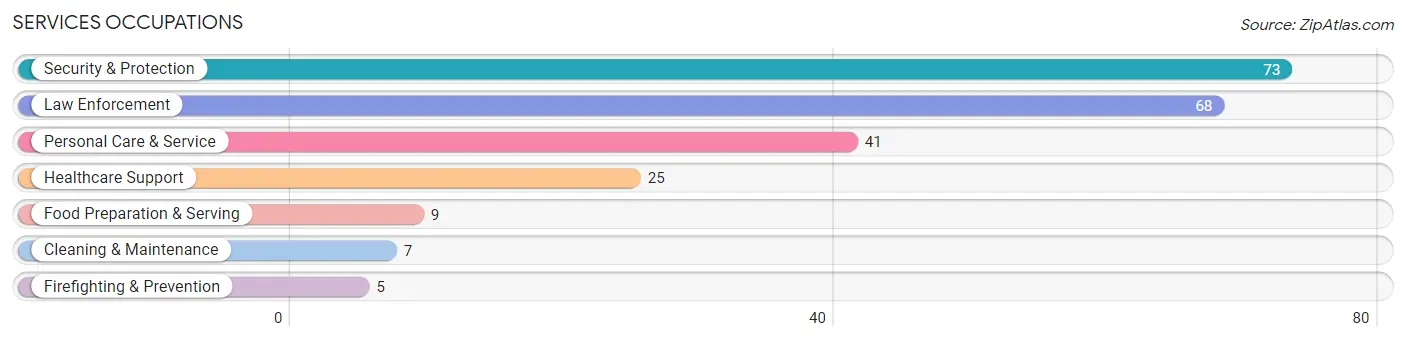
Services Occupations
The most common Services occupations in Mineral County are Security & Protection (73 | 4.4%), Law Enforcement (68 | 4.1%), Personal Care & Service (41 | 2.5%), Healthcare Support (25 | 1.5%), and Food Preparation & Serving (9 | 0.5%).
Services Occupations by Sex
Within the Services occupations in Mineral County, the most male-oriented occupations are Security & Protection (100.0%), Firefighting & Prevention (100.0%), and Law Enforcement (100.0%), while the most female-oriented occupations are Healthcare Support (100.0%), Personal Care & Service (85.4%), and Food Preparation & Serving (44.4%).
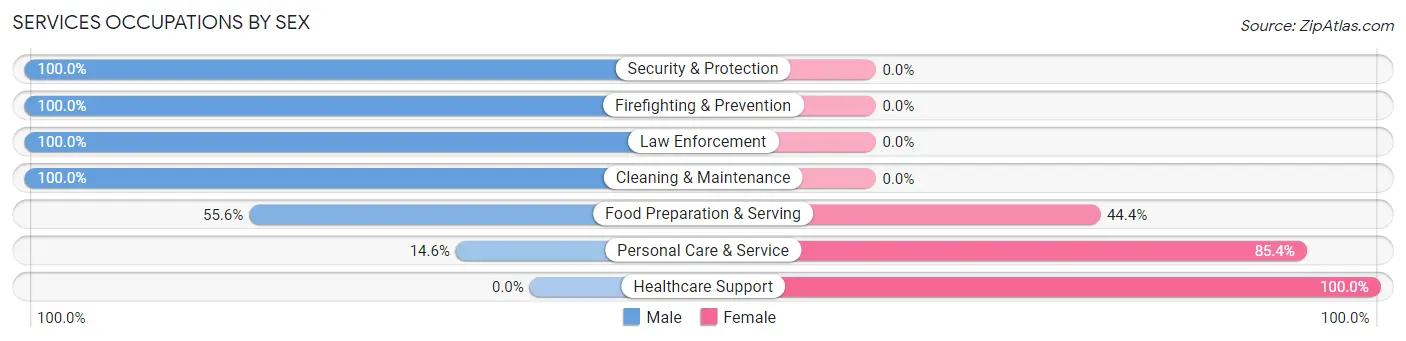
| Occupation | Male | Female |
| Healthcare Support | 0 (0.0%) | 25 (100.0%) |
| Security & Protection | 73 (100.0%) | 0 (0.0%) |
| Firefighting & Prevention | 5 (100.0%) | 0 (0.0%) |
| Law Enforcement | 68 (100.0%) | 0 (0.0%) |
| Food Preparation & Serving | 5 (55.6%) | 4 (44.4%) |
| Cleaning & Maintenance | 7 (100.0%) | 0 (0.0%) |
| Personal Care & Service | 6 (14.6%) | 35 (85.4%) |
| Total (Category) | 91 (58.7%) | 64 (41.3%) |
| Total (Overall) | 841 (50.3%) | 830 (49.7%) |
Sales and Office Occupations
The most common Sales and Office occupations in Mineral County are Sales & Related (227 | 13.6%), and Office & Administration (182 | 10.9%).
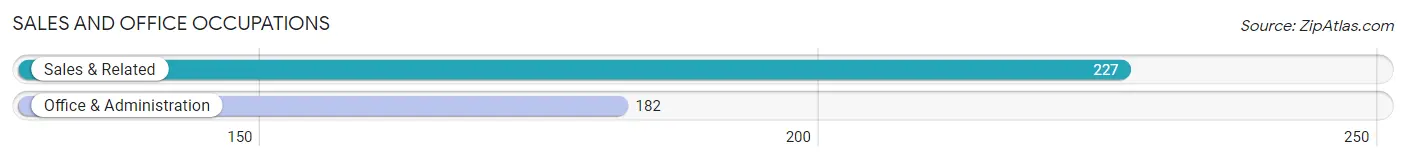
Sales and Office Occupations by Sex
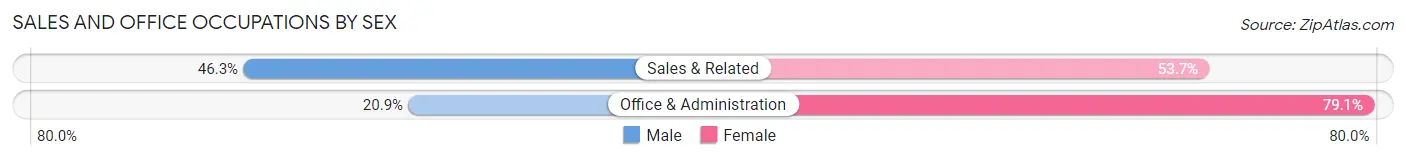
| Occupation | Male | Female |
| Sales & Related | 105 (46.3%) | 122 (53.7%) |
| Office & Administration | 38 (20.9%) | 144 (79.1%) |
| Total (Category) | 143 (35.0%) | 266 (65.0%) |
| Total (Overall) | 841 (50.3%) | 830 (49.7%) |
Natural Resources, Construction and Maintenance Occupations
The most common Natural Resources, Construction and Maintenance occupations in Mineral County are Construction & Extraction (226 | 13.5%), and Installation, Maintenance & Repair (58 | 3.5%).
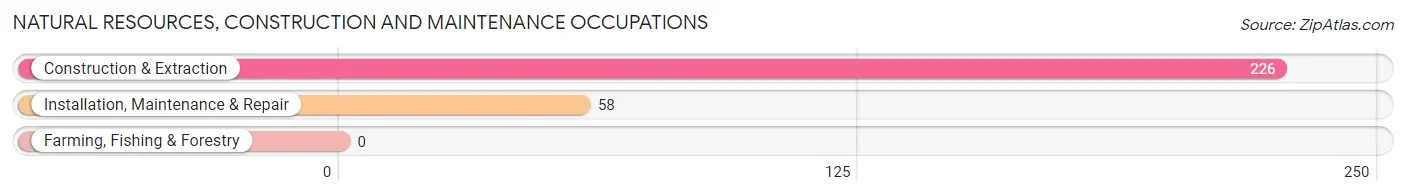
Natural Resources, Construction and Maintenance Occupations by Sex
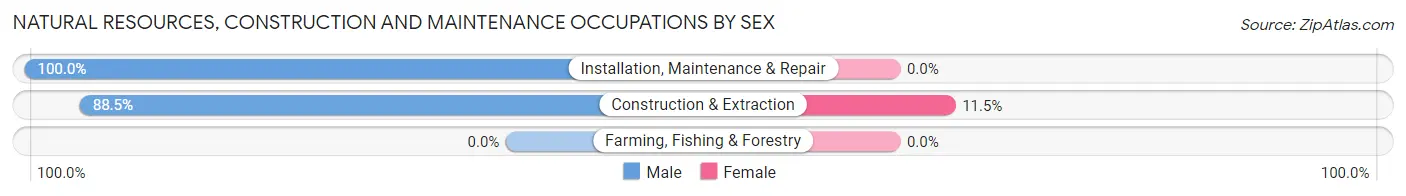
| Occupation | Male | Female |
| Farming, Fishing & Forestry | 0 (0.0%) | 0 (0.0%) |
| Construction & Extraction | 200 (88.5%) | 26 (11.5%) |
| Installation, Maintenance & Repair | 58 (100.0%) | 0 (0.0%) |
| Total (Category) | 258 (90.8%) | 26 (9.1%) |
| Total (Overall) | 841 (50.3%) | 830 (49.7%) |
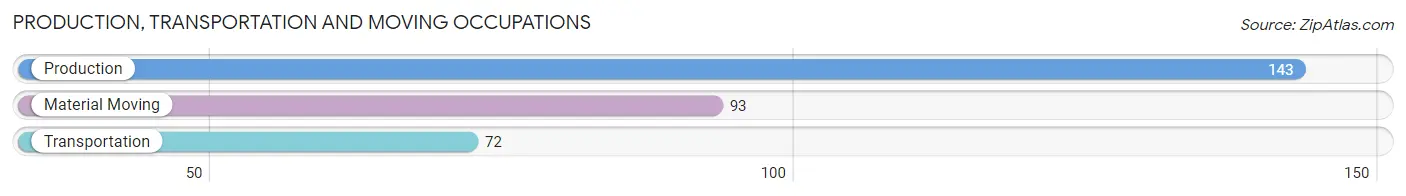
Production, Transportation and Moving Occupations
The most common Production, Transportation and Moving occupations in Mineral County are Production (143 | 8.6%), Material Moving (93 | 5.6%), and Transportation (72 | 4.3%).
Production, Transportation and Moving Occupations by Sex
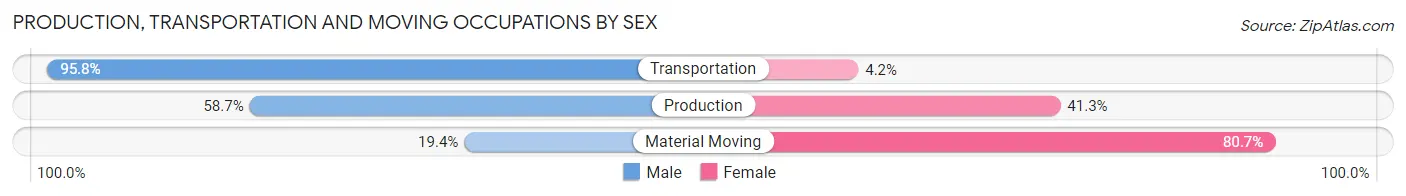
| Occupation | Male | Female |
| Production | 84 (58.7%) | 59 (41.3%) |
| Transportation | 69 (95.8%) | 3 (4.2%) |
| Material Moving | 18 (19.4%) | 75 (80.6%) |
| Total (Category) | 171 (55.5%) | 137 (44.5%) |
| Total (Overall) | 841 (50.3%) | 830 (49.7%) |
Employment Industries by Sex in Mineral County
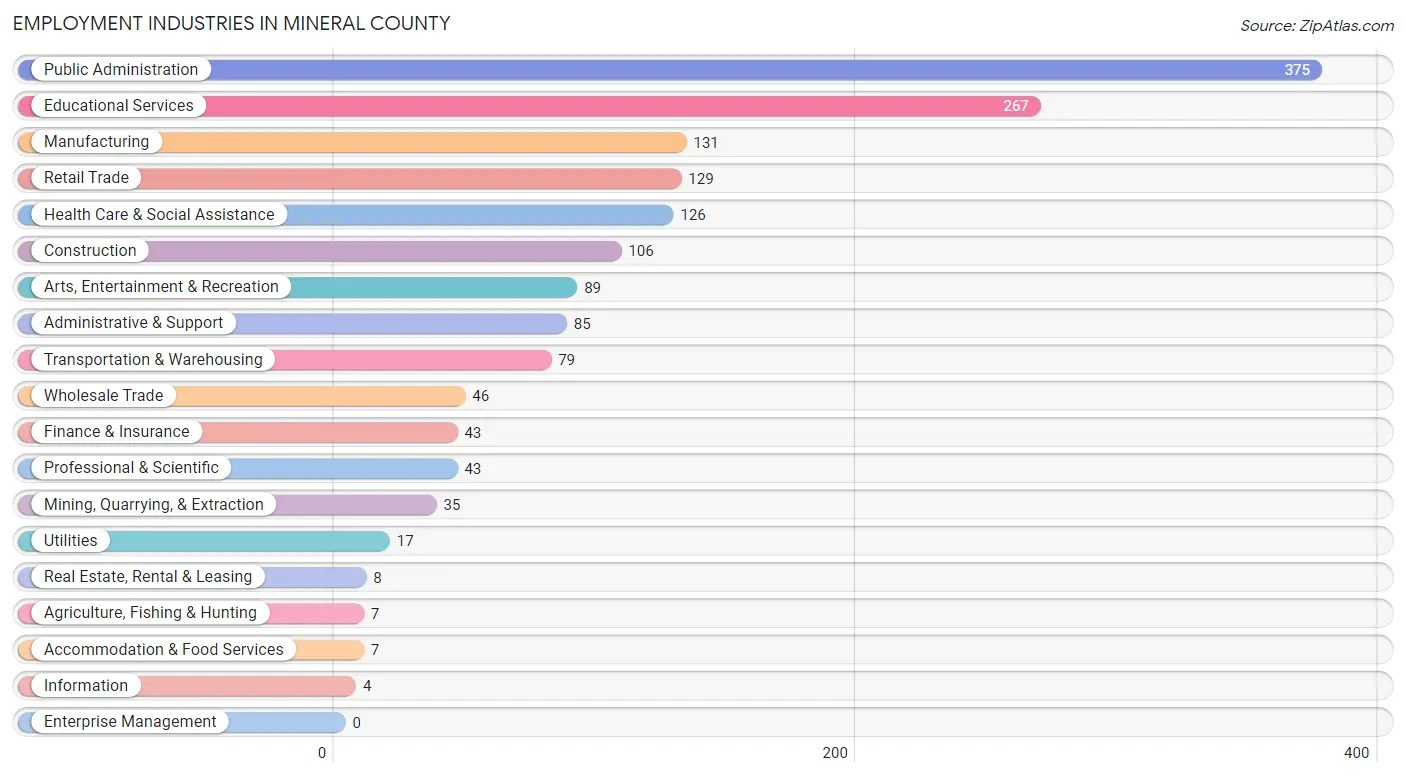
Employment Industries in Mineral County
The major employment industries in Mineral County include Public Administration (375 | 22.4%), Educational Services (267 | 16.0%), Manufacturing (131 | 7.8%), Retail Trade (129 | 7.7%), and Health Care & Social Assistance (126 | 7.5%).
Employment Industries by Sex in Mineral County
The Mineral County industries that see more men than women are Agriculture, Fishing & Hunting (100.0%), Wholesale Trade (100.0%), and Utilities (100.0%), whereas the industries that tend to have a higher number of women are Information (100.0%), Accommodation & Food Services (100.0%), and Health Care & Social Assistance (95.2%).
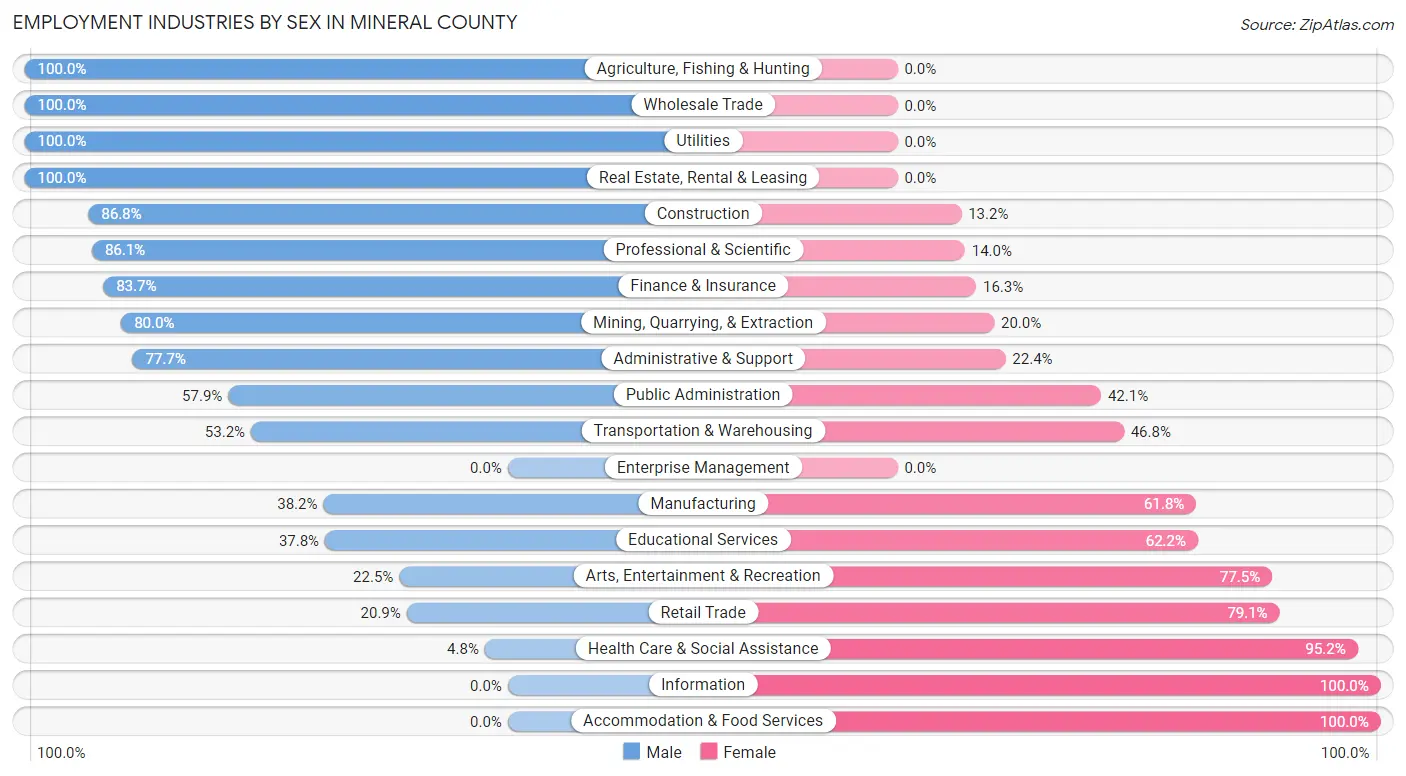
| Industry | Male | Female |
| Agriculture, Fishing & Hunting | 7 (100.0%) | 0 (0.0%) |
| Mining, Quarrying, & Extraction | 28 (80.0%) | 7 (20.0%) |
| Construction | 92 (86.8%) | 14 (13.2%) |
| Manufacturing | 50 (38.2%) | 81 (61.8%) |
| Wholesale Trade | 46 (100.0%) | 0 (0.0%) |
| Retail Trade | 27 (20.9%) | 102 (79.1%) |
| Transportation & Warehousing | 42 (53.2%) | 37 (46.8%) |
| Utilities | 17 (100.0%) | 0 (0.0%) |
| Information | 0 (0.0%) | 4 (100.0%) |
| Finance & Insurance | 36 (83.7%) | 7 (16.3%) |
| Real Estate, Rental & Leasing | 8 (100.0%) | 0 (0.0%) |
| Professional & Scientific | 37 (86.1%) | 6 (14.0%) |
| Enterprise Management | 0 (0.0%) | 0 (0.0%) |
| Administrative & Support | 66 (77.6%) | 19 (22.4%) |
| Educational Services | 101 (37.8%) | 166 (62.2%) |
| Health Care & Social Assistance | 6 (4.8%) | 120 (95.2%) |
| Arts, Entertainment & Recreation | 20 (22.5%) | 69 (77.5%) |
| Accommodation & Food Services | 0 (0.0%) | 7 (100.0%) |
| Public Administration | 217 (57.9%) | 158 (42.1%) |
| Total | 841 (50.3%) | 830 (49.7%) |
Education in Mineral County
School Enrollment in Mineral County
The most common levels of schooling among the 896 students in Mineral County are middle school (242 | 27.0%), high school (235 | 26.2%), and college / undergraduate (171 | 19.1%).
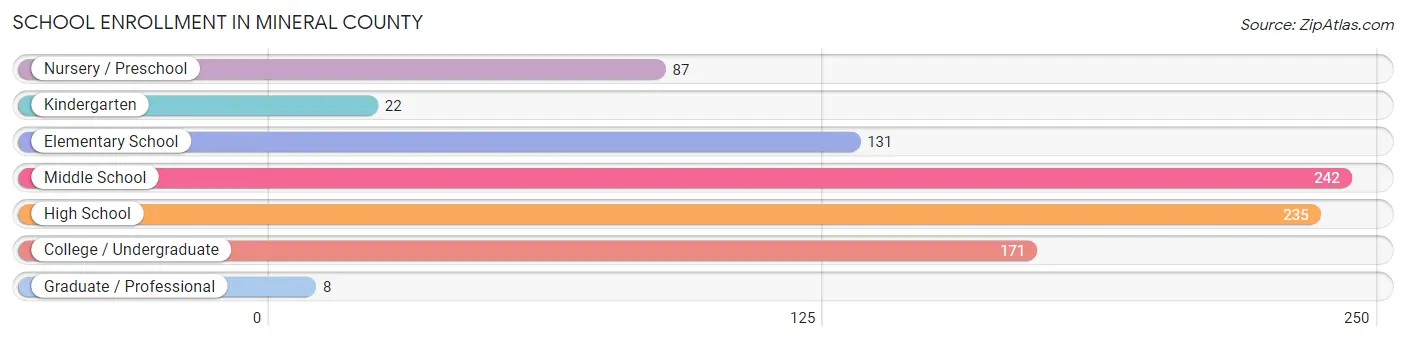
| School Level | # Students | % Students |
| Nursery / Preschool | 87 | 9.7% |
| Kindergarten | 22 | 2.5% |
| Elementary School | 131 | 14.6% |
| Middle School | 242 | 27.0% |
| High School | 235 | 26.2% |
| College / Undergraduate | 171 | 19.1% |
| Graduate / Professional | 8 | 0.9% |
| Total | 896 | 100.0% |
School Enrollment by Age by Funding Source in Mineral County
Out of a total of 896 students who are enrolled in schools in Mineral County, 147 (16.4%) attend a private institution, while the remaining 749 (83.6%) are enrolled in public schools. The age group of 35 years and over has the highest likelihood of being enrolled in private schools, with 82 (94.3% in the age bracket) enrolled. Conversely, the age group of 20 to 24 year olds has the lowest likelihood of being enrolled in a private school, with 5 (100.0% in the age bracket) attending a public institution.
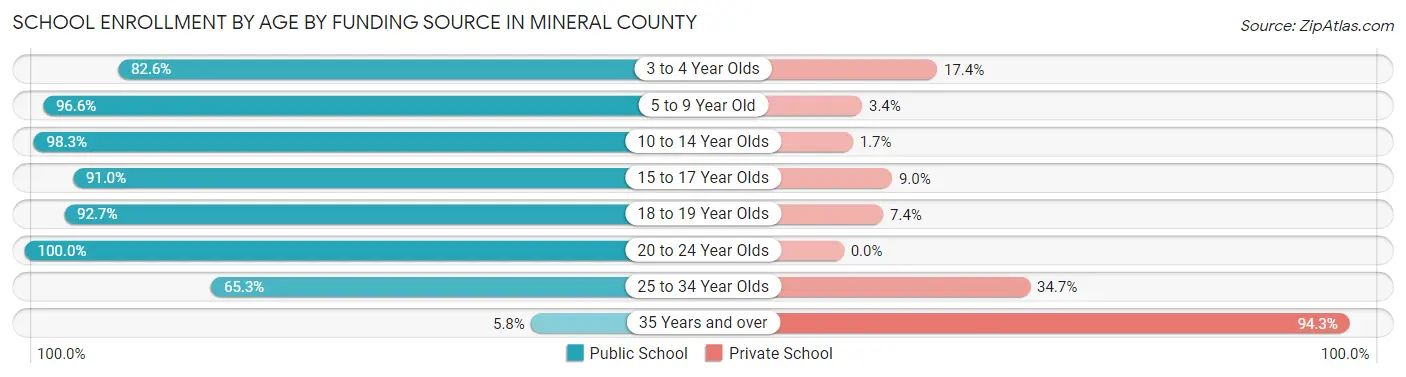
| Age Bracket | Public School | Private School |
| 3 to 4 Year Olds | 76 (82.6%) | 16 (17.4%) |
| 5 to 9 Year Old | 113 (96.6%) | 4 (3.4%) |
| 10 to 14 Year Olds | 349 (98.3%) | 6 (1.7%) |
| 15 to 17 Year Olds | 91 (91.0%) | 9 (9.0%) |
| 18 to 19 Year Olds | 63 (92.6%) | 5 (7.3%) |
| 20 to 24 Year Olds | 5 (100.0%) | 0 (0.0%) |
| 25 to 34 Year Olds | 47 (65.3%) | 25 (34.7%) |
| 35 Years and over | 5 (5.8%) | 82 (94.3%) |
| Total | 749 (83.6%) | 147 (16.4%) |
Educational Attainment by Field of Study in Mineral County
Arts & humanities (126 | 22.9%), engineering (92 | 16.7%), business (90 | 16.3%), education (50 | 9.1%), and liberal arts & history (45 | 8.2%) are the most common fields of study among 551 individuals in Mineral County who have obtained a bachelor's degree or higher.
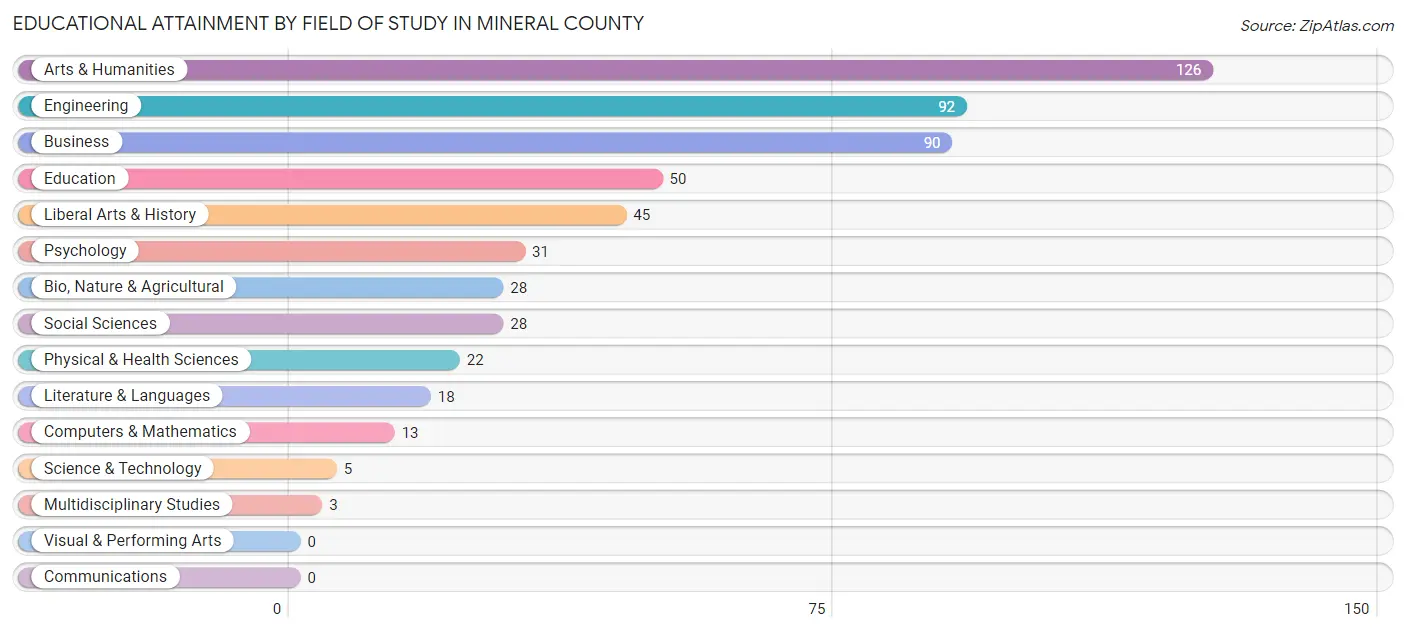
| Field of Study | # Graduates | % Graduates |
| Computers & Mathematics | 13 | 2.4% |
| Bio, Nature & Agricultural | 28 | 5.1% |
| Physical & Health Sciences | 22 | 4.0% |
| Psychology | 31 | 5.6% |
| Social Sciences | 28 | 5.1% |
| Engineering | 92 | 16.7% |
| Multidisciplinary Studies | 3 | 0.5% |
| Science & Technology | 5 | 0.9% |
| Business | 90 | 16.3% |
| Education | 50 | 9.1% |
| Literature & Languages | 18 | 3.3% |
| Liberal Arts & History | 45 | 8.2% |
| Visual & Performing Arts | 0 | 0.0% |
| Communications | 0 | 0.0% |
| Arts & Humanities | 126 | 22.9% |
| Total | 551 | 100.0% |
Transportation & Commute in Mineral County
Vehicle Availability by Sex in Mineral County
The most prevalent vehicle ownership categories in Mineral County are males with 1 vehicle (260, accounting for 30.9%) and females with 1 vehicle (170, making up 32.2%).
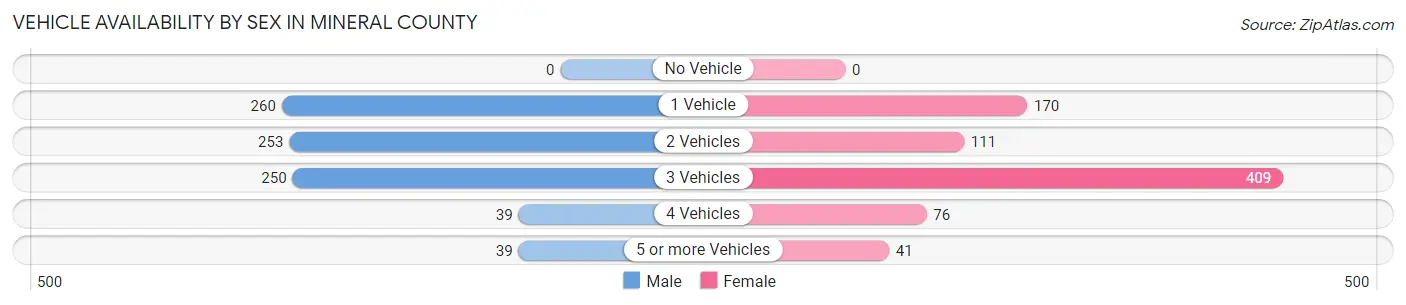
| Vehicles Available | Male | Female |
| No Vehicle | 0 (0.0%) | 0 (0.0%) |
| 1 Vehicle | 260 (30.9%) | 170 (21.1%) |
| 2 Vehicles | 253 (30.1%) | 111 (13.8%) |
| 3 Vehicles | 250 (29.7%) | 409 (50.7%) |
| 4 Vehicles | 39 (4.6%) | 76 (9.4%) |
| 5 or more Vehicles | 39 (4.6%) | 41 (5.1%) |
| Total | 841 (100.0%) | 807 (100.0%) |
Commute Time in Mineral County
The most frequently occuring commute durations in Mineral County are 5 to 9 minutes (527 commuters, 33.1%), 10 to 14 minutes (307 commuters, 19.3%), and less than 5 minutes (267 commuters, 16.8%).
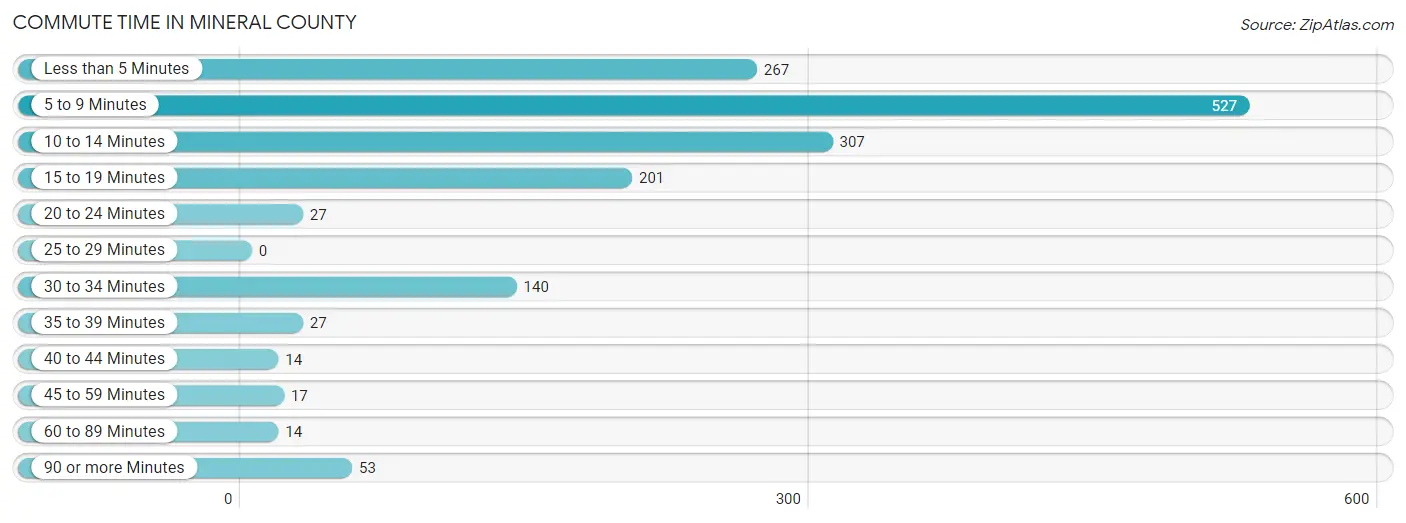
| Commute Time | # Commuters | % Commuters |
| Less than 5 Minutes | 267 | 16.8% |
| 5 to 9 Minutes | 527 | 33.1% |
| 10 to 14 Minutes | 307 | 19.3% |
| 15 to 19 Minutes | 201 | 12.6% |
| 20 to 24 Minutes | 27 | 1.7% |
| 25 to 29 Minutes | 0 | 0.0% |
| 30 to 34 Minutes | 140 | 8.8% |
| 35 to 39 Minutes | 27 | 1.7% |
| 40 to 44 Minutes | 14 | 0.9% |
| 45 to 59 Minutes | 17 | 1.1% |
| 60 to 89 Minutes | 14 | 0.9% |
| 90 or more Minutes | 53 | 3.3% |
Commute Time by Sex in Mineral County
The most common commute times in Mineral County are 10 to 14 minutes (239 commuters, 28.9%) for males and 5 to 9 minutes (329 commuters, 42.9%) for females.
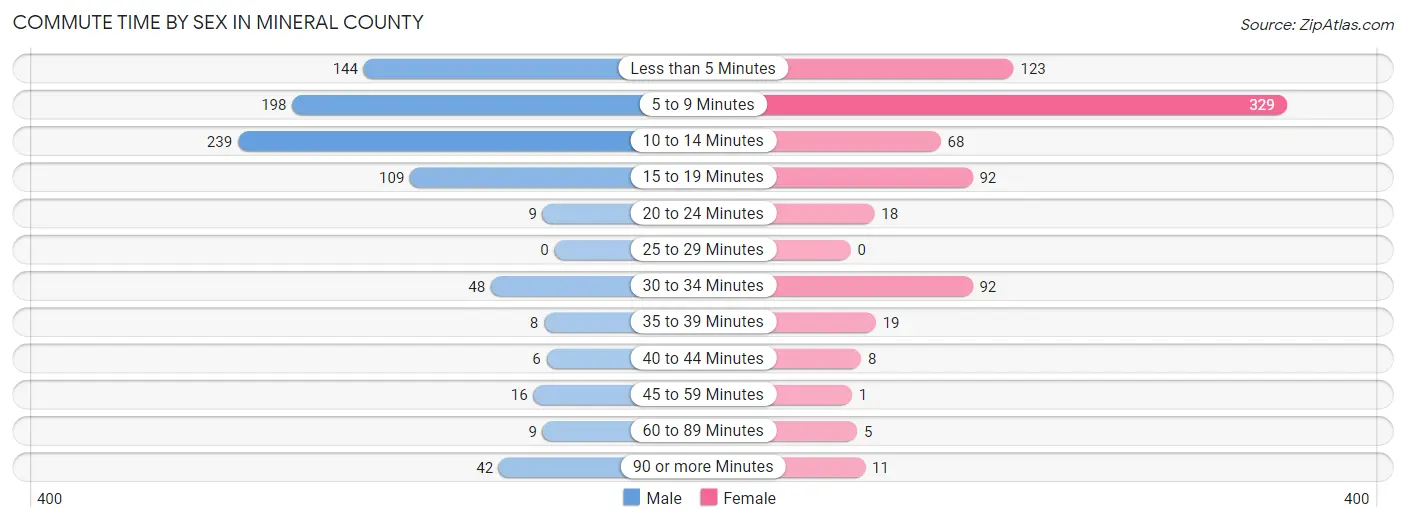
| Commute Time | Male | Female |
| Less than 5 Minutes | 144 (17.4%) | 123 (16.1%) |
| 5 to 9 Minutes | 198 (23.9%) | 329 (42.9%) |
| 10 to 14 Minutes | 239 (28.9%) | 68 (8.9%) |
| 15 to 19 Minutes | 109 (13.2%) | 92 (12.0%) |
| 20 to 24 Minutes | 9 (1.1%) | 18 (2.4%) |
| 25 to 29 Minutes | 0 (0.0%) | 0 (0.0%) |
| 30 to 34 Minutes | 48 (5.8%) | 92 (12.0%) |
| 35 to 39 Minutes | 8 (1.0%) | 19 (2.5%) |
| 40 to 44 Minutes | 6 (0.7%) | 8 (1.0%) |
| 45 to 59 Minutes | 16 (1.9%) | 1 (0.1%) |
| 60 to 89 Minutes | 9 (1.1%) | 5 (0.6%) |
| 90 or more Minutes | 42 (5.1%) | 11 (1.4%) |
Time of Departure to Work by Sex in Mineral County
The most frequent times of departure to work in Mineral County are 6:00 AM to 6:29 AM (263, 31.8%) for males and 7:30 AM to 7:59 AM (179, 23.4%) for females.
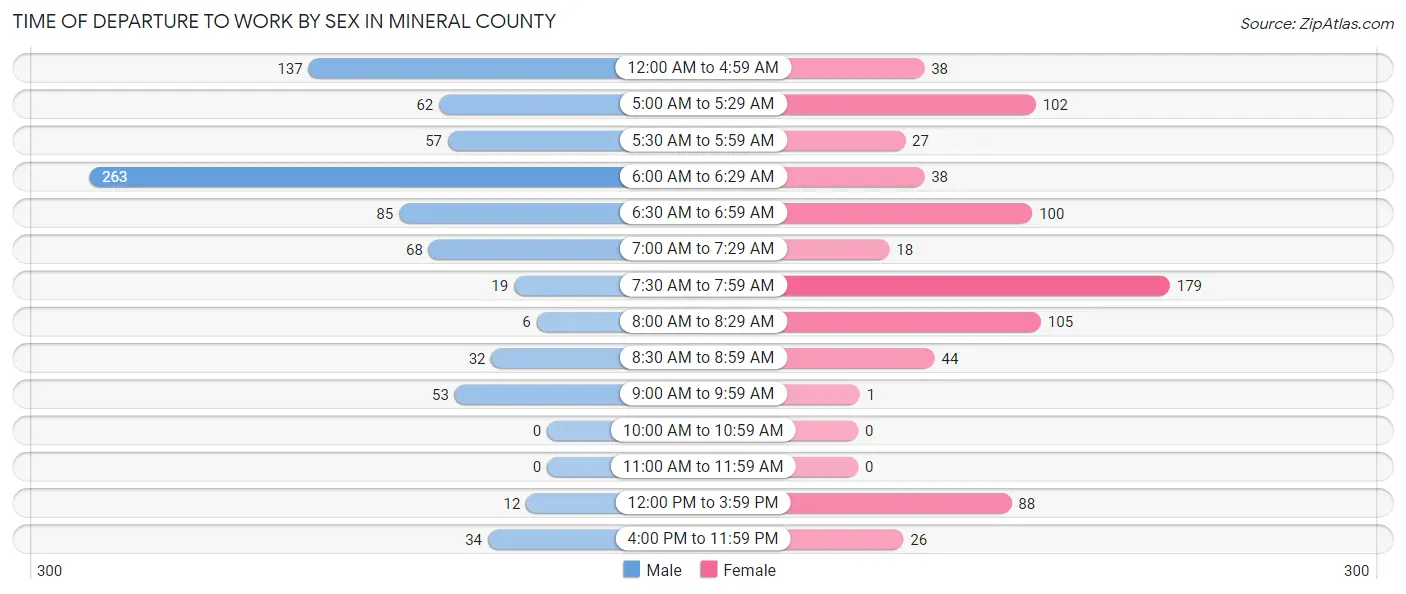
| Time of Departure | Male | Female |
| 12:00 AM to 4:59 AM | 137 (16.6%) | 38 (5.0%) |
| 5:00 AM to 5:29 AM | 62 (7.5%) | 102 (13.3%) |
| 5:30 AM to 5:59 AM | 57 (6.9%) | 27 (3.5%) |
| 6:00 AM to 6:29 AM | 263 (31.8%) | 38 (5.0%) |
| 6:30 AM to 6:59 AM | 85 (10.3%) | 100 (13.1%) |
| 7:00 AM to 7:29 AM | 68 (8.2%) | 18 (2.4%) |
| 7:30 AM to 7:59 AM | 19 (2.3%) | 179 (23.4%) |
| 8:00 AM to 8:29 AM | 6 (0.7%) | 105 (13.7%) |
| 8:30 AM to 8:59 AM | 32 (3.9%) | 44 (5.7%) |
| 9:00 AM to 9:59 AM | 53 (6.4%) | 1 (0.1%) |
| 10:00 AM to 10:59 AM | 0 (0.0%) | 0 (0.0%) |
| 11:00 AM to 11:59 AM | 0 (0.0%) | 0 (0.0%) |
| 12:00 PM to 3:59 PM | 12 (1.5%) | 88 (11.5%) |
| 4:00 PM to 11:59 PM | 34 (4.1%) | 26 (3.4%) |
| Total | 828 (100.0%) | 766 (100.0%) |
Housing Occupancy in Mineral County
Occupancy by Ownership in Mineral County
Of the total 1,881 dwellings in Mineral County, owner-occupied units account for 1,390 (73.9%), while renter-occupied units make up 491 (26.1%).
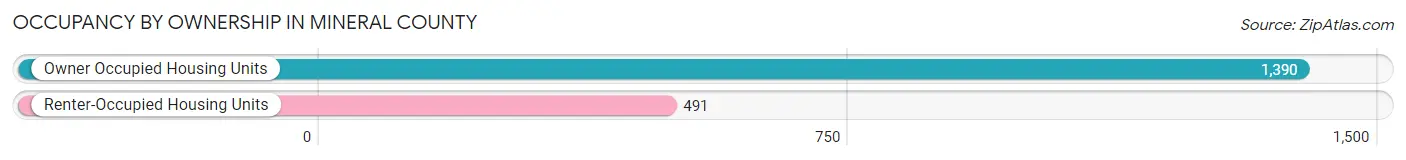
| Occupancy | # Housing Units | % Housing Units |
| Owner Occupied Housing Units | 1,390 | 73.9% |
| Renter-Occupied Housing Units | 491 | 26.1% |
| Total Occupied Housing Units | 1,881 | 100.0% |
Occupancy by Household Size in Mineral County
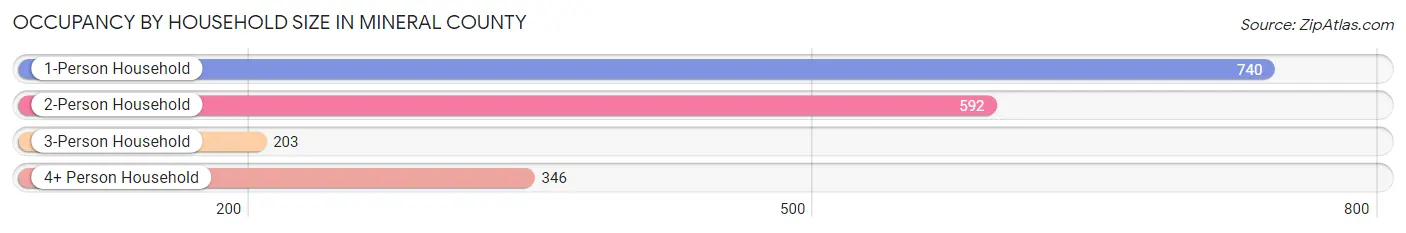
| Household Size | # Housing Units | % Housing Units |
| 1-Person Household | 740 | 39.3% |
| 2-Person Household | 592 | 31.5% |
| 3-Person Household | 203 | 10.8% |
| 4+ Person Household | 346 | 18.4% |
| Total Housing Units | 1,881 | 100.0% |
Occupancy by Ownership by Household Size in Mineral County
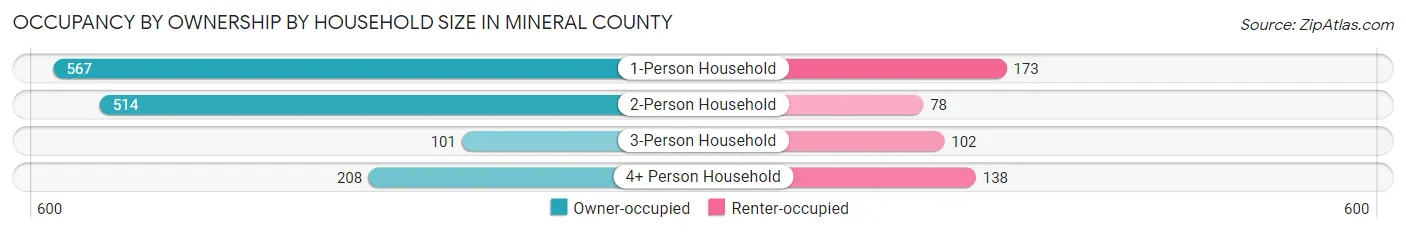
| Household Size | Owner-occupied | Renter-occupied |
| 1-Person Household | 567 (76.6%) | 173 (23.4%) |
| 2-Person Household | 514 (86.8%) | 78 (13.2%) |
| 3-Person Household | 101 (49.7%) | 102 (50.2%) |
| 4+ Person Household | 208 (60.1%) | 138 (39.9%) |
| Total Housing Units | 1,390 (73.9%) | 491 (26.1%) |
Occupancy by Educational Attainment in Mineral County
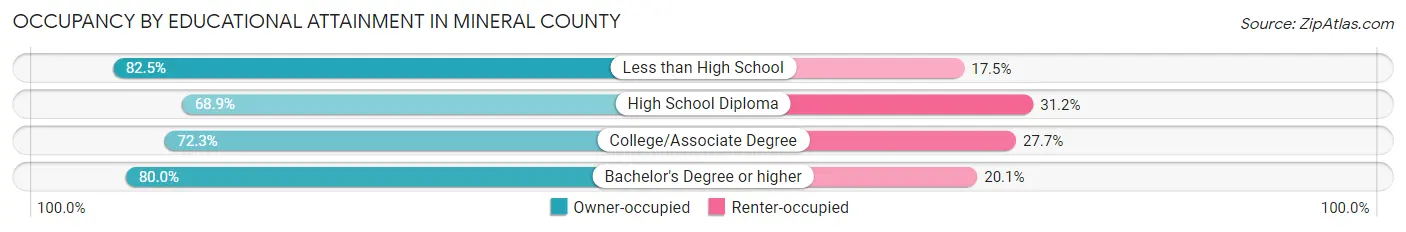
| Household Size | Owner-occupied | Renter-occupied |
| Less than High School | 189 (82.5%) | 40 (17.5%) |
| High School Diploma | 420 (68.9%) | 190 (31.1%) |
| College/Associate Degree | 490 (72.3%) | 188 (27.7%) |
| Bachelor's Degree or higher | 291 (79.9%) | 73 (20.1%) |
Occupancy by Age of Householder in Mineral County
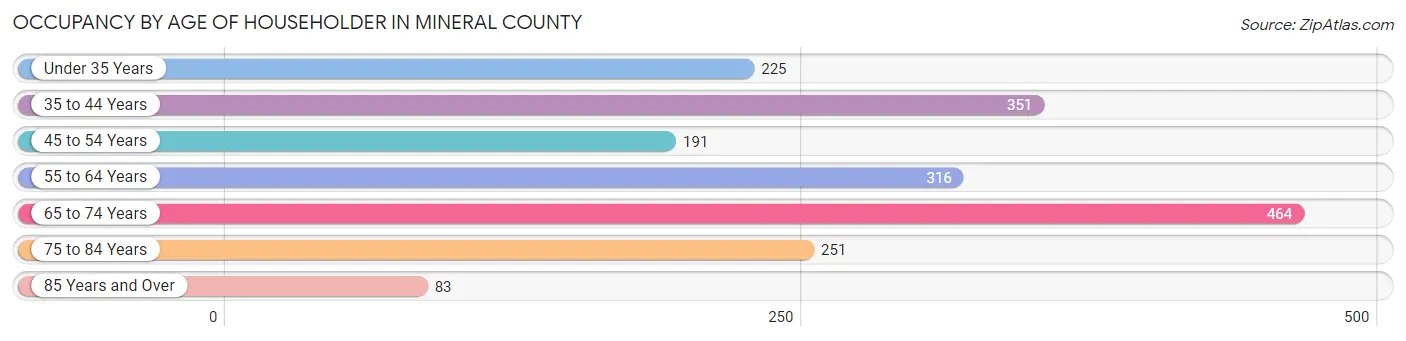
| Age Bracket | # Households | % Households |
| Under 35 Years | 225 | 12.0% |
| 35 to 44 Years | 351 | 18.7% |
| 45 to 54 Years | 191 | 10.2% |
| 55 to 64 Years | 316 | 16.8% |
| 65 to 74 Years | 464 | 24.7% |
| 75 to 84 Years | 251 | 13.3% |
| 85 Years and Over | 83 | 4.4% |
| Total | 1,881 | 100.0% |
Housing Finances in Mineral County
Median Income by Occupancy in Mineral County
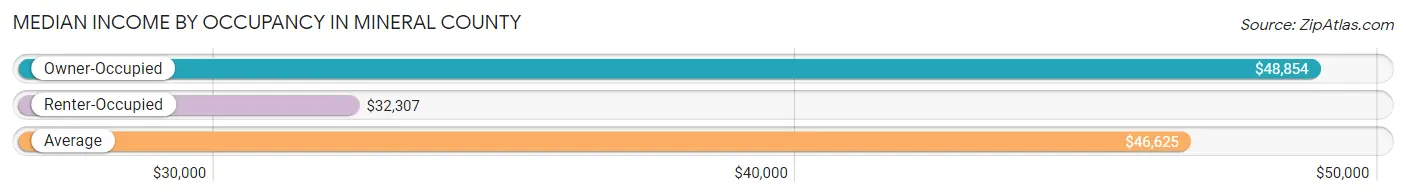
| Occupancy Type | # Households | Median Income |
| Owner-Occupied | 1,390 (73.9%) | $48,854 |
| Renter-Occupied | 491 (26.1%) | $32,307 |
| Average | 1,881 (100.0%) | $46,625 |
Occupancy by Householder Income Bracket in Mineral County
| Income Bracket | Owner-occupied | Renter-occupied |
| Less than $5,000 | 66 (4.8%) | 19 (3.9%) |
| $5,000 to $9,999 | 29 (2.1%) | 4 (0.8%) |
| $10,000 to $14,999 | 145 (10.4%) | 13 (2.6%) |
| $15,000 to $19,999 | 80 (5.8%) | 47 (9.6%) |
| $20,000 to $24,999 | 63 (4.5%) | 25 (5.1%) |
| $25,000 to $34,999 | 98 (7.0%) | 147 (29.9%) |
| $35,000 to $49,999 | 225 (16.2%) | 42 (8.6%) |
| $50,000 to $74,999 | 263 (18.9%) | 63 (12.8%) |
| $75,000 to $99,999 | 163 (11.7%) | 42 (8.6%) |
| $100,000 to $149,999 | 184 (13.2%) | 75 (15.3%) |
| $150,000 or more | 74 (5.3%) | 14 (2.9%) |
| Total | 1,390 (100.0%) | 491 (100.0%) |
Monthly Housing Cost Tiers in Mineral County
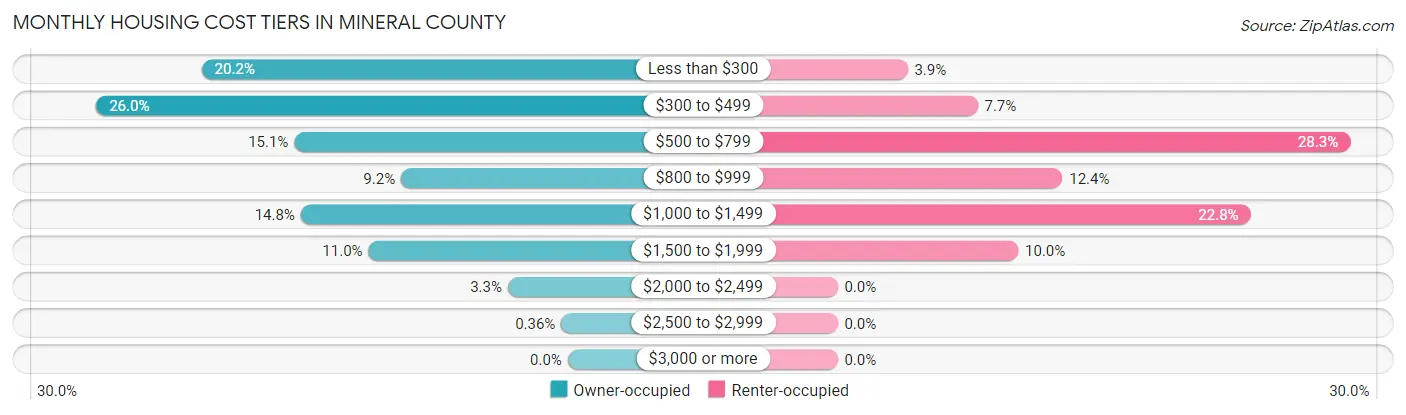
| Monthly Cost | Owner-occupied | Renter-occupied |
| Less than $300 | 281 (20.2%) | 19 (3.9%) |
| $300 to $499 | 362 (26.0%) | 38 (7.7%) |
| $500 to $799 | 210 (15.1%) | 139 (28.3%) |
| $800 to $999 | 128 (9.2%) | 61 (12.4%) |
| $1,000 to $1,499 | 205 (14.7%) | 112 (22.8%) |
| $1,500 to $1,999 | 153 (11.0%) | 49 (10.0%) |
| $2,000 to $2,499 | 46 (3.3%) | 0 (0.0%) |
| $2,500 to $2,999 | 5 (0.4%) | 0 (0.0%) |
| $3,000 or more | 0 (0.0%) | 0 (0.0%) |
| Total | 1,390 (100.0%) | 491 (100.0%) |
Physical Housing Characteristics in Mineral County
Housing Structures in Mineral County
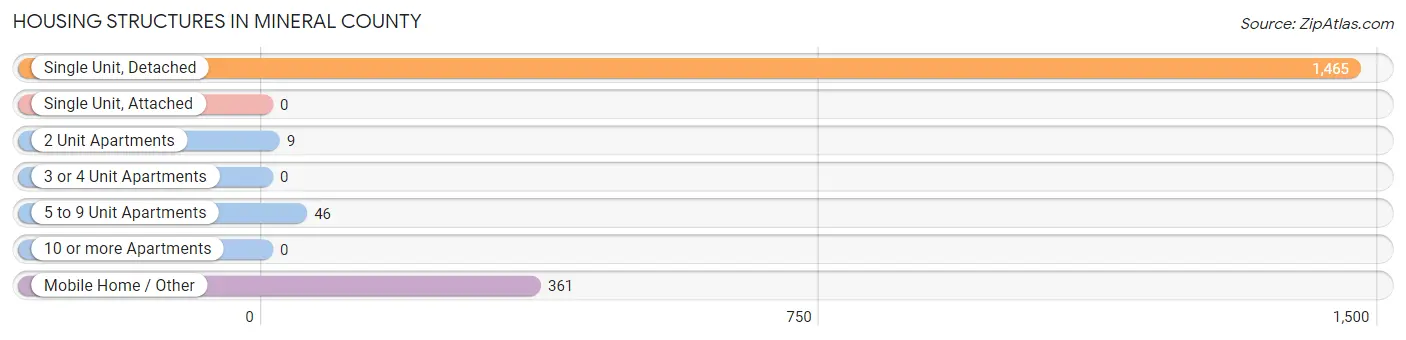
| Structure Type | # Housing Units | % Housing Units |
| Single Unit, Detached | 1,465 | 77.9% |
| Single Unit, Attached | 0 | 0.0% |
| 2 Unit Apartments | 9 | 0.5% |
| 3 or 4 Unit Apartments | 0 | 0.0% |
| 5 to 9 Unit Apartments | 46 | 2.5% |
| 10 or more Apartments | 0 | 0.0% |
| Mobile Home / Other | 361 | 19.2% |
| Total | 1,881 | 100.0% |
Housing Structures by Occupancy in Mineral County
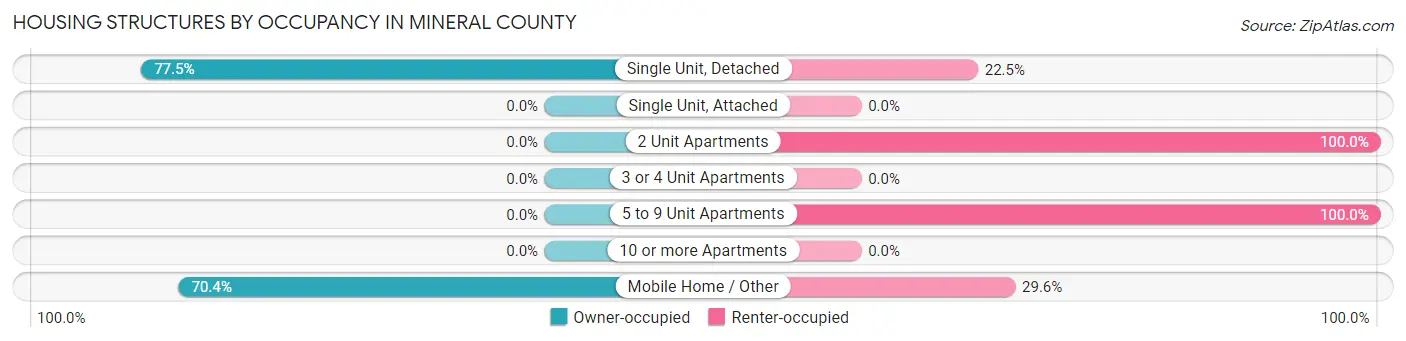
| Structure Type | Owner-occupied | Renter-occupied |
| Single Unit, Detached | 1,136 (77.5%) | 329 (22.5%) |
| Single Unit, Attached | 0 (0.0%) | 0 (0.0%) |
| 2 Unit Apartments | 0 (0.0%) | 9 (100.0%) |
| 3 or 4 Unit Apartments | 0 (0.0%) | 0 (0.0%) |
| 5 to 9 Unit Apartments | 0 (0.0%) | 46 (100.0%) |
| 10 or more Apartments | 0 (0.0%) | 0 (0.0%) |
| Mobile Home / Other | 254 (70.4%) | 107 (29.6%) |
| Total | 1,390 (73.9%) | 491 (26.1%) |
Housing Structures by Number of Rooms in Mineral County
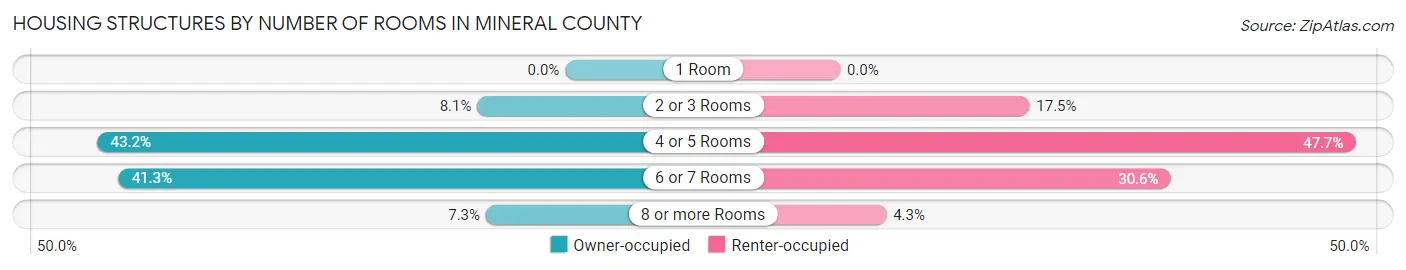
| Number of Rooms | Owner-occupied | Renter-occupied |
| 1 Room | 0 (0.0%) | 0 (0.0%) |
| 2 or 3 Rooms | 113 (8.1%) | 86 (17.5%) |
| 4 or 5 Rooms | 601 (43.2%) | 234 (47.7%) |
| 6 or 7 Rooms | 574 (41.3%) | 150 (30.5%) |
| 8 or more Rooms | 102 (7.3%) | 21 (4.3%) |
| Total | 1,390 (100.0%) | 491 (100.0%) |
Housing Structure by Heating Type in Mineral County
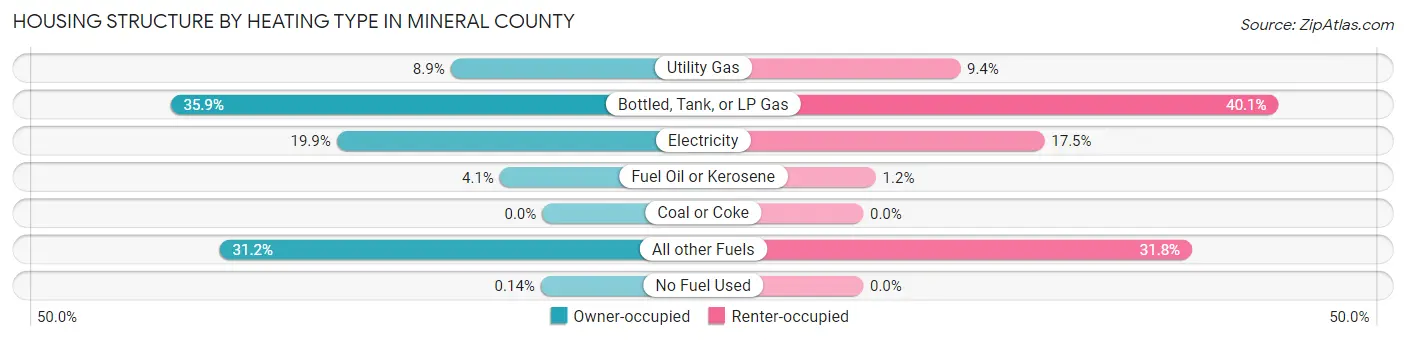
| Heating Type | Owner-occupied | Renter-occupied |
| Utility Gas | 123 (8.8%) | 46 (9.4%) |
| Bottled, Tank, or LP Gas | 499 (35.9%) | 197 (40.1%) |
| Electricity | 276 (19.9%) | 86 (17.5%) |
| Fuel Oil or Kerosene | 57 (4.1%) | 6 (1.2%) |
| Coal or Coke | 0 (0.0%) | 0 (0.0%) |
| All other Fuels | 433 (31.1%) | 156 (31.8%) |
| No Fuel Used | 2 (0.1%) | 0 (0.0%) |
| Total | 1,390 (100.0%) | 491 (100.0%) |
Household Vehicle Usage in Mineral County
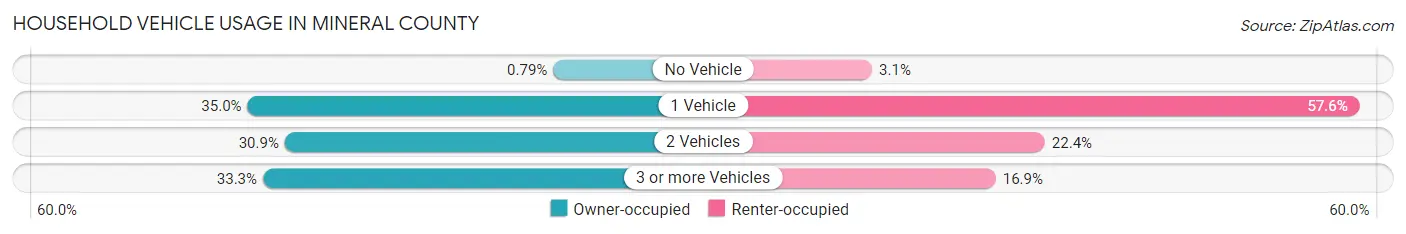
| Vehicles per Household | Owner-occupied | Renter-occupied |
| No Vehicle | 11 (0.8%) | 15 (3.0%) |
| 1 Vehicle | 487 (35.0%) | 283 (57.6%) |
| 2 Vehicles | 429 (30.9%) | 110 (22.4%) |
| 3 or more Vehicles | 463 (33.3%) | 83 (16.9%) |
| Total | 1,390 (100.0%) | 491 (100.0%) |
Real Estate & Mortgages in Mineral County
Real Estate and Mortgage Overview in Mineral County
| Characteristic | Without Mortgage | With Mortgage |
| Housing Units | 735 | 655 |
| Median Property Value | $117,500 | $171,000 |
| Median Household Income | $34,886 | $50 |
| Monthly Housing Costs | $323 | $0 |
| Real Estate Taxes | $1,065 | $59 |
Property Value by Mortgage Status in Mineral County
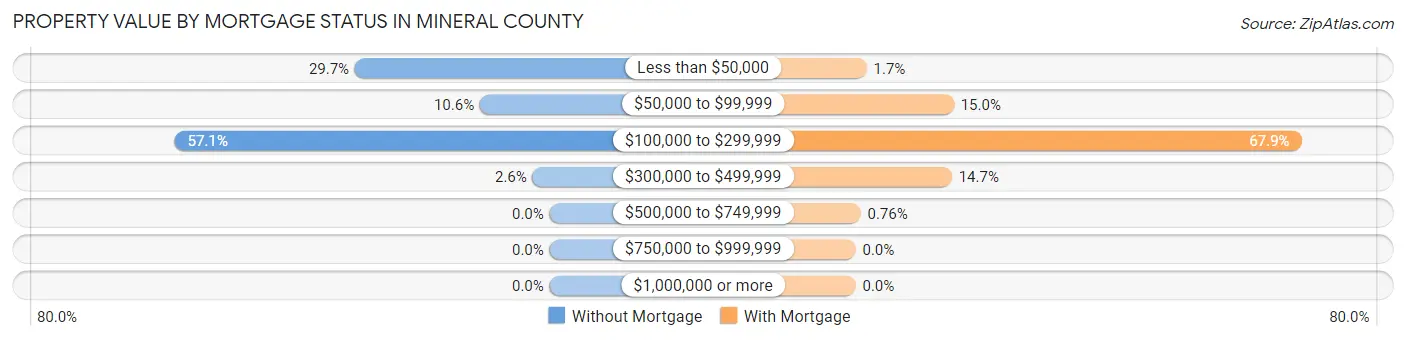
| Property Value | Without Mortgage | With Mortgage |
| Less than $50,000 | 218 (29.7%) | 11 (1.7%) |
| $50,000 to $99,999 | 78 (10.6%) | 98 (15.0%) |
| $100,000 to $299,999 | 420 (57.1%) | 445 (67.9%) |
| $300,000 to $499,999 | 19 (2.6%) | 96 (14.7%) |
| $500,000 to $749,999 | 0 (0.0%) | 5 (0.8%) |
| $750,000 to $999,999 | 0 (0.0%) | 0 (0.0%) |
| $1,000,000 or more | 0 (0.0%) | 0 (0.0%) |
| Total | 735 (100.0%) | 655 (100.0%) |
Household Income by Mortgage Status in Mineral County
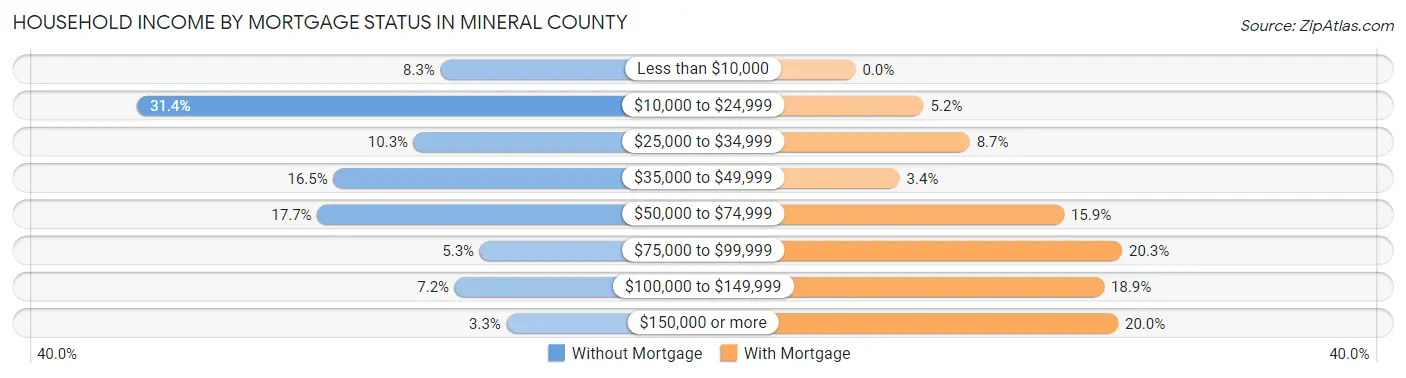
| Household Income | Without Mortgage | With Mortgage |
| Less than $10,000 | 61 (8.3%) | 0 (0.0%) |
| $10,000 to $24,999 | 231 (31.4%) | 34 (5.2%) |
| $25,000 to $34,999 | 76 (10.3%) | 57 (8.7%) |
| $35,000 to $49,999 | 121 (16.5%) | 22 (3.4%) |
| $50,000 to $74,999 | 130 (17.7%) | 104 (15.9%) |
| $75,000 to $99,999 | 39 (5.3%) | 133 (20.3%) |
| $100,000 to $149,999 | 53 (7.2%) | 124 (18.9%) |
| $150,000 or more | 24 (3.3%) | 131 (20.0%) |
| Total | 735 (100.0%) | 655 (100.0%) |
Property Value to Household Income Ratio in Mineral County
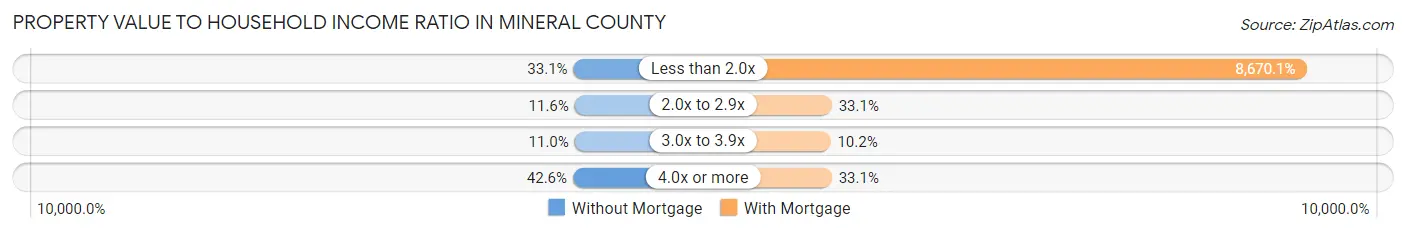
| Value-to-Income Ratio | Without Mortgage | With Mortgage |
| Less than 2.0x | 243 (33.1%) | 56,789 (8,670.1%) |
| 2.0x to 2.9x | 85 (11.6%) | 217 (33.1%) |
| 3.0x to 3.9x | 81 (11.0%) | 67 (10.2%) |
| 4.0x or more | 313 (42.6%) | 217 (33.1%) |
| Total | 735 (100.0%) | 655 (100.0%) |
Real Estate Taxes by Mortgage Status in Mineral County
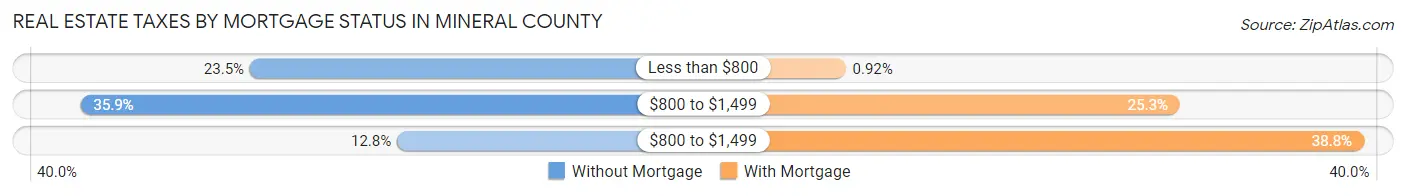
| Property Taxes | Without Mortgage | With Mortgage |
| Less than $800 | 173 (23.5%) | 6 (0.9%) |
| $800 to $1,499 | 264 (35.9%) | 166 (25.3%) |
| $800 to $1,499 | 94 (12.8%) | 254 (38.8%) |
| Total | 735 (100.0%) | 655 (100.0%) |
Health & Disability in Mineral County
Health Insurance Coverage by Age in Mineral County
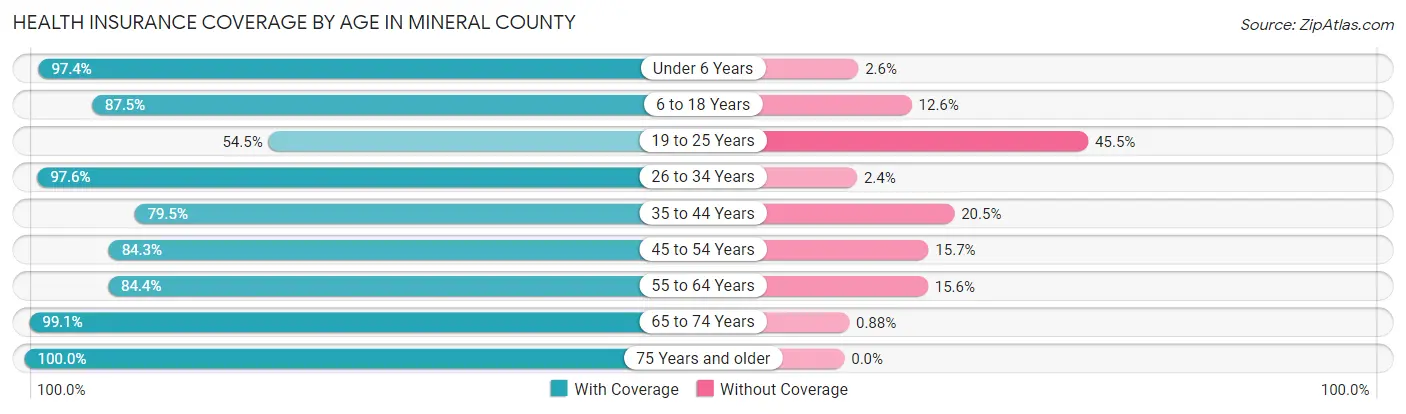
| Age Bracket | With Coverage | Without Coverage |
| Under 6 Years | 301 (97.4%) | 8 (2.6%) |
| 6 to 18 Years | 620 (87.5%) | 89 (12.6%) |
| 19 to 25 Years | 163 (54.5%) | 136 (45.5%) |
| 26 to 34 Years | 496 (97.6%) | 12 (2.4%) |
| 35 to 44 Years | 473 (79.5%) | 122 (20.5%) |
| 45 to 54 Years | 258 (84.3%) | 48 (15.7%) |
| 55 to 64 Years | 396 (84.4%) | 73 (15.6%) |
| 65 to 74 Years | 792 (99.1%) | 7 (0.9%) |
| 75 Years and older | 488 (100.0%) | 0 (0.0%) |
| Total | 3,987 (89.0%) | 495 (11.0%) |
Health Insurance Coverage by Citizenship Status in Mineral County
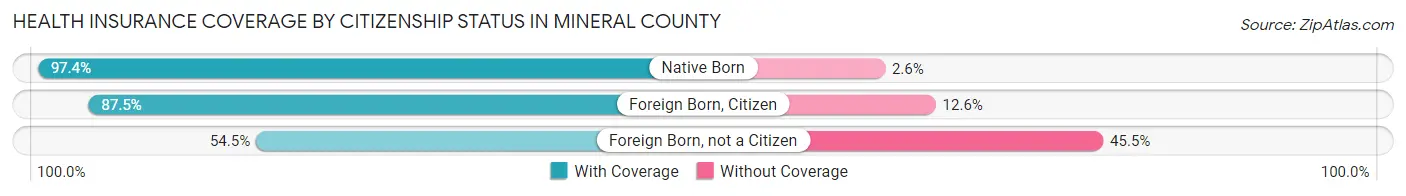
| Citizenship Status | With Coverage | Without Coverage |
| Native Born | 301 (97.4%) | 8 (2.6%) |
| Foreign Born, Citizen | 620 (87.5%) | 89 (12.6%) |
| Foreign Born, not a Citizen | 163 (54.5%) | 136 (45.5%) |
Health Insurance Coverage by Household Income in Mineral County
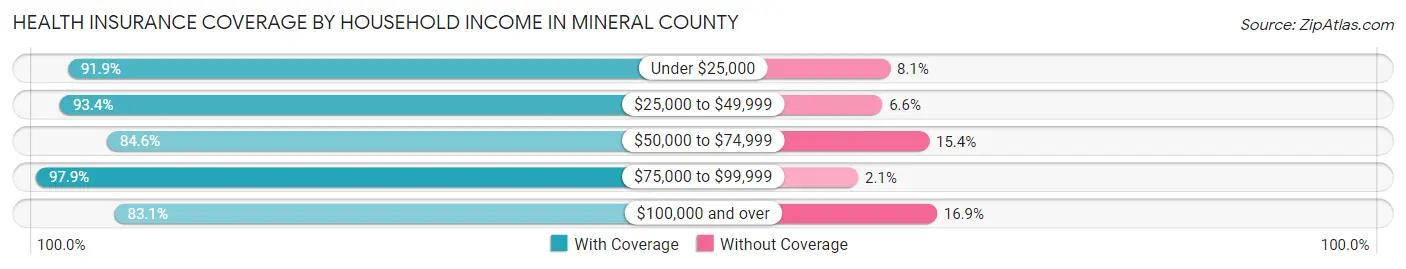
| Household Income | With Coverage | Without Coverage |
| Under $25,000 | 705 (91.9%) | 62 (8.1%) |
| $25,000 to $49,999 | 900 (93.4%) | 64 (6.6%) |
| $50,000 to $74,999 | 1,076 (84.6%) | 196 (15.4%) |
| $75,000 to $99,999 | 505 (97.9%) | 11 (2.1%) |
| $100,000 and over | 799 (83.1%) | 162 (16.9%) |
Public vs Private Health Insurance Coverage by Age in Mineral County
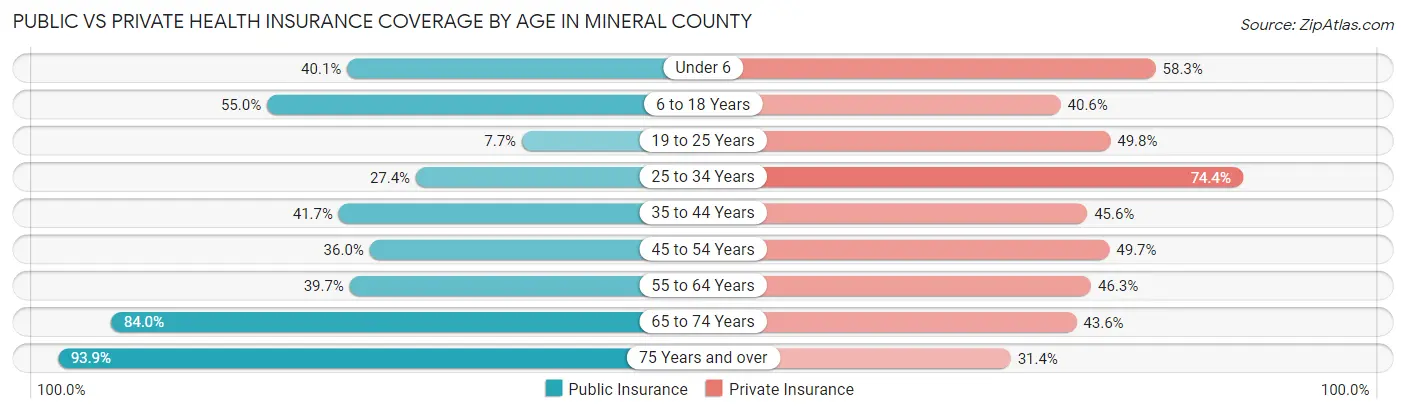
| Age Bracket | Public Insurance | Private Insurance |
| Under 6 | 124 (40.1%) | 180 (58.3%) |
| 6 to 18 Years | 390 (55.0%) | 288 (40.6%) |
| 19 to 25 Years | 23 (7.7%) | 149 (49.8%) |
| 25 to 34 Years | 139 (27.4%) | 378 (74.4%) |
| 35 to 44 Years | 248 (41.7%) | 271 (45.6%) |
| 45 to 54 Years | 110 (35.9%) | 152 (49.7%) |
| 55 to 64 Years | 186 (39.7%) | 217 (46.3%) |
| 65 to 74 Years | 671 (84.0%) | 348 (43.5%) |
| 75 Years and over | 458 (93.9%) | 153 (31.4%) |
| Total | 2,349 (52.4%) | 2,136 (47.7%) |
Disability Status by Sex by Age in Mineral County
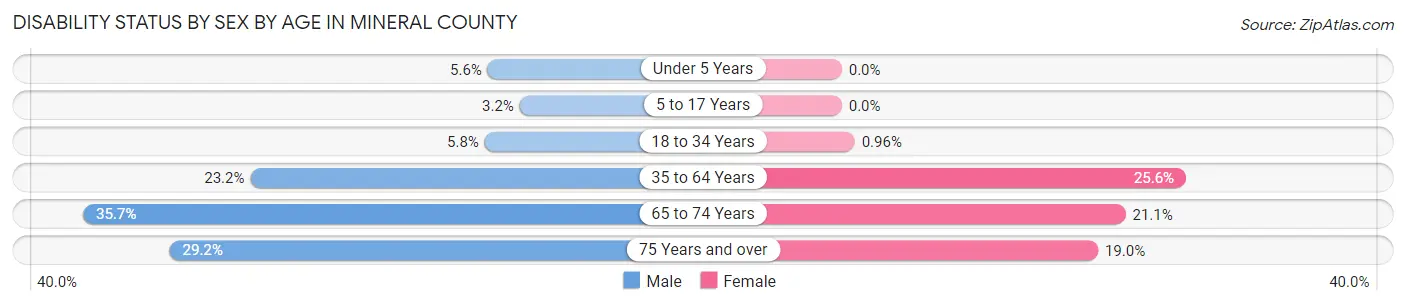
| Age Bracket | Male | Female |
| Under 5 Years | 9 (5.6%) | 0 (0.0%) |
| 5 to 17 Years | 8 (3.2%) | 0 (0.0%) |
| 18 to 34 Years | 18 (5.8%) | 6 (1.0%) |
| 35 to 64 Years | 182 (23.2%) | 150 (25.6%) |
| 65 to 74 Years | 92 (35.7%) | 114 (21.1%) |
| 75 Years and over | 95 (29.2%) | 31 (19.0%) |
Disability Class by Sex by Age in Mineral County
Disability Class: Hearing Difficulty
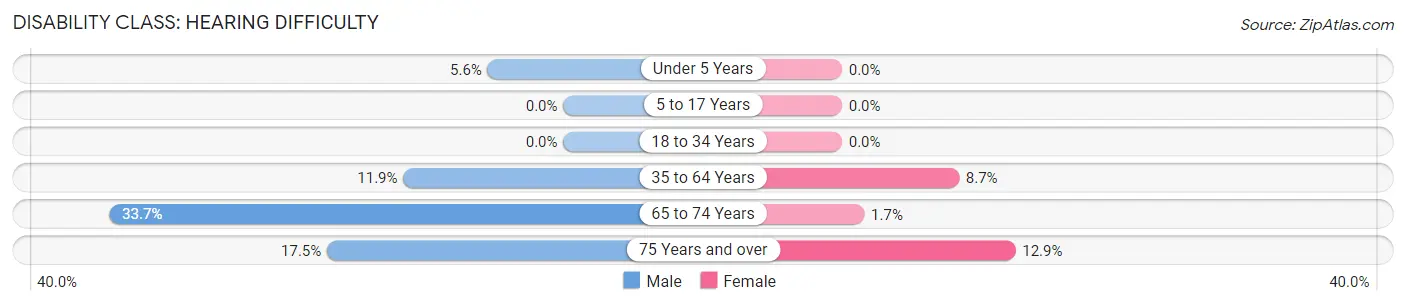
| Age Bracket | Male | Female |
| Under 5 Years | 9 (5.6%) | 0 (0.0%) |
| 5 to 17 Years | 0 (0.0%) | 0 (0.0%) |
| 18 to 34 Years | 0 (0.0%) | 0 (0.0%) |
| 35 to 64 Years | 93 (11.9%) | 51 (8.7%) |
| 65 to 74 Years | 87 (33.7%) | 9 (1.7%) |
| 75 Years and over | 57 (17.5%) | 21 (12.9%) |
Disability Class: Vision Difficulty
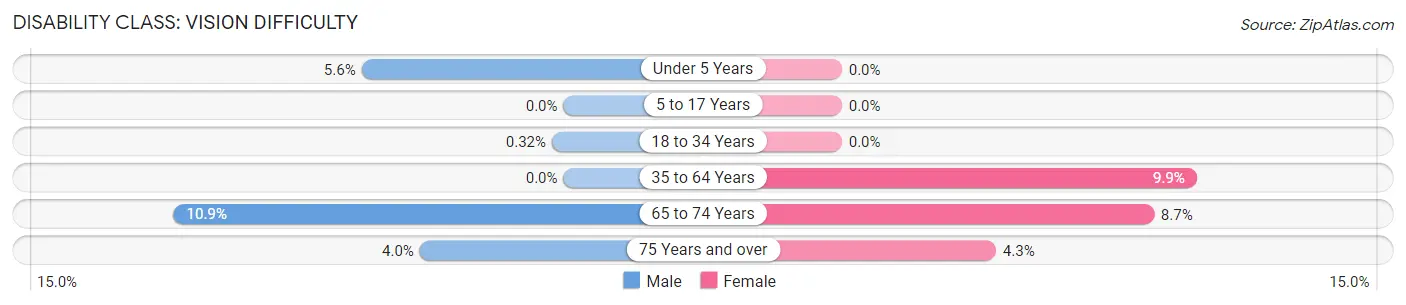
| Age Bracket | Male | Female |
| Under 5 Years | 9 (5.6%) | 0 (0.0%) |
| 5 to 17 Years | 0 (0.0%) | 0 (0.0%) |
| 18 to 34 Years | 1 (0.3%) | 0 (0.0%) |
| 35 to 64 Years | 0 (0.0%) | 58 (9.9%) |
| 65 to 74 Years | 28 (10.8%) | 47 (8.7%) |
| 75 Years and over | 13 (4.0%) | 7 (4.3%) |
Disability Class: Cognitive Difficulty
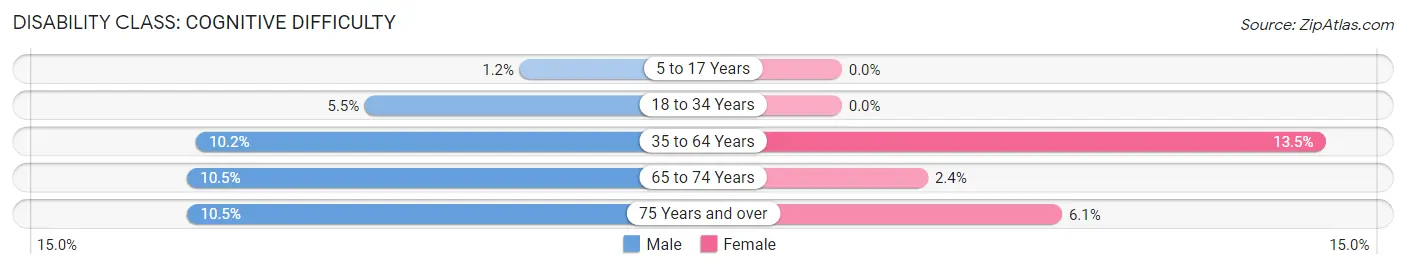
| Age Bracket | Male | Female |
| 5 to 17 Years | 3 (1.2%) | 0 (0.0%) |
| 18 to 34 Years | 17 (5.5%) | 0 (0.0%) |
| 35 to 64 Years | 80 (10.2%) | 79 (13.5%) |
| 65 to 74 Years | 27 (10.5%) | 13 (2.4%) |
| 75 Years and over | 34 (10.5%) | 10 (6.1%) |
Disability Class: Ambulatory Difficulty
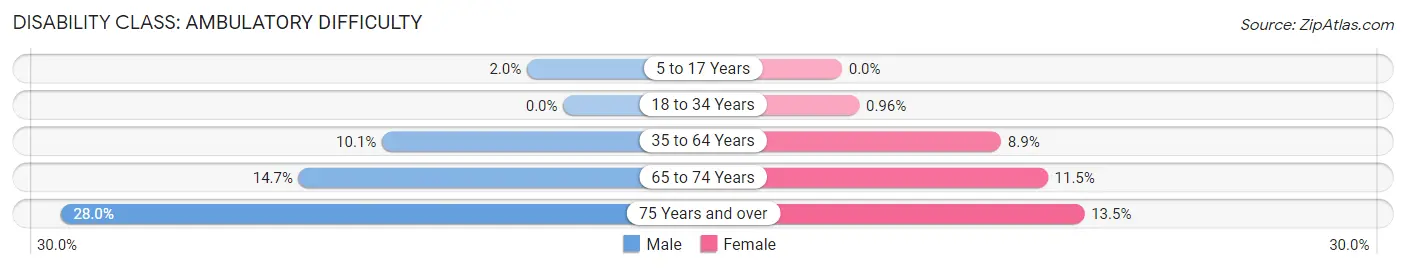
| Age Bracket | Male | Female |
| 5 to 17 Years | 5 (2.0%) | 0 (0.0%) |
| 18 to 34 Years | 0 (0.0%) | 6 (1.0%) |
| 35 to 64 Years | 79 (10.1%) | 52 (8.9%) |
| 65 to 74 Years | 38 (14.7%) | 62 (11.5%) |
| 75 Years and over | 91 (28.0%) | 22 (13.5%) |
Disability Class: Self-Care Difficulty
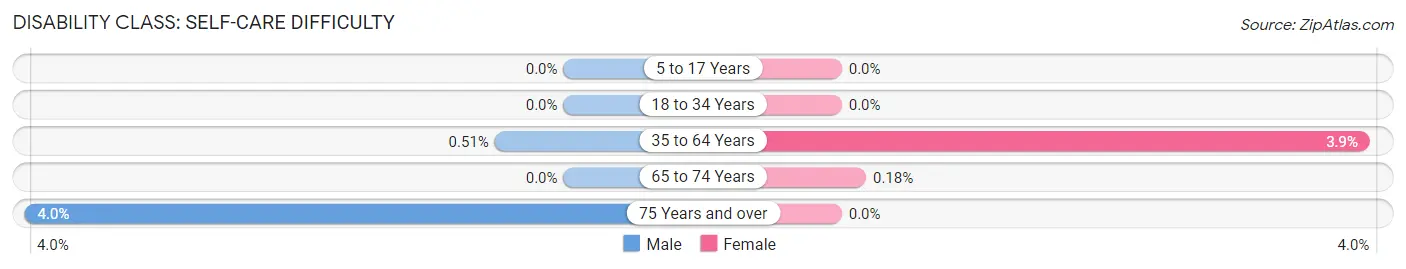
| Age Bracket | Male | Female |
| 5 to 17 Years | 0 (0.0%) | 0 (0.0%) |
| 18 to 34 Years | 0 (0.0%) | 0 (0.0%) |
| 35 to 64 Years | 4 (0.5%) | 23 (3.9%) |
| 65 to 74 Years | 0 (0.0%) | 1 (0.2%) |
| 75 Years and over | 13 (4.0%) | 0 (0.0%) |
Technology Access in Mineral County
Computing Device Access in Mineral County
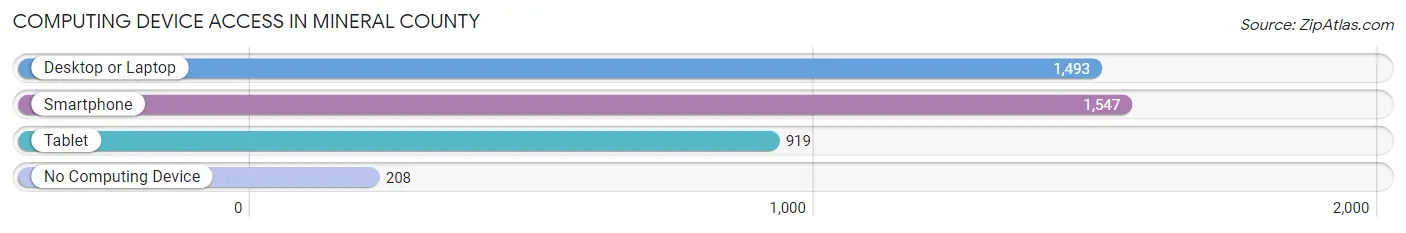
| Device Type | # Households | % Households |
| Desktop or Laptop | 1,493 | 79.4% |
| Smartphone | 1,547 | 82.2% |
| Tablet | 919 | 48.9% |
| No Computing Device | 208 | 11.1% |
| Total | 1,881 | 100.0% |
Internet Access in Mineral County
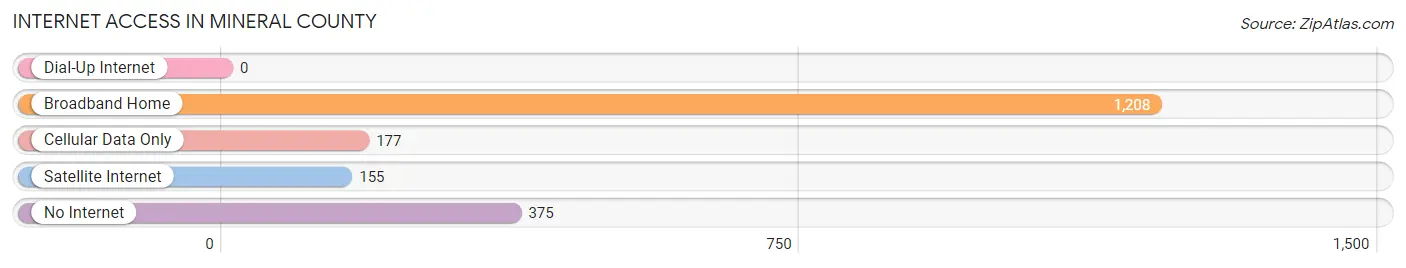
| Internet Type | # Households | % Households |
| Dial-Up Internet | 0 | 0.0% |
| Broadband Home | 1,208 | 64.2% |
| Cellular Data Only | 177 | 9.4% |
| Satellite Internet | 155 | 8.2% |
| No Internet | 375 | 19.9% |
| Total | 1,881 | 100.0% |
Mineral County Summary
Mineral County is a county located in the western part of the U.S. state of Nevada. As of the 2010 census, the population was 4,772, making it the least populous county in Nevada. Its county seat is Hawthorne. The county was established in 1911 and is named after the valuable mineral deposits found in the area.
Geography
Mineral County is located in the western part of Nevada, bordered by Lyon County to the north, Douglas County to the east, Mono County, California to the south, and Esmeralda County to the west. The county covers an area of 2,971 square miles, making it the fifth-largest county in Nevada. The highest point in the county is Mount Grant, which has an elevation of 11,239 feet. The county is mostly mountainous, with the Walker River running through it.
Climate
Mineral County has a semi-arid climate, with hot summers and cold winters. The average annual temperature is 54°F, with an average high of 79°F in July and an average low of 28°F in January. The average annual precipitation is 8.5 inches, with most of it falling in the winter months.
Demographics
As of the 2010 census, there were 4,772 people, 1,845 households, and 1,279 families living in the county. The population density was 2 people per square mile. The racial makeup of the county was 79.3% White, 0.7% African American, 1.3% Native American, 0.4% Asian, 0.1% Pacific Islander, 15.2% from other races, and 3.1% from two or more races. Hispanic or Latino of any race were 24.3% of the population.
The median income for a household in the county was $37,917, and the median income for a family was $45,938. The per capita income for the county was $17,945. About 14.2% of families and 17.7% of the population were below the poverty line, including 22.2% of those under age 18 and 8.2% of those age 65 or over.
Economy
The economy of Mineral County is largely based on mining and agriculture. The county is home to several gold and silver mines, as well as a few copper and lead mines. Agriculture is also important to the county, with hay, alfalfa, and cattle being the main products. Tourism is also an important part of the economy, with many people visiting the area for its natural beauty and outdoor recreation opportunities.
History
Mineral County was created in 1911 from parts of Esmeralda and Lyon counties. The county was named for the valuable mineral deposits found in the area. The county seat was originally located in Hawthorne, but was moved to Mina in 1912. The county seat was moved back to Hawthorne in 1919.
In the early 20th century, the county was home to several mining operations, including the Hawthorne Army Ammunition Plant, which was built in 1942 and operated until the end of World War II. The plant was later used as a storage facility for nuclear weapons.
In the late 20th century, the county experienced a population decline due to the closure of several mines and the decline of the agricultural industry. However, the county has seen a resurgence in recent years due to the growth of tourism and outdoor recreation.
Conclusion
Mineral County is a rural county located in the western part of Nevada. It is home to several gold and silver mines, as well as a few copper and lead mines. Agriculture is also important to the county, with hay, alfalfa, and cattle being the main products. Tourism is also an important part of the economy, with many people visiting the area for its natural beauty and outdoor recreation opportunities. The county has a semi-arid climate, with hot summers and cold winters. As of the 2010 census, the population was 4,772, making it the least populous county in Nevada.
Common Questions
What is Per Capita Income in Mineral County?
Per Capita income in Mineral County is $26,662.
What is the Median Family Income in Mineral County?
Median Family Income in Mineral County is $57,417.
What is the Median Household income in Mineral County?
Median Household Income in Mineral County is $46,625.
What is Income or Wage Gap in Mineral County?
Income or Wage Gap in Mineral County is 41.5%.
Women in Mineral County earn 58.5 cents for every dollar earned by a man.
What is Family Income Deficit in Mineral County?
Family Income Deficit in Mineral County is $8,753.
Families that are below poverty line in Mineral County earn $8,753 less on average than the poverty threshold level.
What is Inequality or Gini Index in Mineral County?
Inequality or Gini Index in Mineral County is 0.44.
What is the Total Population of Mineral County?
Total Population of Mineral County is 4,568.
What is the Total Male Population of Mineral County?
Total Male Population of Mineral County is 2,124.
What is the Total Female Population of Mineral County?
Total Female Population of Mineral County is 2,444.
What is the Ratio of Males per 100 Females in Mineral County?
There are 86.91 Males per 100 Females in Mineral County.
What is the Ratio of Females per 100 Males in Mineral County?
There are 115.07 Females per 100 Males in Mineral County.
What is the Median Population Age in Mineral County?
Median Population Age in Mineral County is 39.8 Years.
What is the Average Family Size in Mineral County
Average Family Size in Mineral County is 3.1 People.
What is the Average Household Size in Mineral County
Average Household Size in Mineral County is 2.4 People.
How Large is the Labor Force in Mineral County?
There are 1,776 People in the Labor Forcein in Mineral County.
What is the Percentage of People in the Labor Force in Mineral County?
47.5% of People are in the Labor Force in Mineral County.
What is the Unemployment Rate in Mineral County?
Unemployment Rate in Mineral County is 5.8%.