Lyon County, NV Map & Demographics
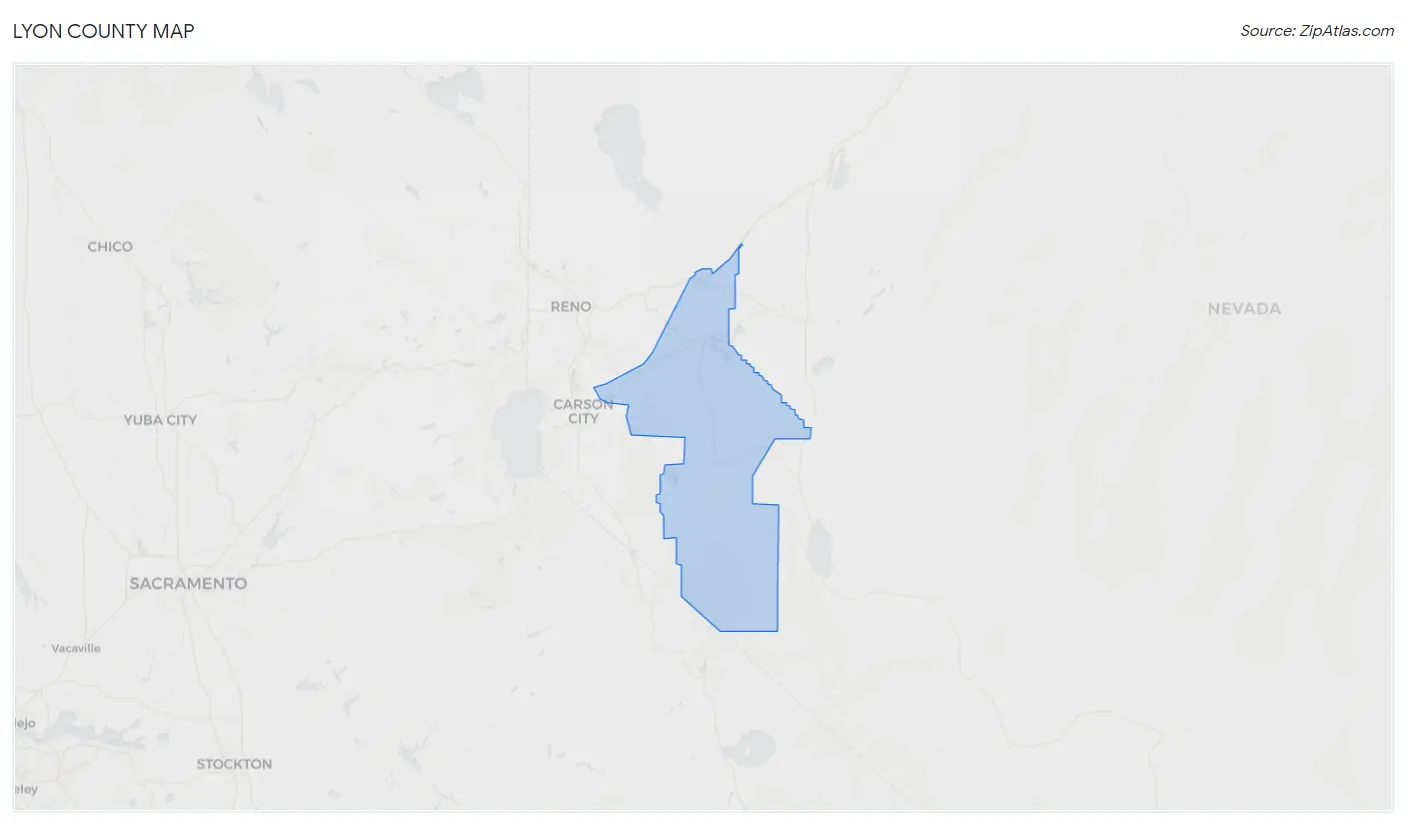
Lyon County Map
Lyon County Overview
$36,330
PER CAPITA INCOME
$84,189
AVG FAMILY INCOME
$70,026
AVG HOUSEHOLD INCOME
34.7%
WAGE / INCOME GAP [ % ]
65.3¢/ $1
WAGE / INCOME GAP [ $ ]
$12,712
FAMILY INCOME DEFICIT
0.42
INEQUALITY / GINI INDEX
59,435
TOTAL POPULATION
30,802
MALE POPULATION
28,633
FEMALE POPULATION
107.58
MALES / 100 FEMALES
92.96
FEMALES / 100 MALES
43.2
MEDIAN AGE
3.1
AVG FAMILY SIZE
2.5
AVG HOUSEHOLD SIZE
28,456
LABOR FORCE [ PEOPLE ]
58.9%
PERCENT IN LABOR FORCE
7.2%
UNEMPLOYMENT RATE
Lyon County Area Codes
Income in Lyon County
Income Overview in Lyon County
Per Capita Income in Lyon County is $36,330, while median incomes of families and households are $84,189 and $70,026 respectively.
| Characteristic | Number | Measure |
| Per Capita Income | 59,435 | $36,330 |
| Median Family Income | 15,503 | $84,189 |
| Mean Family Income | 15,503 | $97,376 |
| Median Household Income | 23,290 | $70,026 |
| Mean Household Income | 23,290 | $88,275 |
| Income Deficit | 15,503 | $12,712 |
| Wage / Income Gap (%) | 59,435 | 34.75% |
| Wage / Income Gap ($) | 59,435 | 65.25¢ per $1 |
| Gini / Inequality Index | 59,435 | 0.42 |
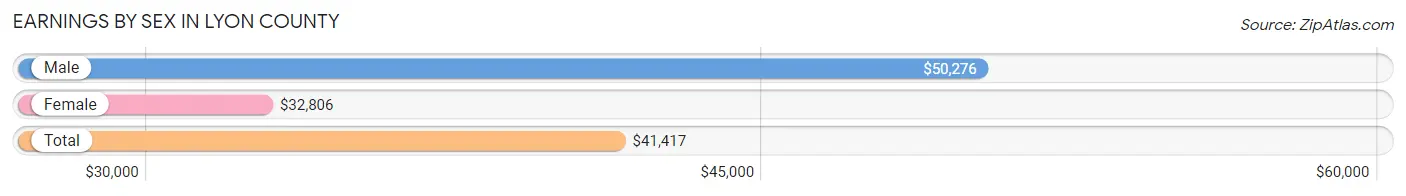
Earnings by Sex in Lyon County
Average Earnings in Lyon County are $41,417, $50,276 for men and $32,806 for women, a difference of 34.7%.
| Sex | Number | Average Earnings |
| Male | 16,330 (55.5%) | $50,276 |
| Female | 13,078 (44.5%) | $32,806 |
| Total | 29,408 (100.0%) | $41,417 |
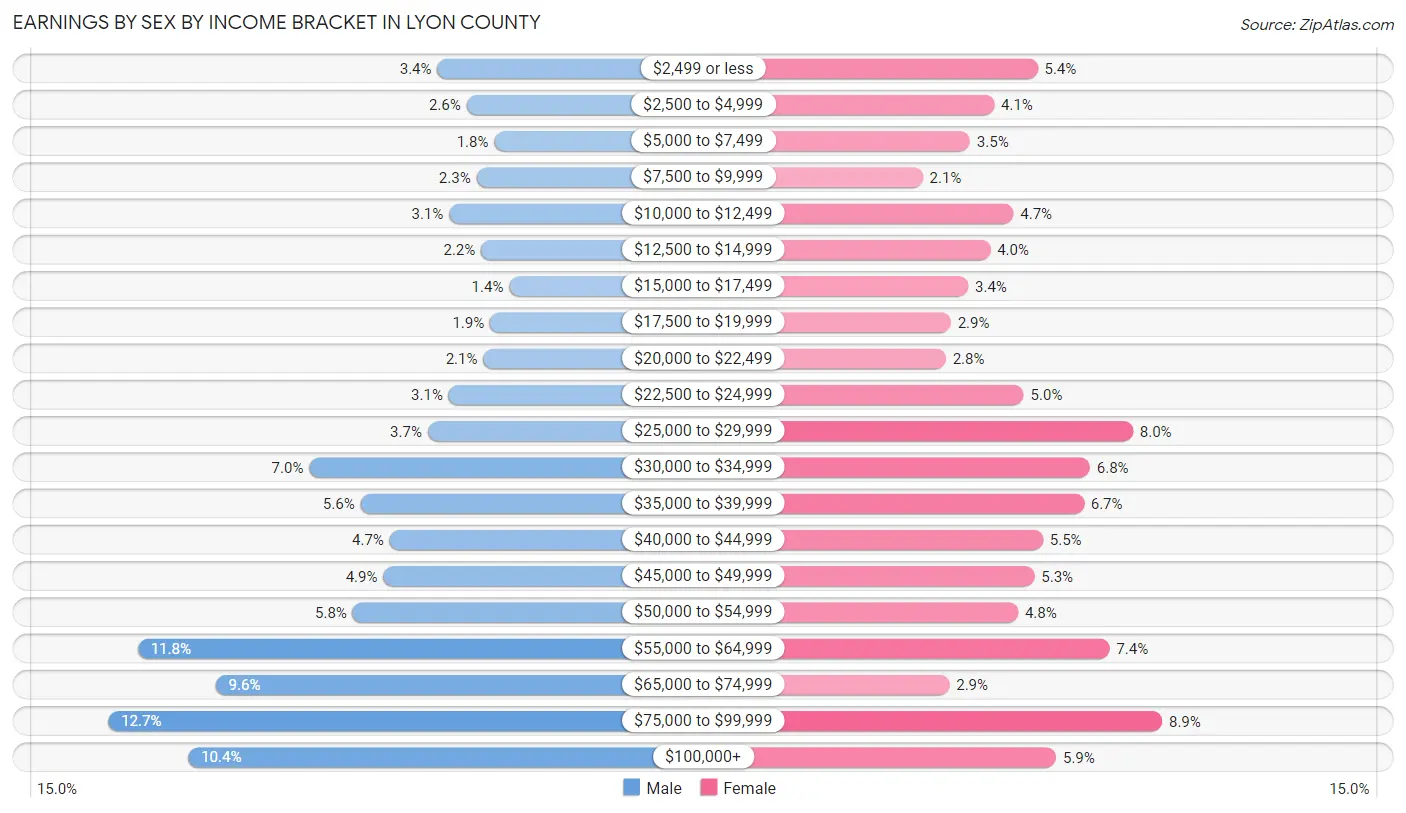
Earnings by Sex by Income Bracket in Lyon County
The most common earnings brackets in Lyon County are $75,000 to $99,999 for men (2,066 | 12.7%) and $75,000 to $99,999 for women (1,159 | 8.9%).
| Income | Male | Female |
| $2,499 or less | 555 (3.4%) | 701 (5.4%) |
| $2,500 to $4,999 | 422 (2.6%) | 542 (4.1%) |
| $5,000 to $7,499 | 294 (1.8%) | 452 (3.5%) |
| $7,500 to $9,999 | 375 (2.3%) | 279 (2.1%) |
| $10,000 to $12,499 | 501 (3.1%) | 612 (4.7%) |
| $12,500 to $14,999 | 354 (2.2%) | 527 (4.0%) |
| $15,000 to $17,499 | 226 (1.4%) | 446 (3.4%) |
| $17,500 to $19,999 | 314 (1.9%) | 382 (2.9%) |
| $20,000 to $22,499 | 345 (2.1%) | 363 (2.8%) |
| $22,500 to $24,999 | 503 (3.1%) | 650 (5.0%) |
| $25,000 to $29,999 | 600 (3.7%) | 1,051 (8.0%) |
| $30,000 to $34,999 | 1,143 (7.0%) | 893 (6.8%) |
| $35,000 to $39,999 | 908 (5.6%) | 871 (6.7%) |
| $40,000 to $44,999 | 774 (4.7%) | 721 (5.5%) |
| $45,000 to $49,999 | 804 (4.9%) | 689 (5.3%) |
| $50,000 to $54,999 | 944 (5.8%) | 629 (4.8%) |
| $55,000 to $64,999 | 1,930 (11.8%) | 965 (7.4%) |
| $65,000 to $74,999 | 1,573 (9.6%) | 377 (2.9%) |
| $75,000 to $99,999 | 2,066 (12.7%) | 1,159 (8.9%) |
| $100,000+ | 1,699 (10.4%) | 769 (5.9%) |
| Total | 16,330 (100.0%) | 13,078 (100.0%) |
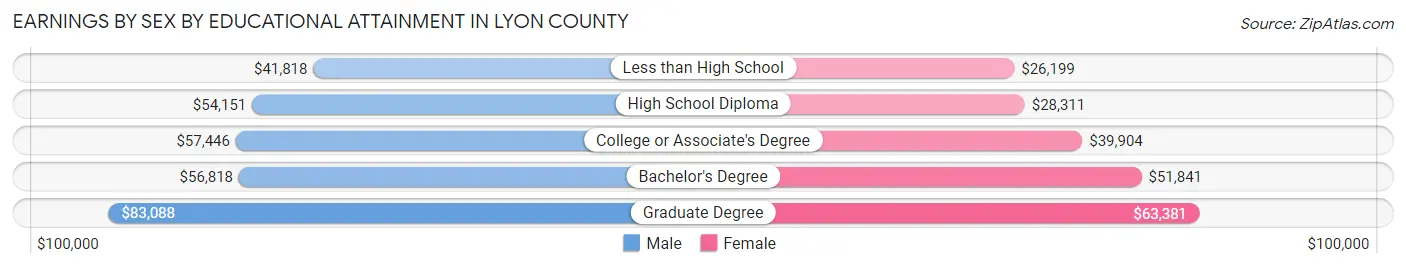
Earnings by Sex by Educational Attainment in Lyon County
Average earnings in Lyon County are $54,672 for men and $36,090 for women, a difference of 34.0%. Men with an educational attainment of graduate degree enjoy the highest average annual earnings of $83,088, while those with less than high school education earn the least with $41,818. Women with an educational attainment of graduate degree earn the most with the average annual earnings of $63,381, while those with less than high school education have the smallest earnings of $26,199.
| Educational Attainment | Male Income | Female Income |
| Less than High School | $41,818 | $26,199 |
| High School Diploma | $54,151 | $28,311 |
| College or Associate's Degree | $57,446 | $39,904 |
| Bachelor's Degree | $56,818 | $51,841 |
| Graduate Degree | $83,088 | $63,381 |
| Total | $54,672 | $36,090 |
Family Income in Lyon County
Family Income Brackets in Lyon County
According to the Lyon County family income data, there are 3,705 families falling into the $100,000 to $149,999 income range, which is the most common income bracket and makes up 23.9% of all families. Conversely, the $15,000 to $24,999 income bracket is the least frequent group with only 310 families (2.0%) belonging to this category.
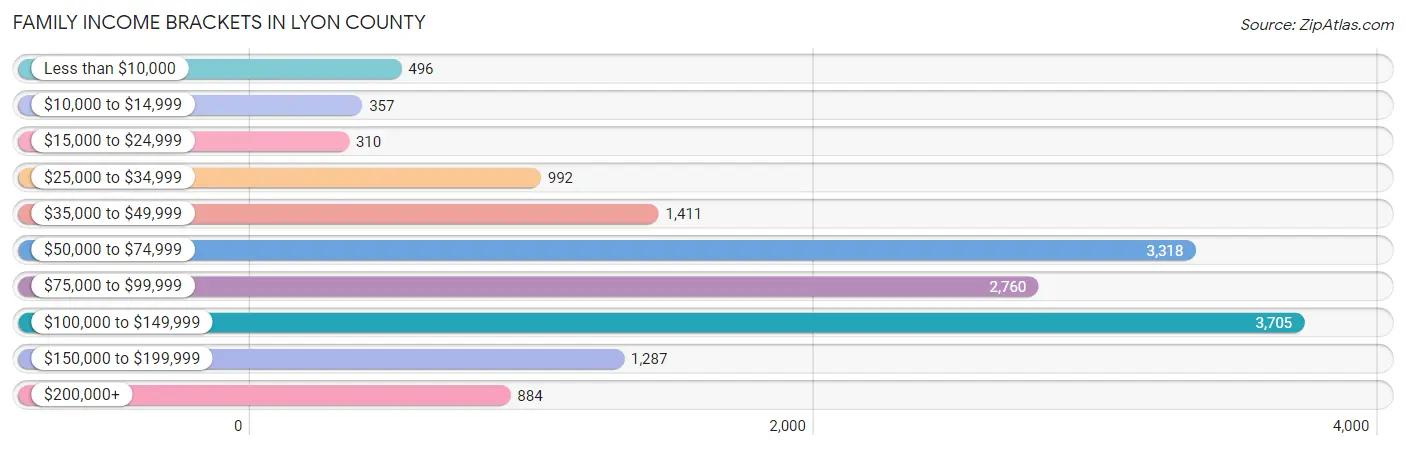
| Income Bracket | # Families | % Families |
| Less than $10,000 | 496 | 3.2% |
| $10,000 to $14,999 | 357 | 2.3% |
| $15,000 to $24,999 | 310 | 2.0% |
| $25,000 to $34,999 | 992 | 6.4% |
| $35,000 to $49,999 | 1,411 | 9.1% |
| $50,000 to $74,999 | 3,318 | 21.4% |
| $75,000 to $99,999 | 2,760 | 17.8% |
| $100,000 to $149,999 | 3,705 | 23.9% |
| $150,000 to $199,999 | 1,287 | 8.3% |
| $200,000+ | 884 | 5.7% |
Family Income by Famaliy Size in Lyon County
6-person families (555 | 3.6%) account for the highest median family income in Lyon County with $103,021 per family, while 2-person families (7,547 | 48.7%) have the highest median income of $37,730 per family member.
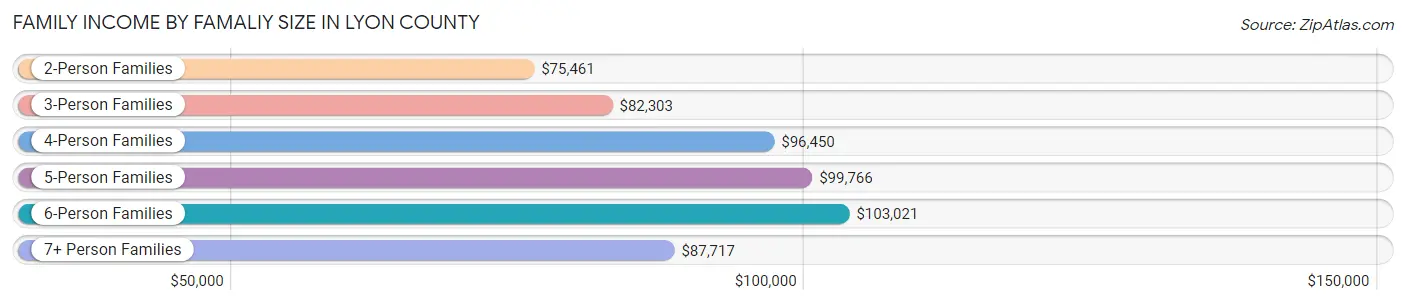
| Income Bracket | # Families | Median Income |
| 2-Person Families | 7,547 (48.7%) | $75,461 |
| 3-Person Families | 3,047 (19.7%) | $82,303 |
| 4-Person Families | 2,819 (18.2%) | $96,450 |
| 5-Person Families | 1,407 (9.1%) | $99,766 |
| 6-Person Families | 555 (3.6%) | $103,021 |
| 7+ Person Families | 128 (0.8%) | $87,717 |
| Total | 15,503 (100.0%) | $84,189 |
Family Income by Number of Earners in Lyon County
The median family income in Lyon County is $84,189, with families comprising 3+ earners (1,513) having the highest median family income of $122,214, while families with no earners (3,161) have the lowest median family income of $56,969, accounting for 9.8% and 20.4% of families, respectively.
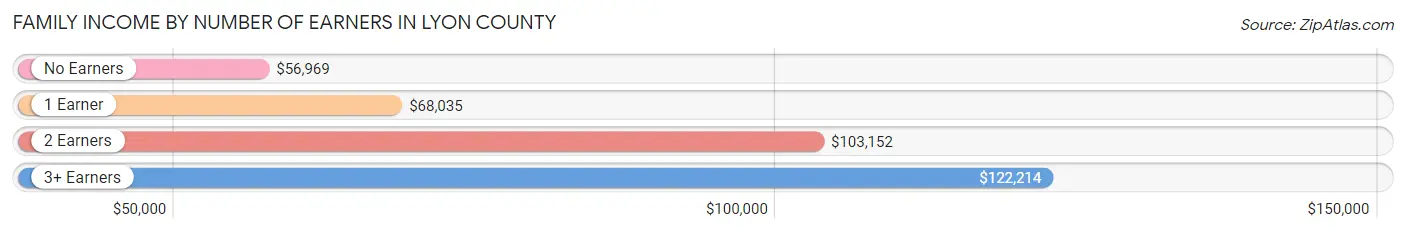
| Number of Earners | # Families | Median Income |
| No Earners | 3,161 (20.4%) | $56,969 |
| 1 Earner | 5,316 (34.3%) | $68,035 |
| 2 Earners | 5,513 (35.6%) | $103,152 |
| 3+ Earners | 1,513 (9.8%) | $122,214 |
| Total | 15,503 (100.0%) | $84,189 |
Household Income in Lyon County
Household Income Brackets in Lyon County
With 4,821 households falling in the category, the $100,000 to $149,999 income range is the most frequent in Lyon County, accounting for 20.7% of all households. In contrast, only 769 households (3.3%) fall into the $10,000 to $14,999 income bracket, making it the least populous group.
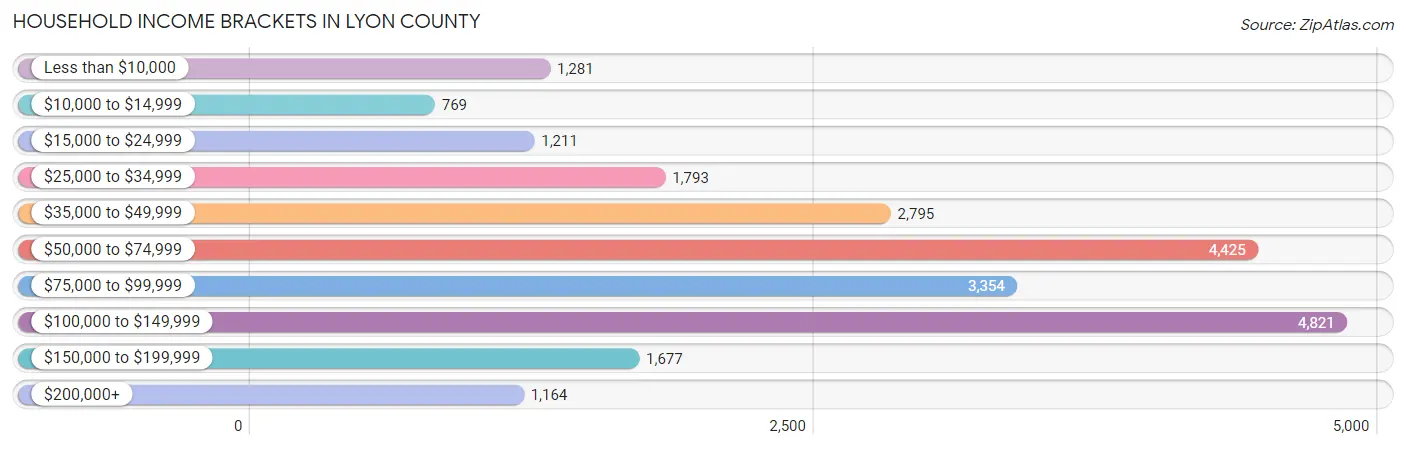
| Income Bracket | # Households | % Households |
| Less than $10,000 | 1,281 | 5.5% |
| $10,000 to $14,999 | 769 | 3.3% |
| $15,000 to $24,999 | 1,211 | 5.2% |
| $25,000 to $34,999 | 1,793 | 7.7% |
| $35,000 to $49,999 | 2,795 | 12.0% |
| $50,000 to $74,999 | 4,425 | 19.0% |
| $75,000 to $99,999 | 3,354 | 14.4% |
| $100,000 to $149,999 | 4,821 | 20.7% |
| $150,000 to $199,999 | 1,677 | 7.2% |
| $200,000+ | 1,164 | 5.0% |
Household Income by Householder Age in Lyon County
The median household income in Lyon County is $70,026, with the highest median household income of $90,000 found in the 25 to 44 years age bracket for the primary householder. A total of 7,186 households (30.8%) fall into this category. Meanwhile, the 15 to 24 years age bracket for the primary householder has the lowest median household income of $47,566, with 594 households (2.5%) in this group.
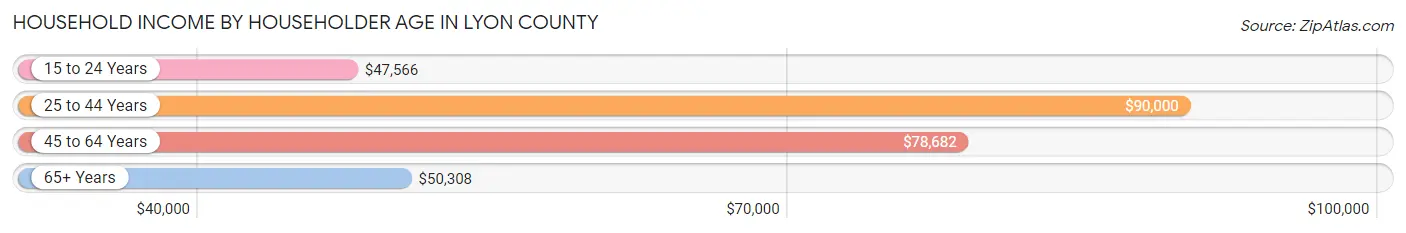
| Income Bracket | # Households | Median Income |
| 15 to 24 Years | 594 (2.5%) | $47,566 |
| 25 to 44 Years | 7,186 (30.8%) | $90,000 |
| 45 to 64 Years | 7,646 (32.8%) | $78,682 |
| 65+ Years | 7,864 (33.8%) | $50,308 |
| Total | 23,290 (100.0%) | $70,026 |
Poverty in Lyon County
Income Below Poverty by Sex and Age in Lyon County
With 9.1% poverty level for males and 11.6% for females among the residents of Lyon County, 6 to 11 year old males and 5 year old females are the most vulnerable to poverty, with 355 males (14.8%) and 102 females (23.5%) in their respective age groups living below the poverty level.
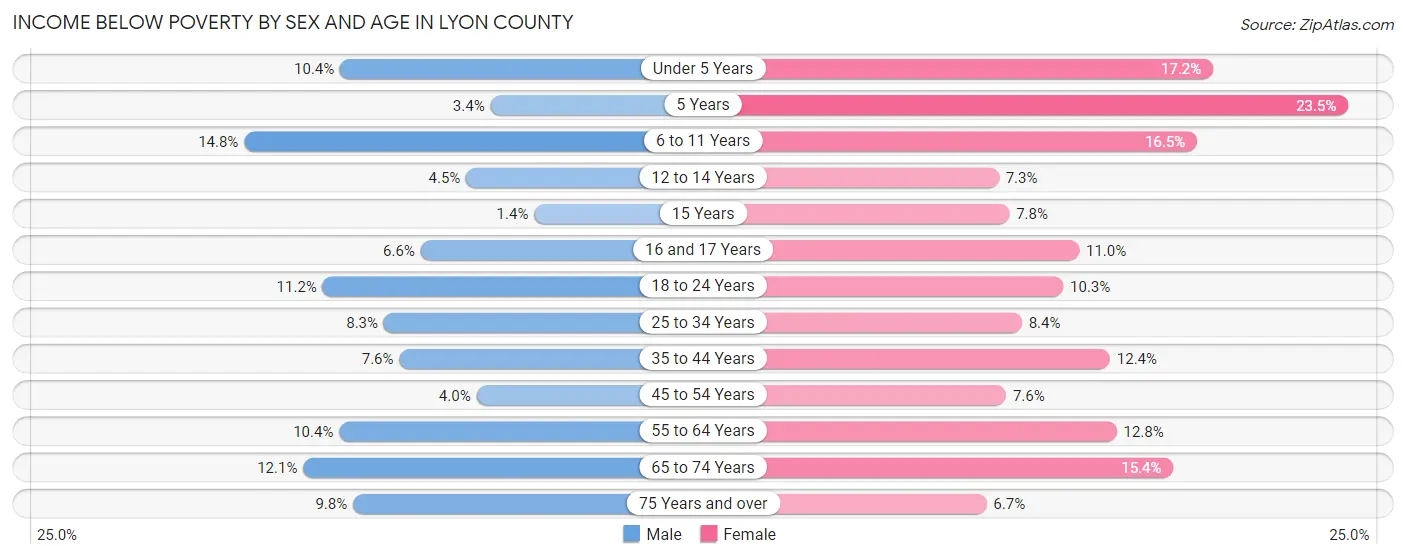
| Age Bracket | Male | Female |
| Under 5 Years | 163 (10.4%) | 261 (17.2%) |
| 5 Years | 11 (3.4%) | 102 (23.5%) |
| 6 to 11 Years | 355 (14.8%) | 314 (16.5%) |
| 12 to 14 Years | 45 (4.5%) | 68 (7.3%) |
| 15 Years | 4 (1.3%) | 40 (7.8%) |
| 16 and 17 Years | 51 (6.6%) | 58 (11.0%) |
| 18 to 24 Years | 223 (11.2%) | 199 (10.3%) |
| 25 to 34 Years | 339 (8.3%) | 293 (8.4%) |
| 35 to 44 Years | 296 (7.6%) | 427 (12.4%) |
| 45 to 54 Years | 143 (4.0%) | 248 (7.6%) |
| 55 to 64 Years | 465 (10.4%) | 533 (12.8%) |
| 65 to 74 Years | 487 (12.1%) | 615 (15.4%) |
| 75 Years and over | 219 (9.8%) | 155 (6.7%) |
| Total | 2,801 (9.1%) | 3,313 (11.6%) |
Income Above Poverty by Sex and Age in Lyon County
According to the poverty statistics in Lyon County, males aged 15 years and females aged 75 years and over are the age groups that are most secure financially, with 98.7% of males and 93.3% of females in these age groups living above the poverty line.
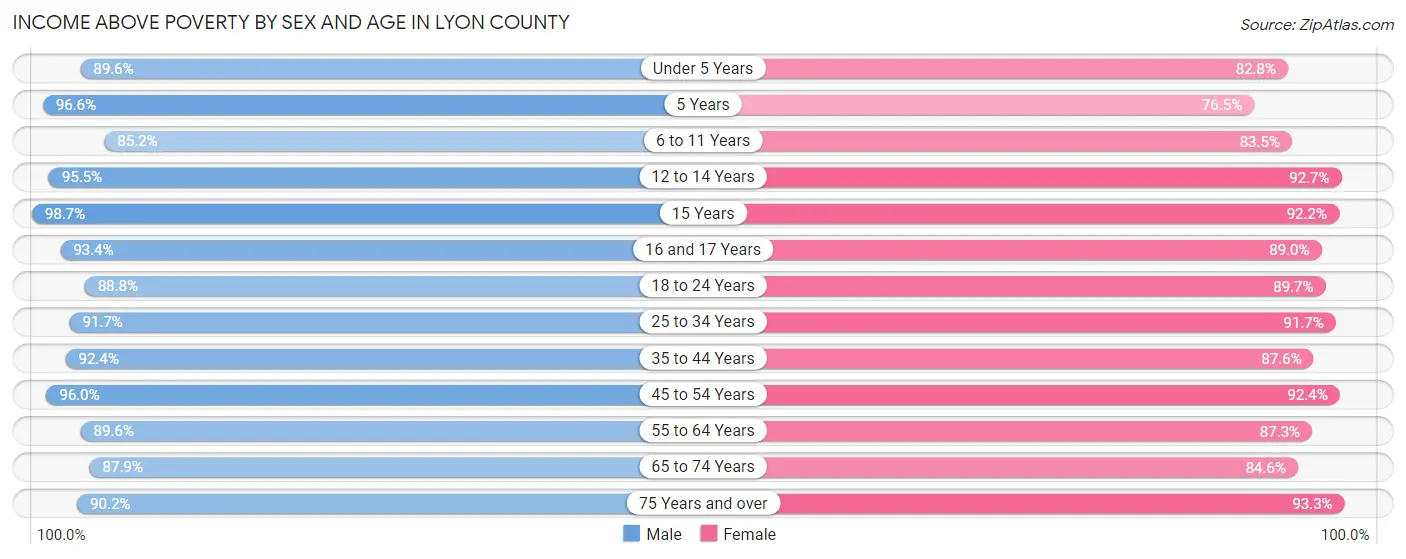
| Age Bracket | Male | Female |
| Under 5 Years | 1,411 (89.6%) | 1,254 (82.8%) |
| 5 Years | 314 (96.6%) | 332 (76.5%) |
| 6 to 11 Years | 2,042 (85.2%) | 1,590 (83.5%) |
| 12 to 14 Years | 952 (95.5%) | 866 (92.7%) |
| 15 Years | 292 (98.7%) | 475 (92.2%) |
| 16 and 17 Years | 719 (93.4%) | 469 (89.0%) |
| 18 to 24 Years | 1,774 (88.8%) | 1,738 (89.7%) |
| 25 to 34 Years | 3,732 (91.7%) | 3,216 (91.6%) |
| 35 to 44 Years | 3,593 (92.4%) | 3,006 (87.6%) |
| 45 to 54 Years | 3,407 (96.0%) | 3,008 (92.4%) |
| 55 to 64 Years | 4,007 (89.6%) | 3,646 (87.3%) |
| 65 to 74 Years | 3,547 (87.9%) | 3,385 (84.6%) |
| 75 Years and over | 2,026 (90.2%) | 2,155 (93.3%) |
| Total | 27,816 (90.8%) | 25,140 (88.4%) |
Income Below Poverty Among Married-Couple Families in Lyon County
The poverty statistics for married-couple families in Lyon County show that 4.5% or 527 of the total 11,730 families live below the poverty line. Families with 5 or more children have the highest poverty rate of 27.5%, comprising of 14 families. On the other hand, families with 1 or 2 children have the lowest poverty rate of 2.1%, which includes 75 families.
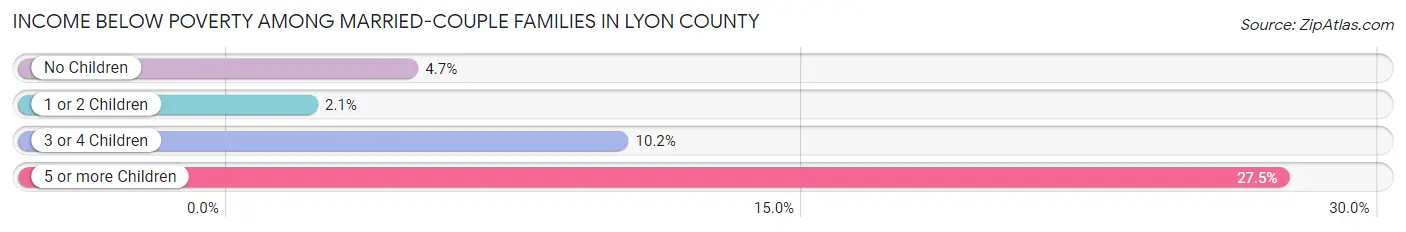
| Children | Above Poverty | Below Poverty |
| No Children | 6,720 (95.3%) | 332 (4.7%) |
| 1 or 2 Children | 3,513 (97.9%) | 75 (2.1%) |
| 3 or 4 Children | 933 (89.8%) | 106 (10.2%) |
| 5 or more Children | 37 (72.6%) | 14 (27.5%) |
| Total | 11,203 (95.5%) | 527 (4.5%) |
Income Below Poverty Among Single-Parent Households in Lyon County
According to the poverty data in Lyon County, 16.9% or 254 single-father households and 16.2% or 367 single-mother households are living below the poverty line. Among single-father households, those with 5 or more children have the highest poverty rate, with 47 households (67.1%) experiencing poverty. Likewise, among single-mother households, those with 3 or 4 children have the highest poverty rate, with 111 households (39.4%) falling below the poverty line.
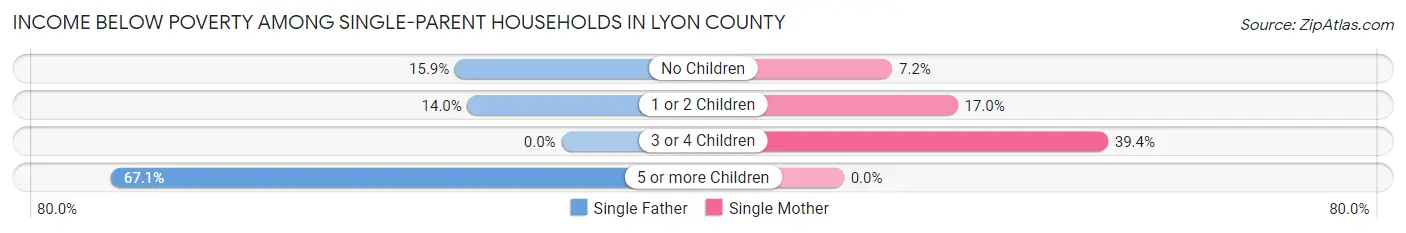
| Children | Single Father | Single Mother |
| No Children | 107 (15.9%) | 60 (7.2%) |
| 1 or 2 Children | 100 (14.0%) | 196 (17.0%) |
| 3 or 4 Children | 0 (0.0%) | 111 (39.4%) |
| 5 or more Children | 47 (67.1%) | 0 (0.0%) |
| Total | 254 (16.9%) | 367 (16.2%) |
Income Below Poverty Among Married-Couple vs Single-Parent Households in Lyon County
The poverty data for Lyon County shows that 527 of the married-couple family households (4.5%) and 621 of the single-parent households (16.5%) are living below the poverty level. Within the married-couple family households, those with 5 or more children have the highest poverty rate, with 14 households (27.5%) falling below the poverty line. Among the single-parent households, those with 5 or more children have the highest poverty rate, with 47 household (67.1%) living below poverty.
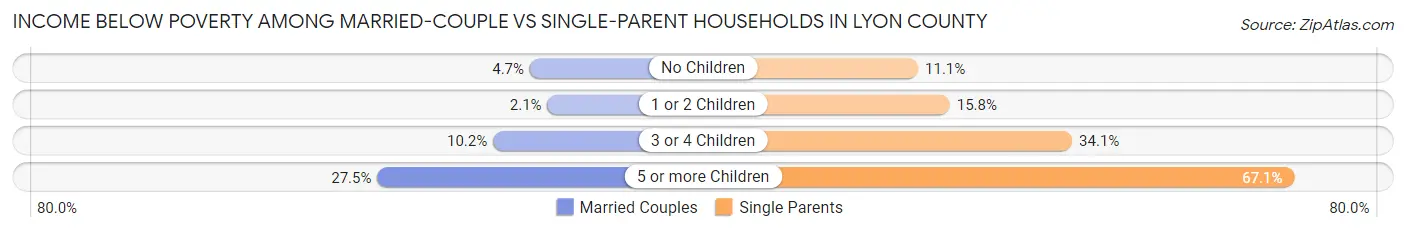
| Children | Married-Couple Families | Single-Parent Households |
| No Children | 332 (4.7%) | 167 (11.1%) |
| 1 or 2 Children | 75 (2.1%) | 296 (15.8%) |
| 3 or 4 Children | 106 (10.2%) | 111 (34.1%) |
| 5 or more Children | 14 (27.5%) | 47 (67.1%) |
| Total | 527 (4.5%) | 621 (16.5%) |
Race in Lyon County
The most populous races in Lyon County are White / Caucasian (46,703 | 78.6%), Hispanic or Latino (11,216 | 18.9%), and Two or more Races (5,901 | 9.9%).
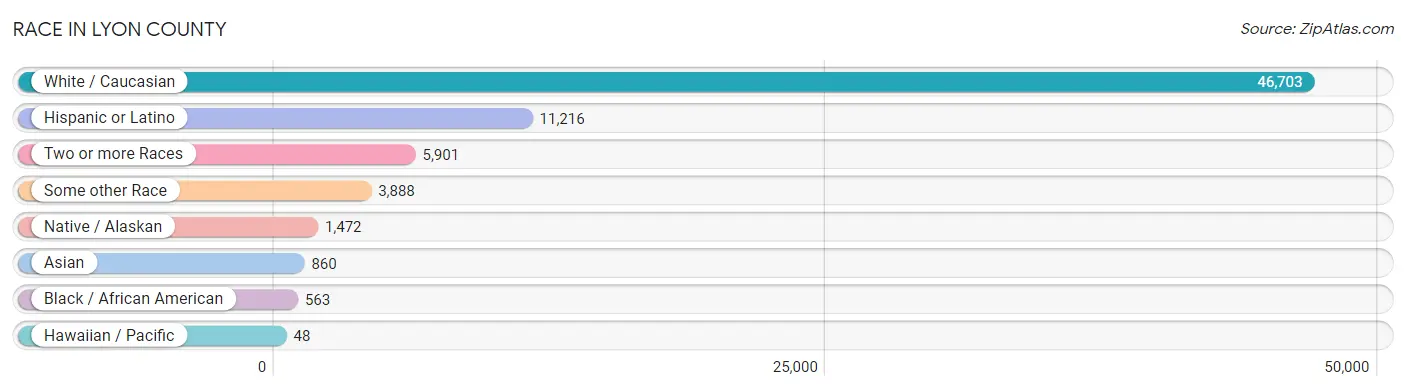
| Race | # Population | % Population |
| Asian | 860 | 1.5% |
| Black / African American | 563 | 0.9% |
| Hawaiian / Pacific | 48 | 0.1% |
| Hispanic or Latino | 11,216 | 18.9% |
| Native / Alaskan | 1,472 | 2.5% |
| White / Caucasian | 46,703 | 78.6% |
| Two or more Races | 5,901 | 9.9% |
| Some other Race | 3,888 | 6.5% |
| Total | 59,435 | 100.0% |
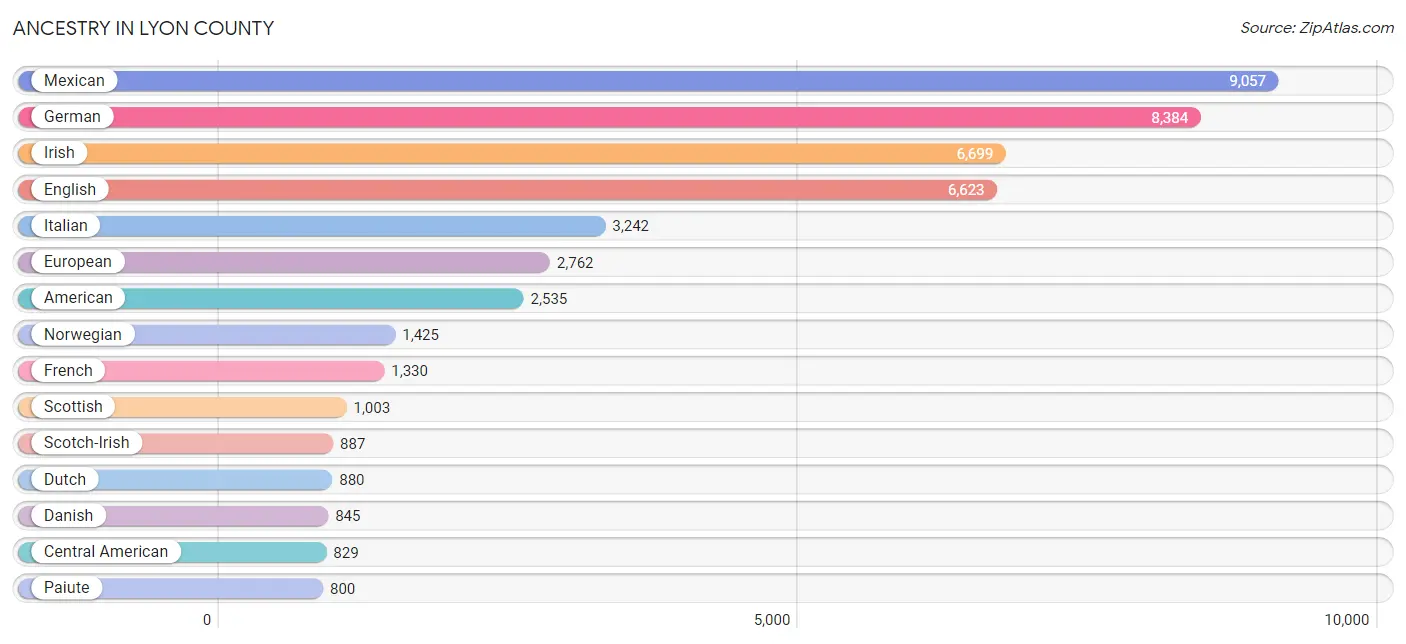
Ancestry in Lyon County
The most populous ancestries reported in Lyon County are Mexican (9,057 | 15.2%), German (8,384 | 14.1%), Irish (6,699 | 11.3%), English (6,623 | 11.1%), and Italian (3,242 | 5.4%), together accounting for 57.2% of all Lyon County residents.
| Ancestry | # Population | % Population |
| African | 28 | 0.1% |
| Alaska Native | 11 | 0.0% |
| Alaskan Athabascan | 103 | 0.2% |
| Alsatian | 8 | 0.0% |
| American | 2,535 | 4.3% |
| Apache | 15 | 0.0% |
| Arab | 69 | 0.1% |
| Argentinean | 30 | 0.1% |
| Austrian | 84 | 0.1% |
| Basque | 28 | 0.1% |
| Belgian | 50 | 0.1% |
| Belizean | 7 | 0.0% |
| Bhutanese | 195 | 0.3% |
| Blackfeet | 15 | 0.0% |
| British | 227 | 0.4% |
| Burmese | 246 | 0.4% |
| Cambodian | 23 | 0.0% |
| Canadian | 208 | 0.4% |
| Central American | 829 | 1.4% |
| Central American Indian | 140 | 0.2% |
| Cherokee | 239 | 0.4% |
| Chickasaw | 221 | 0.4% |
| Chippewa | 36 | 0.1% |
| Choctaw | 179 | 0.3% |
| Colombian | 29 | 0.1% |
| Comanche | 3 | 0.0% |
| Cuban | 286 | 0.5% |
| Czech | 139 | 0.2% |
| Czechoslovakian | 46 | 0.1% |
| Danish | 845 | 1.4% |
| Delaware | 53 | 0.1% |
| Dominican | 48 | 0.1% |
| Dutch | 880 | 1.5% |
| Eastern European | 188 | 0.3% |
| English | 6,623 | 11.1% |
| Estonian | 60 | 0.1% |
| European | 2,762 | 4.6% |
| Finnish | 141 | 0.2% |
| French | 1,330 | 2.2% |
| French Canadian | 231 | 0.4% |
| German | 8,384 | 14.1% |
| Greek | 107 | 0.2% |
| Guamanian / Chamorro | 13 | 0.0% |
| Guatemalan | 280 | 0.5% |
| Hungarian | 119 | 0.2% |
| Indian (Asian) | 325 | 0.5% |
| Iranian | 23 | 0.0% |
| Irish | 6,699 | 11.3% |
| Iroquois | 10 | 0.0% |
| Italian | 3,242 | 5.4% |
| Jamaican | 46 | 0.1% |
| Korean | 738 | 1.2% |
| Laotian | 11 | 0.0% |
| Latvian | 8 | 0.0% |
| Lebanese | 40 | 0.1% |
| Lithuanian | 12 | 0.0% |
| Mexican | 9,057 | 15.2% |
| Mexican American Indian | 119 | 0.2% |
| Native Hawaiian | 143 | 0.2% |
| Navajo | 62 | 0.1% |
| Nicaraguan | 146 | 0.3% |
| Northern European | 78 | 0.1% |
| Norwegian | 1,425 | 2.4% |
| Paiute | 800 | 1.3% |
| Pakistani | 2 | 0.0% |
| Peruvian | 50 | 0.1% |
| Polish | 696 | 1.2% |
| Portuguese | 577 | 1.0% |
| Puerto Rican | 228 | 0.4% |
| Russian | 580 | 1.0% |
| Salvadoran | 377 | 0.6% |
| Samoan | 38 | 0.1% |
| Scandinavian | 358 | 0.6% |
| Scotch-Irish | 887 | 1.5% |
| Scottish | 1,003 | 1.7% |
| Shoshone | 121 | 0.2% |
| Sioux | 145 | 0.2% |
| Slavic | 7 | 0.0% |
| Slovak | 41 | 0.1% |
| Slovene | 14 | 0.0% |
| South American | 109 | 0.2% |
| Spaniard | 249 | 0.4% |
| Spanish | 274 | 0.5% |
| Spanish American | 11 | 0.0% |
| Sri Lankan | 19 | 0.0% |
| Subsaharan African | 28 | 0.1% |
| Swedish | 697 | 1.2% |
| Swiss | 202 | 0.3% |
| Thai | 36 | 0.1% |
| Tlingit-Haida | 28 | 0.1% |
| Tongan | 10 | 0.0% |
| Ukrainian | 22 | 0.0% |
| Welsh | 330 | 0.6% |
| Yugoslavian | 174 | 0.3% | View All 94 Rows |
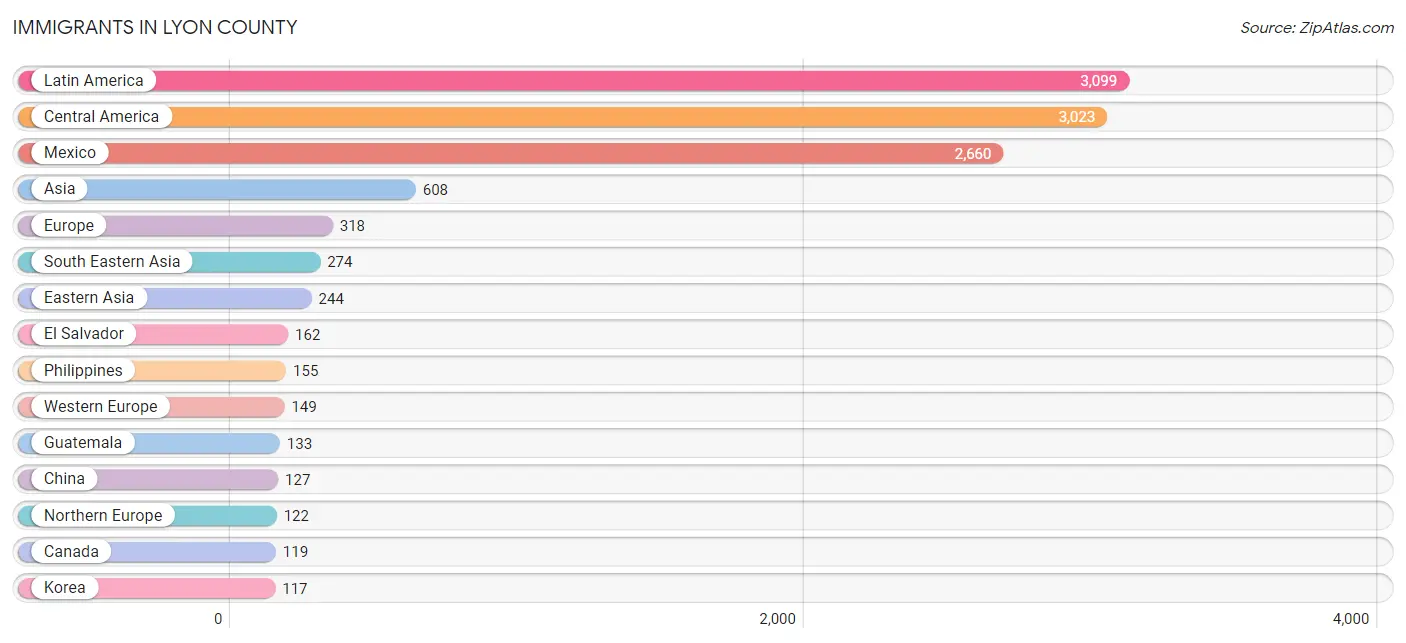
Immigrants in Lyon County
The most numerous immigrant groups reported in Lyon County came from Latin America (3,099 | 5.2%), Central America (3,023 | 5.1%), Mexico (2,660 | 4.5%), Asia (608 | 1.0%), and Europe (318 | 0.5%), together accounting for 16.3% of all Lyon County residents.
| Immigration Origin | # Population | % Population |
| Africa | 11 | 0.0% |
| Armenia | 13 | 0.0% |
| Asia | 608 | 1.0% |
| Belarus | 11 | 0.0% |
| Canada | 119 | 0.2% |
| Central America | 3,023 | 5.1% |
| China | 127 | 0.2% |
| Colombia | 14 | 0.0% |
| Czechoslovakia | 14 | 0.0% |
| Eastern Africa | 6 | 0.0% |
| Eastern Asia | 244 | 0.4% |
| Eastern Europe | 47 | 0.1% |
| Egypt | 5 | 0.0% |
| El Salvador | 162 | 0.3% |
| England | 54 | 0.1% |
| Europe | 318 | 0.5% |
| France | 29 | 0.1% |
| Germany | 107 | 0.2% |
| Guatemala | 133 | 0.2% |
| Hong Kong | 22 | 0.0% |
| India | 18 | 0.0% |
| Indonesia | 11 | 0.0% |
| Iran | 23 | 0.0% |
| Korea | 117 | 0.2% |
| Latin America | 3,099 | 5.2% |
| Malaysia | 43 | 0.1% |
| Mexico | 2,660 | 4.5% |
| Netherlands | 6 | 0.0% |
| Nicaragua | 68 | 0.1% |
| Northern Africa | 5 | 0.0% |
| Northern Europe | 122 | 0.2% |
| Norway | 22 | 0.0% |
| Pakistan | 36 | 0.1% |
| Peru | 62 | 0.1% |
| Philippines | 155 | 0.3% |
| Poland | 22 | 0.0% |
| South America | 76 | 0.1% |
| South Central Asia | 77 | 0.1% |
| South Eastern Asia | 274 | 0.5% |
| Switzerland | 7 | 0.0% |
| Taiwan | 23 | 0.0% |
| Thailand | 1 | 0.0% |
| Vietnam | 64 | 0.1% |
| Western Asia | 13 | 0.0% |
| Western Europe | 149 | 0.3% | View All 45 Rows |
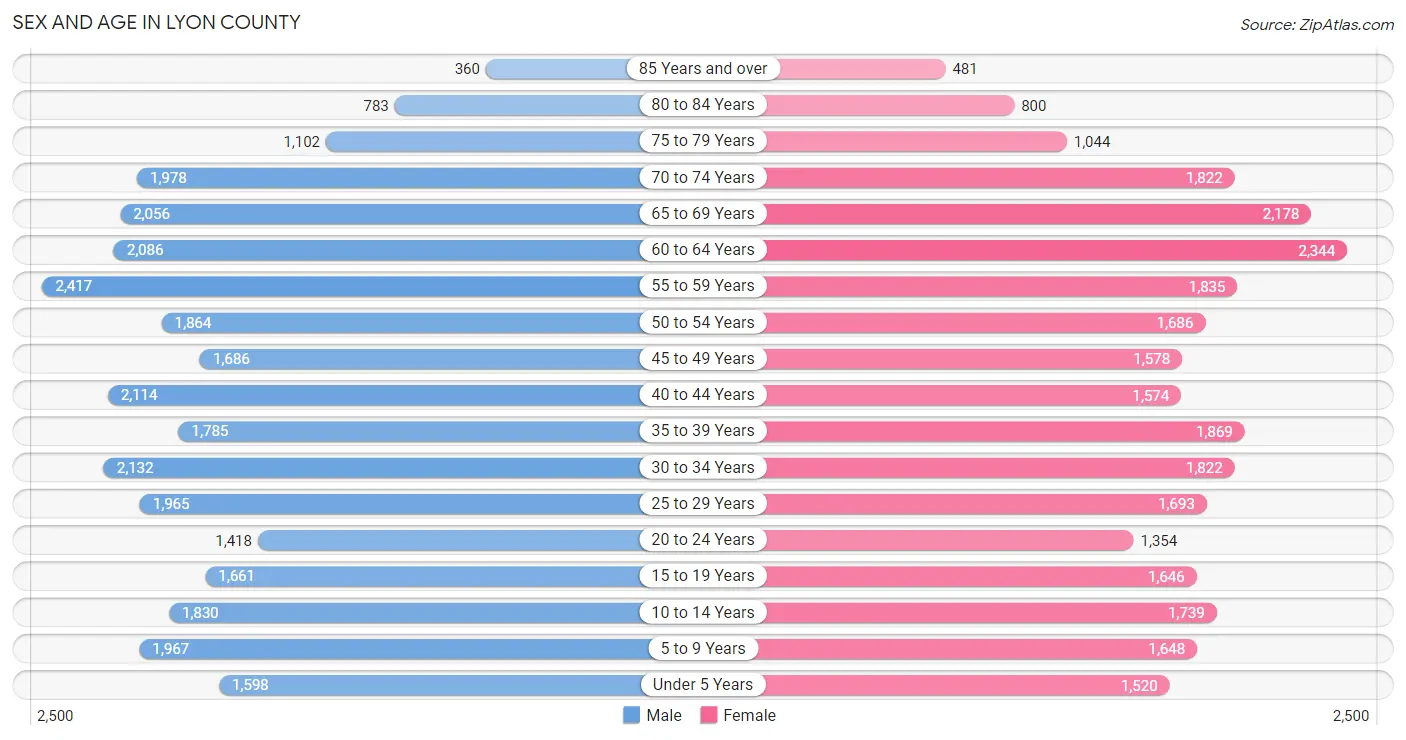
Sex and Age in Lyon County
Sex and Age in Lyon County
The most populous age groups in Lyon County are 55 to 59 Years (2,417 | 7.9%) for men and 60 to 64 Years (2,344 | 8.2%) for women.
| Age Bracket | Male | Female |
| Under 5 Years | 1,598 (5.2%) | 1,520 (5.3%) |
| 5 to 9 Years | 1,967 (6.4%) | 1,648 (5.8%) |
| 10 to 14 Years | 1,830 (5.9%) | 1,739 (6.1%) |
| 15 to 19 Years | 1,661 (5.4%) | 1,646 (5.8%) |
| 20 to 24 Years | 1,418 (4.6%) | 1,354 (4.7%) |
| 25 to 29 Years | 1,965 (6.4%) | 1,693 (5.9%) |
| 30 to 34 Years | 2,132 (6.9%) | 1,822 (6.4%) |
| 35 to 39 Years | 1,785 (5.8%) | 1,869 (6.5%) |
| 40 to 44 Years | 2,114 (6.9%) | 1,574 (5.5%) |
| 45 to 49 Years | 1,686 (5.5%) | 1,578 (5.5%) |
| 50 to 54 Years | 1,864 (6.0%) | 1,686 (5.9%) |
| 55 to 59 Years | 2,417 (7.9%) | 1,835 (6.4%) |
| 60 to 64 Years | 2,086 (6.8%) | 2,344 (8.2%) |
| 65 to 69 Years | 2,056 (6.7%) | 2,178 (7.6%) |
| 70 to 74 Years | 1,978 (6.4%) | 1,822 (6.4%) |
| 75 to 79 Years | 1,102 (3.6%) | 1,044 (3.6%) |
| 80 to 84 Years | 783 (2.5%) | 800 (2.8%) |
| 85 Years and over | 360 (1.2%) | 481 (1.7%) |
| Total | 30,802 (100.0%) | 28,633 (100.0%) |
Families and Households in Lyon County
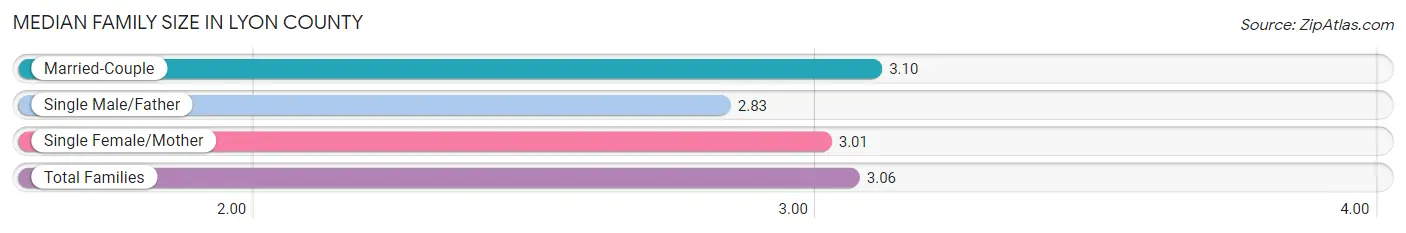
Median Family Size in Lyon County
The median family size in Lyon County is 3.06 persons per family, with married-couple families (11,730 | 75.7%) accounting for the largest median family size of 3.1 persons per family. On the other hand, single male/father families (1,504 | 9.7%) represent the smallest median family size with 2.83 persons per family.
| Family Type | # Families | Family Size |
| Married-Couple | 11,730 (75.7%) | 3.10 |
| Single Male/Father | 1,504 (9.7%) | 2.83 |
| Single Female/Mother | 2,269 (14.6%) | 3.01 |
| Total Families | 15,503 (100.0%) | 3.06 |
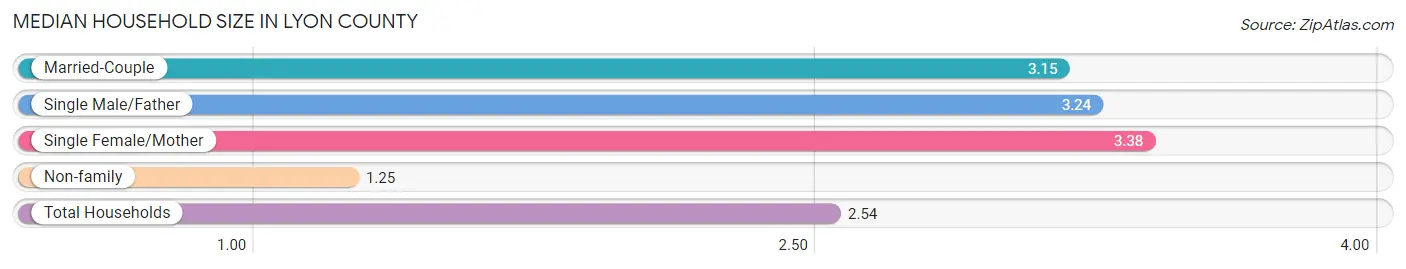
Median Household Size in Lyon County
The median household size in Lyon County is 2.54 persons per household, with single female/mother households (2,269 | 9.7%) accounting for the largest median household size of 3.38 persons per household. non-family households (7,787 | 33.4%) represent the smallest median household size with 1.25 persons per household.
| Household Type | # Households | Household Size |
| Married-Couple | 11,730 (50.4%) | 3.15 |
| Single Male/Father | 1,504 (6.5%) | 3.24 |
| Single Female/Mother | 2,269 (9.7%) | 3.38 |
| Non-family | 7,787 (33.4%) | 1.25 |
| Total Households | 23,290 (100.0%) | 2.54 |
Household Size by Marriage Status in Lyon County
Out of a total of 23,290 households in Lyon County, 15,503 (66.6%) are family households, while 7,787 (33.4%) are nonfamily households. The most numerous type of family households are 2-person households, comprising 7,014, and the most common type of nonfamily households are 1-person households, comprising 6,030.
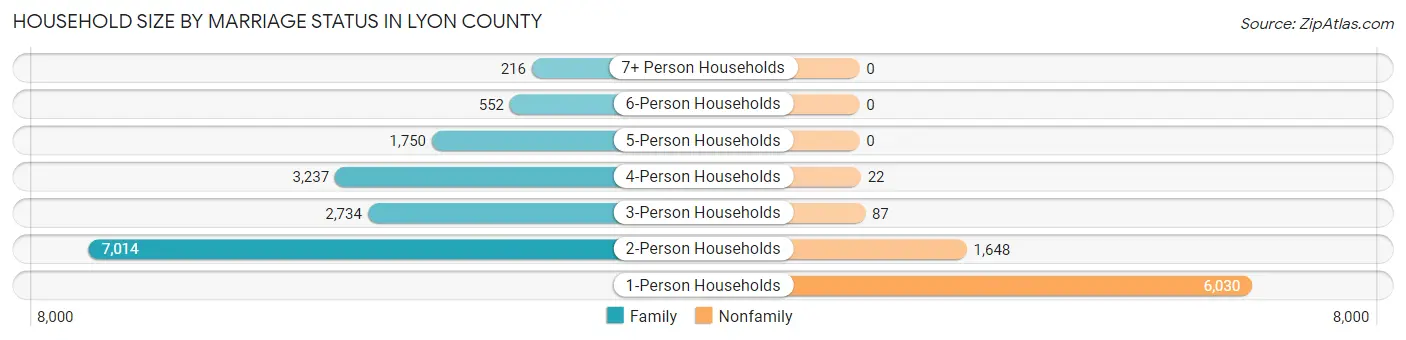
| Household Size | Family Households | Nonfamily Households |
| 1-Person Households | - | 6,030 (25.9%) |
| 2-Person Households | 7,014 (30.1%) | 1,648 (7.1%) |
| 3-Person Households | 2,734 (11.7%) | 87 (0.4%) |
| 4-Person Households | 3,237 (13.9%) | 22 (0.1%) |
| 5-Person Households | 1,750 (7.5%) | 0 (0.0%) |
| 6-Person Households | 552 (2.4%) | 0 (0.0%) |
| 7+ Person Households | 216 (0.9%) | 0 (0.0%) |
| Total | 15,503 (66.6%) | 7,787 (33.4%) |
Female Fertility in Lyon County
Fertility by Age in Lyon County
Average fertility rate in Lyon County is 88.0 births per 1,000 women. Women in the age bracket of 20 to 34 years have the highest fertility rate with 155.0 births per 1,000 women. Women in the age bracket of 20 to 34 years acount for 72.7% of all women with births.
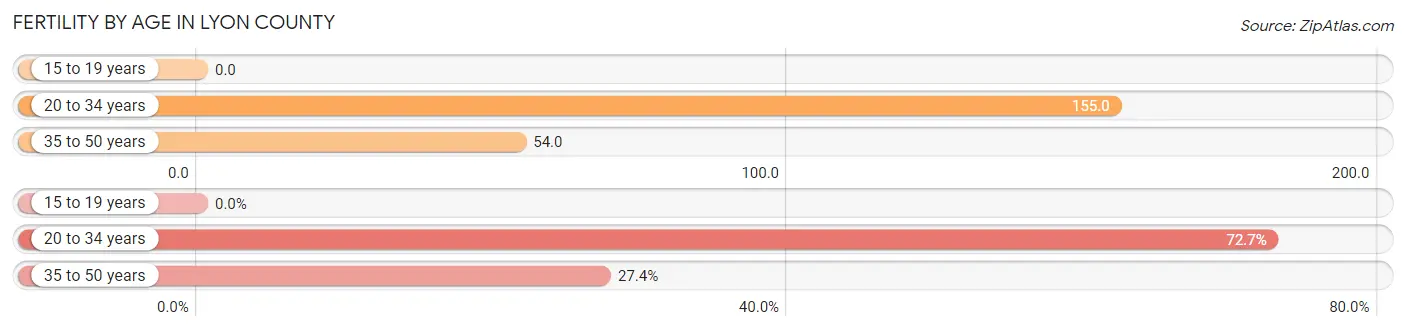
| Age Bracket | Women with Births | Births / 1,000 Women |
| 15 to 19 years | 0 (0.0%) | 0.0 |
| 20 to 34 years | 757 (72.7%) | 155.0 |
| 35 to 50 years | 285 (27.4%) | 54.0 |
| Total | 1,042 (100.0%) | 88.0 |
Fertility by Age by Marriage Status in Lyon County
68.3% of women with births (1,042) in Lyon County are married. The highest percentage of unmarried women with births falls into 20 to 34 years age bracket with 35.0% of them unmarried at the time of birth, while the lowest percentage of unmarried women with births belong to 35 to 50 years age bracket with 22.8% of them unmarried.
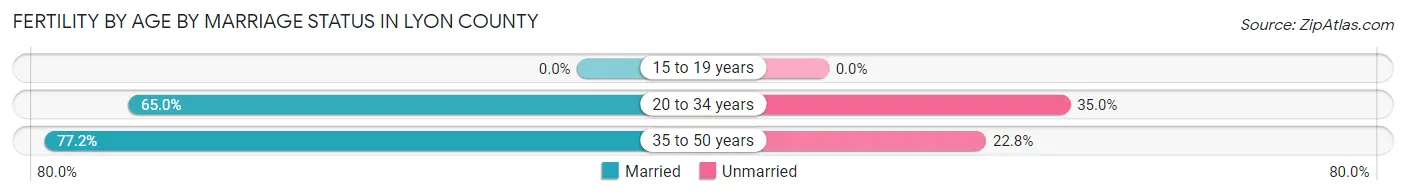
| Age Bracket | Married | Unmarried |
| 15 to 19 years | 0 (0.0%) | 0 (0.0%) |
| 20 to 34 years | 492 (65.0%) | 265 (35.0%) |
| 35 to 50 years | 220 (77.2%) | 65 (22.8%) |
| Total | 712 (68.3%) | 330 (31.7%) |
Fertility by Education in Lyon County
Average fertility rate in Lyon County is 88.0 births per 1,000 women. Women with the education attainment of high school diploma have the highest fertility rate of 113.0 births per 1,000 women, while women with the education attainment of graduate degree have the lowest fertility at 37.0 births per 1,000 women. Women with the education attainment of high school diploma represent 41.0% of all women with births.
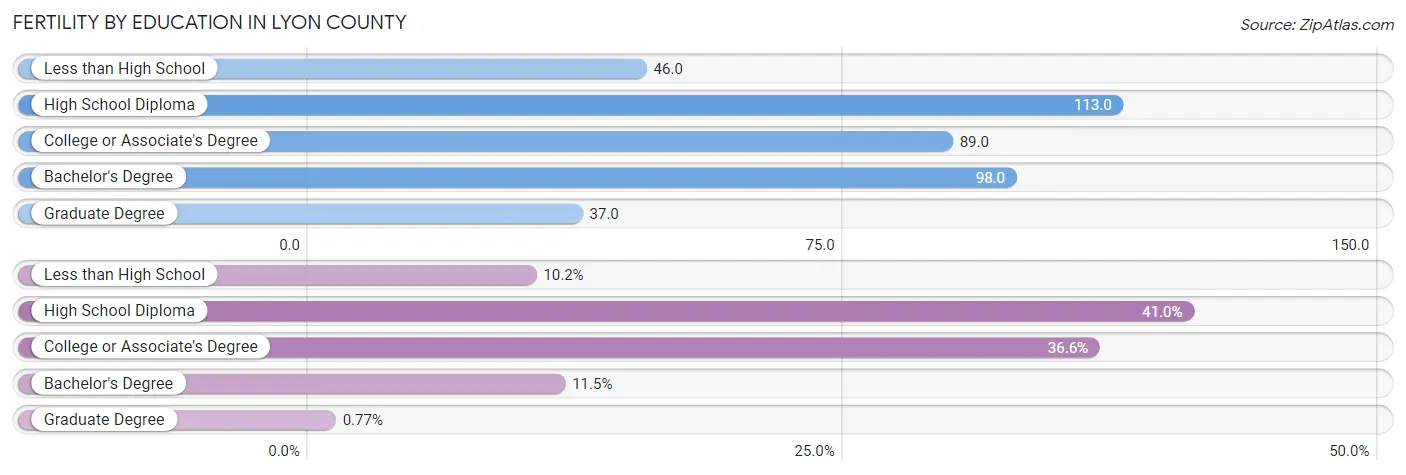
| Educational Attainment | Women with Births | Births / 1,000 Women |
| Less than High School | 106 (10.2%) | 46.0 |
| High School Diploma | 427 (41.0%) | 113.0 |
| College or Associate's Degree | 381 (36.6%) | 89.0 |
| Bachelor's Degree | 120 (11.5%) | 98.0 |
| Graduate Degree | 8 (0.8%) | 37.0 |
| Total | 1,042 (100.0%) | 88.0 |
Fertility by Education by Marriage Status in Lyon County
31.7% of women with births in Lyon County are unmarried. Women with the educational attainment of graduate degree are most likely to be married with 100.0% of them married at childbirth, while women with the educational attainment of high school diploma are least likely to be married with 46.6% of them unmarried at childbirth.
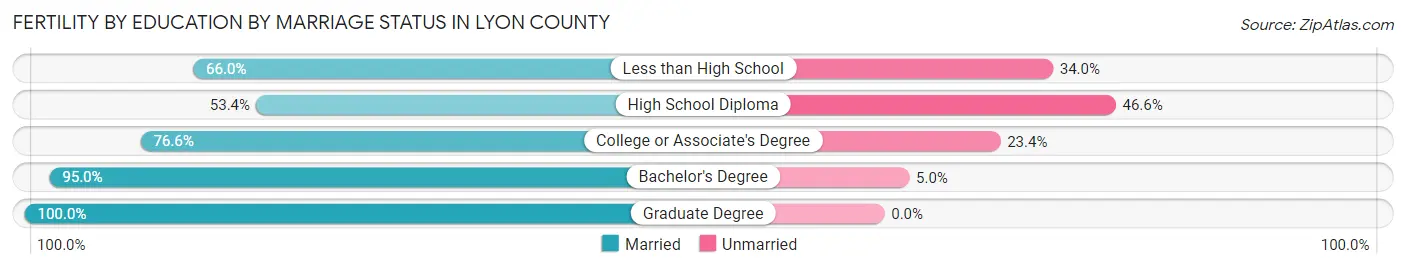
| Educational Attainment | Married | Unmarried |
| Less than High School | 70 (66.0%) | 36 (34.0%) |
| High School Diploma | 228 (53.4%) | 199 (46.6%) |
| College or Associate's Degree | 292 (76.6%) | 89 (23.4%) |
| Bachelor's Degree | 114 (95.0%) | 6 (5.0%) |
| Graduate Degree | 8 (100.0%) | 0 (0.0%) |
| Total | 712 (68.3%) | 330 (31.7%) |
Employment Characteristics in Lyon County
Employment by Class of Employer in Lyon County
Among the 25,834 employed individuals in Lyon County, private company employees (18,888 | 73.1%), local government employees (1,953 | 7.6%), and state government employees (1,625 | 6.3%) make up the most common classes of employment.
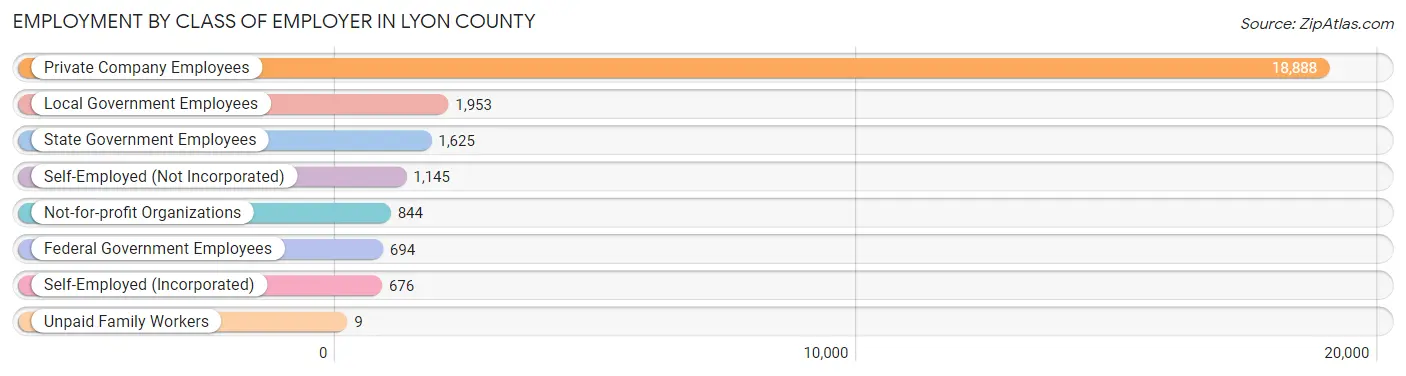
| Employer Class | # Employees | % Employees |
| Private Company Employees | 18,888 | 73.1% |
| Self-Employed (Incorporated) | 676 | 2.6% |
| Self-Employed (Not Incorporated) | 1,145 | 4.4% |
| Not-for-profit Organizations | 844 | 3.3% |
| Local Government Employees | 1,953 | 7.6% |
| State Government Employees | 1,625 | 6.3% |
| Federal Government Employees | 694 | 2.7% |
| Unpaid Family Workers | 9 | 0.0% |
| Total | 25,834 | 100.0% |
Employment Status by Age in Lyon County
According to the labor force statistics for Lyon County, out of the total population over 16 years of age (48,313), 58.9% or 28,456 individuals are in the labor force, with 7.2% or 2,049 of them unemployed. The age group with the highest labor force participation rate is 25 to 29 years, with 86.4% or 3,161 individuals in the labor force. Within the labor force, the 20 to 24 years age range has the highest percentage of unemployed individuals, with 16.1% or 383 of them being unemployed.
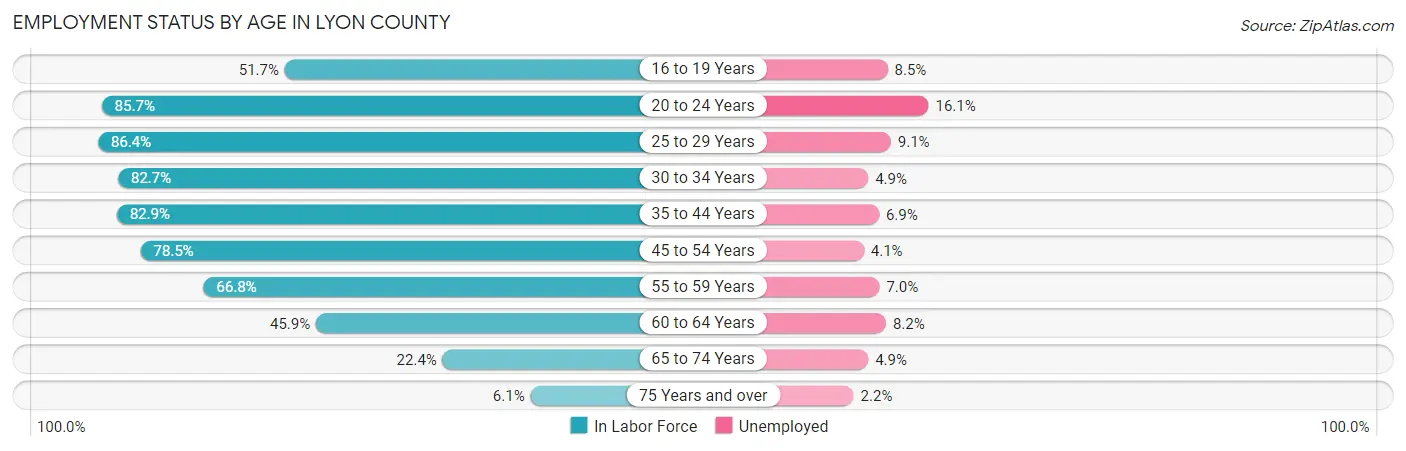
| Age Bracket | In Labor Force | Unemployed |
| 16 to 19 Years | 1,286 (51.7%) | 109 (8.5%) |
| 20 to 24 Years | 2,376 (85.7%) | 383 (16.1%) |
| 25 to 29 Years | 3,161 (86.4%) | 288 (9.1%) |
| 30 to 34 Years | 3,270 (82.7%) | 160 (4.9%) |
| 35 to 44 Years | 6,087 (82.9%) | 420 (6.9%) |
| 45 to 54 Years | 5,349 (78.5%) | 219 (4.1%) |
| 55 to 59 Years | 2,840 (66.8%) | 199 (7.0%) |
| 60 to 64 Years | 2,033 (45.9%) | 167 (8.2%) |
| 65 to 74 Years | 1,800 (22.4%) | 88 (4.9%) |
| 75 Years and over | 279 (6.1%) | 6 (2.2%) |
| Total | 28,456 (58.9%) | 2,049 (7.2%) |
Employment Status by Educational Attainment in Lyon County
According to labor force statistics for Lyon County, 74.7% of individuals (22,746) out of the total population between 25 and 64 years of age (30,450) are in the labor force, with 6.4% or 1,456 of them being unemployed. The group with the highest labor force participation rate are those with the educational attainment of bachelor's degree or higher, with 83.5% or 3,685 individuals in the labor force. Within the labor force, individuals with high school diploma education have the highest percentage of unemployment, with 8.1% or 579 of them being unemployed.
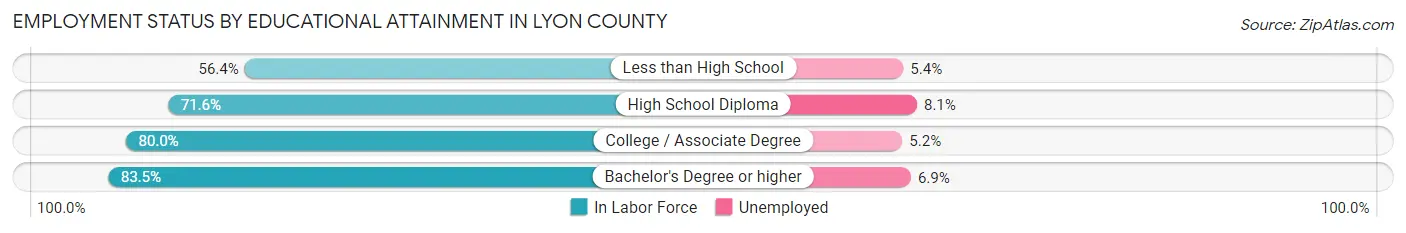
| Educational Attainment | In Labor Force | Unemployed |
| Less than High School | 2,242 (56.4%) | 215 (5.4%) |
| High School Diploma | 7,151 (71.6%) | 809 (8.1%) |
| College / Associate Degree | 9,659 (80.0%) | 628 (5.2%) |
| Bachelor's Degree or higher | 3,685 (83.5%) | 304 (6.9%) |
| Total | 22,746 (74.7%) | 1,949 (6.4%) |
Employment Occupations by Sex in Lyon County
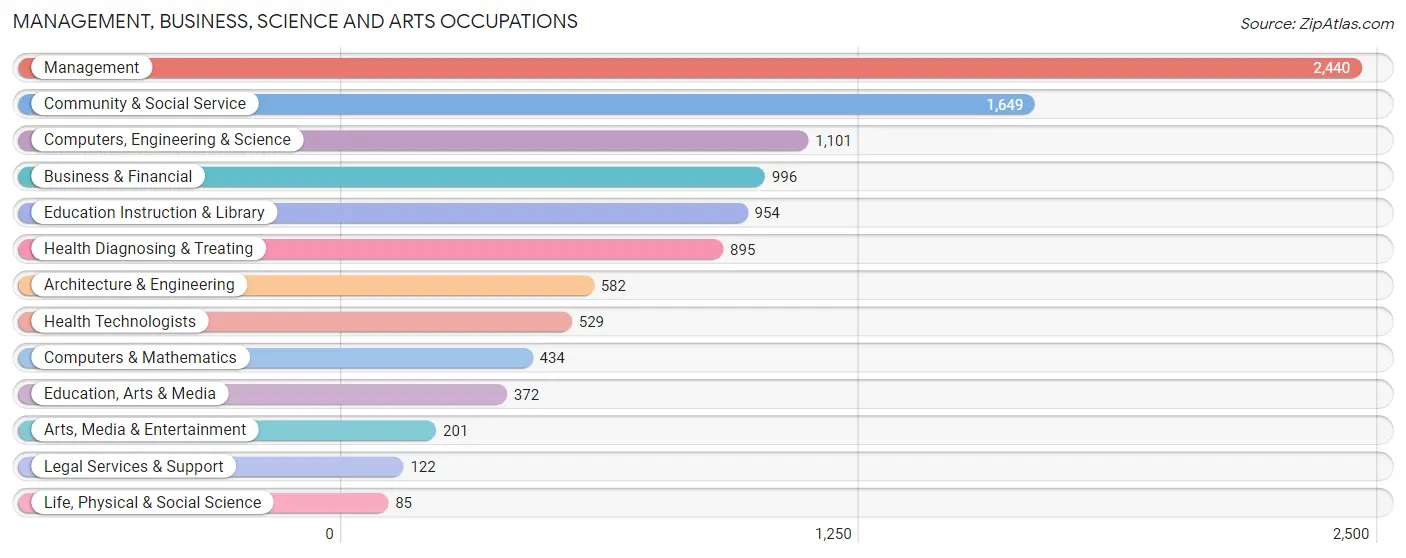
Management, Business, Science and Arts Occupations
The most common Management, Business, Science and Arts occupations in Lyon County are Management (2,440 | 9.3%), Community & Social Service (1,649 | 6.3%), Computers, Engineering & Science (1,101 | 4.2%), Business & Financial (996 | 3.8%), and Education Instruction & Library (954 | 3.6%).
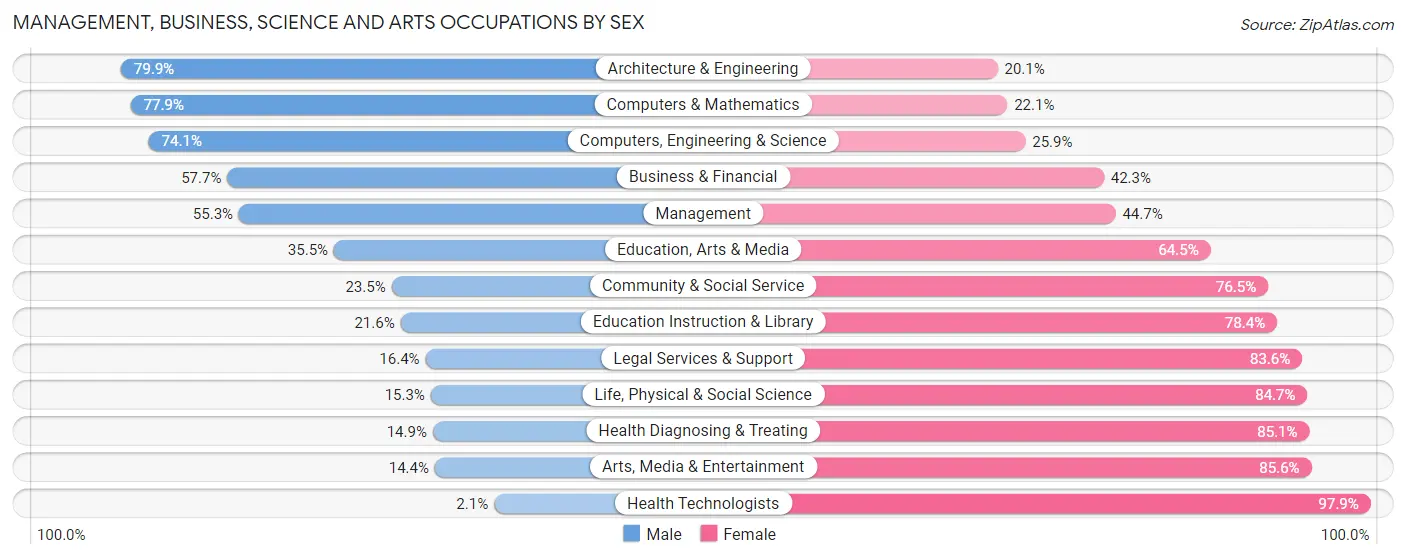
Management, Business, Science and Arts Occupations by Sex
Within the Management, Business, Science and Arts occupations in Lyon County, the most male-oriented occupations are Architecture & Engineering (79.9%), Computers & Mathematics (77.9%), and Computers, Engineering & Science (74.1%), while the most female-oriented occupations are Health Technologists (97.9%), Arts, Media & Entertainment (85.6%), and Health Diagnosing & Treating (85.1%).
| Occupation | Male | Female |
| Management | 1,349 (55.3%) | 1,091 (44.7%) |
| Business & Financial | 575 (57.7%) | 421 (42.3%) |
| Computers, Engineering & Science | 816 (74.1%) | 285 (25.9%) |
| Computers & Mathematics | 338 (77.9%) | 96 (22.1%) |
| Architecture & Engineering | 465 (79.9%) | 117 (20.1%) |
| Life, Physical & Social Science | 13 (15.3%) | 72 (84.7%) |
| Community & Social Service | 387 (23.5%) | 1,262 (76.5%) |
| Education, Arts & Media | 132 (35.5%) | 240 (64.5%) |
| Legal Services & Support | 20 (16.4%) | 102 (83.6%) |
| Education Instruction & Library | 206 (21.6%) | 748 (78.4%) |
| Arts, Media & Entertainment | 29 (14.4%) | 172 (85.6%) |
| Health Diagnosing & Treating | 133 (14.9%) | 762 (85.1%) |
| Health Technologists | 11 (2.1%) | 518 (97.9%) |
| Total (Category) | 3,260 (46.0%) | 3,821 (54.0%) |
| Total (Overall) | 14,753 (56.2%) | 11,474 (43.8%) |
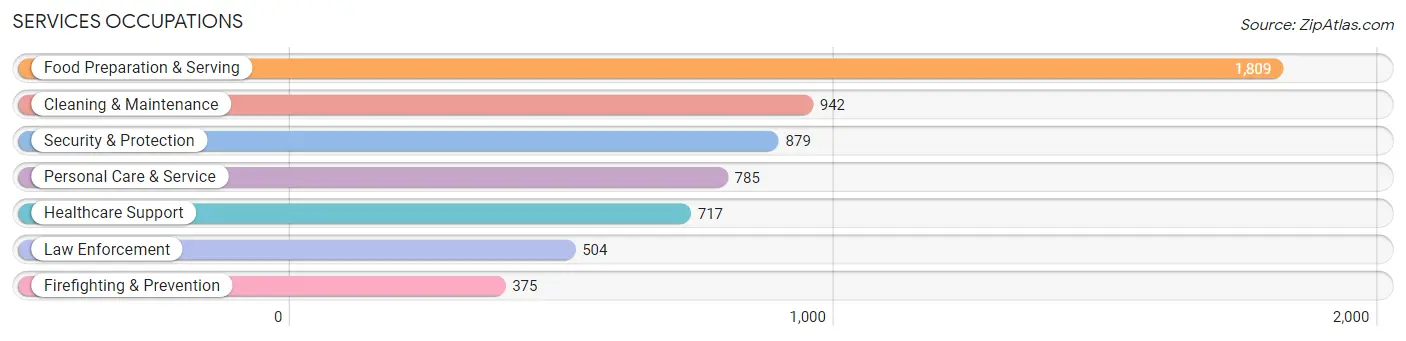
Services Occupations
The most common Services occupations in Lyon County are Food Preparation & Serving (1,809 | 6.9%), Cleaning & Maintenance (942 | 3.6%), Security & Protection (879 | 3.4%), Personal Care & Service (785 | 3.0%), and Healthcare Support (717 | 2.7%).
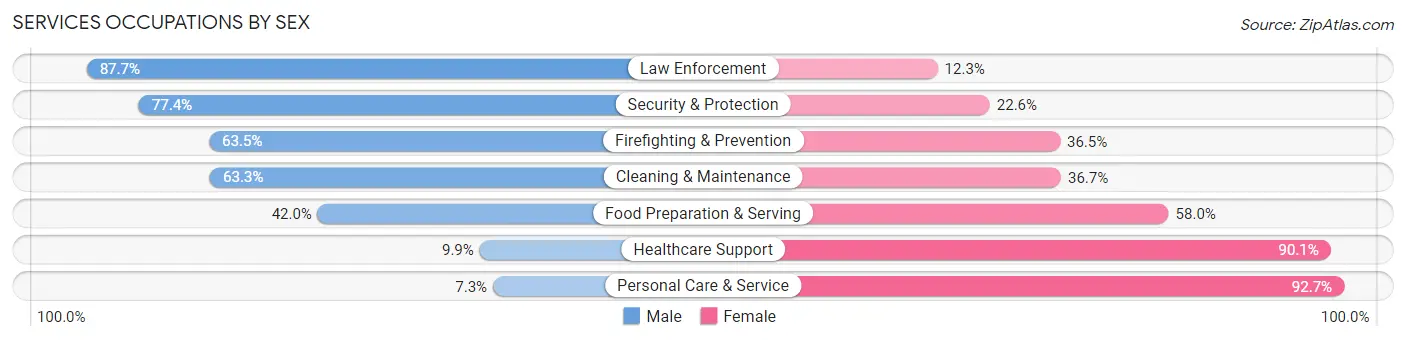
Services Occupations by Sex
Within the Services occupations in Lyon County, the most male-oriented occupations are Law Enforcement (87.7%), Security & Protection (77.4%), and Firefighting & Prevention (63.5%), while the most female-oriented occupations are Personal Care & Service (92.7%), Healthcare Support (90.1%), and Food Preparation & Serving (58.0%).
| Occupation | Male | Female |
| Healthcare Support | 71 (9.9%) | 646 (90.1%) |
| Security & Protection | 680 (77.4%) | 199 (22.6%) |
| Firefighting & Prevention | 238 (63.5%) | 137 (36.5%) |
| Law Enforcement | 442 (87.7%) | 62 (12.3%) |
| Food Preparation & Serving | 759 (42.0%) | 1,050 (58.0%) |
| Cleaning & Maintenance | 596 (63.3%) | 346 (36.7%) |
| Personal Care & Service | 57 (7.3%) | 728 (92.7%) |
| Total (Category) | 2,163 (42.1%) | 2,969 (57.9%) |
| Total (Overall) | 14,753 (56.2%) | 11,474 (43.8%) |
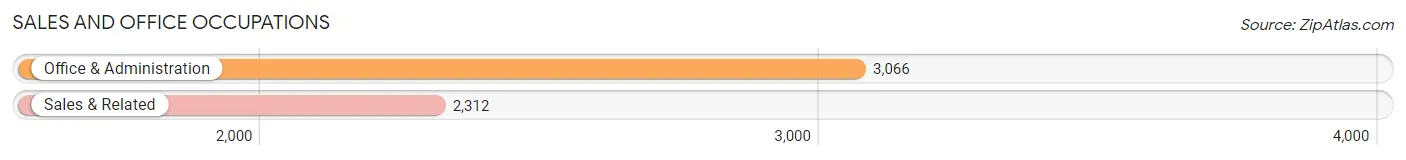
Sales and Office Occupations
The most common Sales and Office occupations in Lyon County are Office & Administration (3,066 | 11.7%), and Sales & Related (2,312 | 8.8%).
Sales and Office Occupations by Sex
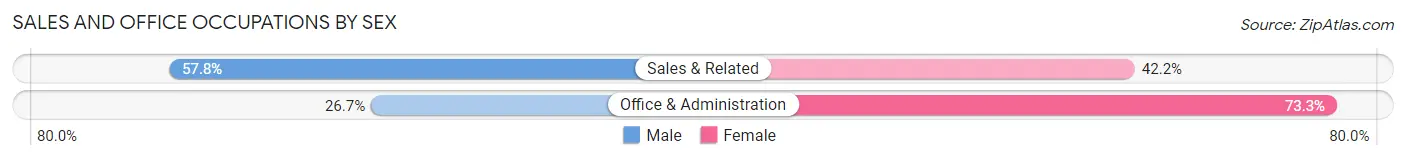
| Occupation | Male | Female |
| Sales & Related | 1,336 (57.8%) | 976 (42.2%) |
| Office & Administration | 819 (26.7%) | 2,247 (73.3%) |
| Total (Category) | 2,155 (40.1%) | 3,223 (59.9%) |
| Total (Overall) | 14,753 (56.2%) | 11,474 (43.8%) |
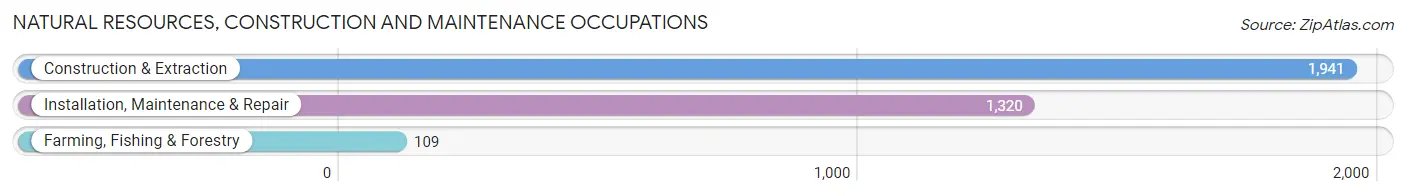
Natural Resources, Construction and Maintenance Occupations
The most common Natural Resources, Construction and Maintenance occupations in Lyon County are Construction & Extraction (1,941 | 7.4%), Installation, Maintenance & Repair (1,320 | 5.0%), and Farming, Fishing & Forestry (109 | 0.4%).
Natural Resources, Construction and Maintenance Occupations by Sex
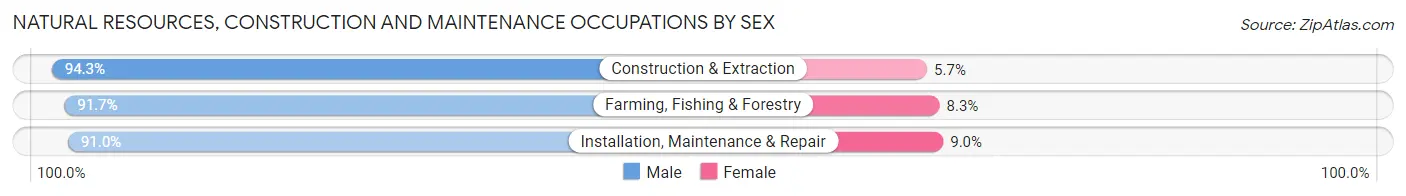
| Occupation | Male | Female |
| Farming, Fishing & Forestry | 100 (91.7%) | 9 (8.3%) |
| Construction & Extraction | 1,831 (94.3%) | 110 (5.7%) |
| Installation, Maintenance & Repair | 1,201 (91.0%) | 119 (9.0%) |
| Total (Category) | 3,132 (92.9%) | 238 (7.1%) |
| Total (Overall) | 14,753 (56.2%) | 11,474 (43.8%) |
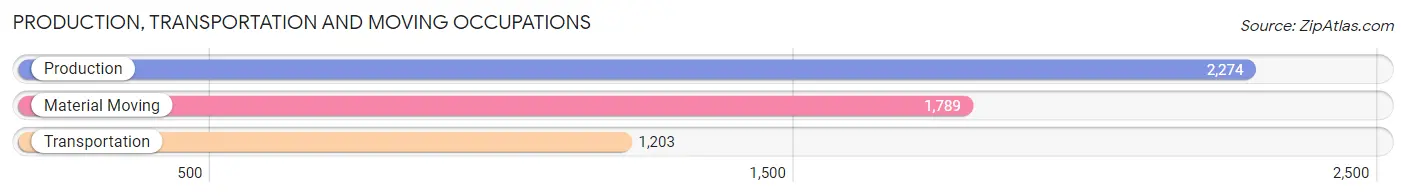
Production, Transportation and Moving Occupations
The most common Production, Transportation and Moving occupations in Lyon County are Production (2,274 | 8.7%), Material Moving (1,789 | 6.8%), and Transportation (1,203 | 4.6%).
Production, Transportation and Moving Occupations by Sex
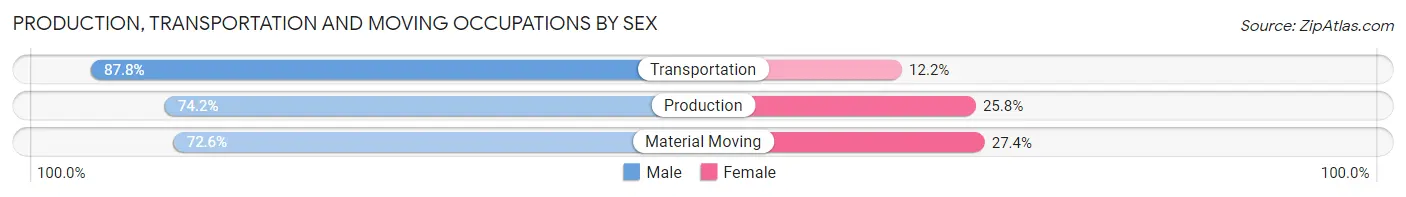
| Occupation | Male | Female |
| Production | 1,688 (74.2%) | 586 (25.8%) |
| Transportation | 1,056 (87.8%) | 147 (12.2%) |
| Material Moving | 1,299 (72.6%) | 490 (27.4%) |
| Total (Category) | 4,043 (76.8%) | 1,223 (23.2%) |
| Total (Overall) | 14,753 (56.2%) | 11,474 (43.8%) |
Employment Industries by Sex in Lyon County
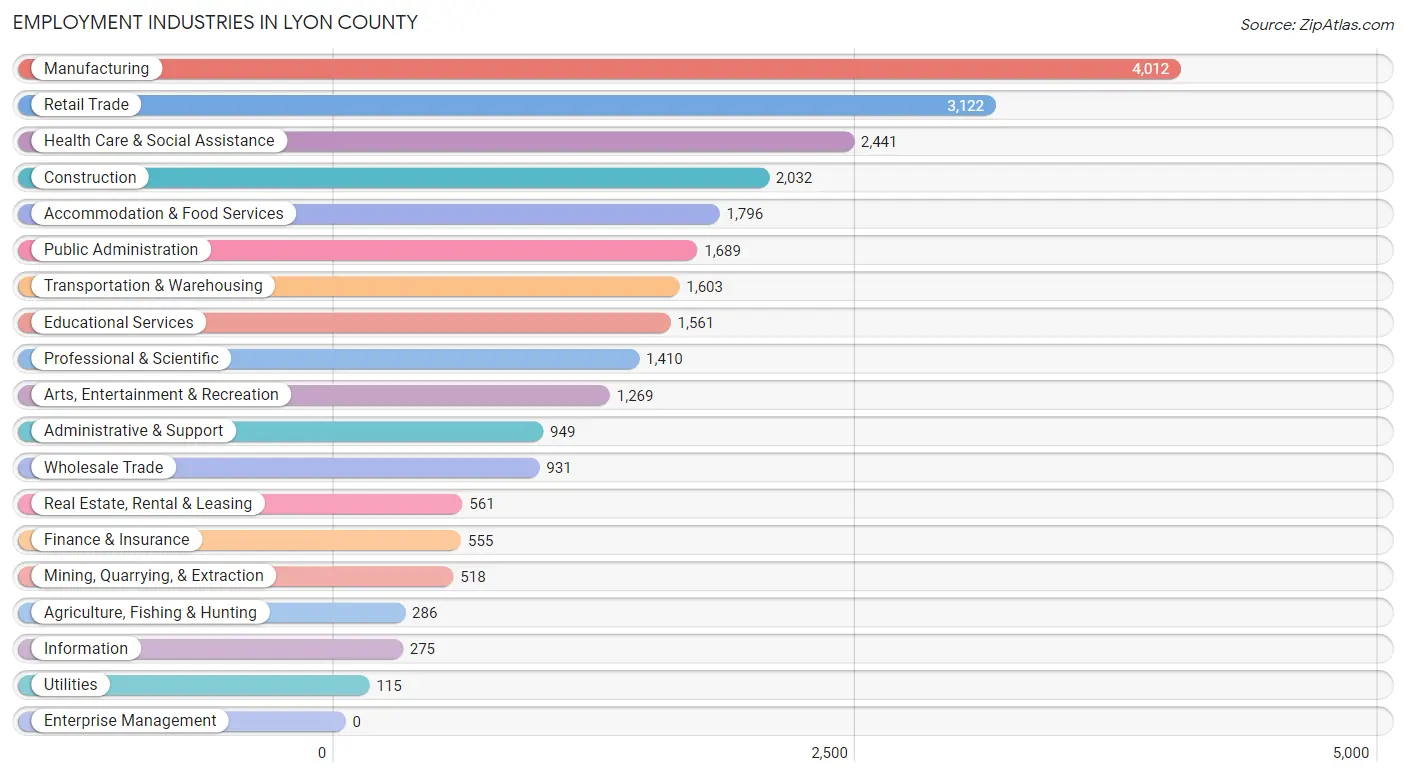
Employment Industries in Lyon County
The major employment industries in Lyon County include Manufacturing (4,012 | 15.3%), Retail Trade (3,122 | 11.9%), Health Care & Social Assistance (2,441 | 9.3%), Construction (2,032 | 7.7%), and Accommodation & Food Services (1,796 | 6.9%).
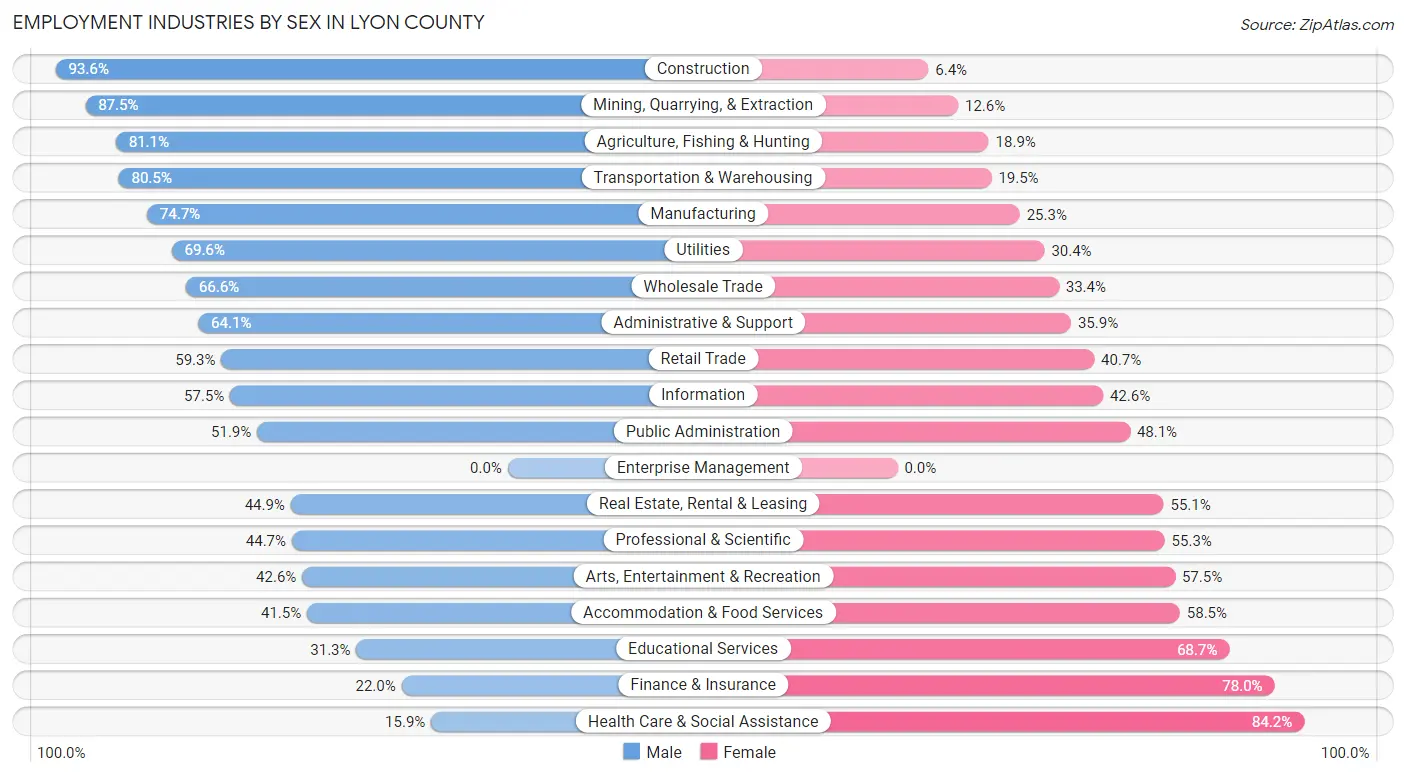
Employment Industries by Sex in Lyon County
The Lyon County industries that see more men than women are Construction (93.6%), Mining, Quarrying, & Extraction (87.5%), and Agriculture, Fishing & Hunting (81.1%), whereas the industries that tend to have a higher number of women are Health Care & Social Assistance (84.2%), Finance & Insurance (78.0%), and Educational Services (68.7%).
| Industry | Male | Female |
| Agriculture, Fishing & Hunting | 232 (81.1%) | 54 (18.9%) |
| Mining, Quarrying, & Extraction | 453 (87.5%) | 65 (12.6%) |
| Construction | 1,902 (93.6%) | 130 (6.4%) |
| Manufacturing | 2,996 (74.7%) | 1,016 (25.3%) |
| Wholesale Trade | 620 (66.6%) | 311 (33.4%) |
| Retail Trade | 1,851 (59.3%) | 1,271 (40.7%) |
| Transportation & Warehousing | 1,291 (80.5%) | 312 (19.5%) |
| Utilities | 80 (69.6%) | 35 (30.4%) |
| Information | 158 (57.5%) | 117 (42.5%) |
| Finance & Insurance | 122 (22.0%) | 433 (78.0%) |
| Real Estate, Rental & Leasing | 252 (44.9%) | 309 (55.1%) |
| Professional & Scientific | 630 (44.7%) | 780 (55.3%) |
| Enterprise Management | 0 (0.0%) | 0 (0.0%) |
| Administrative & Support | 608 (64.1%) | 341 (35.9%) |
| Educational Services | 489 (31.3%) | 1,072 (68.7%) |
| Health Care & Social Assistance | 387 (15.9%) | 2,054 (84.2%) |
| Arts, Entertainment & Recreation | 540 (42.5%) | 729 (57.5%) |
| Accommodation & Food Services | 746 (41.5%) | 1,050 (58.5%) |
| Public Administration | 876 (51.9%) | 813 (48.1%) |
| Total | 14,753 (56.2%) | 11,474 (43.8%) |
Education in Lyon County
School Enrollment in Lyon County
The most common levels of schooling among the 12,000 students in Lyon County are middle school (2,882 | 24.0%), elementary school (2,797 | 23.3%), and high school (2,688 | 22.4%).
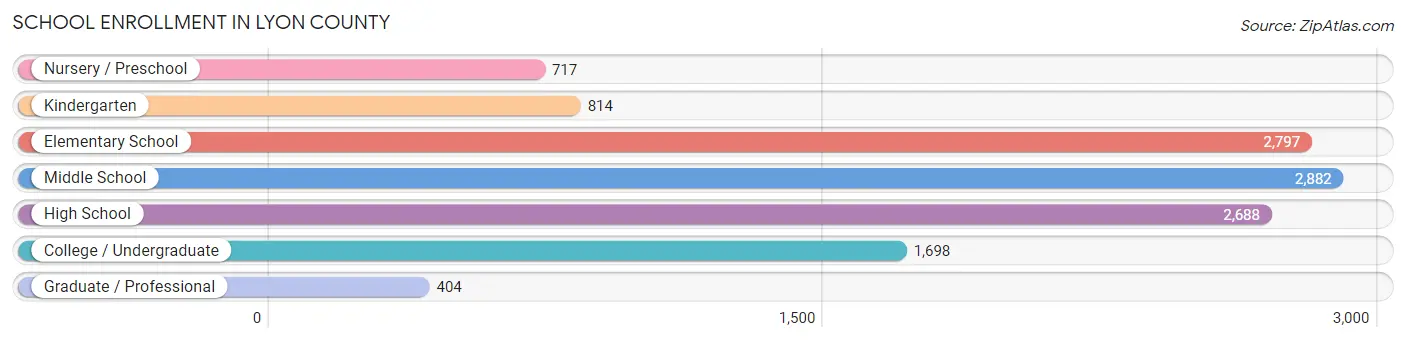
| School Level | # Students | % Students |
| Nursery / Preschool | 717 | 6.0% |
| Kindergarten | 814 | 6.8% |
| Elementary School | 2,797 | 23.3% |
| Middle School | 2,882 | 24.0% |
| High School | 2,688 | 22.4% |
| College / Undergraduate | 1,698 | 14.1% |
| Graduate / Professional | 404 | 3.4% |
| Total | 12,000 | 100.0% |
School Enrollment by Age by Funding Source in Lyon County
Out of a total of 12,000 students who are enrolled in schools in Lyon County, 864 (7.2%) attend a private institution, while the remaining 11,136 (92.8%) are enrolled in public schools. The age group of 3 to 4 year olds has the highest likelihood of being enrolled in private schools, with 190 (42.5% in the age bracket) enrolled. Conversely, the age group of 10 to 14 year olds has the lowest likelihood of being enrolled in a private school, with 3,401 (96.3% in the age bracket) attending a public institution.
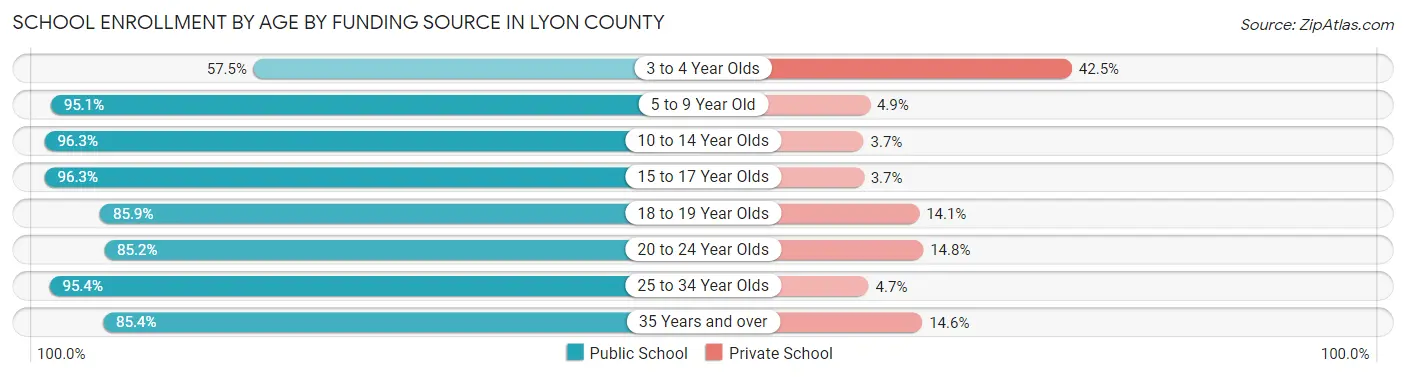
| Age Bracket | Public School | Private School |
| 3 to 4 Year Olds | 257 (57.5%) | 190 (42.5%) |
| 5 to 9 Year Old | 3,230 (95.1%) | 166 (4.9%) |
| 10 to 14 Year Olds | 3,401 (96.3%) | 131 (3.7%) |
| 15 to 17 Year Olds | 2,012 (96.3%) | 78 (3.7%) |
| 18 to 19 Year Olds | 452 (85.9%) | 74 (14.1%) |
| 20 to 24 Year Olds | 362 (85.2%) | 63 (14.8%) |
| 25 to 34 Year Olds | 676 (95.4%) | 33 (4.6%) |
| 35 Years and over | 747 (85.4%) | 128 (14.6%) |
| Total | 11,136 (92.8%) | 864 (7.2%) |
Educational Attainment by Field of Study in Lyon County
Business (1,517 | 20.1%), education (971 | 12.8%), arts & humanities (776 | 10.3%), science & technology (640 | 8.5%), and bio, nature & agricultural (582 | 7.7%) are the most common fields of study among 7,566 individuals in Lyon County who have obtained a bachelor's degree or higher.
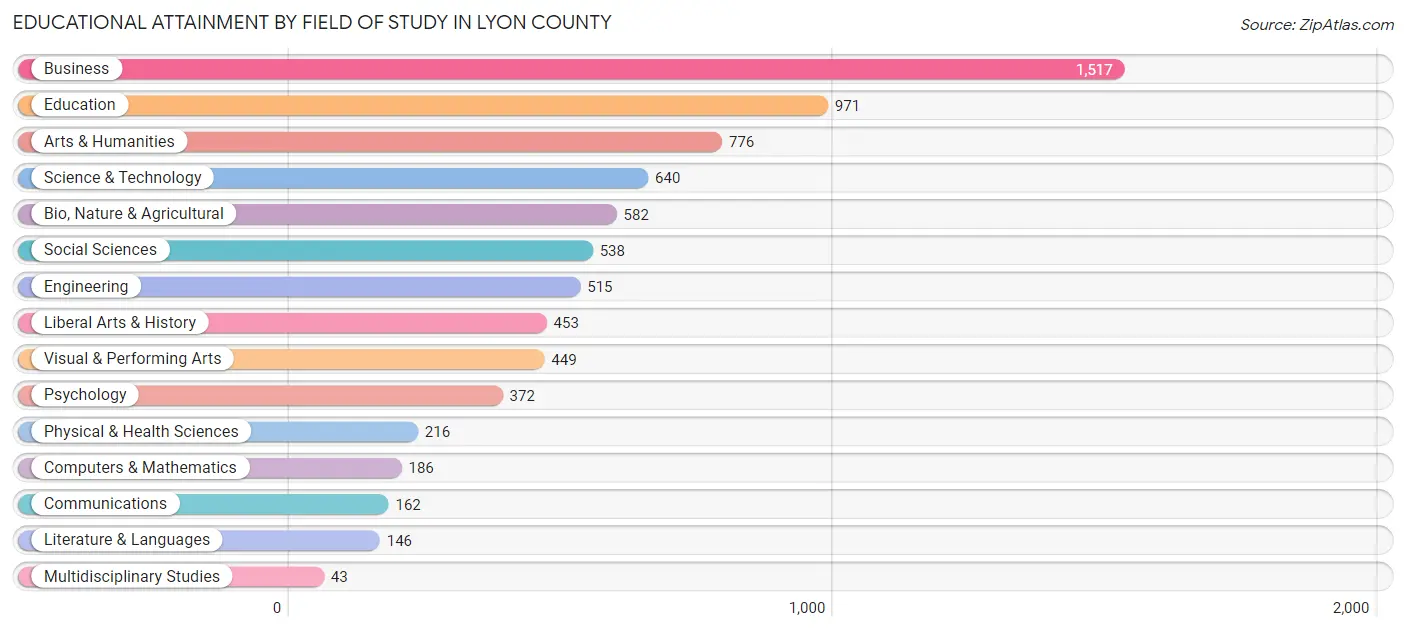
| Field of Study | # Graduates | % Graduates |
| Computers & Mathematics | 186 | 2.5% |
| Bio, Nature & Agricultural | 582 | 7.7% |
| Physical & Health Sciences | 216 | 2.9% |
| Psychology | 372 | 4.9% |
| Social Sciences | 538 | 7.1% |
| Engineering | 515 | 6.8% |
| Multidisciplinary Studies | 43 | 0.6% |
| Science & Technology | 640 | 8.5% |
| Business | 1,517 | 20.1% |
| Education | 971 | 12.8% |
| Literature & Languages | 146 | 1.9% |
| Liberal Arts & History | 453 | 6.0% |
| Visual & Performing Arts | 449 | 5.9% |
| Communications | 162 | 2.1% |
| Arts & Humanities | 776 | 10.3% |
| Total | 7,566 | 100.0% |
Transportation & Commute in Lyon County
Vehicle Availability by Sex in Lyon County
The most prevalent vehicle ownership categories in Lyon County are males with 2 vehicles (5,287, accounting for 35.6%) and females with 2 vehicles (3,599, making up 48.3%).
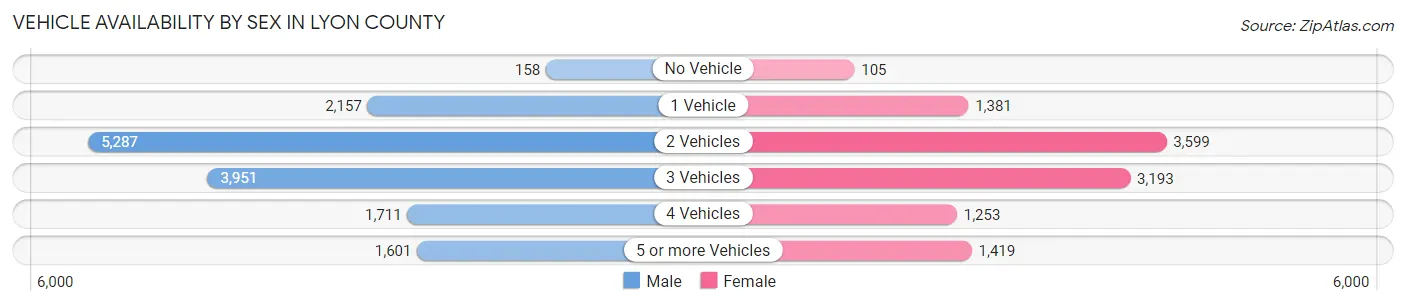
| Vehicles Available | Male | Female |
| No Vehicle | 158 (1.1%) | 105 (1.0%) |
| 1 Vehicle | 2,157 (14.5%) | 1,381 (12.6%) |
| 2 Vehicles | 5,287 (35.6%) | 3,599 (32.9%) |
| 3 Vehicles | 3,951 (26.6%) | 3,193 (29.2%) |
| 4 Vehicles | 1,711 (11.5%) | 1,253 (11.4%) |
| 5 or more Vehicles | 1,601 (10.8%) | 1,419 (13.0%) |
| Total | 14,865 (100.0%) | 10,950 (100.0%) |
Commute Time in Lyon County
The most frequently occuring commute durations in Lyon County are 10 to 14 minutes (2,943 commuters, 12.3%), 30 to 34 minutes (2,905 commuters, 12.1%), and 20 to 24 minutes (2,805 commuters, 11.7%).
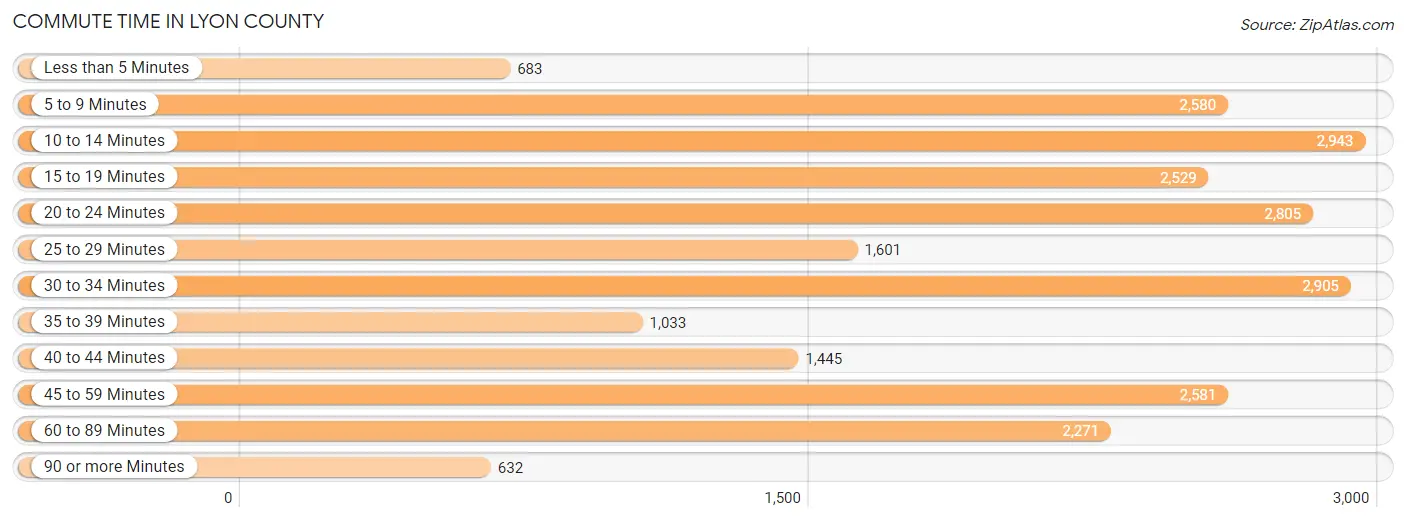
| Commute Time | # Commuters | % Commuters |
| Less than 5 Minutes | 683 | 2.8% |
| 5 to 9 Minutes | 2,580 | 10.7% |
| 10 to 14 Minutes | 2,943 | 12.3% |
| 15 to 19 Minutes | 2,529 | 10.5% |
| 20 to 24 Minutes | 2,805 | 11.7% |
| 25 to 29 Minutes | 1,601 | 6.7% |
| 30 to 34 Minutes | 2,905 | 12.1% |
| 35 to 39 Minutes | 1,033 | 4.3% |
| 40 to 44 Minutes | 1,445 | 6.0% |
| 45 to 59 Minutes | 2,581 | 10.7% |
| 60 to 89 Minutes | 2,271 | 9.5% |
| 90 or more Minutes | 632 | 2.6% |
Commute Time by Sex in Lyon County
The most common commute times in Lyon County are 20 to 24 minutes (1,878 commuters, 13.3%) for males and 10 to 14 minutes (1,558 commuters, 15.7%) for females.
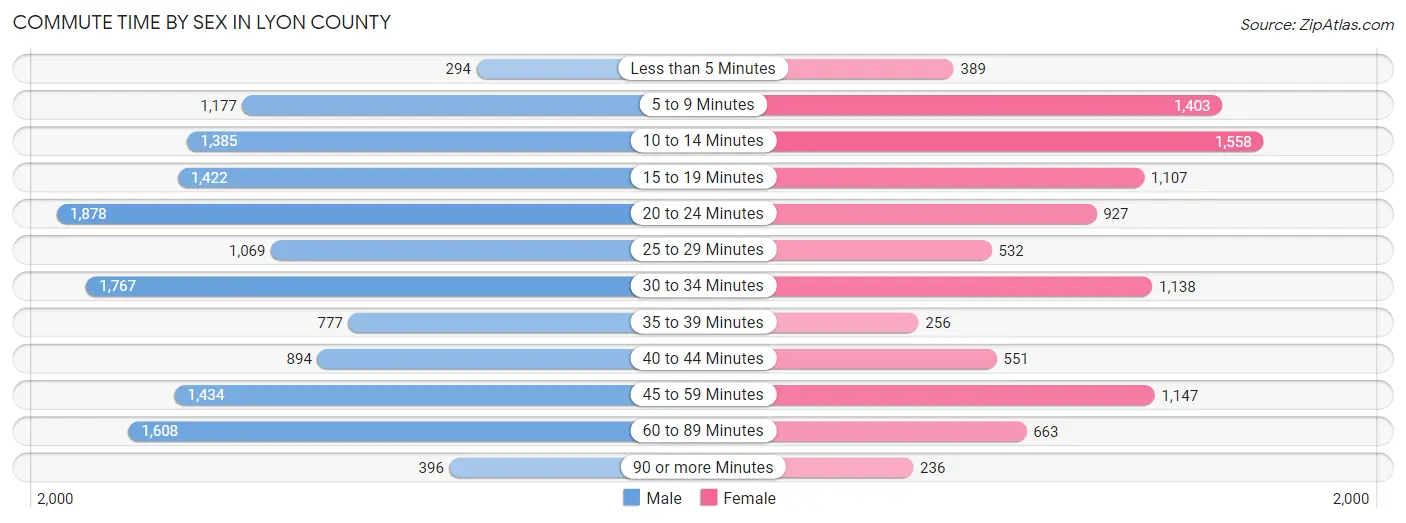
| Commute Time | Male | Female |
| Less than 5 Minutes | 294 (2.1%) | 389 (3.9%) |
| 5 to 9 Minutes | 1,177 (8.4%) | 1,403 (14.2%) |
| 10 to 14 Minutes | 1,385 (9.8%) | 1,558 (15.7%) |
| 15 to 19 Minutes | 1,422 (10.1%) | 1,107 (11.2%) |
| 20 to 24 Minutes | 1,878 (13.3%) | 927 (9.4%) |
| 25 to 29 Minutes | 1,069 (7.6%) | 532 (5.4%) |
| 30 to 34 Minutes | 1,767 (12.5%) | 1,138 (11.5%) |
| 35 to 39 Minutes | 777 (5.5%) | 256 (2.6%) |
| 40 to 44 Minutes | 894 (6.3%) | 551 (5.6%) |
| 45 to 59 Minutes | 1,434 (10.2%) | 1,147 (11.6%) |
| 60 to 89 Minutes | 1,608 (11.4%) | 663 (6.7%) |
| 90 or more Minutes | 396 (2.8%) | 236 (2.4%) |
Time of Departure to Work by Sex in Lyon County
The most frequent times of departure to work in Lyon County are 12:00 AM to 4:59 AM (1,945, 13.8%) for males and 6:00 AM to 6:29 AM (1,321, 13.3%) for females.
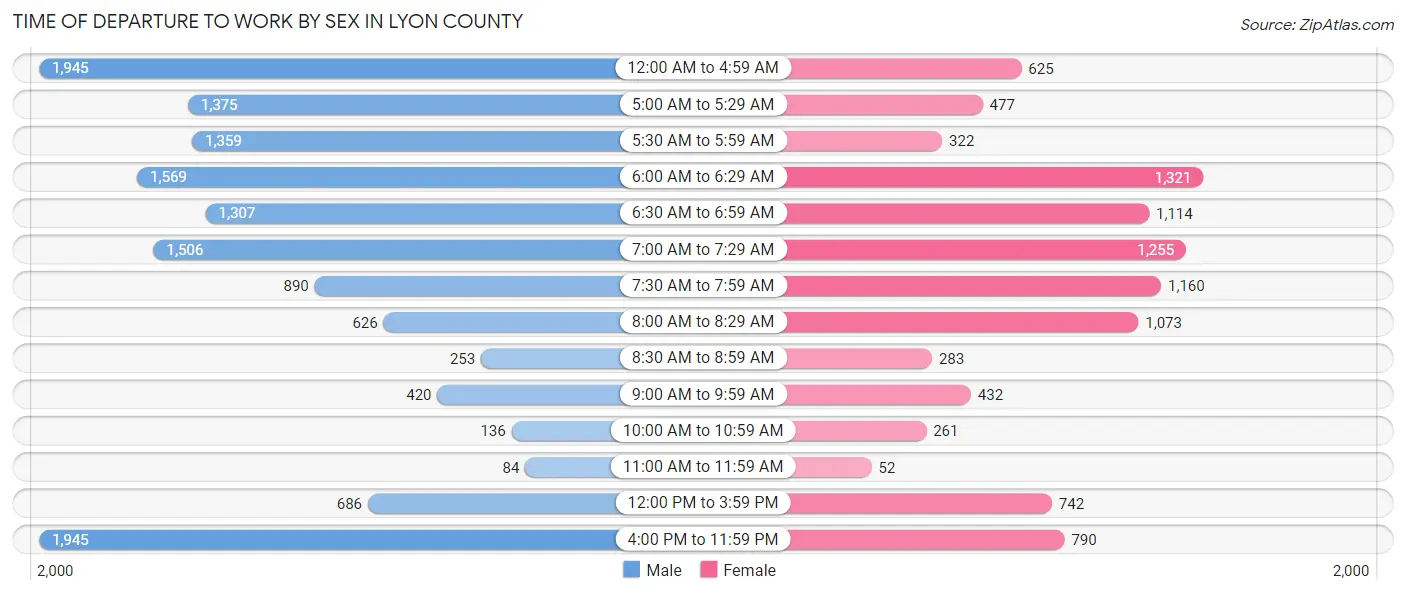
| Time of Departure | Male | Female |
| 12:00 AM to 4:59 AM | 1,945 (13.8%) | 625 (6.3%) |
| 5:00 AM to 5:29 AM | 1,375 (9.8%) | 477 (4.8%) |
| 5:30 AM to 5:59 AM | 1,359 (9.6%) | 322 (3.3%) |
| 6:00 AM to 6:29 AM | 1,569 (11.1%) | 1,321 (13.3%) |
| 6:30 AM to 6:59 AM | 1,307 (9.3%) | 1,114 (11.2%) |
| 7:00 AM to 7:29 AM | 1,506 (10.7%) | 1,255 (12.7%) |
| 7:30 AM to 7:59 AM | 890 (6.3%) | 1,160 (11.7%) |
| 8:00 AM to 8:29 AM | 626 (4.4%) | 1,073 (10.8%) |
| 8:30 AM to 8:59 AM | 253 (1.8%) | 283 (2.9%) |
| 9:00 AM to 9:59 AM | 420 (3.0%) | 432 (4.4%) |
| 10:00 AM to 10:59 AM | 136 (1.0%) | 261 (2.6%) |
| 11:00 AM to 11:59 AM | 84 (0.6%) | 52 (0.5%) |
| 12:00 PM to 3:59 PM | 686 (4.9%) | 742 (7.5%) |
| 4:00 PM to 11:59 PM | 1,945 (13.8%) | 790 (8.0%) |
| Total | 14,101 (100.0%) | 9,907 (100.0%) |
Housing Occupancy in Lyon County
Occupancy by Ownership in Lyon County
Of the total 23,290 dwellings in Lyon County, owner-occupied units account for 17,790 (76.4%), while renter-occupied units make up 5,500 (23.6%).
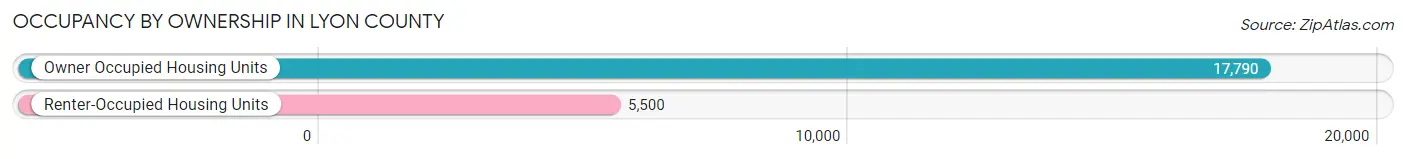
| Occupancy | # Housing Units | % Housing Units |
| Owner Occupied Housing Units | 17,790 | 76.4% |
| Renter-Occupied Housing Units | 5,500 | 23.6% |
| Total Occupied Housing Units | 23,290 | 100.0% |
Occupancy by Household Size in Lyon County
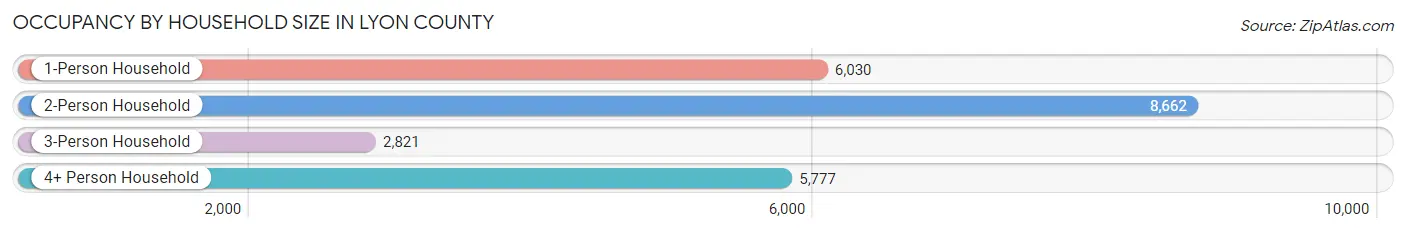
| Household Size | # Housing Units | % Housing Units |
| 1-Person Household | 6,030 | 25.9% |
| 2-Person Household | 8,662 | 37.2% |
| 3-Person Household | 2,821 | 12.1% |
| 4+ Person Household | 5,777 | 24.8% |
| Total Housing Units | 23,290 | 100.0% |
Occupancy by Ownership by Household Size in Lyon County
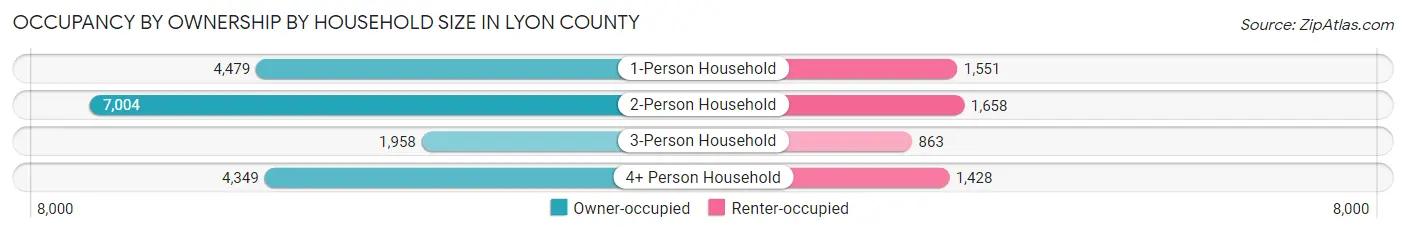
| Household Size | Owner-occupied | Renter-occupied |
| 1-Person Household | 4,479 (74.3%) | 1,551 (25.7%) |
| 2-Person Household | 7,004 (80.9%) | 1,658 (19.1%) |
| 3-Person Household | 1,958 (69.4%) | 863 (30.6%) |
| 4+ Person Household | 4,349 (75.3%) | 1,428 (24.7%) |
| Total Housing Units | 17,790 (76.4%) | 5,500 (23.6%) |
Occupancy by Educational Attainment in Lyon County
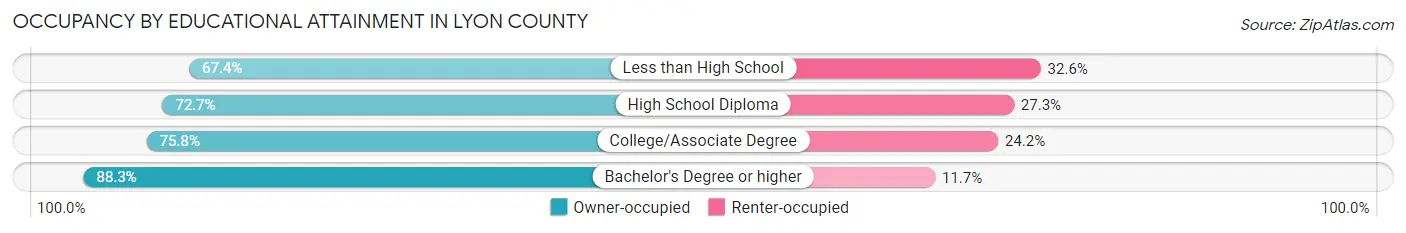
| Household Size | Owner-occupied | Renter-occupied |
| Less than High School | 1,583 (67.4%) | 766 (32.6%) |
| High School Diploma | 4,878 (72.7%) | 1,833 (27.3%) |
| College/Associate Degree | 7,522 (75.8%) | 2,398 (24.2%) |
| Bachelor's Degree or higher | 3,807 (88.3%) | 503 (11.7%) |
Occupancy by Age of Householder in Lyon County
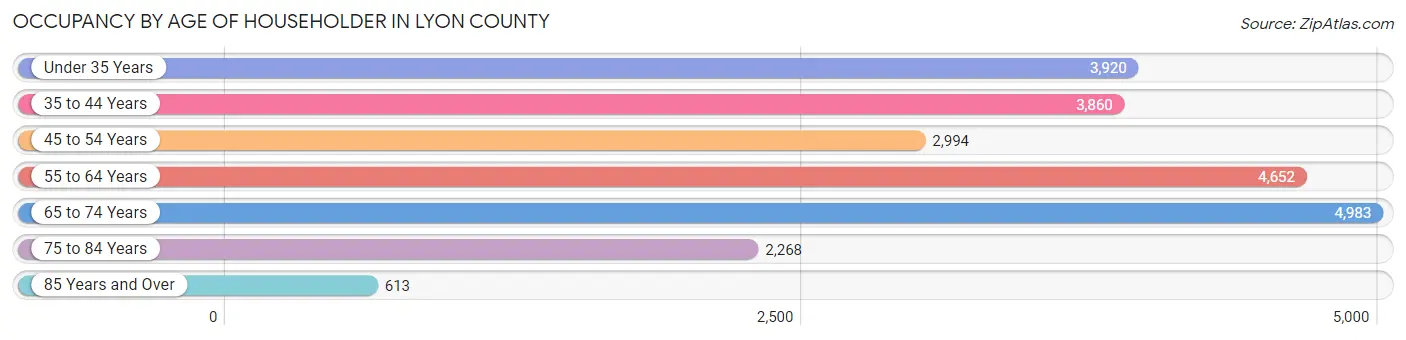
| Age Bracket | # Households | % Households |
| Under 35 Years | 3,920 | 16.8% |
| 35 to 44 Years | 3,860 | 16.6% |
| 45 to 54 Years | 2,994 | 12.9% |
| 55 to 64 Years | 4,652 | 20.0% |
| 65 to 74 Years | 4,983 | 21.4% |
| 75 to 84 Years | 2,268 | 9.7% |
| 85 Years and Over | 613 | 2.6% |
| Total | 23,290 | 100.0% |
Housing Finances in Lyon County
Median Income by Occupancy in Lyon County
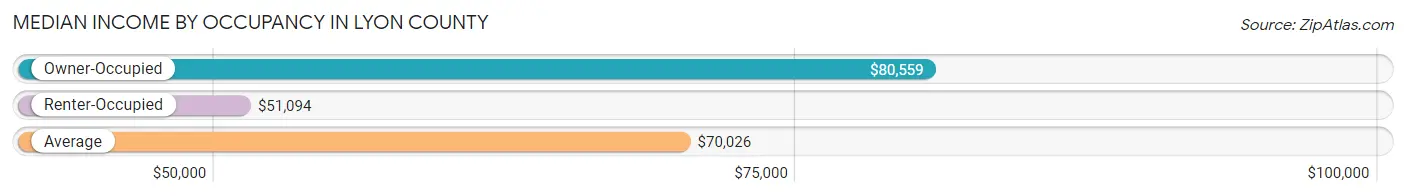
| Occupancy Type | # Households | Median Income |
| Owner-Occupied | 17,790 (76.4%) | $80,559 |
| Renter-Occupied | 5,500 (23.6%) | $51,094 |
| Average | 23,290 (100.0%) | $70,026 |
Occupancy by Householder Income Bracket in Lyon County
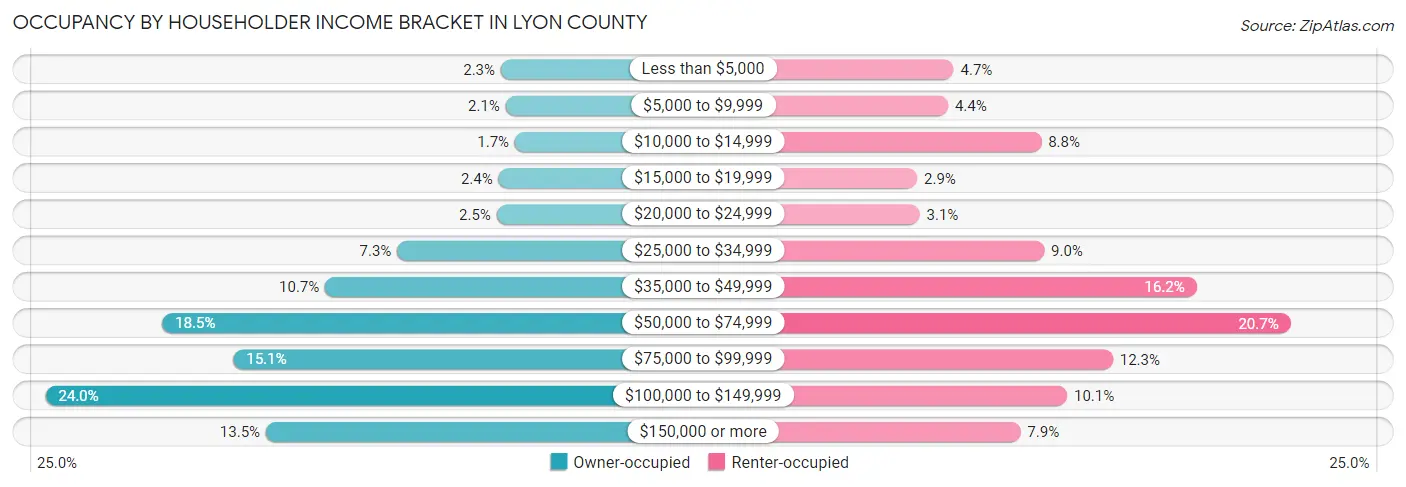
| Income Bracket | Owner-occupied | Renter-occupied |
| Less than $5,000 | 413 (2.3%) | 257 (4.7%) |
| $5,000 to $9,999 | 371 (2.1%) | 242 (4.4%) |
| $10,000 to $14,999 | 293 (1.7%) | 486 (8.8%) |
| $15,000 to $19,999 | 433 (2.4%) | 161 (2.9%) |
| $20,000 to $24,999 | 449 (2.5%) | 168 (3.0%) |
| $25,000 to $34,999 | 1,291 (7.3%) | 494 (9.0%) |
| $35,000 to $49,999 | 1,902 (10.7%) | 893 (16.2%) |
| $50,000 to $74,999 | 3,283 (18.4%) | 1,139 (20.7%) |
| $75,000 to $99,999 | 2,680 (15.1%) | 674 (12.2%) |
| $100,000 to $149,999 | 4,272 (24.0%) | 554 (10.1%) |
| $150,000 or more | 2,403 (13.5%) | 432 (7.9%) |
| Total | 17,790 (100.0%) | 5,500 (100.0%) |
Monthly Housing Cost Tiers in Lyon County
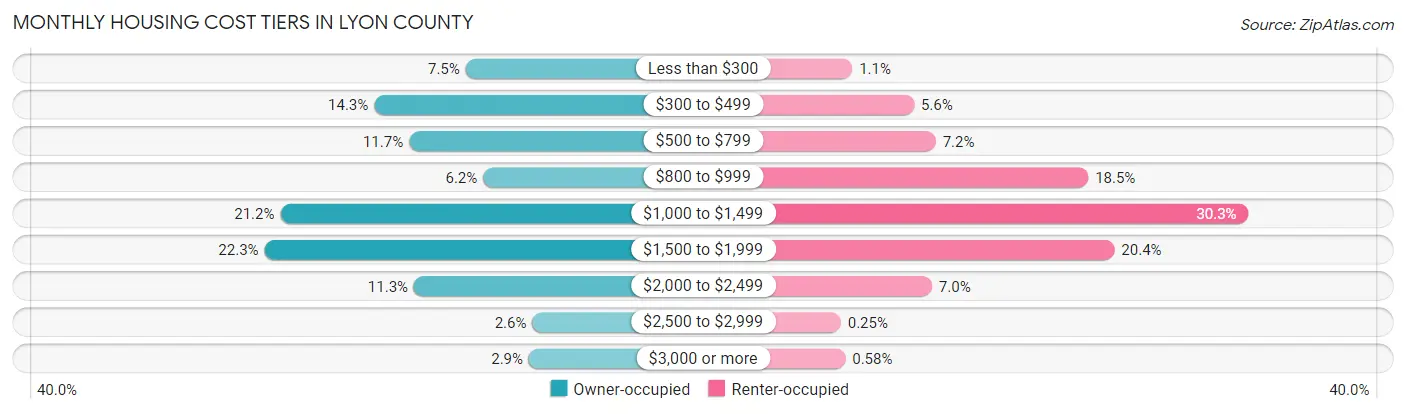
| Monthly Cost | Owner-occupied | Renter-occupied |
| Less than $300 | 1,337 (7.5%) | 60 (1.1%) |
| $300 to $499 | 2,536 (14.3%) | 310 (5.6%) |
| $500 to $799 | 2,079 (11.7%) | 398 (7.2%) |
| $800 to $999 | 1,109 (6.2%) | 1,016 (18.5%) |
| $1,000 to $1,499 | 3,766 (21.2%) | 1,665 (30.3%) |
| $1,500 to $1,999 | 3,975 (22.3%) | 1,122 (20.4%) |
| $2,000 to $2,499 | 2,015 (11.3%) | 383 (7.0%) |
| $2,500 to $2,999 | 464 (2.6%) | 14 (0.3%) |
| $3,000 or more | 509 (2.9%) | 32 (0.6%) |
| Total | 17,790 (100.0%) | 5,500 (100.0%) |
Physical Housing Characteristics in Lyon County
Housing Structures in Lyon County
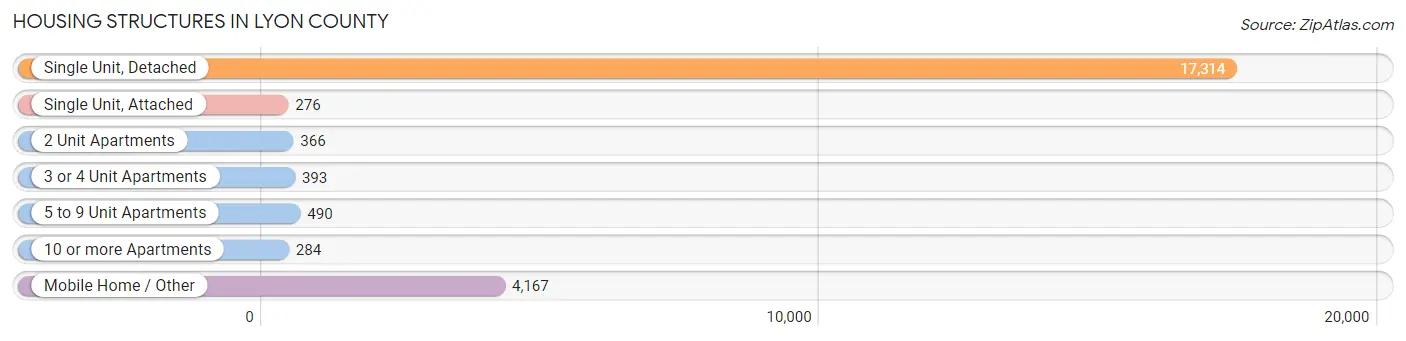
| Structure Type | # Housing Units | % Housing Units |
| Single Unit, Detached | 17,314 | 74.3% |
| Single Unit, Attached | 276 | 1.2% |
| 2 Unit Apartments | 366 | 1.6% |
| 3 or 4 Unit Apartments | 393 | 1.7% |
| 5 to 9 Unit Apartments | 490 | 2.1% |
| 10 or more Apartments | 284 | 1.2% |
| Mobile Home / Other | 4,167 | 17.9% |
| Total | 23,290 | 100.0% |
Housing Structures by Occupancy in Lyon County
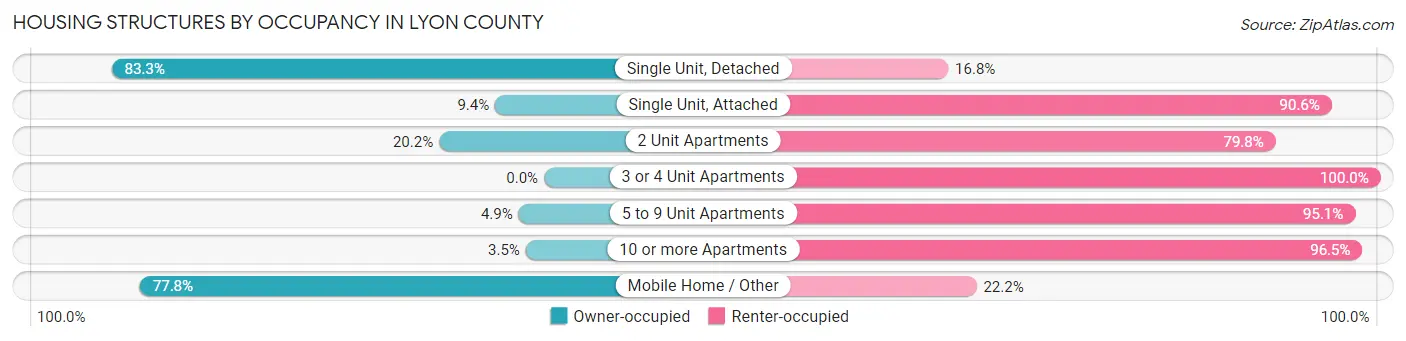
| Structure Type | Owner-occupied | Renter-occupied |
| Single Unit, Detached | 14,414 (83.3%) | 2,900 (16.8%) |
| Single Unit, Attached | 26 (9.4%) | 250 (90.6%) |
| 2 Unit Apartments | 74 (20.2%) | 292 (79.8%) |
| 3 or 4 Unit Apartments | 0 (0.0%) | 393 (100.0%) |
| 5 to 9 Unit Apartments | 24 (4.9%) | 466 (95.1%) |
| 10 or more Apartments | 10 (3.5%) | 274 (96.5%) |
| Mobile Home / Other | 3,242 (77.8%) | 925 (22.2%) |
| Total | 17,790 (76.4%) | 5,500 (23.6%) |
Housing Structures by Number of Rooms in Lyon County
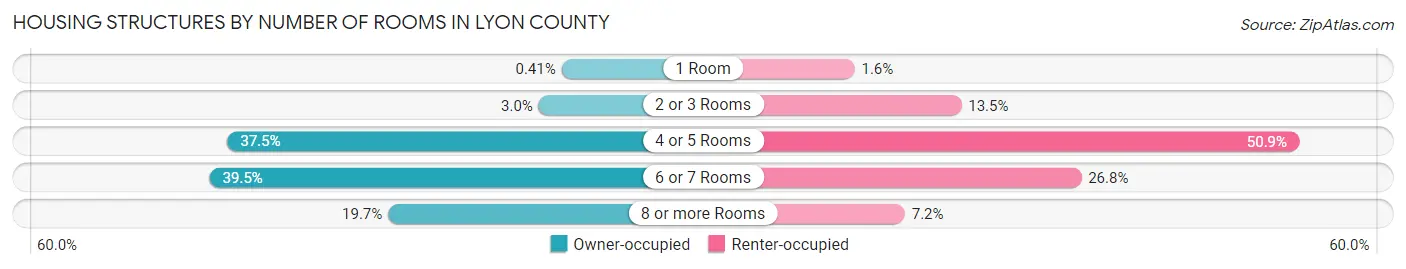
| Number of Rooms | Owner-occupied | Renter-occupied |
| 1 Room | 73 (0.4%) | 89 (1.6%) |
| 2 or 3 Rooms | 524 (2.9%) | 741 (13.5%) |
| 4 or 5 Rooms | 6,671 (37.5%) | 2,801 (50.9%) |
| 6 or 7 Rooms | 7,024 (39.5%) | 1,473 (26.8%) |
| 8 or more Rooms | 3,498 (19.7%) | 396 (7.2%) |
| Total | 17,790 (100.0%) | 5,500 (100.0%) |
Housing Structure by Heating Type in Lyon County
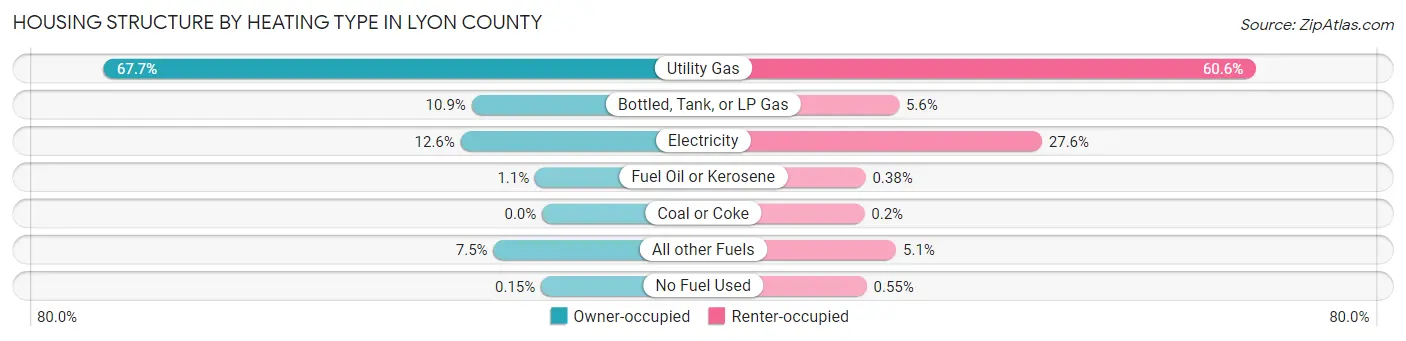
| Heating Type | Owner-occupied | Renter-occupied |
| Utility Gas | 12,051 (67.7%) | 3,332 (60.6%) |
| Bottled, Tank, or LP Gas | 1,938 (10.9%) | 305 (5.6%) |
| Electricity | 2,241 (12.6%) | 1,520 (27.6%) |
| Fuel Oil or Kerosene | 194 (1.1%) | 21 (0.4%) |
| Coal or Coke | 0 (0.0%) | 11 (0.2%) |
| All other Fuels | 1,340 (7.5%) | 281 (5.1%) |
| No Fuel Used | 26 (0.2%) | 30 (0.5%) |
| Total | 17,790 (100.0%) | 5,500 (100.0%) |
Household Vehicle Usage in Lyon County
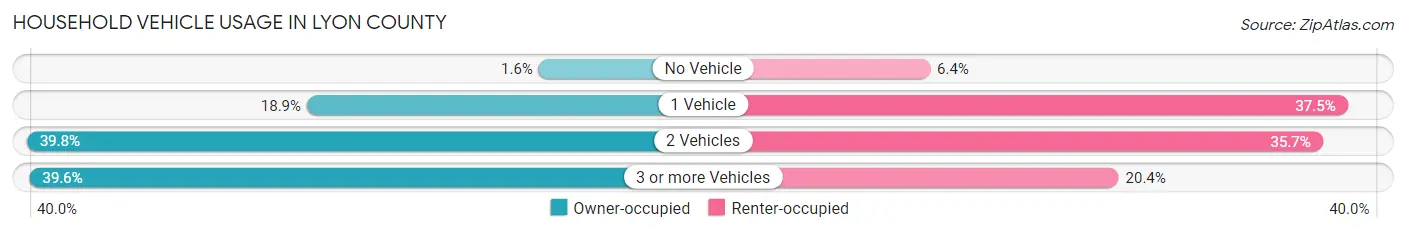
| Vehicles per Household | Owner-occupied | Renter-occupied |
| No Vehicle | 286 (1.6%) | 350 (6.4%) |
| 1 Vehicle | 3,365 (18.9%) | 2,064 (37.5%) |
| 2 Vehicles | 7,087 (39.8%) | 1,962 (35.7%) |
| 3 or more Vehicles | 7,052 (39.6%) | 1,124 (20.4%) |
| Total | 17,790 (100.0%) | 5,500 (100.0%) |
Real Estate & Mortgages in Lyon County
Real Estate and Mortgage Overview in Lyon County
| Characteristic | Without Mortgage | With Mortgage |
| Housing Units | 6,121 | 11,669 |
| Median Property Value | $267,800 | $335,100 |
| Median Household Income | $59,392 | $1,808 |
| Monthly Housing Costs | $429 | $487 |
| Real Estate Taxes | $1,294 | $574 |
Property Value by Mortgage Status in Lyon County
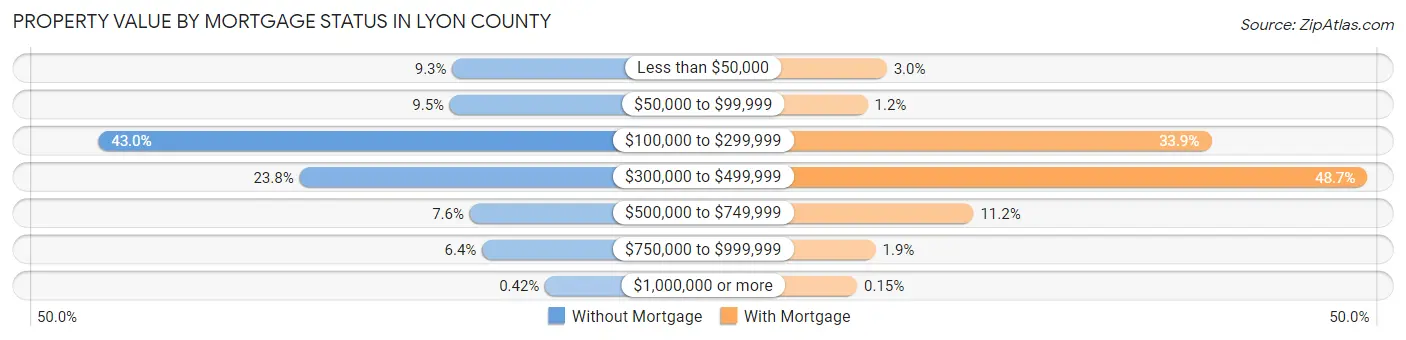
| Property Value | Without Mortgage | With Mortgage |
| Less than $50,000 | 567 (9.3%) | 346 (3.0%) |
| $50,000 to $99,999 | 581 (9.5%) | 134 (1.1%) |
| $100,000 to $299,999 | 2,631 (43.0%) | 3,952 (33.9%) |
| $300,000 to $499,999 | 1,458 (23.8%) | 5,687 (48.7%) |
| $500,000 to $749,999 | 465 (7.6%) | 1,310 (11.2%) |
| $750,000 to $999,999 | 393 (6.4%) | 223 (1.9%) |
| $1,000,000 or more | 26 (0.4%) | 17 (0.2%) |
| Total | 6,121 (100.0%) | 11,669 (100.0%) |
Household Income by Mortgage Status in Lyon County
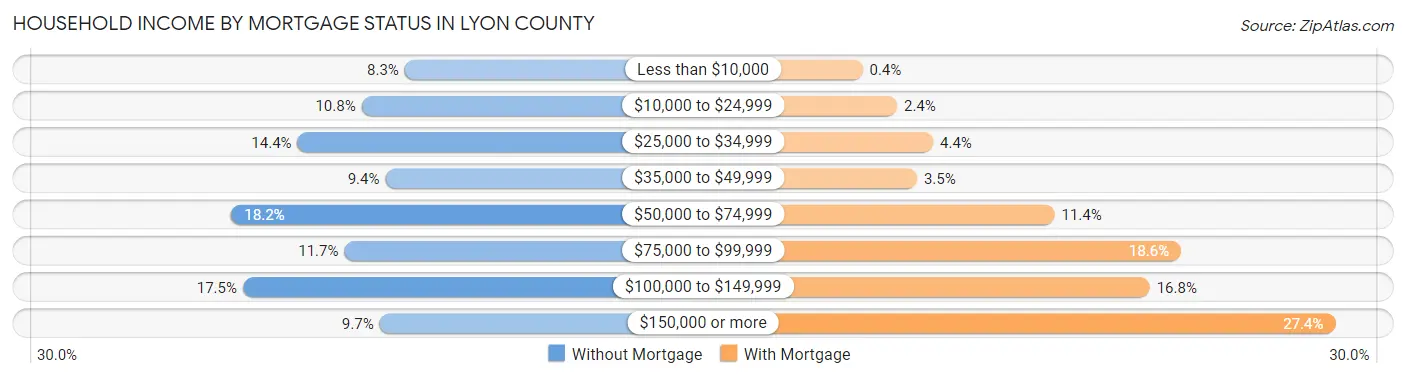
| Household Income | Without Mortgage | With Mortgage |
| Less than $10,000 | 507 (8.3%) | 47 (0.4%) |
| $10,000 to $24,999 | 658 (10.7%) | 277 (2.4%) |
| $25,000 to $34,999 | 882 (14.4%) | 517 (4.4%) |
| $35,000 to $49,999 | 575 (9.4%) | 409 (3.5%) |
| $50,000 to $74,999 | 1,113 (18.2%) | 1,327 (11.4%) |
| $75,000 to $99,999 | 718 (11.7%) | 2,170 (18.6%) |
| $100,000 to $149,999 | 1,073 (17.5%) | 1,962 (16.8%) |
| $150,000 or more | 595 (9.7%) | 3,199 (27.4%) |
| Total | 6,121 (100.0%) | 11,669 (100.0%) |
Property Value to Household Income Ratio in Lyon County
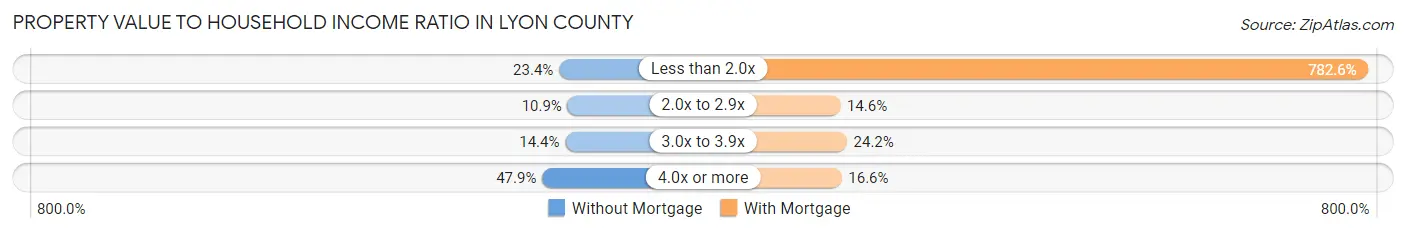
| Value-to-Income Ratio | Without Mortgage | With Mortgage |
| Less than 2.0x | 1,431 (23.4%) | 91,321 (782.6%) |
| 2.0x to 2.9x | 669 (10.9%) | 1,707 (14.6%) |
| 3.0x to 3.9x | 880 (14.4%) | 2,829 (24.2%) |
| 4.0x or more | 2,933 (47.9%) | 1,940 (16.6%) |
| Total | 6,121 (100.0%) | 11,669 (100.0%) |
Real Estate Taxes by Mortgage Status in Lyon County
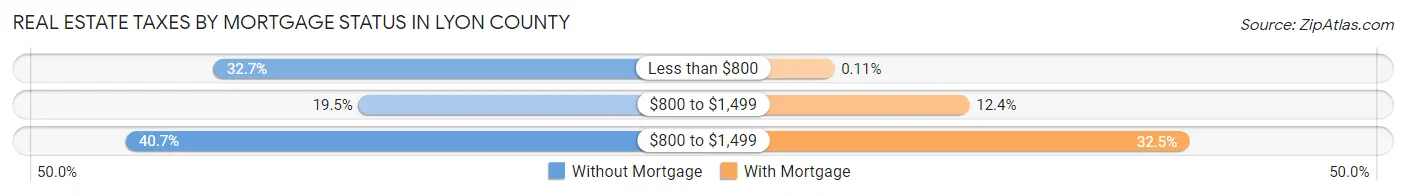
| Property Taxes | Without Mortgage | With Mortgage |
| Less than $800 | 2,002 (32.7%) | 13 (0.1%) |
| $800 to $1,499 | 1,193 (19.5%) | 1,452 (12.4%) |
| $800 to $1,499 | 2,494 (40.7%) | 3,794 (32.5%) |
| Total | 6,121 (100.0%) | 11,669 (100.0%) |
Health & Disability in Lyon County
Health Insurance Coverage by Age in Lyon County
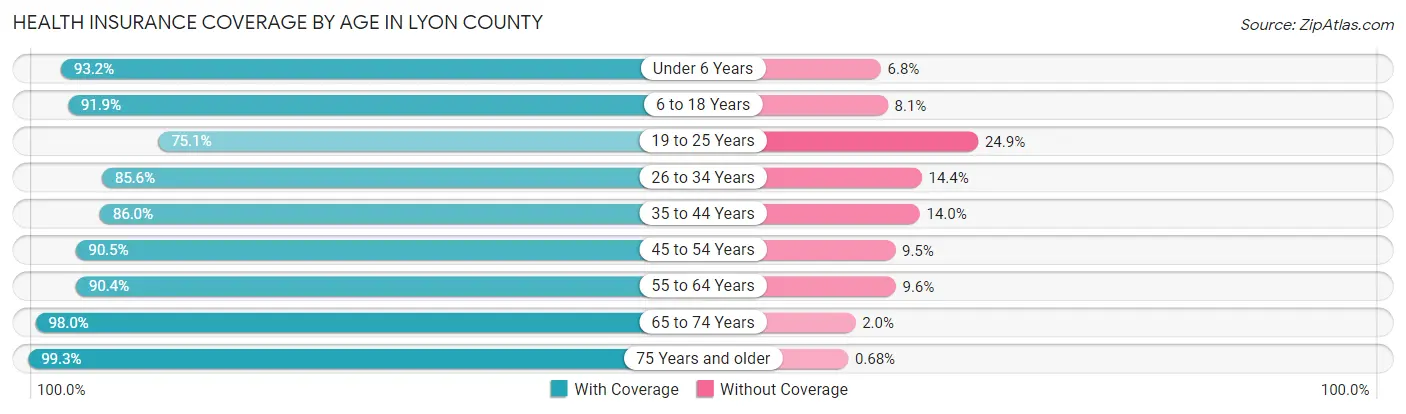
| Age Bracket | With Coverage | Without Coverage |
| Under 6 Years | 3,637 (93.2%) | 264 (6.8%) |
| 6 to 18 Years | 8,288 (91.9%) | 728 (8.1%) |
| 19 to 25 Years | 3,174 (75.1%) | 1,054 (24.9%) |
| 26 to 34 Years | 5,664 (85.6%) | 953 (14.4%) |
| 35 to 44 Years | 6,240 (86.0%) | 1,019 (14.0%) |
| 45 to 54 Years | 6,156 (90.5%) | 643 (9.5%) |
| 55 to 64 Years | 7,824 (90.4%) | 827 (9.6%) |
| 65 to 74 Years | 7,871 (98.0%) | 163 (2.0%) |
| 75 Years and older | 4,524 (99.3%) | 31 (0.7%) |
| Total | 53,378 (90.4%) | 5,682 (9.6%) |
Health Insurance Coverage by Citizenship Status in Lyon County
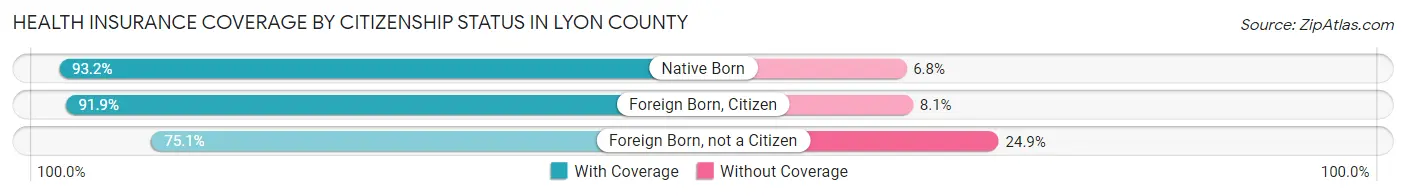
| Citizenship Status | With Coverage | Without Coverage |
| Native Born | 3,637 (93.2%) | 264 (6.8%) |
| Foreign Born, Citizen | 8,288 (91.9%) | 728 (8.1%) |
| Foreign Born, not a Citizen | 3,174 (75.1%) | 1,054 (24.9%) |
Health Insurance Coverage by Household Income in Lyon County
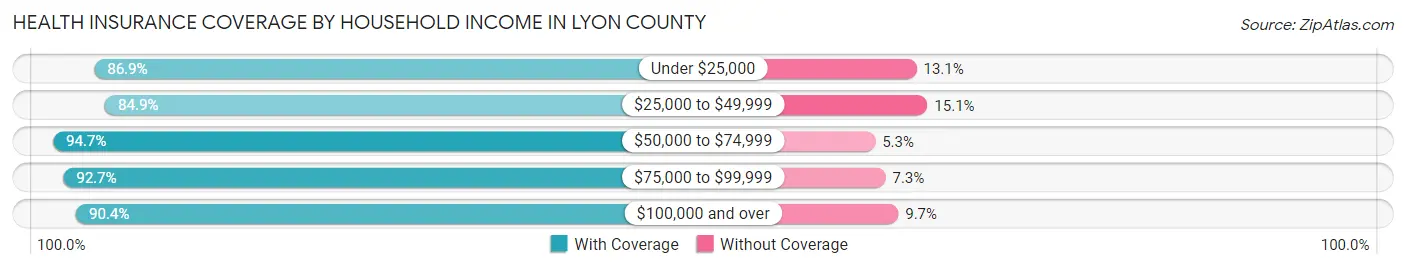
| Household Income | With Coverage | Without Coverage |
| Under $25,000 | 4,615 (86.9%) | 694 (13.1%) |
| $25,000 to $49,999 | 7,492 (84.9%) | 1,332 (15.1%) |
| $50,000 to $74,999 | 10,194 (94.7%) | 574 (5.3%) |
| $75,000 to $99,999 | 8,720 (92.7%) | 683 (7.3%) |
| $100,000 and over | 22,304 (90.3%) | 2,382 (9.7%) |
Public vs Private Health Insurance Coverage by Age in Lyon County
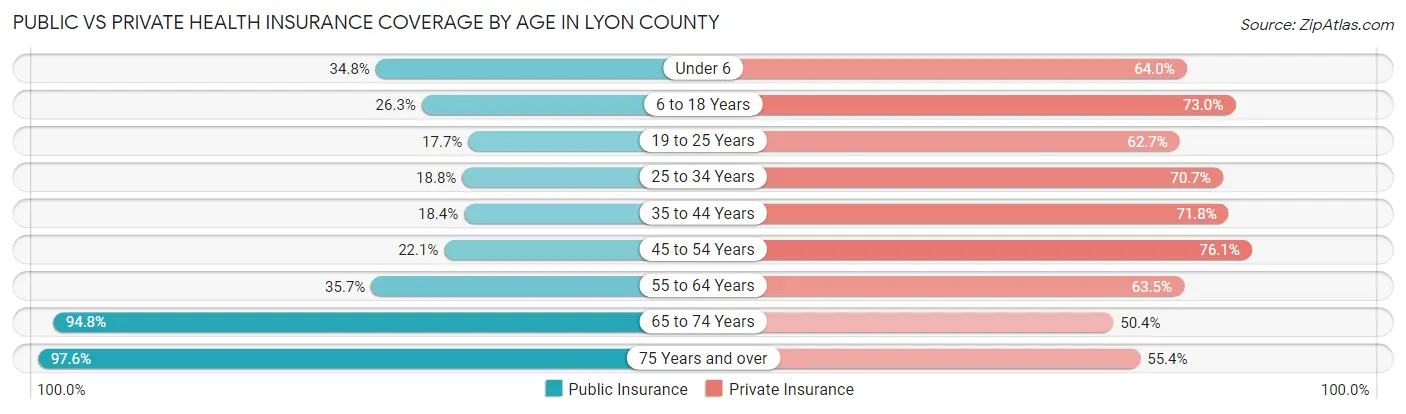
| Age Bracket | Public Insurance | Private Insurance |
| Under 6 | 1,359 (34.8%) | 2,496 (64.0%) |
| 6 to 18 Years | 2,371 (26.3%) | 6,580 (73.0%) |
| 19 to 25 Years | 747 (17.7%) | 2,650 (62.7%) |
| 25 to 34 Years | 1,243 (18.8%) | 4,676 (70.7%) |
| 35 to 44 Years | 1,338 (18.4%) | 5,210 (71.8%) |
| 45 to 54 Years | 1,504 (22.1%) | 5,172 (76.1%) |
| 55 to 64 Years | 3,086 (35.7%) | 5,492 (63.5%) |
| 65 to 74 Years | 7,612 (94.8%) | 4,048 (50.4%) |
| 75 Years and over | 4,444 (97.6%) | 2,524 (55.4%) |
| Total | 23,704 (40.1%) | 38,848 (65.8%) |
Disability Status by Sex by Age in Lyon County
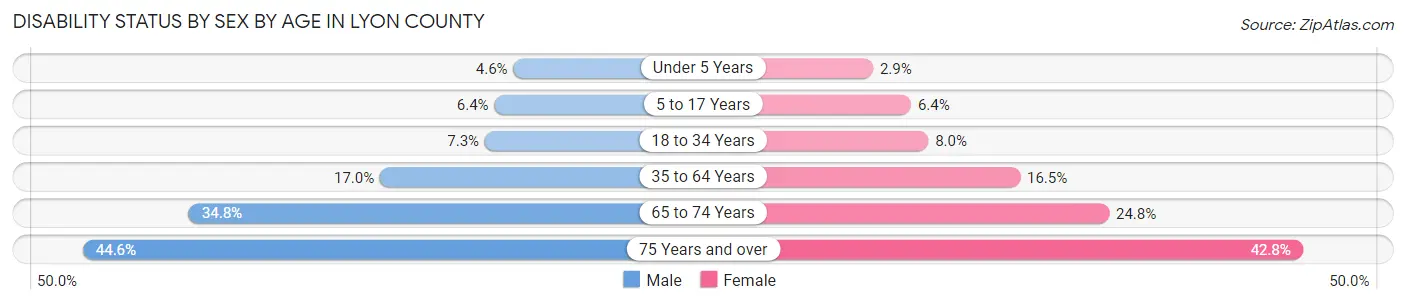
| Age Bracket | Male | Female |
| Under 5 Years | 74 (4.6%) | 44 (2.9%) |
| 5 to 17 Years | 311 (6.4%) | 284 (6.4%) |
| 18 to 34 Years | 431 (7.3%) | 436 (8.0%) |
| 35 to 64 Years | 2,014 (17.0%) | 1,798 (16.5%) |
| 65 to 74 Years | 1,402 (34.7%) | 992 (24.8%) |
| 75 Years and over | 1,001 (44.6%) | 988 (42.8%) |
Disability Class by Sex by Age in Lyon County
Disability Class: Hearing Difficulty
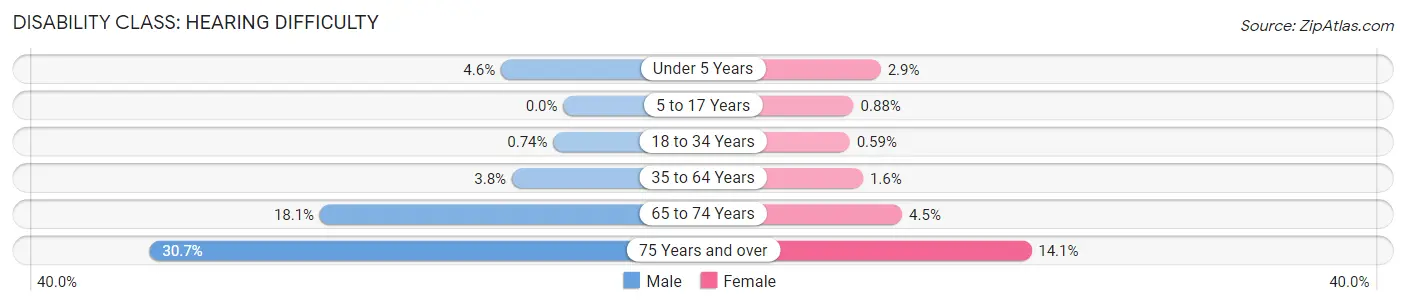
| Age Bracket | Male | Female |
| Under 5 Years | 74 (4.6%) | 44 (2.9%) |
| 5 to 17 Years | 0 (0.0%) | 39 (0.9%) |
| 18 to 34 Years | 44 (0.7%) | 32 (0.6%) |
| 35 to 64 Years | 452 (3.8%) | 171 (1.6%) |
| 65 to 74 Years | 729 (18.1%) | 179 (4.5%) |
| 75 Years and over | 690 (30.7%) | 325 (14.1%) |
Disability Class: Vision Difficulty
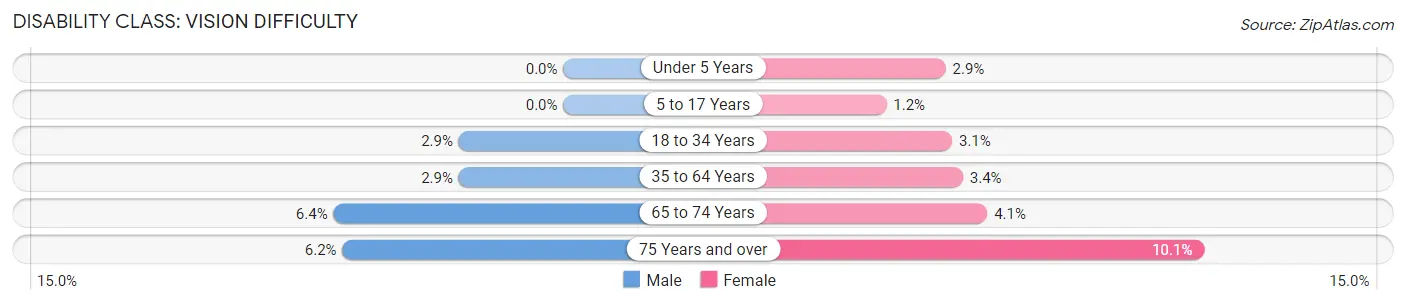
| Age Bracket | Male | Female |
| Under 5 Years | 0 (0.0%) | 44 (2.9%) |
| 5 to 17 Years | 0 (0.0%) | 55 (1.2%) |
| 18 to 34 Years | 172 (2.9%) | 167 (3.1%) |
| 35 to 64 Years | 344 (2.9%) | 366 (3.4%) |
| 65 to 74 Years | 258 (6.4%) | 162 (4.1%) |
| 75 Years and over | 138 (6.1%) | 233 (10.1%) |
Disability Class: Cognitive Difficulty
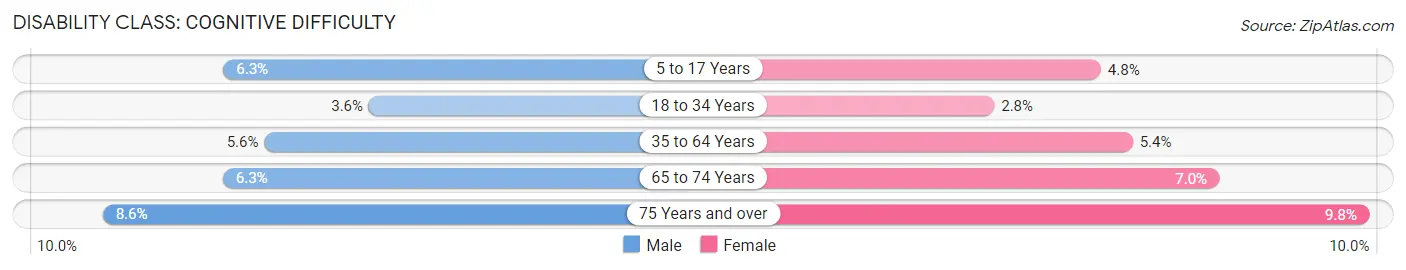
| Age Bracket | Male | Female |
| 5 to 17 Years | 307 (6.3%) | 213 (4.8%) |
| 18 to 34 Years | 214 (3.6%) | 154 (2.8%) |
| 35 to 64 Years | 657 (5.6%) | 587 (5.4%) |
| 65 to 74 Years | 255 (6.3%) | 280 (7.0%) |
| 75 Years and over | 192 (8.6%) | 226 (9.8%) |
Disability Class: Ambulatory Difficulty
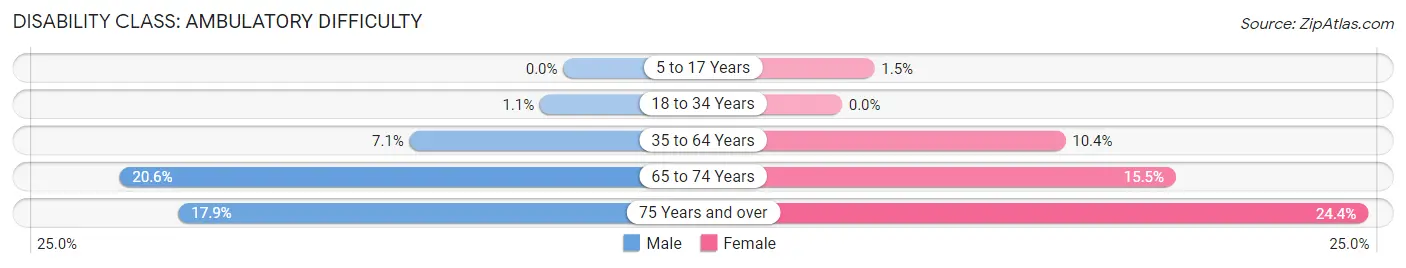
| Age Bracket | Male | Female |
| 5 to 17 Years | 0 (0.0%) | 67 (1.5%) |
| 18 to 34 Years | 64 (1.1%) | 0 (0.0%) |
| 35 to 64 Years | 844 (7.1%) | 1,127 (10.4%) |
| 65 to 74 Years | 831 (20.6%) | 620 (15.5%) |
| 75 Years and over | 401 (17.9%) | 564 (24.4%) |
Disability Class: Self-Care Difficulty
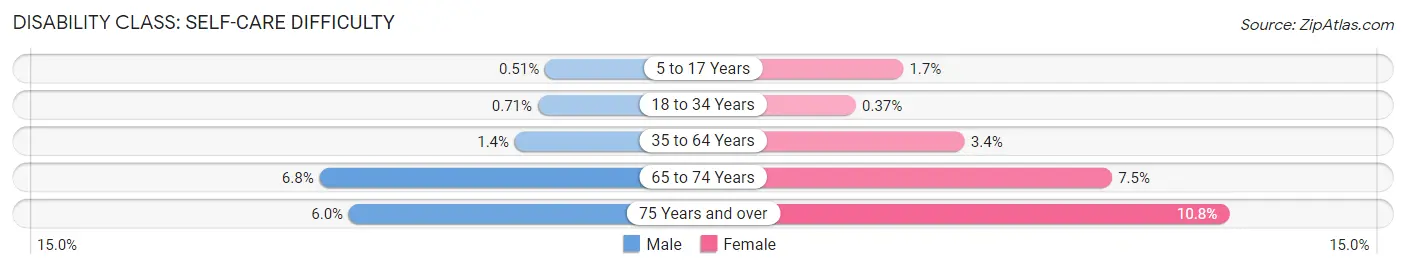
| Age Bracket | Male | Female |
| 5 to 17 Years | 25 (0.5%) | 75 (1.7%) |
| 18 to 34 Years | 42 (0.7%) | 20 (0.4%) |
| 35 to 64 Years | 160 (1.3%) | 369 (3.4%) |
| 65 to 74 Years | 274 (6.8%) | 300 (7.5%) |
| 75 Years and over | 134 (6.0%) | 249 (10.8%) |
Technology Access in Lyon County
Computing Device Access in Lyon County
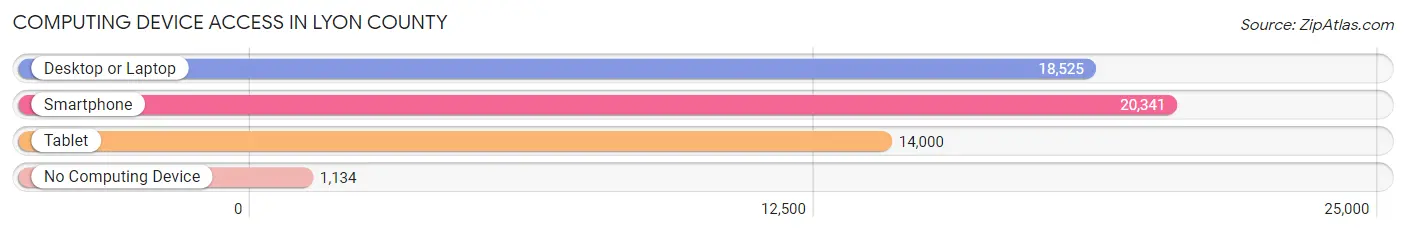
| Device Type | # Households | % Households |
| Desktop or Laptop | 18,525 | 79.5% |
| Smartphone | 20,341 | 87.3% |
| Tablet | 14,000 | 60.1% |
| No Computing Device | 1,134 | 4.9% |
| Total | 23,290 | 100.0% |
Internet Access in Lyon County
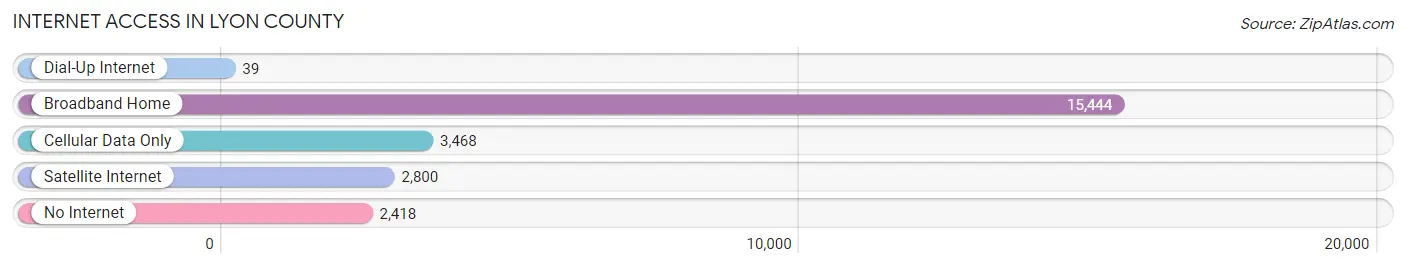
| Internet Type | # Households | % Households |
| Dial-Up Internet | 39 | 0.2% |
| Broadband Home | 15,444 | 66.3% |
| Cellular Data Only | 3,468 | 14.9% |
| Satellite Internet | 2,800 | 12.0% |
| No Internet | 2,418 | 10.4% |
| Total | 23,290 | 100.0% |
Lyon County Summary
Lyon County is located in the western part of the state of Nevada, and is bordered by Storey, Churchill, Mineral, and Douglas Counties. It is the third largest county in the state, with an area of 5,019 square miles. The county seat is Yerington, and the largest city is Fernley. The population of Lyon County was 54,541 in 2019, making it the fourth most populous county in Nevada.
History
Lyon County was established in 1861, and was named after Nathaniel Lyon, a Union general who was killed in the Civil War. The county was originally part of the Utah Territory, and was later part of the Nevada Territory. The county was created in 1861, and the first county seat was established in Dayton in 1862. In 1863, the county seat was moved to Yerington, where it remains today.
The county was originally populated by Native American tribes, including the Washoe, Paiute, and Shoshone. The first non-native settlers arrived in the 1860s, and the county quickly became a center for mining and ranching. The county was also home to several stagecoach lines, which connected the county to other parts of the state.
Geography
Lyon County is located in the western part of the state of Nevada, and is bordered by Storey, Churchill, Mineral, and Douglas Counties. It is the third largest county in the state, with an area of 5,019 square miles. The county is mostly mountainous, with the Sierra Nevada Mountains to the west and the Toiyabe Range to the east. The highest point in the county is Mount Grant, which has an elevation of 9,717 feet.
The county is home to several rivers, including the Walker River, the Carson River, and the Truckee River. The Walker River is the largest river in the county, and is a major source of irrigation for the area. The Carson River is the second largest river in the county, and is a popular destination for fishing and recreation.
Economy
Lyon County is a major agricultural center, with a variety of crops grown in the area. The county is also home to several large ranches, which raise cattle and sheep. Mining is also an important part of the economy, with gold, silver, and copper being mined in the area.
The county is also home to several manufacturing companies, including a large paper mill in Fernley. The county is also home to several casinos, which attract tourists from all over the world.
Demographics
As of 2019, the population of Lyon County was 54,541. The population is mostly white (83.3%), with smaller percentages of Hispanic (7.3%), Asian (3.2%), and African American (2.2%) residents. The median household income in the county is $54,845, and the median home value is $219,400.
The county is home to several large cities, including Yerington (population 3,845), Fernley (population 20,945), and Dayton (population 8,845). The county is also home to several smaller towns, including Silver Springs (population 1,845), Smith Valley (population 1,045), and Mason Valley (population 1,045).
Conclusion
Lyon County is a large and diverse county in the western part of Nevada. It is home to a variety of industries, including agriculture, mining, and manufacturing. The county is also home to several large cities, as well as several smaller towns. The population of the county is mostly white, with smaller percentages of Hispanic, Asian, and African American residents. The median household income in the county is $54,845, and the median home value is $219,400.
Common Questions
What is Per Capita Income in Lyon County?
Per Capita income in Lyon County is $36,330.
What is the Median Family Income in Lyon County?
Median Family Income in Lyon County is $84,189.
What is the Median Household income in Lyon County?
Median Household Income in Lyon County is $70,026.
What is Income or Wage Gap in Lyon County?
Income or Wage Gap in Lyon County is 34.7%.
Women in Lyon County earn 65.3 cents for every dollar earned by a man.
What is Family Income Deficit in Lyon County?
Family Income Deficit in Lyon County is $12,712.
Families that are below poverty line in Lyon County earn $12,712 less on average than the poverty threshold level.
What is Inequality or Gini Index in Lyon County?
Inequality or Gini Index in Lyon County is 0.42.
What is the Total Population of Lyon County?
Total Population of Lyon County is 59,435.
What is the Total Male Population of Lyon County?
Total Male Population of Lyon County is 30,802.
What is the Total Female Population of Lyon County?
Total Female Population of Lyon County is 28,633.
What is the Ratio of Males per 100 Females in Lyon County?
There are 107.58 Males per 100 Females in Lyon County.
What is the Ratio of Females per 100 Males in Lyon County?
There are 92.96 Females per 100 Males in Lyon County.
What is the Median Population Age in Lyon County?
Median Population Age in Lyon County is 43.2 Years.
What is the Average Family Size in Lyon County
Average Family Size in Lyon County is 3.1 People.
What is the Average Household Size in Lyon County
Average Household Size in Lyon County is 2.5 People.
How Large is the Labor Force in Lyon County?
There are 28,456 People in the Labor Forcein in Lyon County.
What is the Percentage of People in the Labor Force in Lyon County?
58.9% of People are in the Labor Force in Lyon County.
What is the Unemployment Rate in Lyon County?
Unemployment Rate in Lyon County is 7.2%.