Lander County, NV Map & Demographics
Lander County Map
Lander County Overview
$41,561
PER CAPITA INCOME
$101,968
AVG FAMILY INCOME
$92,388
AVG HOUSEHOLD INCOME
41.0%
WAGE / INCOME GAP [ % ]
59.0¢/ $1
WAGE / INCOME GAP [ $ ]
0.40
INEQUALITY / GINI INDEX
5,728
TOTAL POPULATION
3,109
MALE POPULATION
2,619
FEMALE POPULATION
118.71
MALES / 100 FEMALES
84.24
FEMALES / 100 MALES
40.0
MEDIAN AGE
3.0
AVG FAMILY SIZE
2.5
AVG HOUSEHOLD SIZE
2,644
LABOR FORCE [ PEOPLE ]
60.1%
PERCENT IN LABOR FORCE
11.7%
UNEMPLOYMENT RATE
Lander County Area Codes
Income in Lander County
Income Overview in Lander County
Per Capita Income in Lander County is $41,561, while median incomes of families and households are $101,968 and $92,388 respectively.
| Characteristic | Number | Measure |
| Per Capita Income | 5,728 | $41,561 |
| Median Family Income | 1,637 | $101,968 |
| Mean Family Income | 1,637 | $113,368 |
| Median Household Income | 2,256 | $92,388 |
| Mean Household Income | 2,256 | $102,279 |
| Income Deficit | 1,637 | $0 |
| Wage / Income Gap (%) | 5,728 | 41.01% |
| Wage / Income Gap ($) | 5,728 | 58.99¢ per $1 |
| Gini / Inequality Index | 5,728 | 0.40 |
Earnings by Sex in Lander County
Average Earnings in Lander County are $66,094, $80,721 for men and $47,616 for women, a difference of 41.0%.
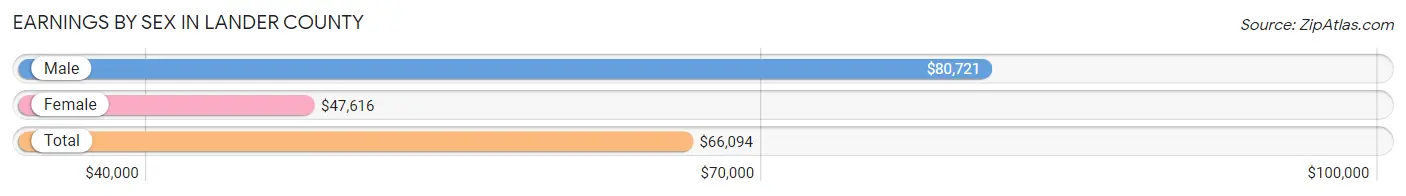
| Sex | Number | Average Earnings |
| Male | 1,691 (63.9%) | $80,721 |
| Female | 956 (36.1%) | $47,616 |
| Total | 2,647 (100.0%) | $66,094 |
Earnings by Sex by Income Bracket in Lander County
The most common earnings brackets in Lander County are $100,000+ for men (690 | 40.8%) and $75,000 to $99,999 for women (215 | 22.5%).
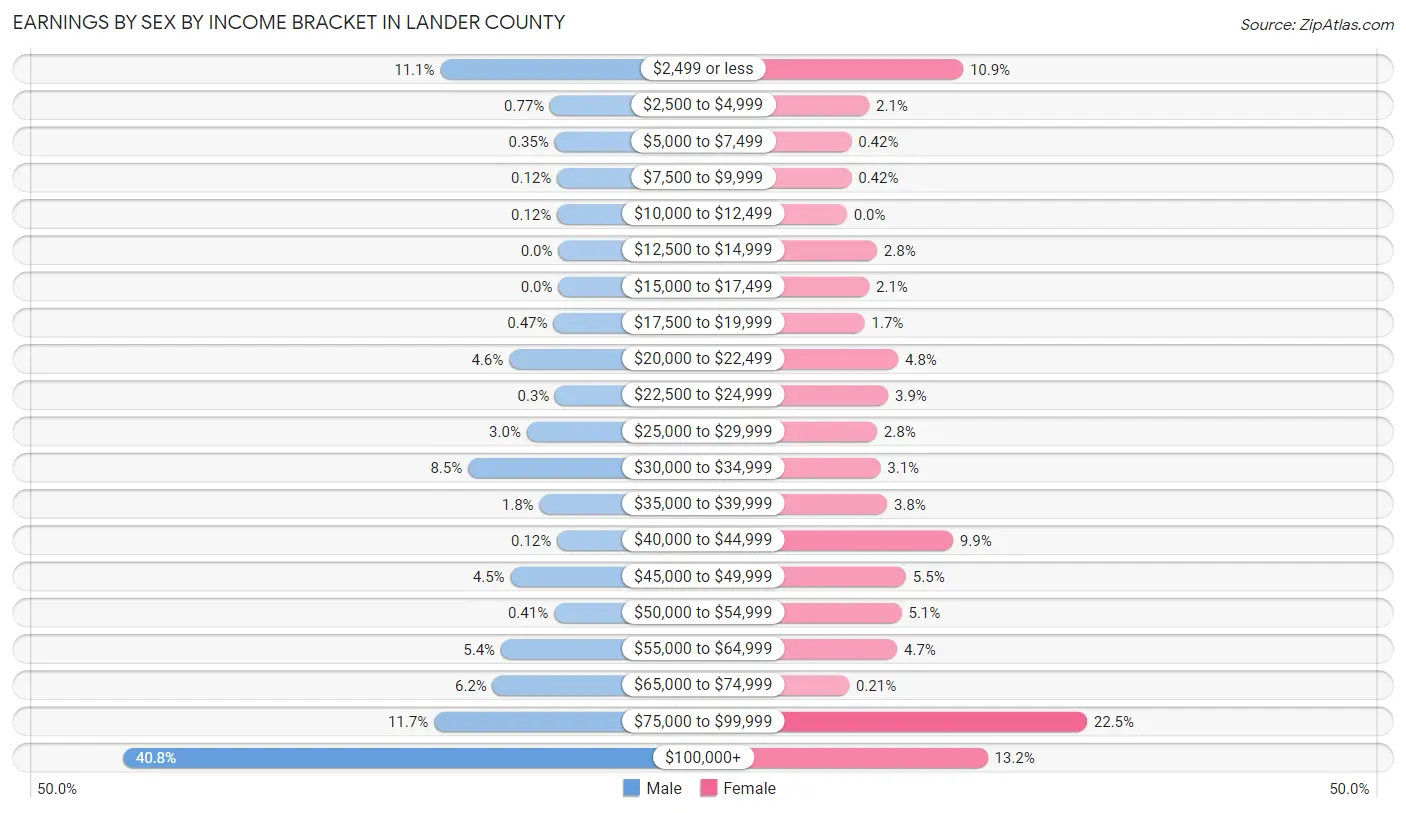
| Income | Male | Female |
| $2,499 or less | 187 (11.1%) | 104 (10.9%) |
| $2,500 to $4,999 | 13 (0.8%) | 20 (2.1%) |
| $5,000 to $7,499 | 6 (0.4%) | 4 (0.4%) |
| $7,500 to $9,999 | 2 (0.1%) | 4 (0.4%) |
| $10,000 to $12,499 | 2 (0.1%) | 0 (0.0%) |
| $12,500 to $14,999 | 0 (0.0%) | 27 (2.8%) |
| $15,000 to $17,499 | 0 (0.0%) | 20 (2.1%) |
| $17,500 to $19,999 | 8 (0.5%) | 16 (1.7%) |
| $20,000 to $22,499 | 78 (4.6%) | 46 (4.8%) |
| $22,500 to $24,999 | 5 (0.3%) | 37 (3.9%) |
| $25,000 to $29,999 | 50 (3.0%) | 27 (2.8%) |
| $30,000 to $34,999 | 143 (8.5%) | 30 (3.1%) |
| $35,000 to $39,999 | 30 (1.8%) | 36 (3.8%) |
| $40,000 to $44,999 | 2 (0.1%) | 95 (9.9%) |
| $45,000 to $49,999 | 76 (4.5%) | 53 (5.5%) |
| $50,000 to $54,999 | 7 (0.4%) | 49 (5.1%) |
| $55,000 to $64,999 | 91 (5.4%) | 45 (4.7%) |
| $65,000 to $74,999 | 104 (6.1%) | 2 (0.2%) |
| $75,000 to $99,999 | 197 (11.7%) | 215 (22.5%) |
| $100,000+ | 690 (40.8%) | 126 (13.2%) |
| Total | 1,691 (100.0%) | 956 (100.0%) |
Earnings by Sex by Educational Attainment in Lander County
Average earnings in Lander County are $86,360 for men and $53,852 for women, a difference of 37.6%. Men with an educational attainment of bachelor's degree enjoy the highest average annual earnings of $116,827, while those with high school diploma education earn the least with $71,944. Women with an educational attainment of college or associate's degree earn the most with the average annual earnings of $88,350, while those with high school diploma education have the smallest earnings of $23,041.
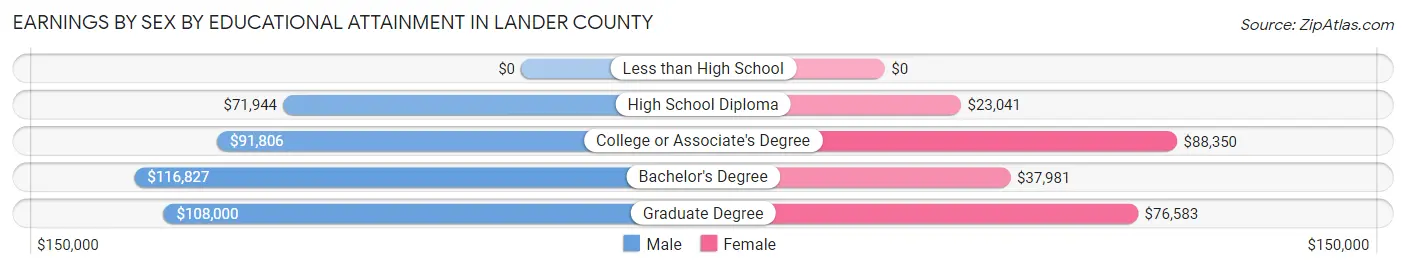
| Educational Attainment | Male Income | Female Income |
| Less than High School | - | - |
| High School Diploma | $71,944 | $23,041 |
| College or Associate's Degree | $91,806 | $88,350 |
| Bachelor's Degree | $116,827 | $37,981 |
| Graduate Degree | $108,000 | $76,583 |
| Total | $86,360 | $53,852 |
Family Income in Lander County
Family Income Brackets in Lander County
According to the Lander County family income data, there are 578 families falling into the $100,000 to $149,999 income range, which is the most common income bracket and makes up 35.3% of all families.
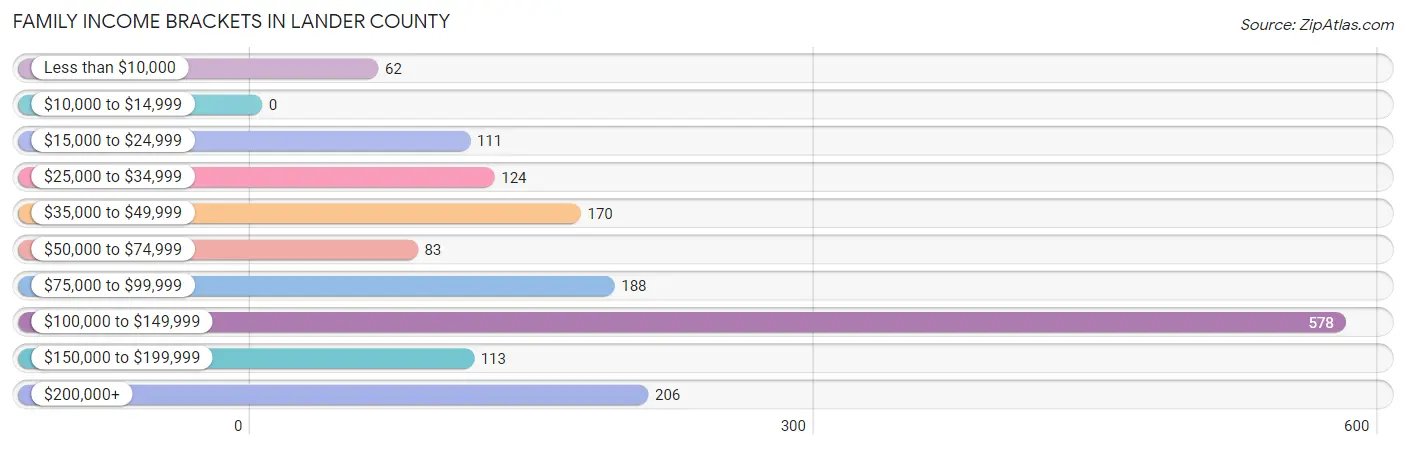
| Income Bracket | # Families | % Families |
| Less than $10,000 | 62 | 3.8% |
| $10,000 to $14,999 | 0 | 0.0% |
| $15,000 to $24,999 | 111 | 6.8% |
| $25,000 to $34,999 | 124 | 7.6% |
| $35,000 to $49,999 | 170 | 10.4% |
| $50,000 to $74,999 | 83 | 5.1% |
| $75,000 to $99,999 | 188 | 11.5% |
| $100,000 to $149,999 | 578 | 35.3% |
| $150,000 to $199,999 | 113 | 6.9% |
| $200,000+ | 206 | 12.6% |
Family Income by Famaliy Size in Lander County
5-person families (58 | 3.5%) account for the highest median family income in Lander County with $179,412 per family, while 2-person families (761 | 46.5%) have the highest median income of $42,485 per family member.
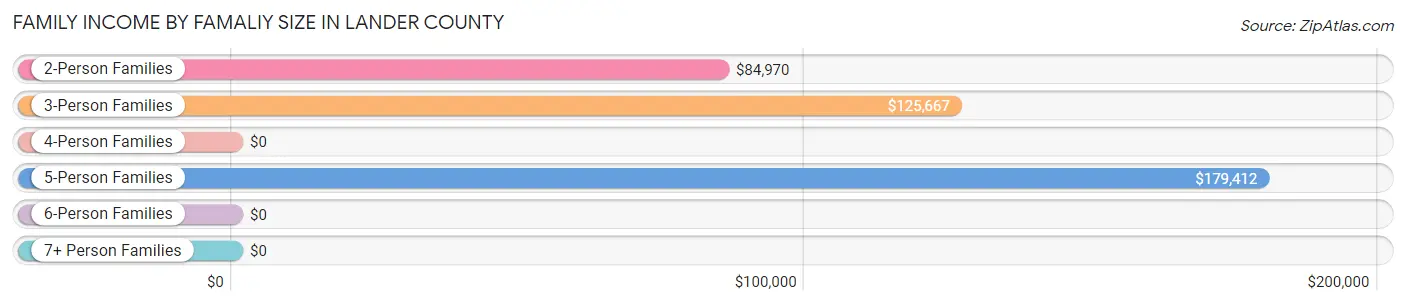
| Income Bracket | # Families | Median Income |
| 2-Person Families | 761 (46.5%) | $84,970 |
| 3-Person Families | 478 (29.2%) | $125,667 |
| 4-Person Families | 287 (17.5%) | $0 |
| 5-Person Families | 58 (3.5%) | $179,412 |
| 6-Person Families | 14 (0.9%) | $0 |
| 7+ Person Families | 39 (2.4%) | $0 |
| Total | 1,637 (100.0%) | $101,968 |
Family Income by Number of Earners in Lander County
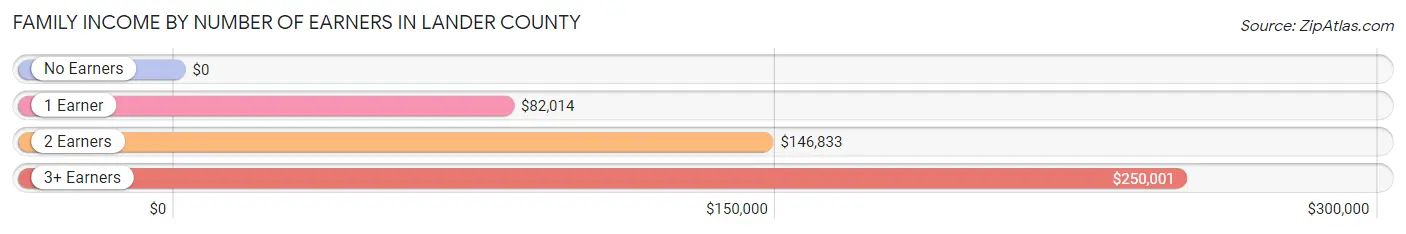
| Number of Earners | # Families | Median Income |
| No Earners | 239 (14.6%) | $0 |
| 1 Earner | 821 (50.1%) | $82,014 |
| 2 Earners | 484 (29.6%) | $146,833 |
| 3+ Earners | 93 (5.7%) | $250,001 |
| Total | 1,637 (100.0%) | $101,968 |
Household Income in Lander County
Household Income Brackets in Lander County
With 744 households falling in the category, the $100,000 to $149,999 income range is the most frequent in Lander County, accounting for 33.0% of all households. In contrast, only 47 households (2.1%) fall into the $10,000 to $14,999 income bracket, making it the least populous group.
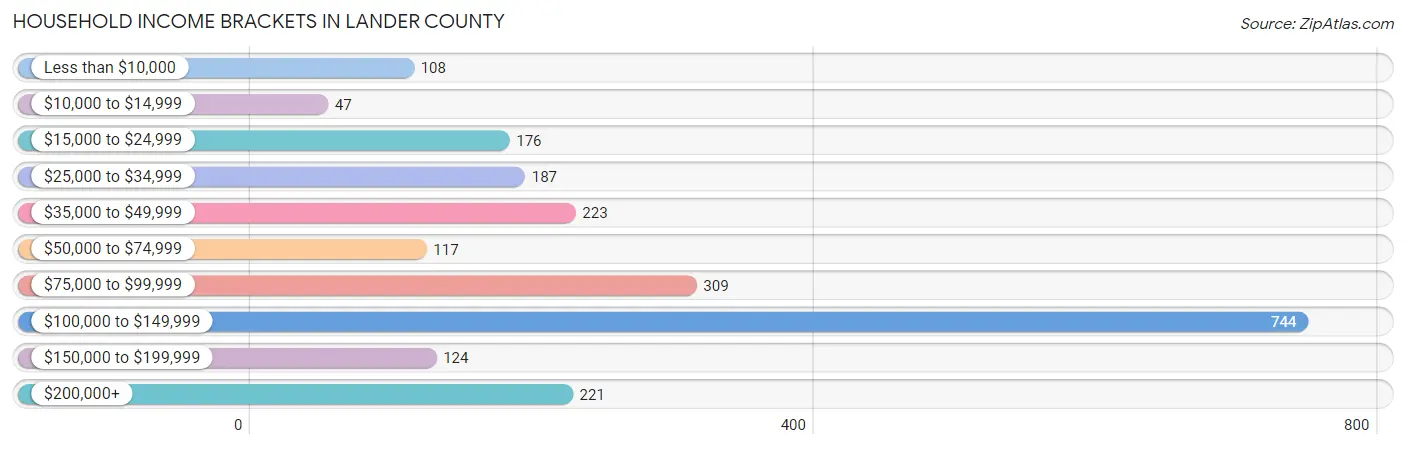
| Income Bracket | # Households | % Households |
| Less than $10,000 | 108 | 4.8% |
| $10,000 to $14,999 | 47 | 2.1% |
| $15,000 to $24,999 | 176 | 7.8% |
| $25,000 to $34,999 | 187 | 8.3% |
| $35,000 to $49,999 | 223 | 9.9% |
| $50,000 to $74,999 | 117 | 5.2% |
| $75,000 to $99,999 | 309 | 13.7% |
| $100,000 to $149,999 | 744 | 33.0% |
| $150,000 to $199,999 | 124 | 5.5% |
| $200,000+ | 221 | 9.8% |
Household Income by Householder Age in Lander County
The median household income in Lander County is $92,388, with the highest median household income of $104,984 found in the 45 to 64 years age bracket for the primary householder. A total of 897 households (39.8%) fall into this category. Meanwhile, the 15 to 24 years age bracket for the primary householder has the lowest median household income of $0, with 52 households (2.3%) in this group.
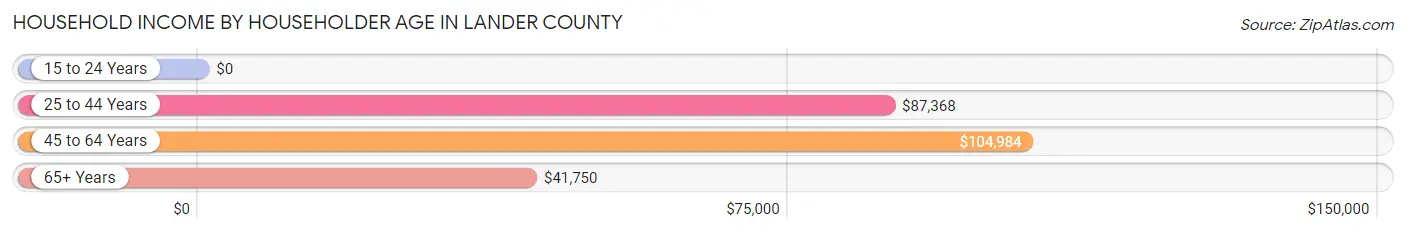
| Income Bracket | # Households | Median Income |
| 15 to 24 Years | 52 (2.3%) | $0 |
| 25 to 44 Years | 850 (37.7%) | $87,368 |
| 45 to 64 Years | 897 (39.8%) | $104,984 |
| 65+ Years | 457 (20.3%) | $41,750 |
| Total | 2,256 (100.0%) | $92,388 |
Poverty in Lander County
Income Below Poverty by Sex and Age in Lander County
With 9.4% poverty level for males and 12.4% for females among the residents of Lander County, 12 to 14 year old males and 5 year old females are the most vulnerable to poverty, with 48 males (32.0%) and 12 females (66.7%) in their respective age groups living below the poverty level.
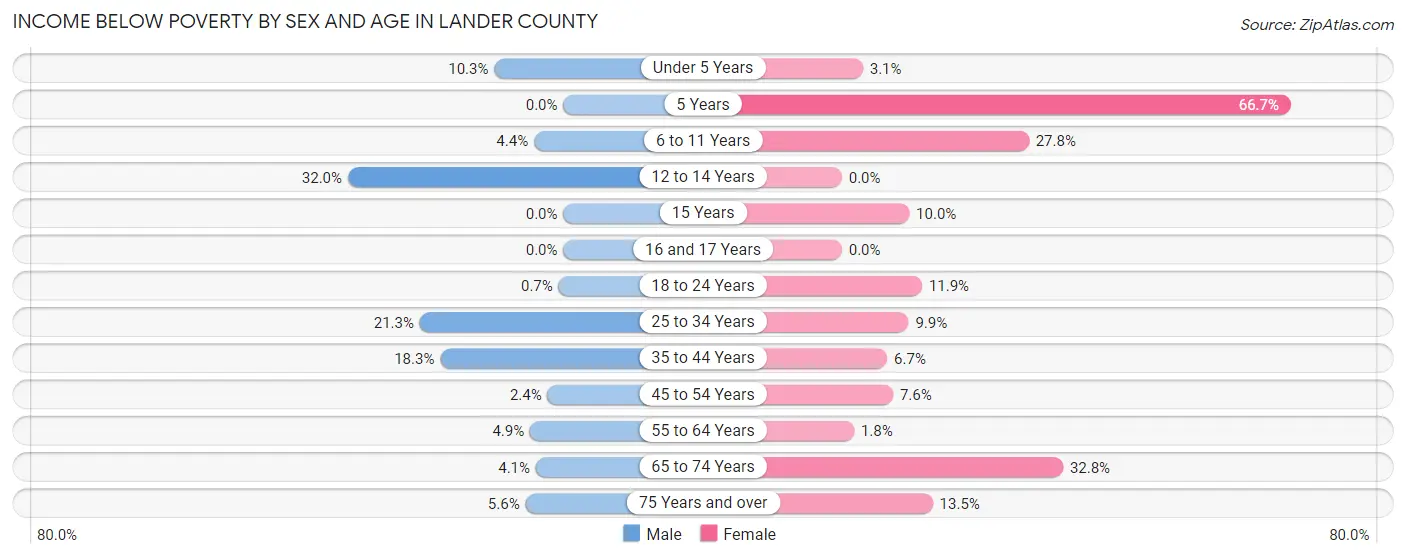
| Age Bracket | Male | Female |
| Under 5 Years | 4 (10.3%) | 5 (3.1%) |
| 5 Years | 0 (0.0%) | 12 (66.7%) |
| 6 to 11 Years | 17 (4.4%) | 98 (27.8%) |
| 12 to 14 Years | 48 (32.0%) | 0 (0.0%) |
| 15 Years | 0 (0.0%) | 4 (10.0%) |
| 16 and 17 Years | 0 (0.0%) | 0 (0.0%) |
| 18 to 24 Years | 2 (0.7%) | 10 (11.9%) |
| 25 to 34 Years | 87 (21.3%) | 29 (9.9%) |
| 35 to 44 Years | 85 (18.3%) | 19 (6.7%) |
| 45 to 54 Years | 8 (2.4%) | 31 (7.6%) |
| 55 to 64 Years | 22 (4.9%) | 7 (1.8%) |
| 65 to 74 Years | 12 (4.1%) | 89 (32.8%) |
| 75 Years and over | 5 (5.6%) | 17 (13.5%) |
| Total | 290 (9.4%) | 321 (12.4%) |
Income Above Poverty by Sex and Age in Lander County
According to the poverty statistics in Lander County, males aged 15 years and females aged 12 to 14 years are the age groups that are most secure financially, with 100.0% of males and 100.0% of females in these age groups living above the poverty line.
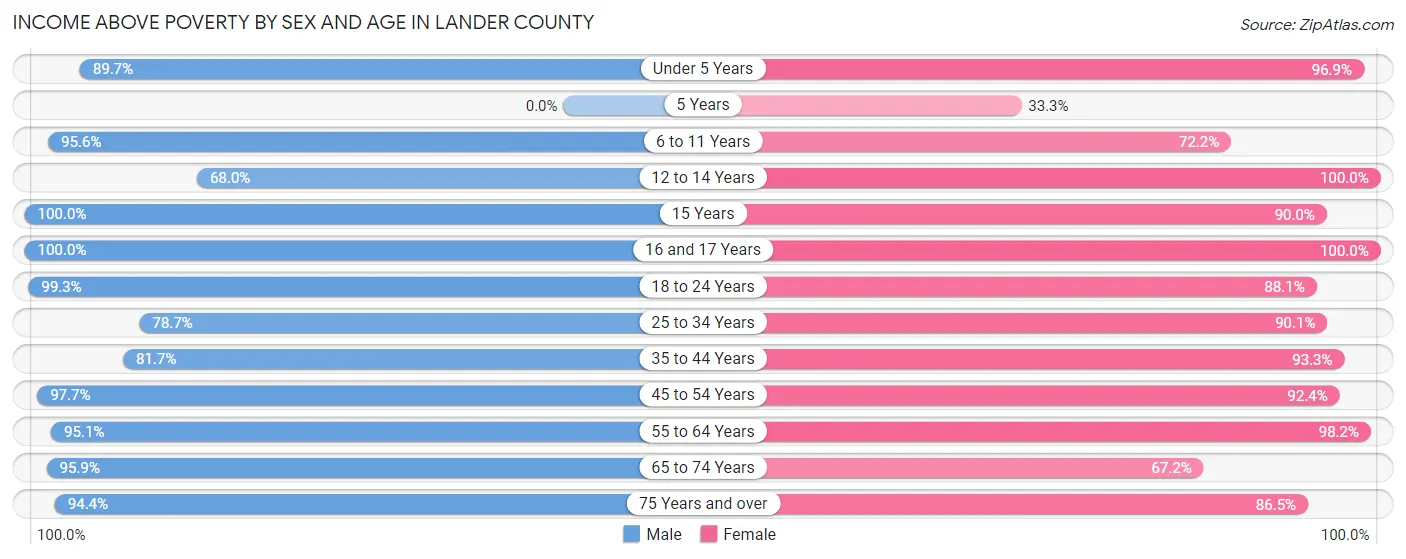
| Age Bracket | Male | Female |
| Under 5 Years | 35 (89.7%) | 155 (96.9%) |
| 5 Years | 0 (0.0%) | 6 (33.3%) |
| 6 to 11 Years | 373 (95.6%) | 255 (72.2%) |
| 12 to 14 Years | 102 (68.0%) | 55 (100.0%) |
| 15 Years | 120 (100.0%) | 36 (90.0%) |
| 16 and 17 Years | 57 (100.0%) | 121 (100.0%) |
| 18 to 24 Years | 282 (99.3%) | 74 (88.1%) |
| 25 to 34 Years | 321 (78.7%) | 264 (90.1%) |
| 35 to 44 Years | 380 (81.7%) | 263 (93.3%) |
| 45 to 54 Years | 332 (97.7%) | 377 (92.4%) |
| 55 to 64 Years | 423 (95.1%) | 380 (98.2%) |
| 65 to 74 Years | 282 (95.9%) | 182 (67.2%) |
| 75 Years and over | 84 (94.4%) | 109 (86.5%) |
| Total | 2,791 (90.6%) | 2,277 (87.6%) |
Income Below Poverty Among Married-Couple Families in Lander County
The poverty statistics for married-couple families in Lander County show that 1.2% or 14 of the total 1,138 families live below the poverty line. Families with 3 or 4 children have the highest poverty rate of 28.2%, comprising of 11 families. On the other hand, families with 1 or 2 children have the lowest poverty rate of 0.0%, which includes 0 families.
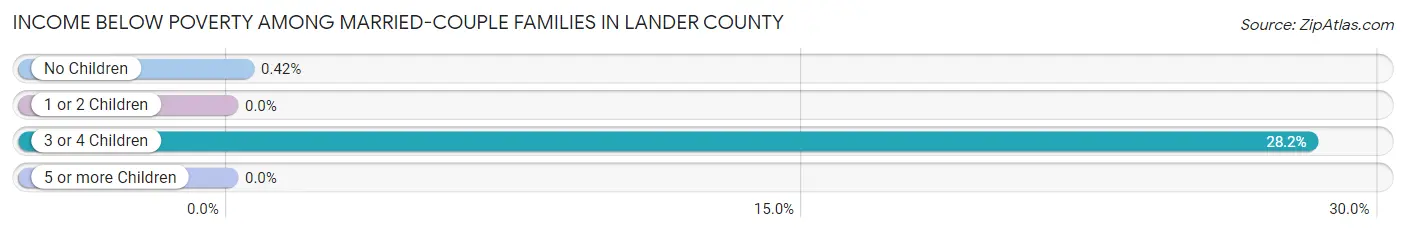
| Children | Above Poverty | Below Poverty |
| No Children | 704 (99.6%) | 3 (0.4%) |
| 1 or 2 Children | 375 (100.0%) | 0 (0.0%) |
| 3 or 4 Children | 28 (71.8%) | 11 (28.2%) |
| 5 or more Children | 17 (100.0%) | 0 (0.0%) |
| Total | 1,124 (98.8%) | 14 (1.2%) |
Income Below Poverty Among Single-Parent Households in Lander County
According to the poverty data in Lander County, 18.0% or 63 single-father households and 48.0% or 72 single-mother households are living below the poverty line. Among single-father households, those with 1 or 2 children have the highest poverty rate, with 63 households (20.0%) experiencing poverty. Likewise, among single-mother households, those with 3 or 4 children have the highest poverty rate, with 5 households (100.0%) falling below the poverty line.
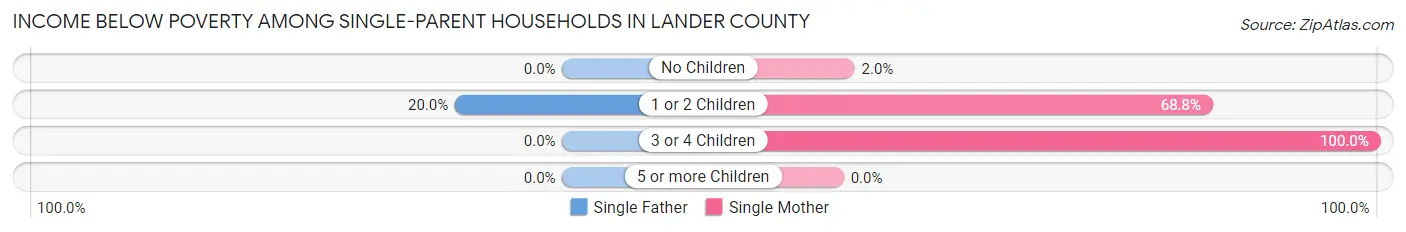
| Children | Single Father | Single Mother |
| No Children | 0 (0.0%) | 1 (2.0%) |
| 1 or 2 Children | 63 (20.0%) | 66 (68.8%) |
| 3 or 4 Children | 0 (0.0%) | 5 (100.0%) |
| 5 or more Children | 0 (0.0%) | 0 (0.0%) |
| Total | 63 (18.0%) | 72 (48.0%) |
Income Below Poverty Among Married-Couple vs Single-Parent Households in Lander County
The poverty data for Lander County shows that 14 of the married-couple family households (1.2%) and 135 of the single-parent households (27.1%) are living below the poverty level. Within the married-couple family households, those with 3 or 4 children have the highest poverty rate, with 11 households (28.2%) falling below the poverty line. Among the single-parent households, those with 3 or 4 children have the highest poverty rate, with 5 household (100.0%) living below poverty.
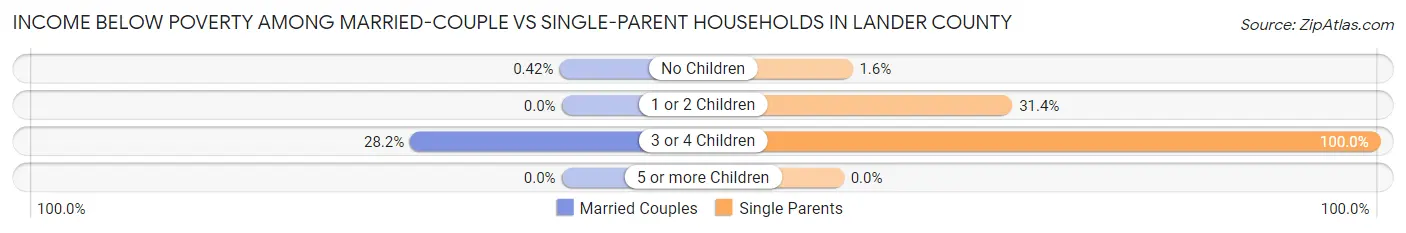
| Children | Married-Couple Families | Single-Parent Households |
| No Children | 3 (0.4%) | 1 (1.6%) |
| 1 or 2 Children | 0 (0.0%) | 129 (31.4%) |
| 3 or 4 Children | 11 (28.2%) | 5 (100.0%) |
| 5 or more Children | 0 (0.0%) | 0 (0.0%) |
| Total | 14 (1.2%) | 135 (27.1%) |
Race in Lander County
The most populous races in Lander County are White / Caucasian (4,858 | 84.8%), Hispanic or Latino (1,229 | 21.5%), and Two or more Races (373 | 6.5%).
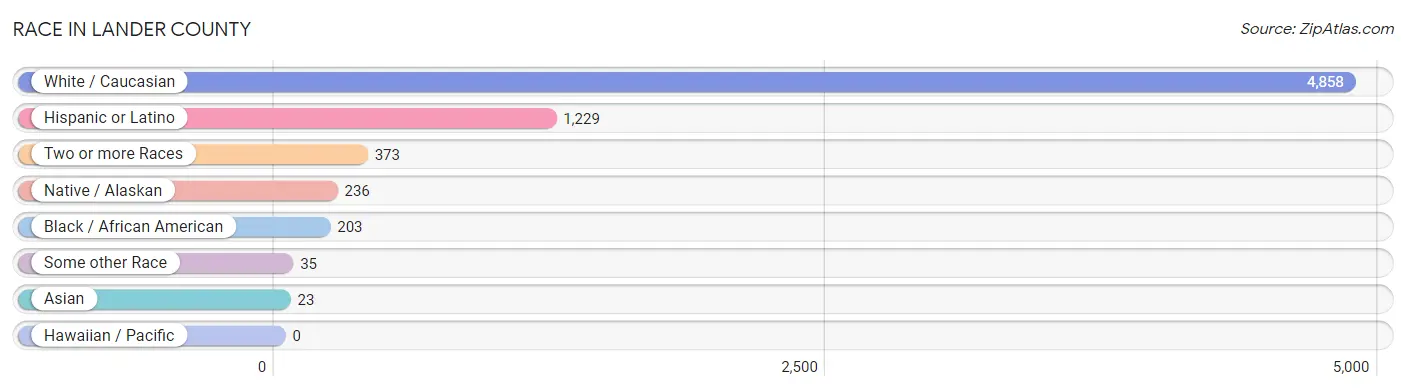
| Race | # Population | % Population |
| Asian | 23 | 0.4% |
| Black / African American | 203 | 3.5% |
| Hawaiian / Pacific | 0 | 0.0% |
| Hispanic or Latino | 1,229 | 21.5% |
| Native / Alaskan | 236 | 4.1% |
| White / Caucasian | 4,858 | 84.8% |
| Two or more Races | 373 | 6.5% |
| Some other Race | 35 | 0.6% |
| Total | 5,728 | 100.0% |
Ancestry in Lander County
The most populous ancestries reported in Lander County are Mexican (1,151 | 20.1%), German (879 | 15.3%), English (552 | 9.6%), American (496 | 8.7%), and Irish (458 | 8.0%), together accounting for 61.7% of all Lander County residents.
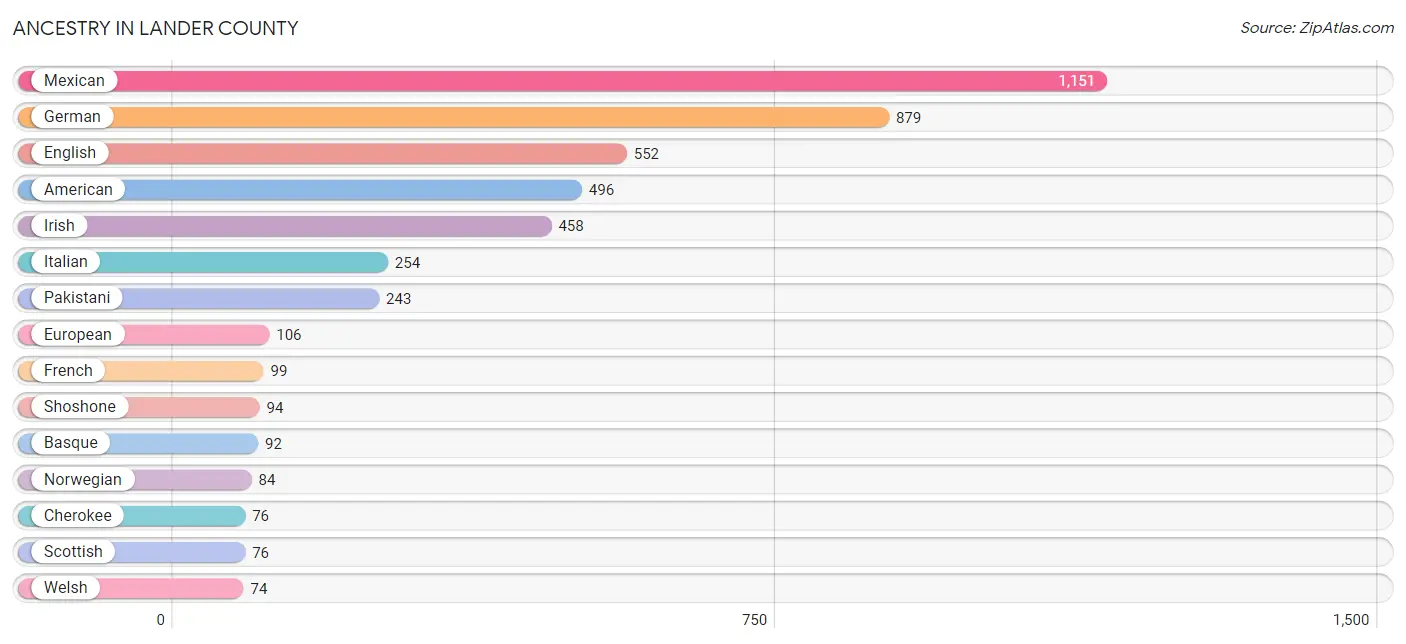
| Ancestry | # Population | % Population |
| American | 496 | 8.7% |
| Basque | 92 | 1.6% |
| British | 57 | 1.0% |
| Canadian | 15 | 0.3% |
| Cherokee | 76 | 1.3% |
| Colombian | 27 | 0.5% |
| Danish | 55 | 1.0% |
| Dutch | 22 | 0.4% |
| English | 552 | 9.6% |
| European | 106 | 1.8% |
| Finnish | 52 | 0.9% |
| French | 99 | 1.7% |
| French Canadian | 51 | 0.9% |
| German | 879 | 15.3% |
| Greek | 53 | 0.9% |
| Hungarian | 49 | 0.9% |
| Irish | 458 | 8.0% |
| Italian | 254 | 4.4% |
| Mexican | 1,151 | 20.1% |
| Mexican American Indian | 57 | 1.0% |
| Norwegian | 84 | 1.5% |
| Paiute | 7 | 0.1% |
| Pakistani | 243 | 4.2% |
| Polish | 41 | 0.7% |
| Portuguese | 12 | 0.2% |
| Russian | 25 | 0.4% |
| Scotch-Irish | 63 | 1.1% |
| Scottish | 76 | 1.3% |
| Shoshone | 94 | 1.6% |
| South African | 10 | 0.2% |
| South American | 27 | 0.5% |
| Spaniard | 51 | 0.9% |
| Subsaharan African | 10 | 0.2% |
| Swedish | 47 | 0.8% |
| Thai | 7 | 0.1% |
| Welsh | 74 | 1.3% | View All 36 Rows |
Immigrants in Lander County
The most numerous immigrant groups reported in Lander County came from Central America (300 | 5.2%), Latin America (300 | 5.2%), Mexico (300 | 5.2%), Asia (23 | 0.4%), and Philippines (23 | 0.4%), together accounting for 16.5% of all Lander County residents.
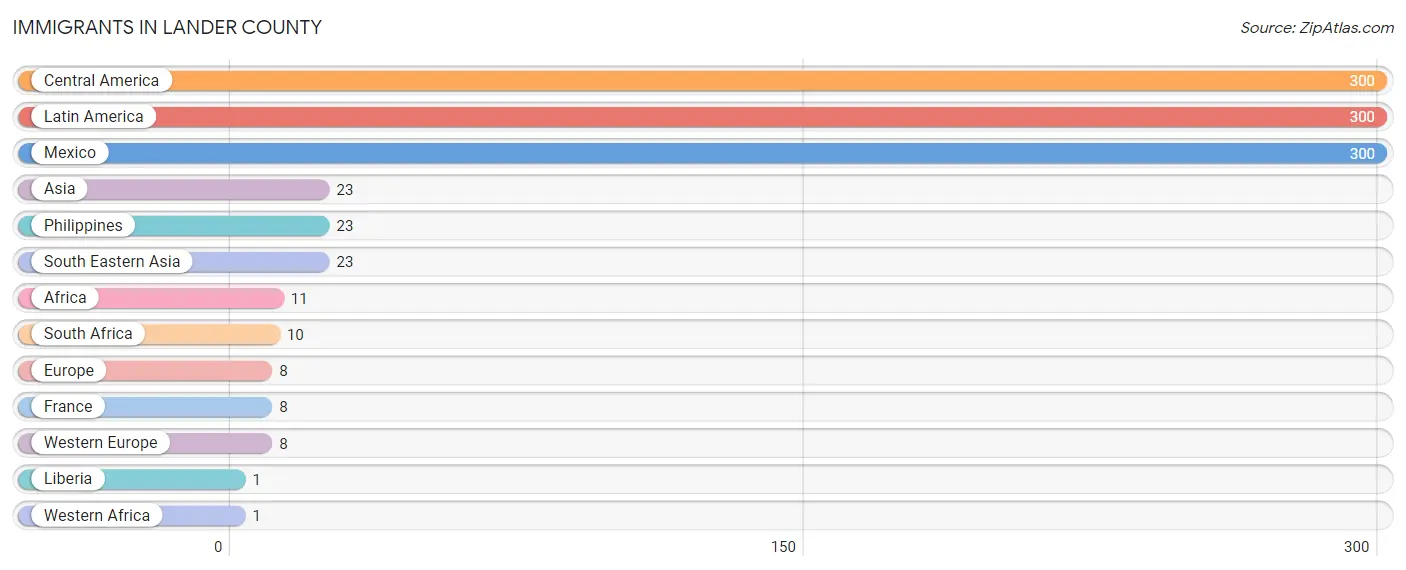
| Immigration Origin | # Population | % Population |
| Africa | 11 | 0.2% |
| Asia | 23 | 0.4% |
| Central America | 300 | 5.2% |
| Europe | 8 | 0.1% |
| France | 8 | 0.1% |
| Latin America | 300 | 5.2% |
| Liberia | 1 | 0.0% |
| Mexico | 300 | 5.2% |
| Philippines | 23 | 0.4% |
| South Africa | 10 | 0.2% |
| South Eastern Asia | 23 | 0.4% |
| Western Africa | 1 | 0.0% |
| Western Europe | 8 | 0.1% | View All 13 Rows |
Sex and Age in Lander County
Sex and Age in Lander County
The most populous age groups in Lander County are 55 to 59 Years (326 | 10.5%) for men and 50 to 54 Years (259 | 9.9%) for women.
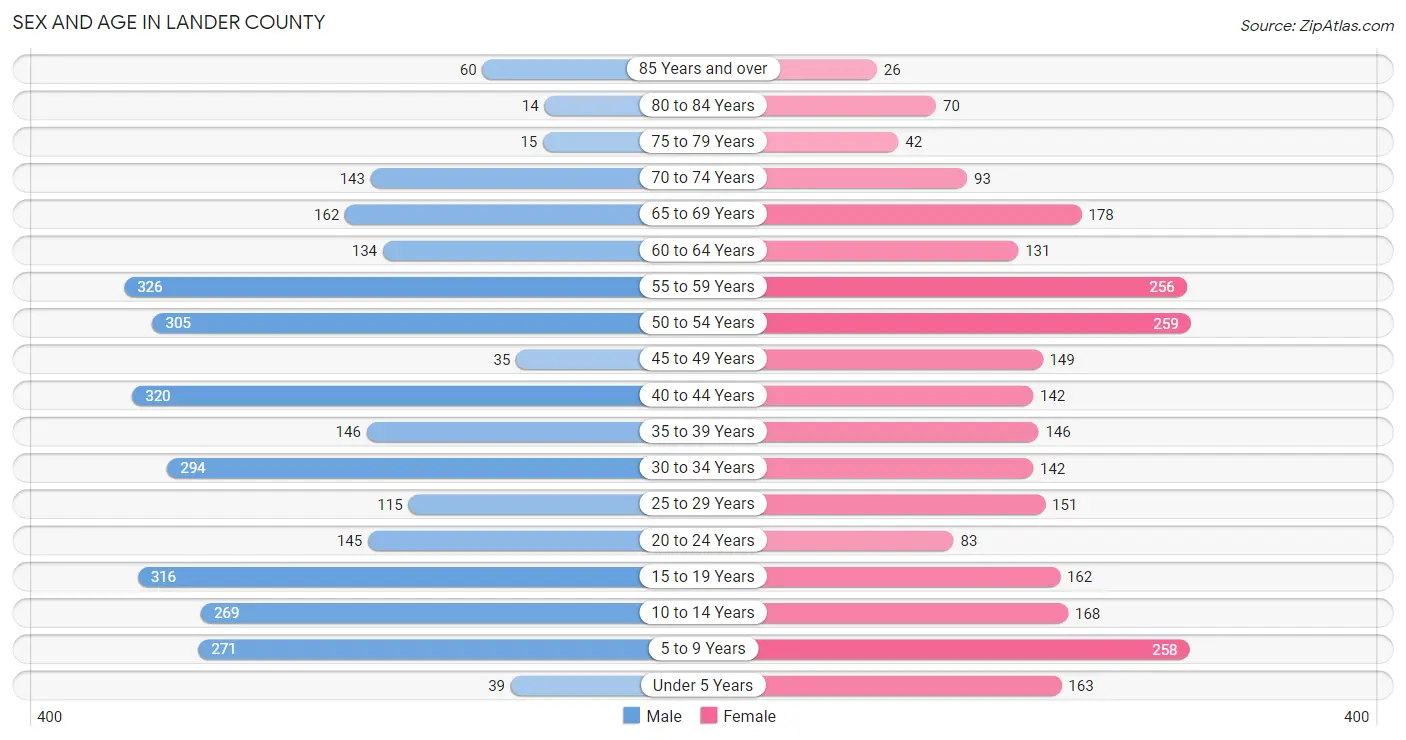
| Age Bracket | Male | Female |
| Under 5 Years | 39 (1.3%) | 163 (6.2%) |
| 5 to 9 Years | 271 (8.7%) | 258 (9.9%) |
| 10 to 14 Years | 269 (8.6%) | 168 (6.4%) |
| 15 to 19 Years | 316 (10.2%) | 162 (6.2%) |
| 20 to 24 Years | 145 (4.7%) | 83 (3.2%) |
| 25 to 29 Years | 115 (3.7%) | 151 (5.8%) |
| 30 to 34 Years | 294 (9.5%) | 142 (5.4%) |
| 35 to 39 Years | 146 (4.7%) | 146 (5.6%) |
| 40 to 44 Years | 320 (10.3%) | 142 (5.4%) |
| 45 to 49 Years | 35 (1.1%) | 149 (5.7%) |
| 50 to 54 Years | 305 (9.8%) | 259 (9.9%) |
| 55 to 59 Years | 326 (10.5%) | 256 (9.8%) |
| 60 to 64 Years | 134 (4.3%) | 131 (5.0%) |
| 65 to 69 Years | 162 (5.2%) | 178 (6.8%) |
| 70 to 74 Years | 143 (4.6%) | 93 (3.5%) |
| 75 to 79 Years | 15 (0.5%) | 42 (1.6%) |
| 80 to 84 Years | 14 (0.4%) | 70 (2.7%) |
| 85 Years and over | 60 (1.9%) | 26 (1.0%) |
| Total | 3,109 (100.0%) | 2,619 (100.0%) |
Families and Households in Lander County
Median Family Size in Lander County
The median family size in Lander County is 2.97 persons per family, with single female/mother families (150 | 9.2%) accounting for the largest median family size of 3.15 persons per family. On the other hand, single male/father families (349 | 21.3%) represent the smallest median family size with 2.68 persons per family.
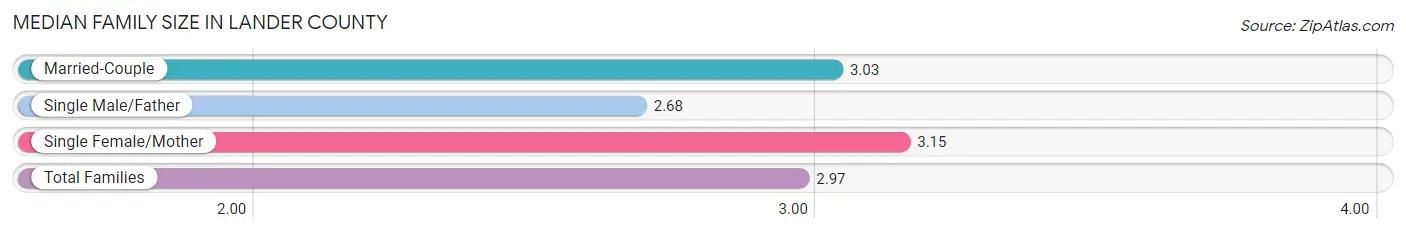
| Family Type | # Families | Family Size |
| Married-Couple | 1,138 (69.5%) | 3.03 |
| Single Male/Father | 349 (21.3%) | 2.68 |
| Single Female/Mother | 150 (9.2%) | 3.15 |
| Total Families | 1,637 (100.0%) | 2.97 |
Median Household Size in Lander County
The median household size in Lander County is 2.51 persons per household, with single female/mother households (150 | 6.7%) accounting for the largest median household size of 3.72 persons per household. non-family households (619 | 27.4%) represent the smallest median household size with 1.06 persons per household.
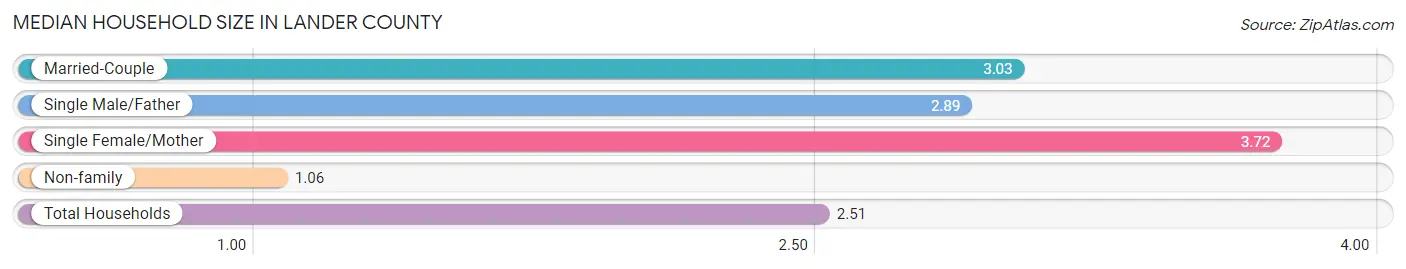
| Household Type | # Households | Household Size |
| Married-Couple | 1,138 (50.4%) | 3.03 |
| Single Male/Father | 349 (15.5%) | 2.89 |
| Single Female/Mother | 150 (6.7%) | 3.72 |
| Non-family | 619 (27.4%) | 1.06 |
| Total Households | 2,256 (100.0%) | 2.51 |
Household Size by Marriage Status in Lander County
Out of a total of 2,256 households in Lander County, 1,637 (72.6%) are family households, while 619 (27.4%) are nonfamily households. The most numerous type of family households are 2-person households, comprising 717, and the most common type of nonfamily households are 1-person households, comprising 576.
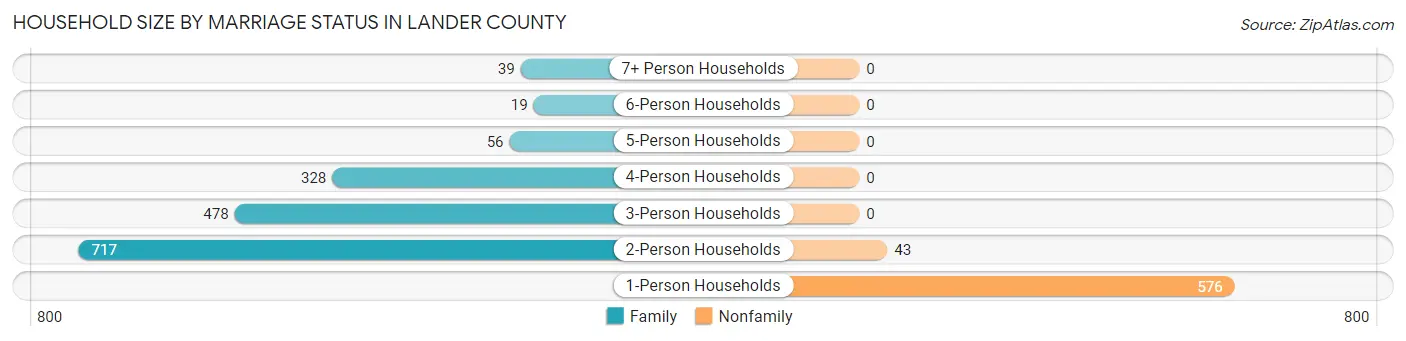
| Household Size | Family Households | Nonfamily Households |
| 1-Person Households | - | 576 (25.5%) |
| 2-Person Households | 717 (31.8%) | 43 (1.9%) |
| 3-Person Households | 478 (21.2%) | 0 (0.0%) |
| 4-Person Households | 328 (14.5%) | 0 (0.0%) |
| 5-Person Households | 56 (2.5%) | 0 (0.0%) |
| 6-Person Households | 19 (0.8%) | 0 (0.0%) |
| 7+ Person Households | 39 (1.7%) | 0 (0.0%) |
| Total | 1,637 (72.6%) | 619 (27.4%) |
Female Fertility in Lander County
Fertility by Age in Lander County
Average fertility rate in Lander County is 47.0 births per 1,000 women. Women in the age bracket of 20 to 34 years have the highest fertility rate with 128.0 births per 1,000 women. Women in the age bracket of 20 to 34 years acount for 100.0% of all women with births.
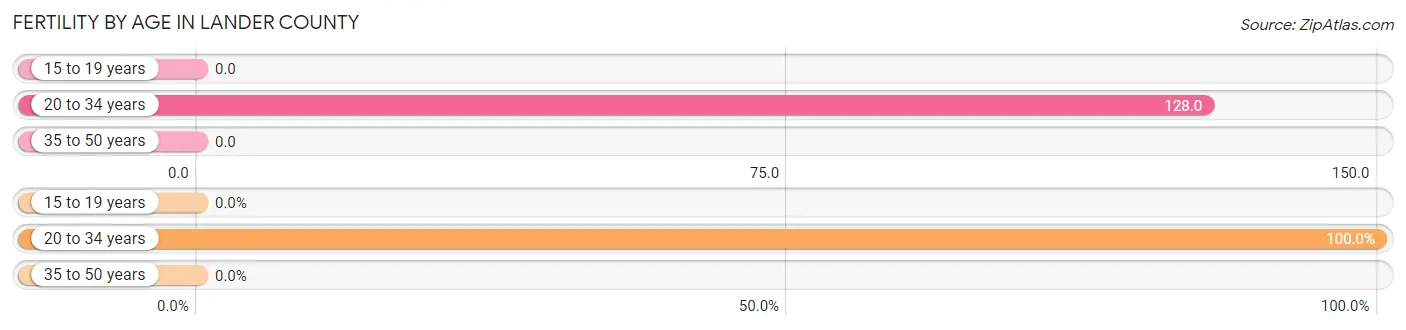
| Age Bracket | Women with Births | Births / 1,000 Women |
| 15 to 19 years | 0 (0.0%) | 0.0 |
| 20 to 34 years | 48 (100.0%) | 128.0 |
| 35 to 50 years | 0 (0.0%) | 0.0 |
| Total | 48 (100.0%) | 47.0 |
Fertility by Age by Marriage Status in Lander County
89.6% of women with births (48) in Lander County are married. The highest percentage of unmarried women with births falls into 20 to 34 years age bracket with 10.4% of them unmarried at the time of birth, while the lowest percentage of unmarried women with births belong to 20 to 34 years age bracket with 10.4% of them unmarried.
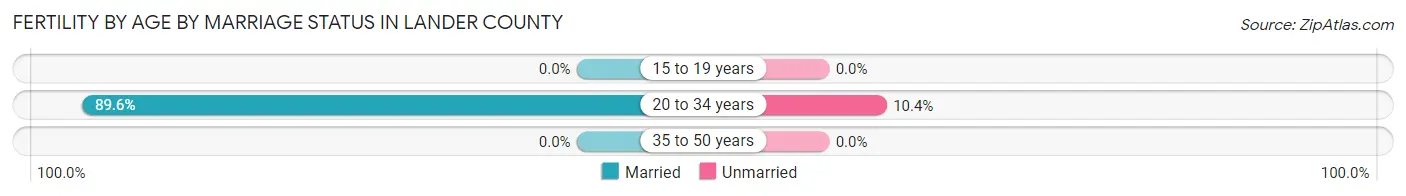
| Age Bracket | Married | Unmarried |
| 15 to 19 years | 0 (0.0%) | 0 (0.0%) |
| 20 to 34 years | 43 (89.6%) | 5 (10.4%) |
| 35 to 50 years | 0 (0.0%) | 0 (0.0%) |
| Total | 43 (89.6%) | 5 (10.4%) |
Fertility by Education in Lander County
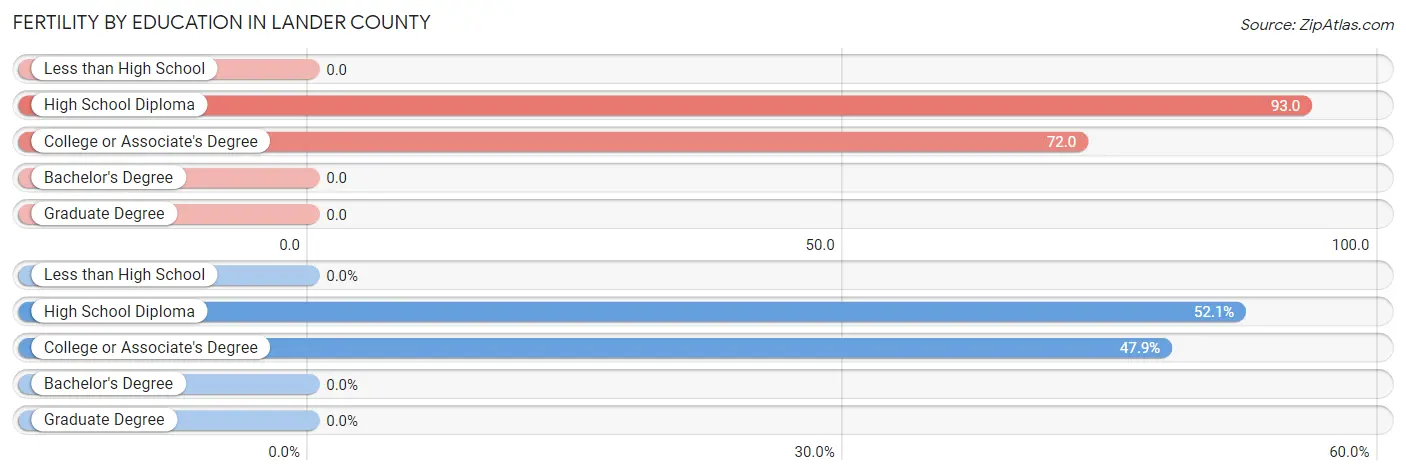
| Educational Attainment | Women with Births | Births / 1,000 Women |
| Less than High School | 0 (0.0%) | 0.0 |
| High School Diploma | 25 (52.1%) | 93.0 |
| College or Associate's Degree | 23 (47.9%) | 72.0 |
| Bachelor's Degree | 0 (0.0%) | 0.0 |
| Graduate Degree | 0 (0.0%) | 0.0 |
| Total | 48 (100.0%) | 47.0 |
Fertility by Education by Marriage Status in Lander County
10.4% of women with births in Lander County are unmarried. Women with the educational attainment of college or associate's degree are most likely to be married with 100.0% of them married at childbirth, while women with the educational attainment of high school diploma are least likely to be married with 20.0% of them unmarried at childbirth.
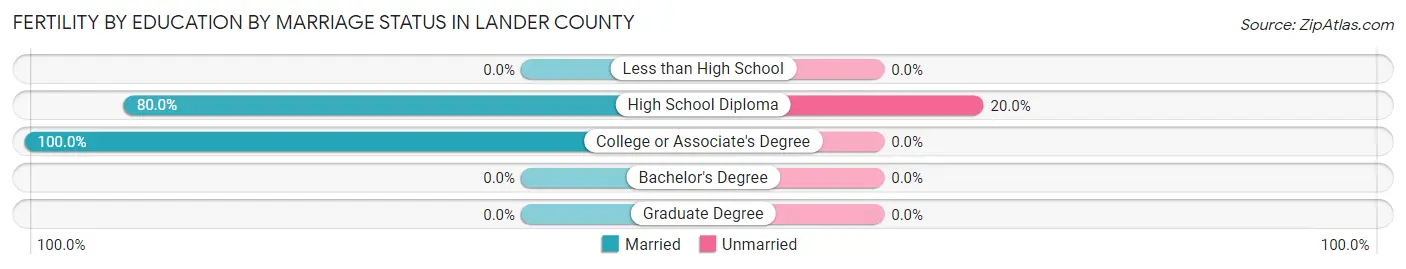
| Educational Attainment | Married | Unmarried |
| Less than High School | 0 (0.0%) | 0 (0.0%) |
| High School Diploma | 20 (80.0%) | 5 (20.0%) |
| College or Associate's Degree | 23 (100.0%) | 0 (0.0%) |
| Bachelor's Degree | 0 (0.0%) | 0 (0.0%) |
| Graduate Degree | 0 (0.0%) | 0 (0.0%) |
| Total | 43 (89.6%) | 5 (10.4%) |
Employment Characteristics in Lander County
Employment by Class of Employer in Lander County
Among the 2,335 employed individuals in Lander County, private company employees (1,610 | 69.0%), local government employees (310 | 13.3%), and federal government employees (170 | 7.3%) make up the most common classes of employment.
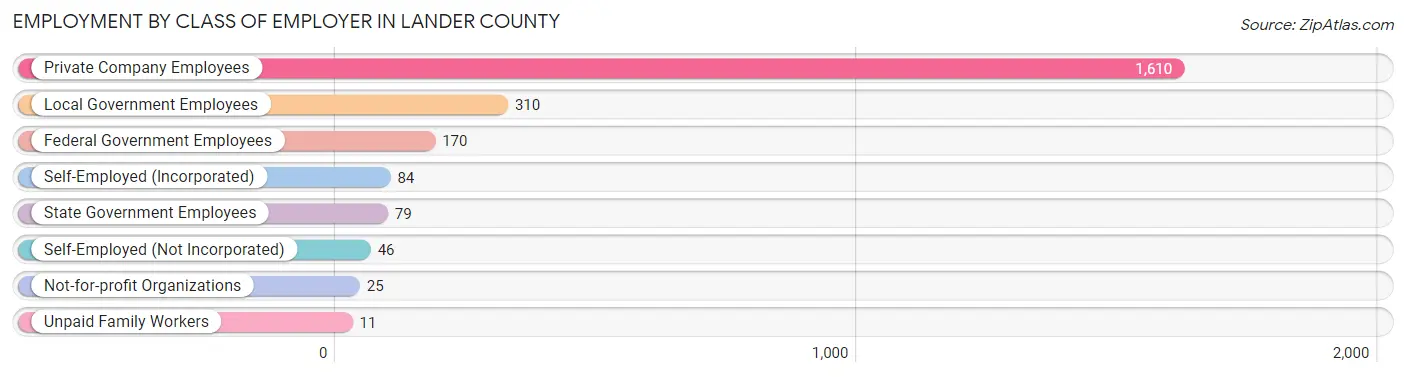
| Employer Class | # Employees | % Employees |
| Private Company Employees | 1,610 | 69.0% |
| Self-Employed (Incorporated) | 84 | 3.6% |
| Self-Employed (Not Incorporated) | 46 | 2.0% |
| Not-for-profit Organizations | 25 | 1.1% |
| Local Government Employees | 310 | 13.3% |
| State Government Employees | 79 | 3.4% |
| Federal Government Employees | 170 | 7.3% |
| Unpaid Family Workers | 11 | 0.5% |
| Total | 2,335 | 100.0% |
Employment Status by Age in Lander County
According to the labor force statistics for Lander County, out of the total population over 16 years of age (4,400), 60.1% or 2,644 individuals are in the labor force, with 11.7% or 309 of them unemployed. The age group with the highest labor force participation rate is 35 to 44 years, with 91.0% or 686 individuals in the labor force. Within the labor force, the 16 to 19 years age range has the highest percentage of unemployed individuals, with 82.6% or 38 of them being unemployed.
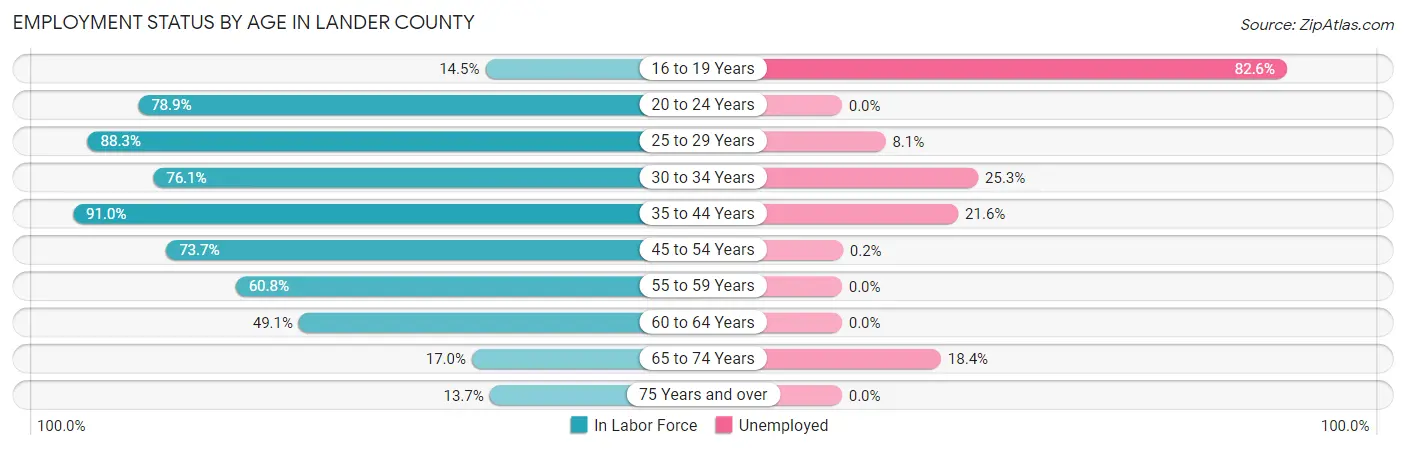
| Age Bracket | In Labor Force | Unemployed |
| 16 to 19 Years | 46 (14.5%) | 38 (82.6%) |
| 20 to 24 Years | 180 (78.9%) | 0 (0.0%) |
| 25 to 29 Years | 235 (88.3%) | 19 (8.1%) |
| 30 to 34 Years | 332 (76.1%) | 84 (25.3%) |
| 35 to 44 Years | 686 (91.0%) | 148 (21.6%) |
| 45 to 54 Years | 551 (73.7%) | 1 (0.2%) |
| 55 to 59 Years | 354 (60.8%) | 0 (0.0%) |
| 60 to 64 Years | 130 (49.1%) | 0 (0.0%) |
| 65 to 74 Years | 98 (17.0%) | 18 (18.4%) |
| 75 Years and over | 31 (13.7%) | 0 (0.0%) |
| Total | 2,644 (60.1%) | 309 (11.7%) |
Employment Status by Educational Attainment in Lander County
According to labor force statistics for Lander County, 75.0% of individuals (2,288) out of the total population between 25 and 64 years of age (3,051) are in the labor force, with 11.0% or 252 of them being unemployed. The group with the highest labor force participation rate are those with the educational attainment of bachelor's degree or higher, with 100.0% or 410 individuals in the labor force. Within the labor force, individuals with less than high school education have the highest percentage of unemployment, with 40.3% or 60 of them being unemployed.
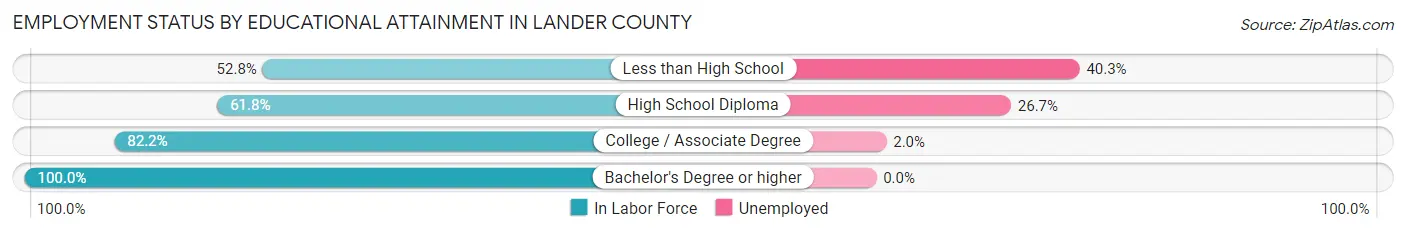
| Educational Attainment | In Labor Force | Unemployed |
| Less than High School | 149 (52.8%) | 114 (40.3%) |
| High School Diploma | 637 (61.8%) | 275 (26.7%) |
| College / Associate Degree | 1,092 (82.2%) | 27 (2.0%) |
| Bachelor's Degree or higher | 410 (100.0%) | 0 (0.0%) |
| Total | 2,288 (75.0%) | 336 (11.0%) |
Employment Occupations by Sex in Lander County
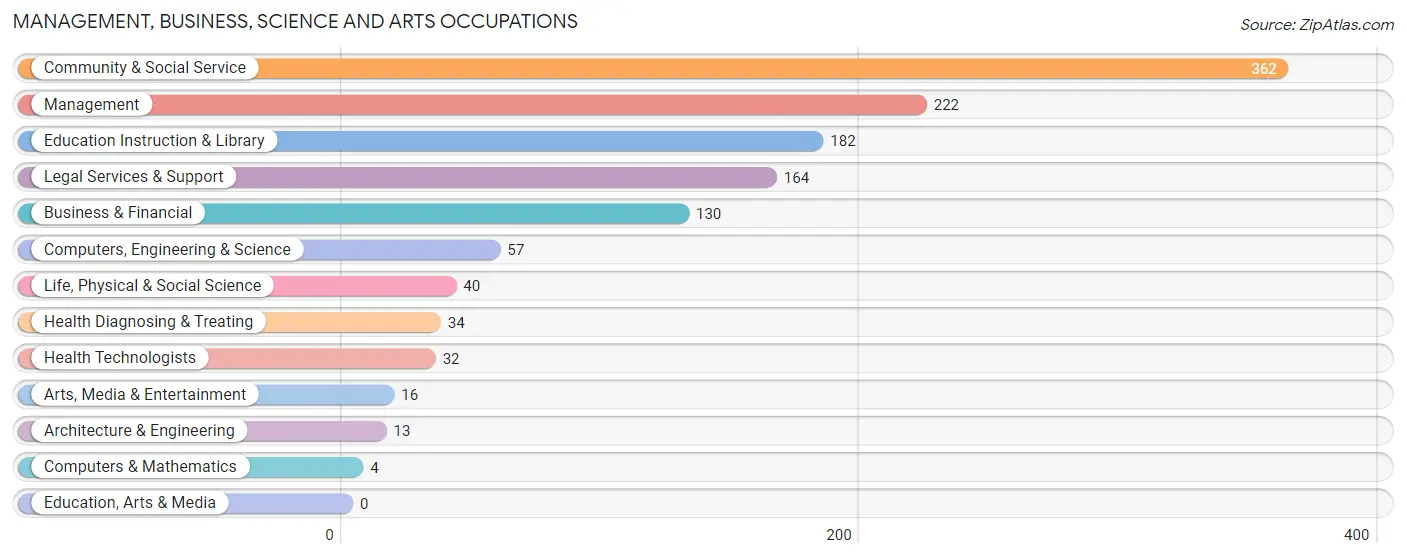
Management, Business, Science and Arts Occupations
The most common Management, Business, Science and Arts occupations in Lander County are Community & Social Service (362 | 15.5%), Management (222 | 9.5%), Education Instruction & Library (182 | 7.8%), Legal Services & Support (164 | 7.0%), and Business & Financial (130 | 5.6%).
Management, Business, Science and Arts Occupations by Sex
Within the Management, Business, Science and Arts occupations in Lander County, the most male-oriented occupations are Architecture & Engineering (100.0%), Arts, Media & Entertainment (100.0%), and Management (63.5%), while the most female-oriented occupations are Computers & Mathematics (100.0%), Life, Physical & Social Science (100.0%), and Legal Services & Support (100.0%).
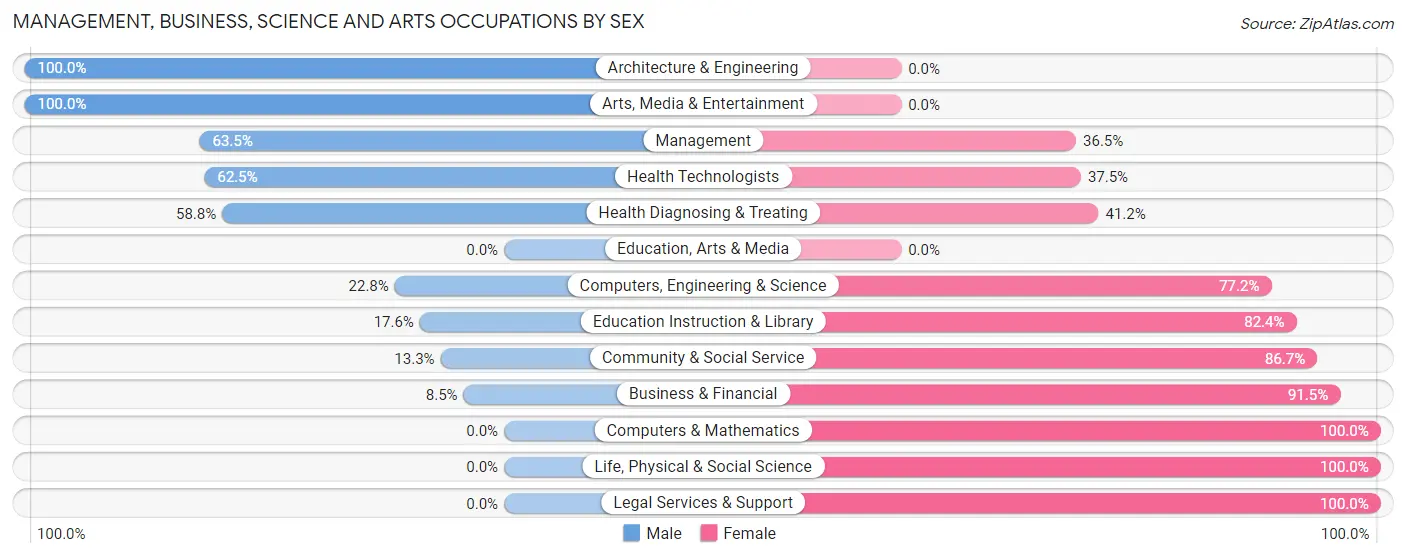
| Occupation | Male | Female |
| Management | 141 (63.5%) | 81 (36.5%) |
| Business & Financial | 11 (8.5%) | 119 (91.5%) |
| Computers, Engineering & Science | 13 (22.8%) | 44 (77.2%) |
| Computers & Mathematics | 0 (0.0%) | 4 (100.0%) |
| Architecture & Engineering | 13 (100.0%) | 0 (0.0%) |
| Life, Physical & Social Science | 0 (0.0%) | 40 (100.0%) |
| Community & Social Service | 48 (13.3%) | 314 (86.7%) |
| Education, Arts & Media | 0 (0.0%) | 0 (0.0%) |
| Legal Services & Support | 0 (0.0%) | 164 (100.0%) |
| Education Instruction & Library | 32 (17.6%) | 150 (82.4%) |
| Arts, Media & Entertainment | 16 (100.0%) | 0 (0.0%) |
| Health Diagnosing & Treating | 20 (58.8%) | 14 (41.2%) |
| Health Technologists | 20 (62.5%) | 12 (37.5%) |
| Total (Category) | 233 (28.9%) | 572 (71.1%) |
| Total (Overall) | 1,493 (63.9%) | 842 (36.1%) |
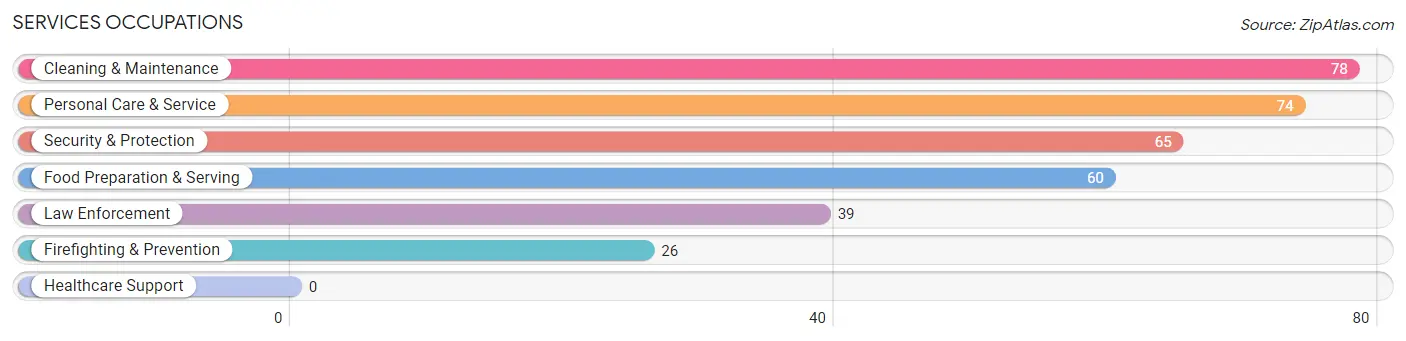
Services Occupations
The most common Services occupations in Lander County are Cleaning & Maintenance (78 | 3.3%), Personal Care & Service (74 | 3.2%), Security & Protection (65 | 2.8%), Food Preparation & Serving (60 | 2.6%), and Law Enforcement (39 | 1.7%).
Services Occupations by Sex
Within the Services occupations in Lander County, the most male-oriented occupations are Security & Protection (100.0%), Firefighting & Prevention (100.0%), and Law Enforcement (100.0%), while the most female-oriented occupations are Food Preparation & Serving (78.3%), and Personal Care & Service (23.0%).
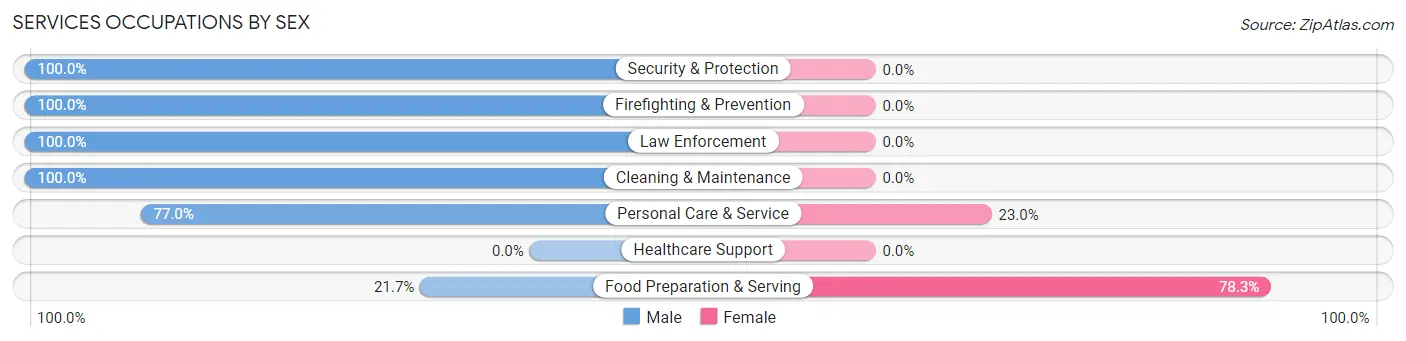
| Occupation | Male | Female |
| Healthcare Support | 0 (0.0%) | 0 (0.0%) |
| Security & Protection | 65 (100.0%) | 0 (0.0%) |
| Firefighting & Prevention | 26 (100.0%) | 0 (0.0%) |
| Law Enforcement | 39 (100.0%) | 0 (0.0%) |
| Food Preparation & Serving | 13 (21.7%) | 47 (78.3%) |
| Cleaning & Maintenance | 78 (100.0%) | 0 (0.0%) |
| Personal Care & Service | 57 (77.0%) | 17 (23.0%) |
| Total (Category) | 213 (76.9%) | 64 (23.1%) |
| Total (Overall) | 1,493 (63.9%) | 842 (36.1%) |
Sales and Office Occupations
The most common Sales and Office occupations in Lander County are Office & Administration (232 | 9.9%), and Sales & Related (70 | 3.0%).
Sales and Office Occupations by Sex
| Occupation | Male | Female |
| Sales & Related | 6 (8.6%) | 64 (91.4%) |
| Office & Administration | 96 (41.4%) | 136 (58.6%) |
| Total (Category) | 102 (33.8%) | 200 (66.2%) |
| Total (Overall) | 1,493 (63.9%) | 842 (36.1%) |
Natural Resources, Construction and Maintenance Occupations
The most common Natural Resources, Construction and Maintenance occupations in Lander County are Installation, Maintenance & Repair (373 | 16.0%), Construction & Extraction (145 | 6.2%), and Farming, Fishing & Forestry (36 | 1.5%).
Natural Resources, Construction and Maintenance Occupations by Sex
| Occupation | Male | Female |
| Farming, Fishing & Forestry | 36 (100.0%) | 0 (0.0%) |
| Construction & Extraction | 145 (100.0%) | 0 (0.0%) |
| Installation, Maintenance & Repair | 373 (100.0%) | 0 (0.0%) |
| Total (Category) | 554 (100.0%) | 0 (0.0%) |
| Total (Overall) | 1,493 (63.9%) | 842 (36.1%) |
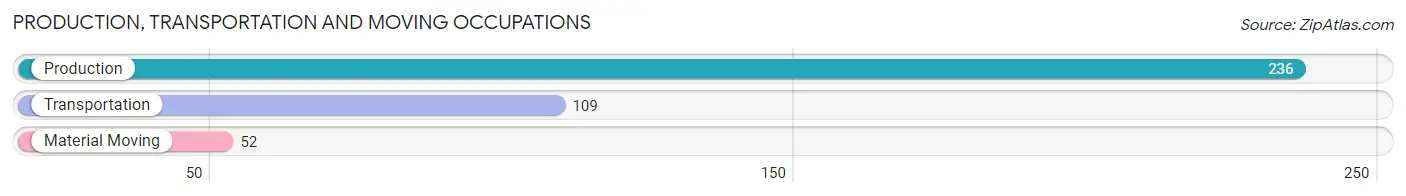
Production, Transportation and Moving Occupations
The most common Production, Transportation and Moving occupations in Lander County are Production (236 | 10.1%), Transportation (109 | 4.7%), and Material Moving (52 | 2.2%).
Production, Transportation and Moving Occupations by Sex
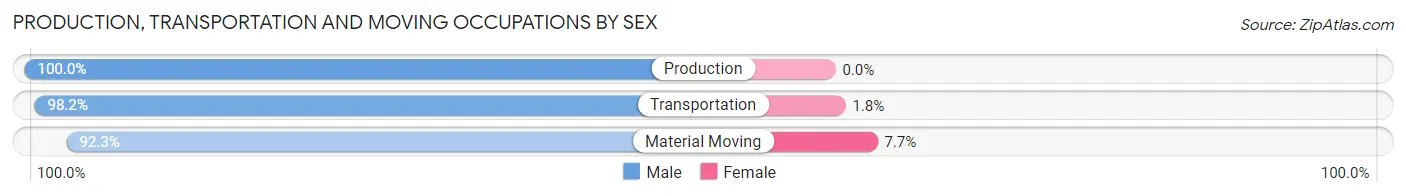
| Occupation | Male | Female |
| Production | 236 (100.0%) | 0 (0.0%) |
| Transportation | 107 (98.2%) | 2 (1.8%) |
| Material Moving | 48 (92.3%) | 4 (7.7%) |
| Total (Category) | 391 (98.5%) | 6 (1.5%) |
| Total (Overall) | 1,493 (63.9%) | 842 (36.1%) |
Employment Industries by Sex in Lander County
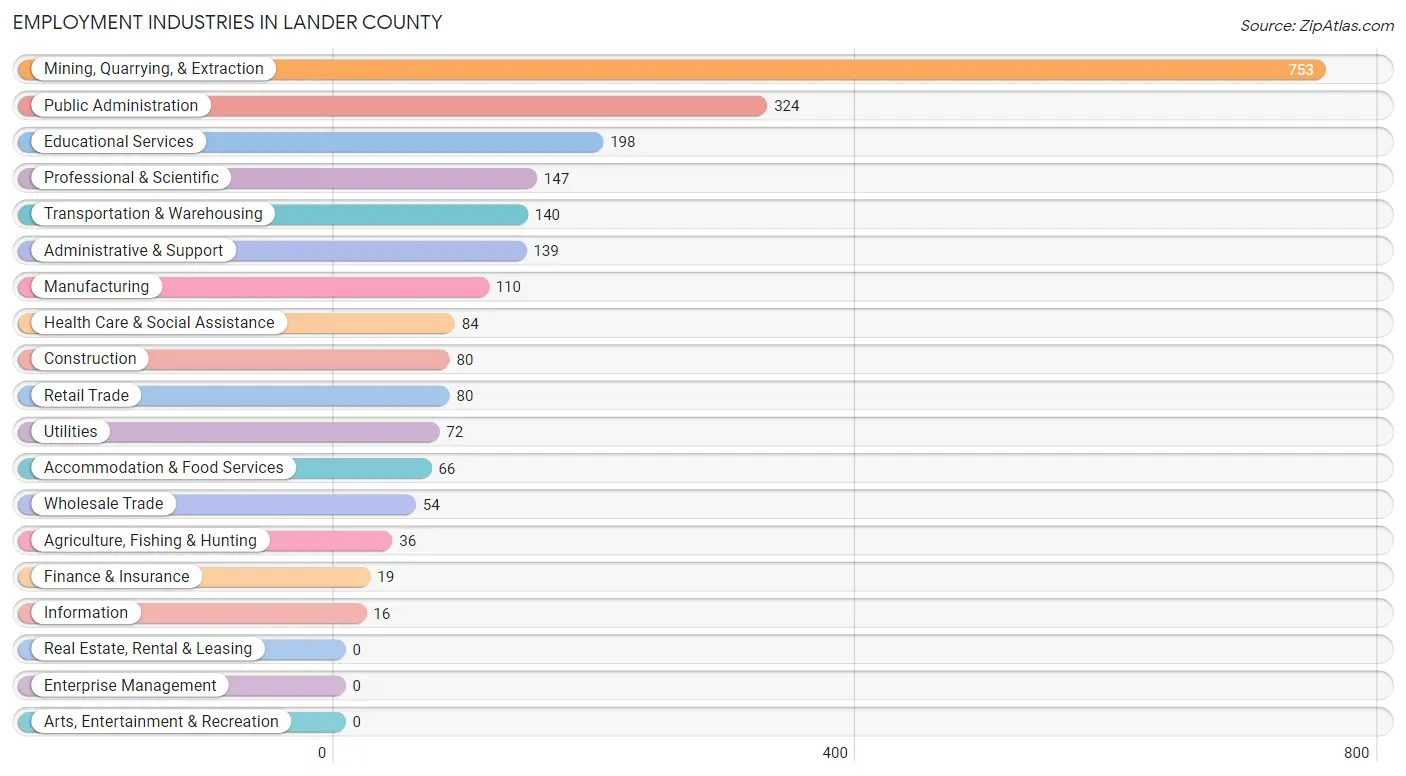
Employment Industries in Lander County
The major employment industries in Lander County include Mining, Quarrying, & Extraction (753 | 32.3%), Public Administration (324 | 13.9%), Educational Services (198 | 8.5%), Professional & Scientific (147 | 6.3%), and Transportation & Warehousing (140 | 6.0%).
Employment Industries by Sex in Lander County
The Lander County industries that see more men than women are Agriculture, Fishing & Hunting (100.0%), Construction (100.0%), and Wholesale Trade (100.0%), whereas the industries that tend to have a higher number of women are Finance & Insurance (100.0%), Accommodation & Food Services (80.3%), and Professional & Scientific (79.6%).
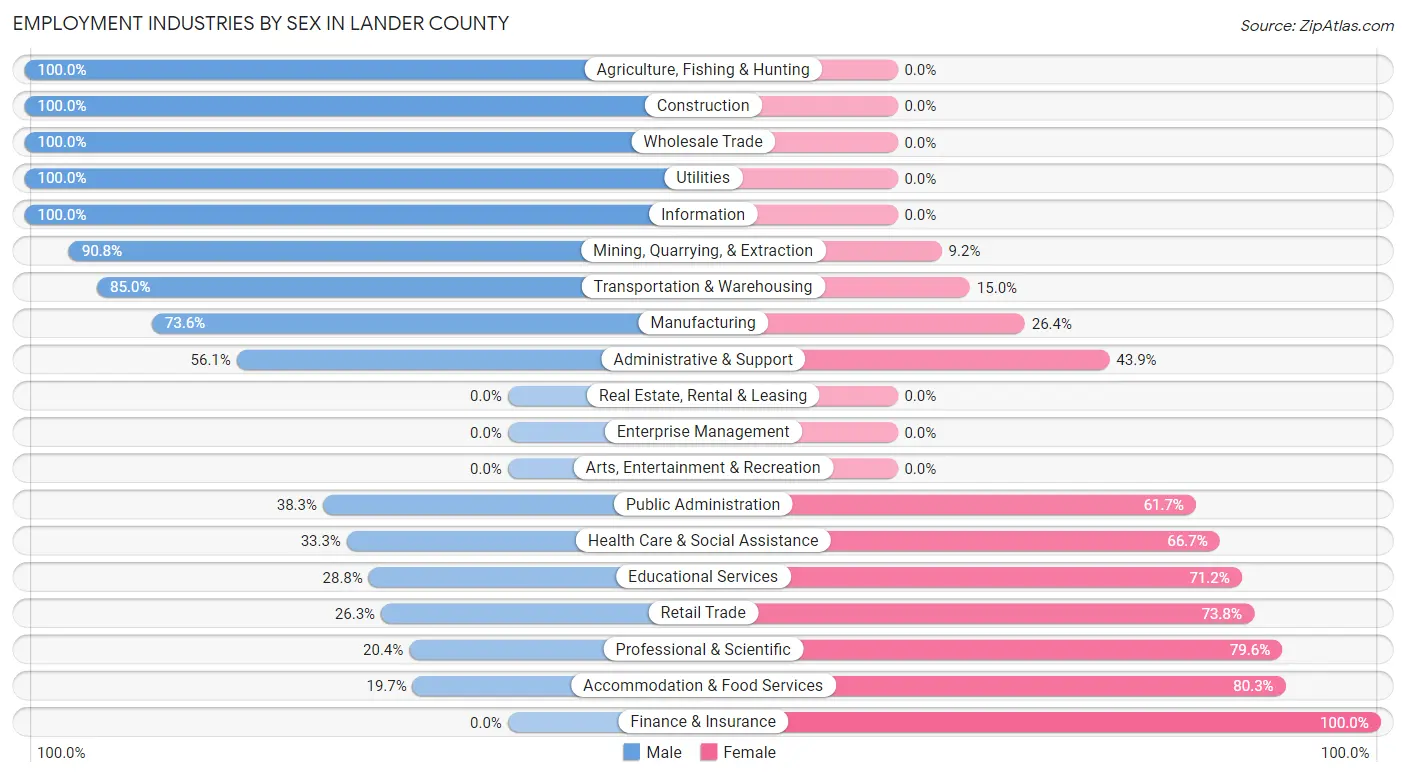
| Industry | Male | Female |
| Agriculture, Fishing & Hunting | 36 (100.0%) | 0 (0.0%) |
| Mining, Quarrying, & Extraction | 684 (90.8%) | 69 (9.2%) |
| Construction | 80 (100.0%) | 0 (0.0%) |
| Manufacturing | 81 (73.6%) | 29 (26.4%) |
| Wholesale Trade | 54 (100.0%) | 0 (0.0%) |
| Retail Trade | 21 (26.3%) | 59 (73.8%) |
| Transportation & Warehousing | 119 (85.0%) | 21 (15.0%) |
| Utilities | 72 (100.0%) | 0 (0.0%) |
| Information | 16 (100.0%) | 0 (0.0%) |
| Finance & Insurance | 0 (0.0%) | 19 (100.0%) |
| Real Estate, Rental & Leasing | 0 (0.0%) | 0 (0.0%) |
| Professional & Scientific | 30 (20.4%) | 117 (79.6%) |
| Enterprise Management | 0 (0.0%) | 0 (0.0%) |
| Administrative & Support | 78 (56.1%) | 61 (43.9%) |
| Educational Services | 57 (28.8%) | 141 (71.2%) |
| Health Care & Social Assistance | 28 (33.3%) | 56 (66.7%) |
| Arts, Entertainment & Recreation | 0 (0.0%) | 0 (0.0%) |
| Accommodation & Food Services | 13 (19.7%) | 53 (80.3%) |
| Public Administration | 124 (38.3%) | 200 (61.7%) |
| Total | 1,493 (63.9%) | 842 (36.1%) |
Education in Lander County
School Enrollment in Lander County
The most common levels of schooling among the 1,702 students in Lander County are elementary school (536 | 31.5%), high school (481 | 28.3%), and middle school (398 | 23.4%).
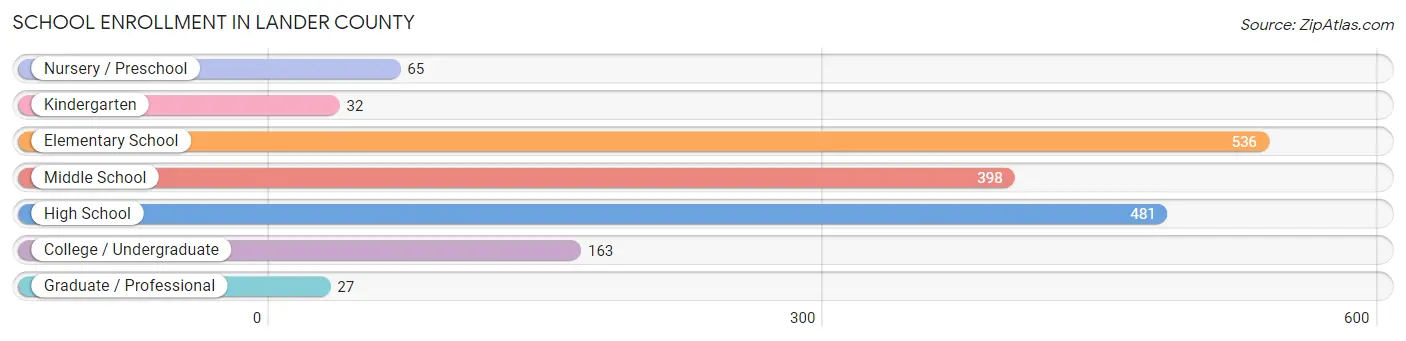
| School Level | # Students | % Students |
| Nursery / Preschool | 65 | 3.8% |
| Kindergarten | 32 | 1.9% |
| Elementary School | 536 | 31.5% |
| Middle School | 398 | 23.4% |
| High School | 481 | 28.3% |
| College / Undergraduate | 163 | 9.6% |
| Graduate / Professional | 27 | 1.6% |
| Total | 1,702 | 100.0% |
School Enrollment by Age by Funding Source in Lander County
Out of a total of 1,702 students who are enrolled in schools in Lander County, 250 (14.7%) attend a private institution, while the remaining 1,452 (85.3%) are enrolled in public schools. The age group of 35 years and over has the highest likelihood of being enrolled in private schools, with 88 (95.7% in the age bracket) enrolled. Conversely, the age group of 18 to 19 year olds has the lowest likelihood of being enrolled in a private school, with 140 (100.0% in the age bracket) attending a public institution.
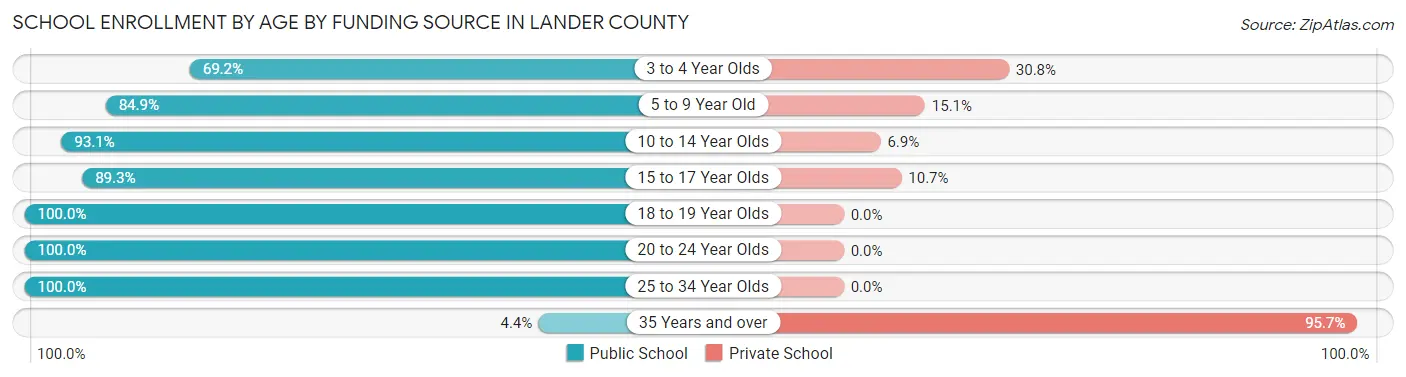
| Age Bracket | Public School | Private School |
| 3 to 4 Year Olds | 45 (69.2%) | 20 (30.8%) |
| 5 to 9 Year Old | 449 (84.9%) | 80 (15.1%) |
| 10 to 14 Year Olds | 407 (93.1%) | 30 (6.9%) |
| 15 to 17 Year Olds | 266 (89.3%) | 32 (10.7%) |
| 18 to 19 Year Olds | 140 (100.0%) | 0 (0.0%) |
| 20 to 24 Year Olds | 122 (100.0%) | 0 (0.0%) |
| 25 to 34 Year Olds | 19 (100.0%) | 0 (0.0%) |
| 35 Years and over | 4 (4.3%) | 88 (95.7%) |
| Total | 1,452 (85.3%) | 250 (14.7%) |
Educational Attainment by Field of Study in Lander County
Business (224 | 35.8%), education (109 | 17.4%), arts & humanities (92 | 14.7%), physical & health sciences (42 | 6.7%), and engineering (36 | 5.8%) are the most common fields of study among 625 individuals in Lander County who have obtained a bachelor's degree or higher.
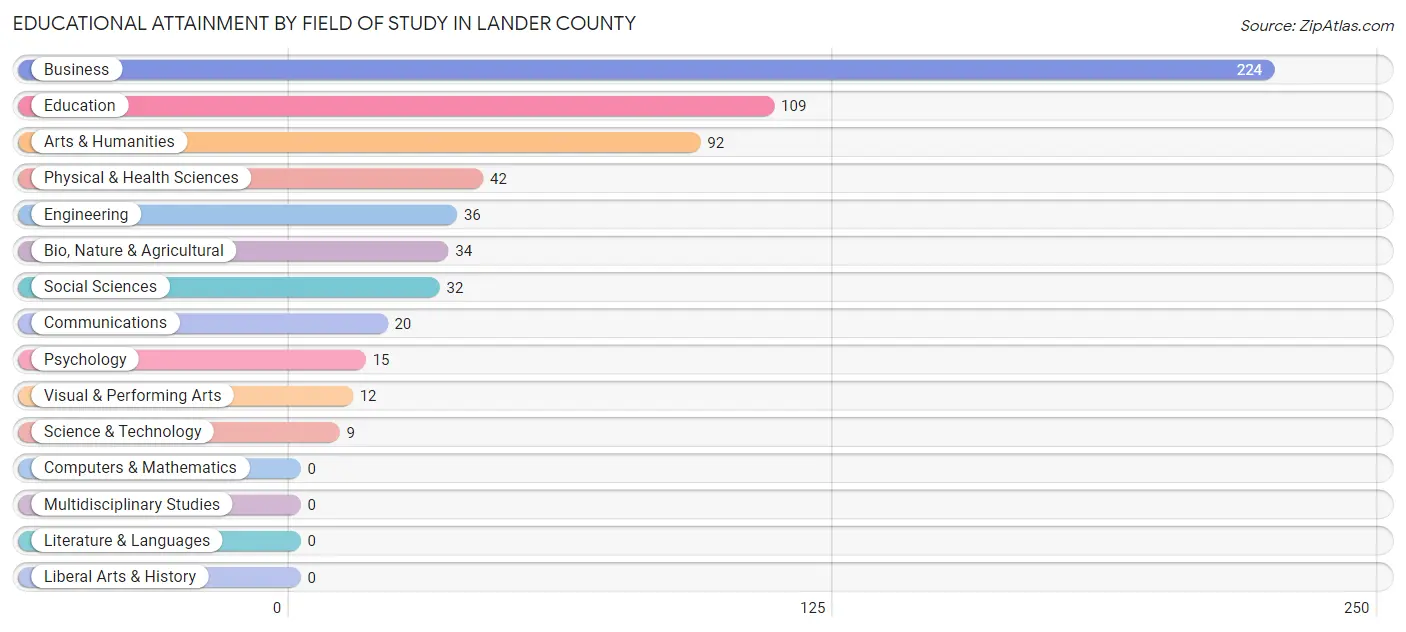
| Field of Study | # Graduates | % Graduates |
| Computers & Mathematics | 0 | 0.0% |
| Bio, Nature & Agricultural | 34 | 5.4% |
| Physical & Health Sciences | 42 | 6.7% |
| Psychology | 15 | 2.4% |
| Social Sciences | 32 | 5.1% |
| Engineering | 36 | 5.8% |
| Multidisciplinary Studies | 0 | 0.0% |
| Science & Technology | 9 | 1.4% |
| Business | 224 | 35.8% |
| Education | 109 | 17.4% |
| Literature & Languages | 0 | 0.0% |
| Liberal Arts & History | 0 | 0.0% |
| Visual & Performing Arts | 12 | 1.9% |
| Communications | 20 | 3.2% |
| Arts & Humanities | 92 | 14.7% |
| Total | 625 | 100.0% |
Transportation & Commute in Lander County
Vehicle Availability by Sex in Lander County
The most prevalent vehicle ownership categories in Lander County are males with 2 vehicles (611, accounting for 41.0%) and females with 2 vehicles (328, making up 72.6%).
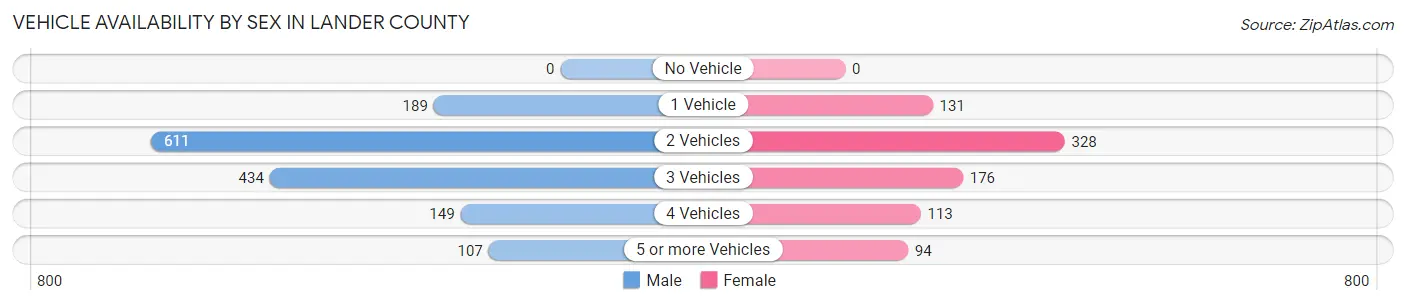
| Vehicles Available | Male | Female |
| No Vehicle | 0 (0.0%) | 0 (0.0%) |
| 1 Vehicle | 189 (12.7%) | 131 (15.6%) |
| 2 Vehicles | 611 (41.0%) | 328 (39.0%) |
| 3 Vehicles | 434 (29.1%) | 176 (20.9%) |
| 4 Vehicles | 149 (10.0%) | 113 (13.4%) |
| 5 or more Vehicles | 107 (7.2%) | 94 (11.2%) |
| Total | 1,490 (100.0%) | 842 (100.0%) |
Commute Time in Lander County
The most frequently occuring commute durations in Lander County are 5 to 9 minutes (651 commuters, 28.0%), 20 to 24 minutes (330 commuters, 14.2%), and 60 to 89 minutes (288 commuters, 12.4%).
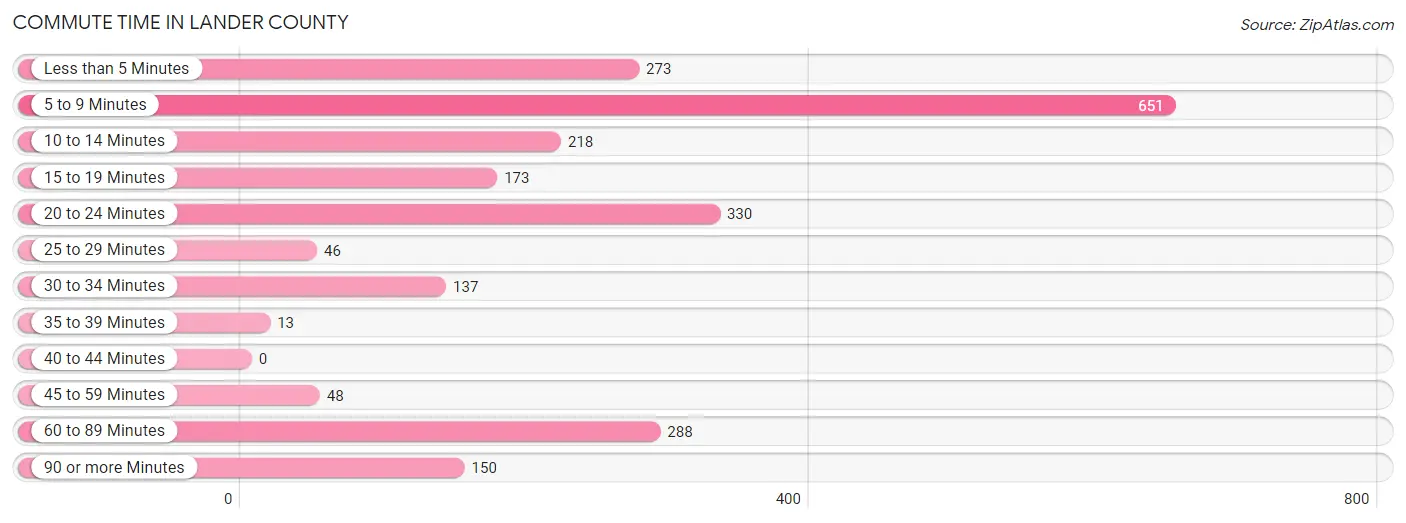
| Commute Time | # Commuters | % Commuters |
| Less than 5 Minutes | 273 | 11.7% |
| 5 to 9 Minutes | 651 | 28.0% |
| 10 to 14 Minutes | 218 | 9.4% |
| 15 to 19 Minutes | 173 | 7.4% |
| 20 to 24 Minutes | 330 | 14.2% |
| 25 to 29 Minutes | 46 | 2.0% |
| 30 to 34 Minutes | 137 | 5.9% |
| 35 to 39 Minutes | 13 | 0.6% |
| 40 to 44 Minutes | 0 | 0.0% |
| 45 to 59 Minutes | 48 | 2.1% |
| 60 to 89 Minutes | 288 | 12.4% |
| 90 or more Minutes | 150 | 6.5% |
Commute Time by Sex in Lander County
The most common commute times in Lander County are 5 to 9 minutes (453 commuters, 30.4%) for males and less than 5 minutes (203 commuters, 24.2%) for females.
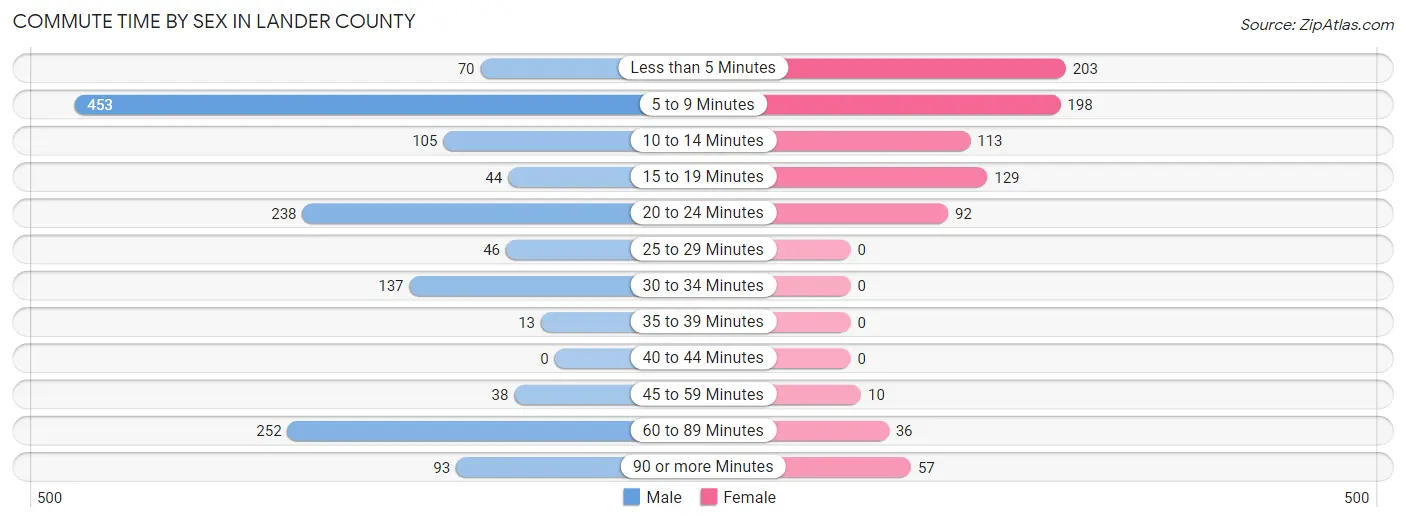
| Commute Time | Male | Female |
| Less than 5 Minutes | 70 (4.7%) | 203 (24.2%) |
| 5 to 9 Minutes | 453 (30.4%) | 198 (23.6%) |
| 10 to 14 Minutes | 105 (7.0%) | 113 (13.5%) |
| 15 to 19 Minutes | 44 (3.0%) | 129 (15.4%) |
| 20 to 24 Minutes | 238 (16.0%) | 92 (11.0%) |
| 25 to 29 Minutes | 46 (3.1%) | 0 (0.0%) |
| 30 to 34 Minutes | 137 (9.2%) | 0 (0.0%) |
| 35 to 39 Minutes | 13 (0.9%) | 0 (0.0%) |
| 40 to 44 Minutes | 0 (0.0%) | 0 (0.0%) |
| 45 to 59 Minutes | 38 (2.5%) | 10 (1.2%) |
| 60 to 89 Minutes | 252 (16.9%) | 36 (4.3%) |
| 90 or more Minutes | 93 (6.2%) | 57 (6.8%) |
Time of Departure to Work by Sex in Lander County
The most frequent times of departure to work in Lander County are 12:00 AM to 4:59 AM (557, 37.4%) for males and 7:30 AM to 7:59 AM (131, 15.6%) for females.
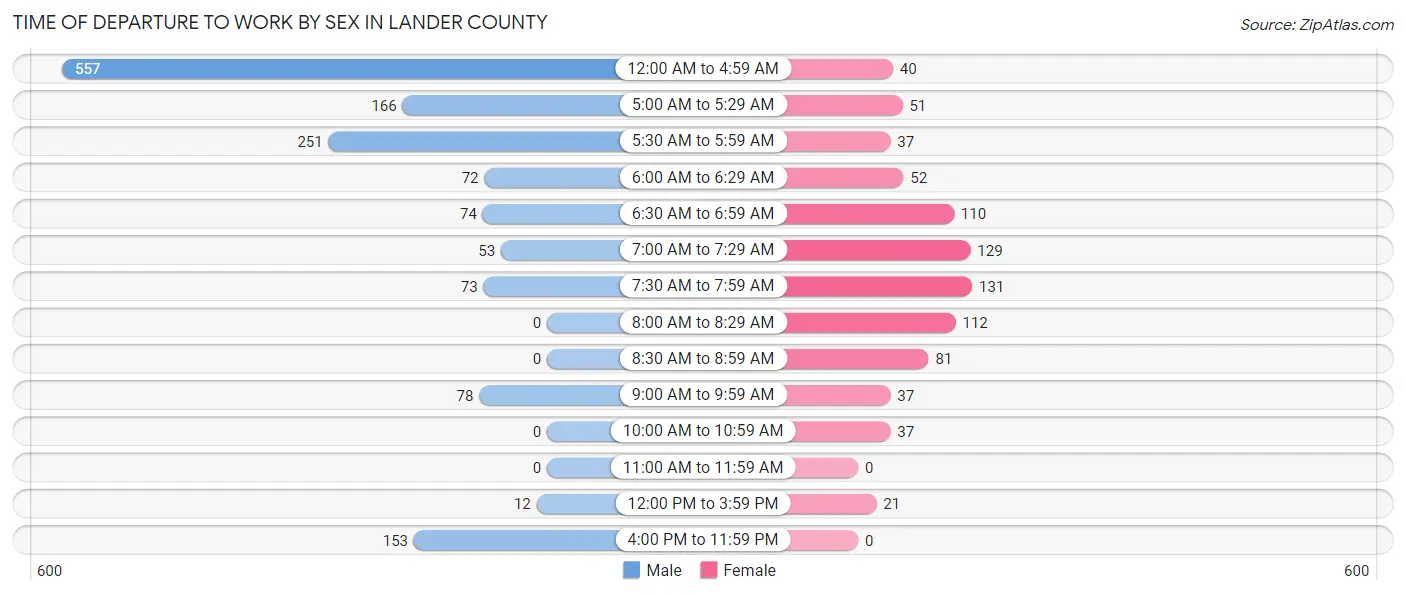
| Time of Departure | Male | Female |
| 12:00 AM to 4:59 AM | 557 (37.4%) | 40 (4.8%) |
| 5:00 AM to 5:29 AM | 166 (11.2%) | 51 (6.1%) |
| 5:30 AM to 5:59 AM | 251 (16.9%) | 37 (4.4%) |
| 6:00 AM to 6:29 AM | 72 (4.8%) | 52 (6.2%) |
| 6:30 AM to 6:59 AM | 74 (5.0%) | 110 (13.1%) |
| 7:00 AM to 7:29 AM | 53 (3.6%) | 129 (15.4%) |
| 7:30 AM to 7:59 AM | 73 (4.9%) | 131 (15.6%) |
| 8:00 AM to 8:29 AM | 0 (0.0%) | 112 (13.4%) |
| 8:30 AM to 8:59 AM | 0 (0.0%) | 81 (9.7%) |
| 9:00 AM to 9:59 AM | 78 (5.2%) | 37 (4.4%) |
| 10:00 AM to 10:59 AM | 0 (0.0%) | 37 (4.4%) |
| 11:00 AM to 11:59 AM | 0 (0.0%) | 0 (0.0%) |
| 12:00 PM to 3:59 PM | 12 (0.8%) | 21 (2.5%) |
| 4:00 PM to 11:59 PM | 153 (10.3%) | 0 (0.0%) |
| Total | 1,489 (100.0%) | 838 (100.0%) |
Housing Occupancy in Lander County
Occupancy by Ownership in Lander County
Of the total 2,256 dwellings in Lander County, owner-occupied units account for 1,705 (75.6%), while renter-occupied units make up 551 (24.4%).
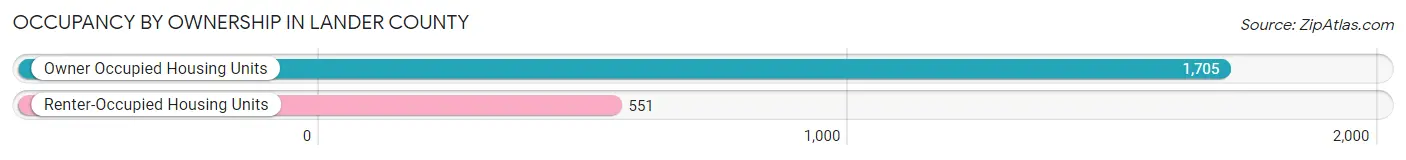
| Occupancy | # Housing Units | % Housing Units |
| Owner Occupied Housing Units | 1,705 | 75.6% |
| Renter-Occupied Housing Units | 551 | 24.4% |
| Total Occupied Housing Units | 2,256 | 100.0% |
Occupancy by Household Size in Lander County
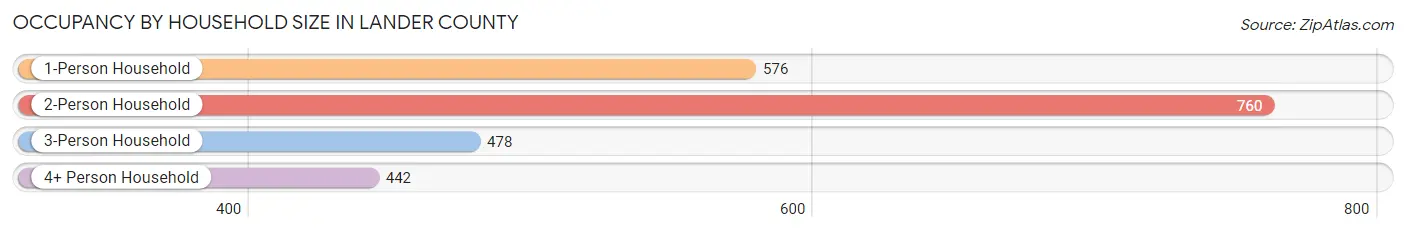
| Household Size | # Housing Units | % Housing Units |
| 1-Person Household | 576 | 25.5% |
| 2-Person Household | 760 | 33.7% |
| 3-Person Household | 478 | 21.2% |
| 4+ Person Household | 442 | 19.6% |
| Total Housing Units | 2,256 | 100.0% |
Occupancy by Ownership by Household Size in Lander County
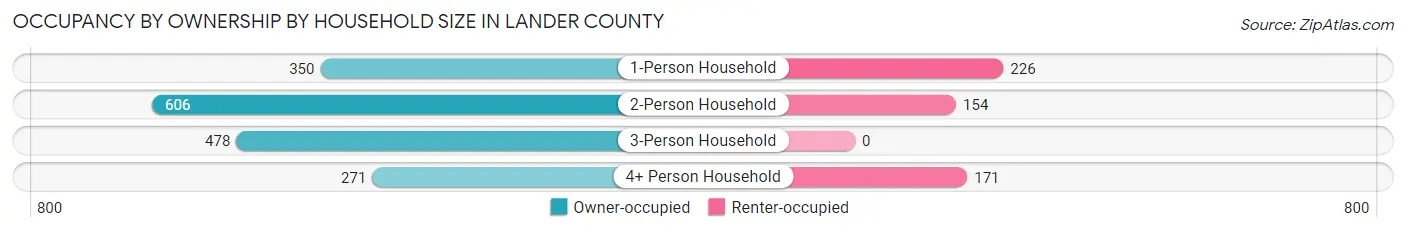
| Household Size | Owner-occupied | Renter-occupied |
| 1-Person Household | 350 (60.8%) | 226 (39.2%) |
| 2-Person Household | 606 (79.7%) | 154 (20.3%) |
| 3-Person Household | 478 (100.0%) | 0 (0.0%) |
| 4+ Person Household | 271 (61.3%) | 171 (38.7%) |
| Total Housing Units | 1,705 (75.6%) | 551 (24.4%) |
Occupancy by Educational Attainment in Lander County
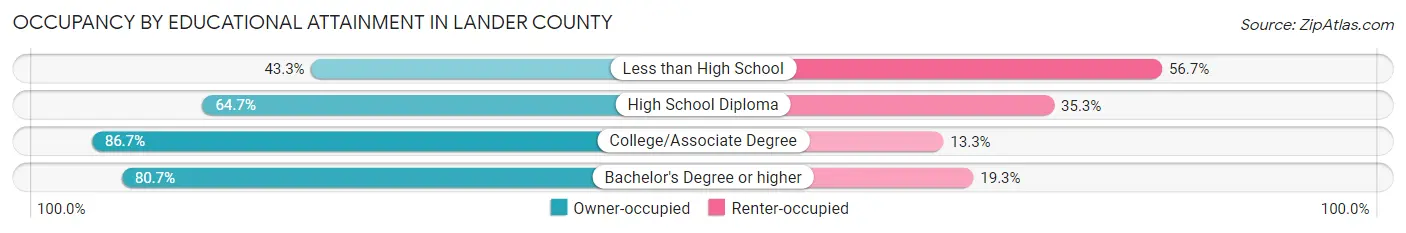
| Household Size | Owner-occupied | Renter-occupied |
| Less than High School | 52 (43.3%) | 68 (56.7%) |
| High School Diploma | 532 (64.7%) | 290 (35.3%) |
| College/Associate Degree | 878 (86.7%) | 135 (13.3%) |
| Bachelor's Degree or higher | 243 (80.7%) | 58 (19.3%) |
Occupancy by Age of Householder in Lander County
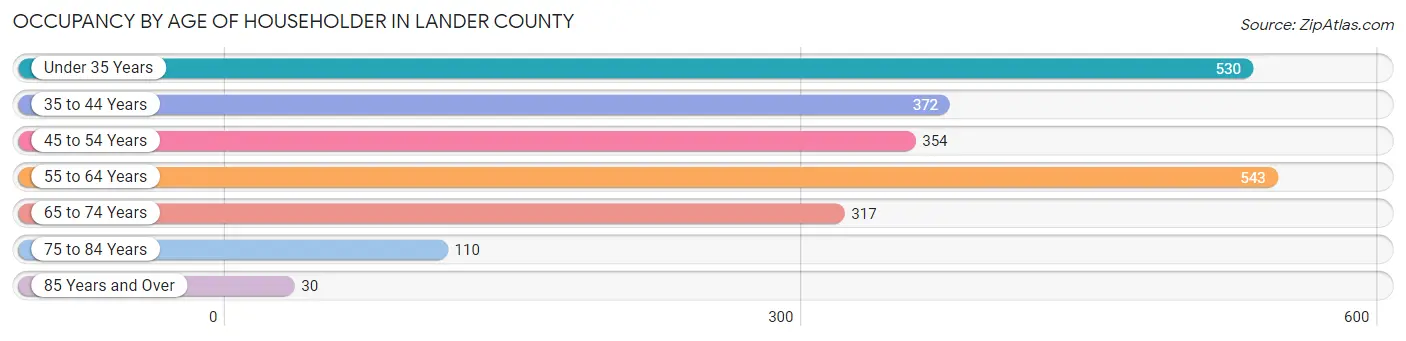
| Age Bracket | # Households | % Households |
| Under 35 Years | 530 | 23.5% |
| 35 to 44 Years | 372 | 16.5% |
| 45 to 54 Years | 354 | 15.7% |
| 55 to 64 Years | 543 | 24.1% |
| 65 to 74 Years | 317 | 14.1% |
| 75 to 84 Years | 110 | 4.9% |
| 85 Years and Over | 30 | 1.3% |
| Total | 2,256 | 100.0% |
Housing Finances in Lander County
Median Income by Occupancy in Lander County
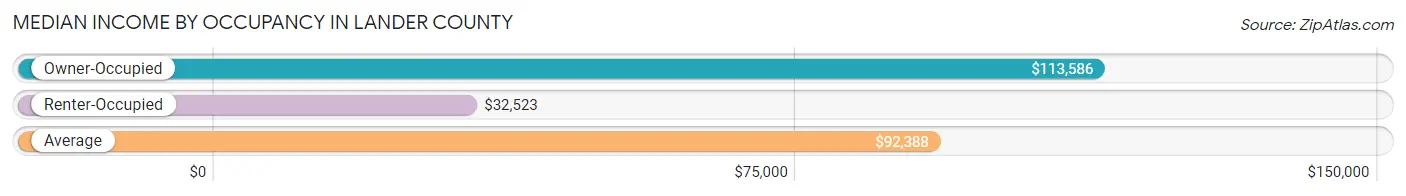
| Occupancy Type | # Households | Median Income |
| Owner-Occupied | 1,705 (75.6%) | $113,586 |
| Renter-Occupied | 551 (24.4%) | $32,523 |
| Average | 2,256 (100.0%) | $92,388 |
Occupancy by Householder Income Bracket in Lander County
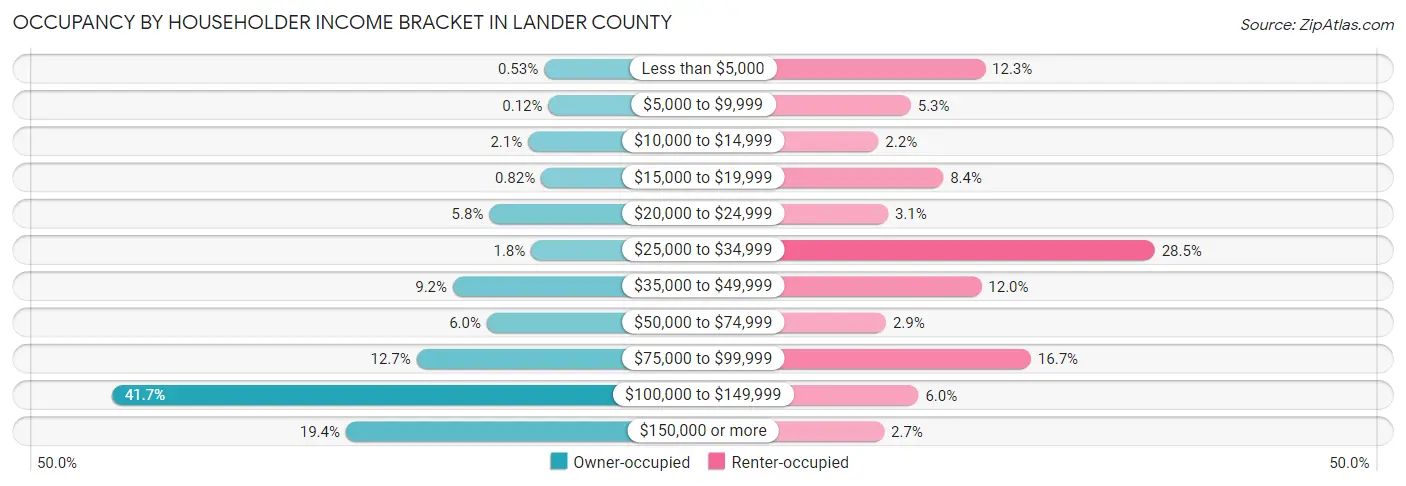
| Income Bracket | Owner-occupied | Renter-occupied |
| Less than $5,000 | 9 (0.5%) | 68 (12.3%) |
| $5,000 to $9,999 | 2 (0.1%) | 29 (5.3%) |
| $10,000 to $14,999 | 35 (2.1%) | 12 (2.2%) |
| $15,000 to $19,999 | 14 (0.8%) | 46 (8.4%) |
| $20,000 to $24,999 | 98 (5.8%) | 17 (3.1%) |
| $25,000 to $34,999 | 30 (1.8%) | 157 (28.5%) |
| $35,000 to $49,999 | 157 (9.2%) | 66 (12.0%) |
| $50,000 to $74,999 | 102 (6.0%) | 16 (2.9%) |
| $75,000 to $99,999 | 216 (12.7%) | 92 (16.7%) |
| $100,000 to $149,999 | 711 (41.7%) | 33 (6.0%) |
| $150,000 or more | 331 (19.4%) | 15 (2.7%) |
| Total | 1,705 (100.0%) | 551 (100.0%) |
Monthly Housing Cost Tiers in Lander County
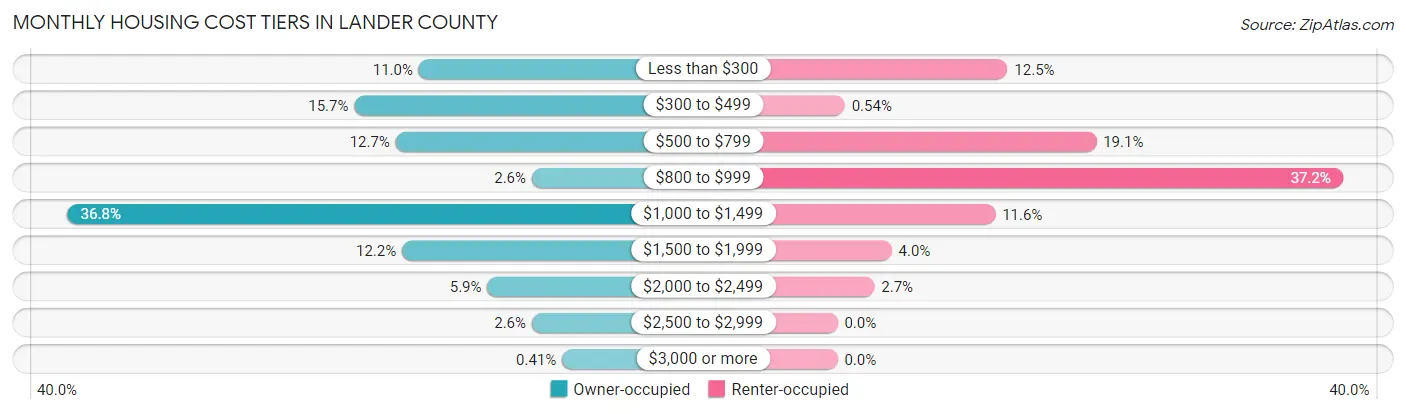
| Monthly Cost | Owner-occupied | Renter-occupied |
| Less than $300 | 187 (11.0%) | 69 (12.5%) |
| $300 to $499 | 268 (15.7%) | 3 (0.5%) |
| $500 to $799 | 216 (12.7%) | 105 (19.1%) |
| $800 to $999 | 45 (2.6%) | 205 (37.2%) |
| $1,000 to $1,499 | 628 (36.8%) | 64 (11.6%) |
| $1,500 to $1,999 | 208 (12.2%) | 22 (4.0%) |
| $2,000 to $2,499 | 101 (5.9%) | 15 (2.7%) |
| $2,500 to $2,999 | 45 (2.6%) | 0 (0.0%) |
| $3,000 or more | 7 (0.4%) | 0 (0.0%) |
| Total | 1,705 (100.0%) | 551 (100.0%) |
Physical Housing Characteristics in Lander County
Housing Structures in Lander County
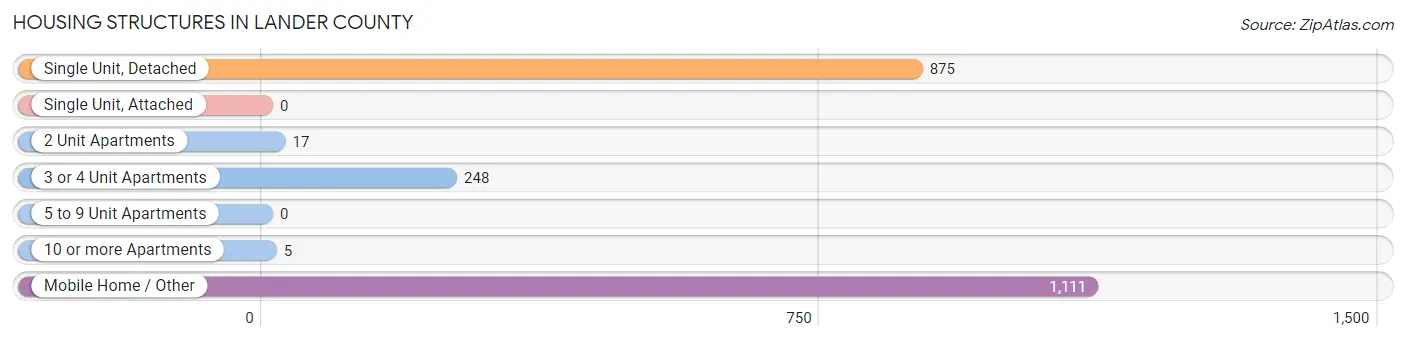
| Structure Type | # Housing Units | % Housing Units |
| Single Unit, Detached | 875 | 38.8% |
| Single Unit, Attached | 0 | 0.0% |
| 2 Unit Apartments | 17 | 0.7% |
| 3 or 4 Unit Apartments | 248 | 11.0% |
| 5 to 9 Unit Apartments | 0 | 0.0% |
| 10 or more Apartments | 5 | 0.2% |
| Mobile Home / Other | 1,111 | 49.2% |
| Total | 2,256 | 100.0% |
Housing Structures by Occupancy in Lander County
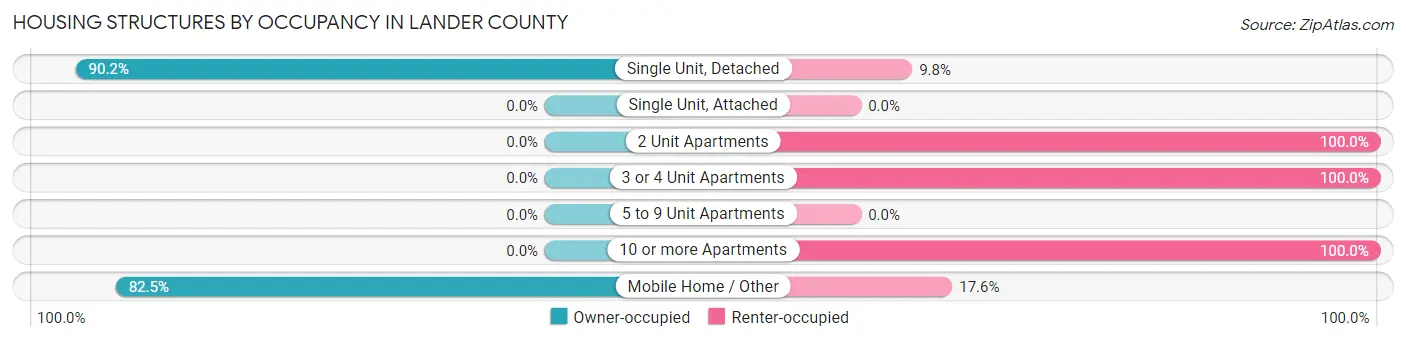
| Structure Type | Owner-occupied | Renter-occupied |
| Single Unit, Detached | 789 (90.2%) | 86 (9.8%) |
| Single Unit, Attached | 0 (0.0%) | 0 (0.0%) |
| 2 Unit Apartments | 0 (0.0%) | 17 (100.0%) |
| 3 or 4 Unit Apartments | 0 (0.0%) | 248 (100.0%) |
| 5 to 9 Unit Apartments | 0 (0.0%) | 0 (0.0%) |
| 10 or more Apartments | 0 (0.0%) | 5 (100.0%) |
| Mobile Home / Other | 916 (82.5%) | 195 (17.5%) |
| Total | 1,705 (75.6%) | 551 (24.4%) |
Housing Structures by Number of Rooms in Lander County
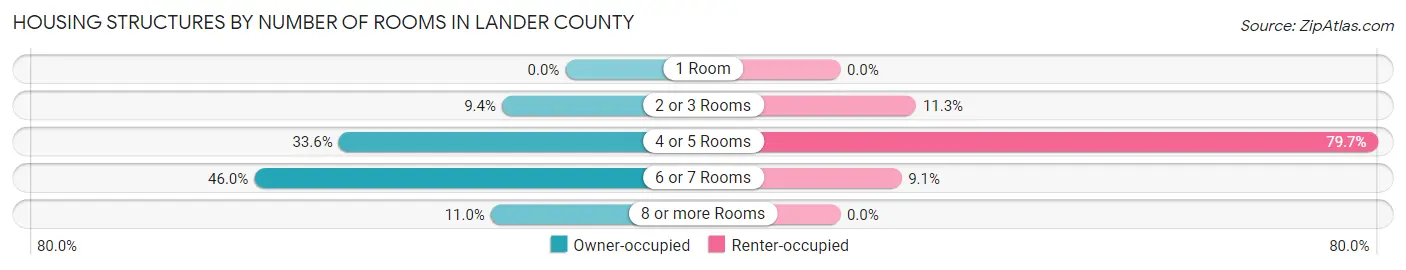
| Number of Rooms | Owner-occupied | Renter-occupied |
| 1 Room | 0 (0.0%) | 0 (0.0%) |
| 2 or 3 Rooms | 160 (9.4%) | 62 (11.3%) |
| 4 or 5 Rooms | 572 (33.6%) | 439 (79.7%) |
| 6 or 7 Rooms | 785 (46.0%) | 50 (9.1%) |
| 8 or more Rooms | 188 (11.0%) | 0 (0.0%) |
| Total | 1,705 (100.0%) | 551 (100.0%) |
Housing Structure by Heating Type in Lander County
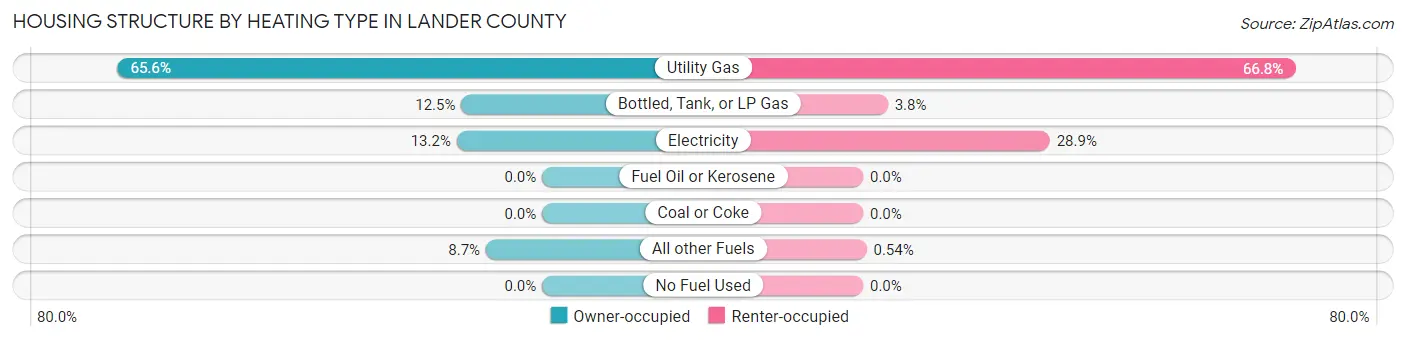
| Heating Type | Owner-occupied | Renter-occupied |
| Utility Gas | 1,119 (65.6%) | 368 (66.8%) |
| Bottled, Tank, or LP Gas | 213 (12.5%) | 21 (3.8%) |
| Electricity | 225 (13.2%) | 159 (28.9%) |
| Fuel Oil or Kerosene | 0 (0.0%) | 0 (0.0%) |
| Coal or Coke | 0 (0.0%) | 0 (0.0%) |
| All other Fuels | 148 (8.7%) | 3 (0.5%) |
| No Fuel Used | 0 (0.0%) | 0 (0.0%) |
| Total | 1,705 (100.0%) | 551 (100.0%) |
Household Vehicle Usage in Lander County
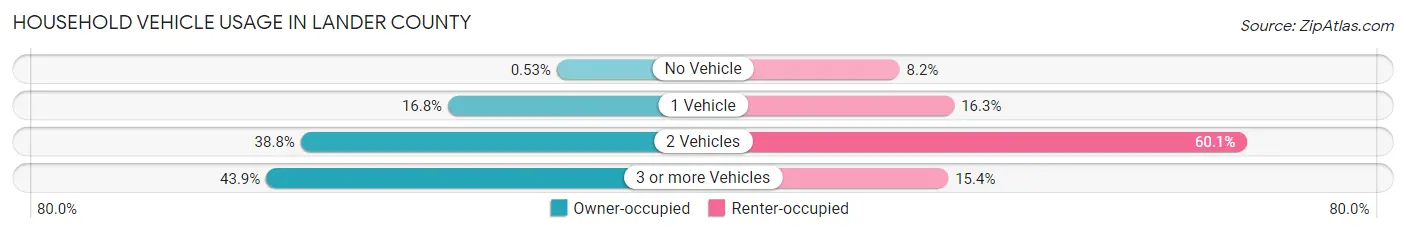
| Vehicles per Household | Owner-occupied | Renter-occupied |
| No Vehicle | 9 (0.5%) | 45 (8.2%) |
| 1 Vehicle | 286 (16.8%) | 90 (16.3%) |
| 2 Vehicles | 661 (38.8%) | 331 (60.1%) |
| 3 or more Vehicles | 749 (43.9%) | 85 (15.4%) |
| Total | 1,705 (100.0%) | 551 (100.0%) |
Real Estate & Mortgages in Lander County
Real Estate and Mortgage Overview in Lander County
| Characteristic | Without Mortgage | With Mortgage |
| Housing Units | 628 | 1,077 |
| Median Property Value | $157,800 | $231,900 |
| Median Household Income | $97,969 | $289 |
| Monthly Housing Costs | $396 | $7 |
| Real Estate Taxes | $1,235 | $68 |
Property Value by Mortgage Status in Lander County
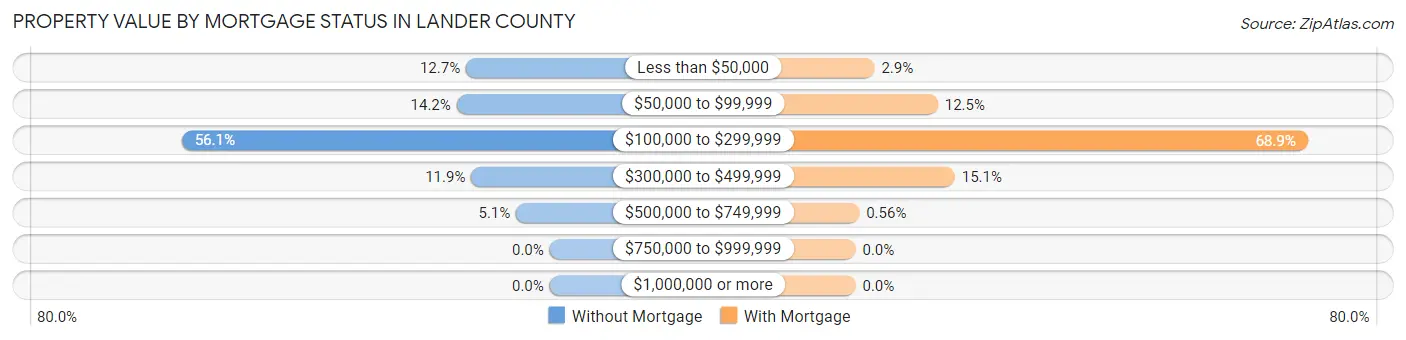
| Property Value | Without Mortgage | With Mortgage |
| Less than $50,000 | 80 (12.7%) | 31 (2.9%) |
| $50,000 to $99,999 | 89 (14.2%) | 135 (12.5%) |
| $100,000 to $299,999 | 352 (56.0%) | 742 (68.9%) |
| $300,000 to $499,999 | 75 (11.9%) | 163 (15.1%) |
| $500,000 to $749,999 | 32 (5.1%) | 6 (0.6%) |
| $750,000 to $999,999 | 0 (0.0%) | 0 (0.0%) |
| $1,000,000 or more | 0 (0.0%) | 0 (0.0%) |
| Total | 628 (100.0%) | 1,077 (100.0%) |
Household Income by Mortgage Status in Lander County
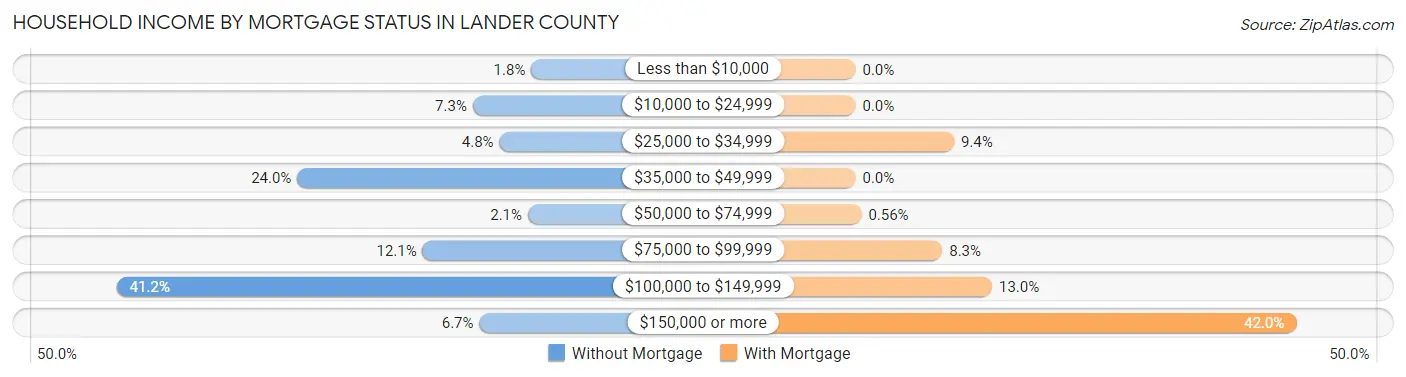
| Household Income | Without Mortgage | With Mortgage |
| Less than $10,000 | 11 (1.8%) | 0 (0.0%) |
| $10,000 to $24,999 | 46 (7.3%) | 0 (0.0%) |
| $25,000 to $34,999 | 30 (4.8%) | 101 (9.4%) |
| $35,000 to $49,999 | 151 (24.0%) | 0 (0.0%) |
| $50,000 to $74,999 | 13 (2.1%) | 6 (0.6%) |
| $75,000 to $99,999 | 76 (12.1%) | 89 (8.3%) |
| $100,000 to $149,999 | 259 (41.2%) | 140 (13.0%) |
| $150,000 or more | 42 (6.7%) | 452 (42.0%) |
| Total | 628 (100.0%) | 1,077 (100.0%) |
Property Value to Household Income Ratio in Lander County
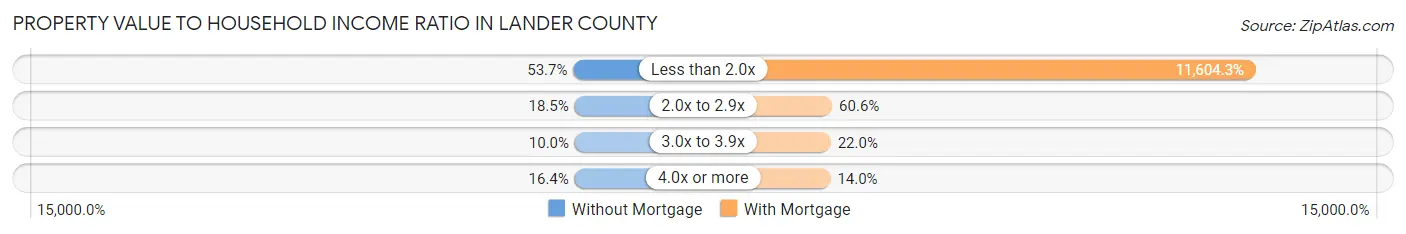
| Value-to-Income Ratio | Without Mortgage | With Mortgage |
| Less than 2.0x | 337 (53.7%) | 124,978 (11,604.3%) |
| 2.0x to 2.9x | 116 (18.5%) | 653 (60.6%) |
| 3.0x to 3.9x | 63 (10.0%) | 237 (22.0%) |
| 4.0x or more | 103 (16.4%) | 151 (14.0%) |
| Total | 628 (100.0%) | 1,077 (100.0%) |
Real Estate Taxes by Mortgage Status in Lander County
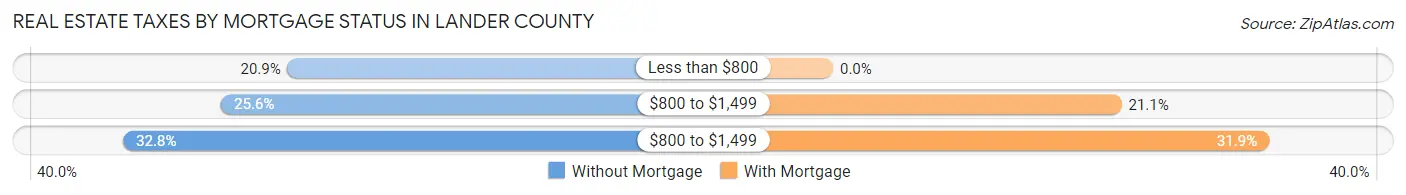
| Property Taxes | Without Mortgage | With Mortgage |
| Less than $800 | 131 (20.9%) | 0 (0.0%) |
| $800 to $1,499 | 161 (25.6%) | 227 (21.1%) |
| $800 to $1,499 | 206 (32.8%) | 343 (31.9%) |
| Total | 628 (100.0%) | 1,077 (100.0%) |
Health & Disability in Lander County
Health Insurance Coverage by Age in Lander County
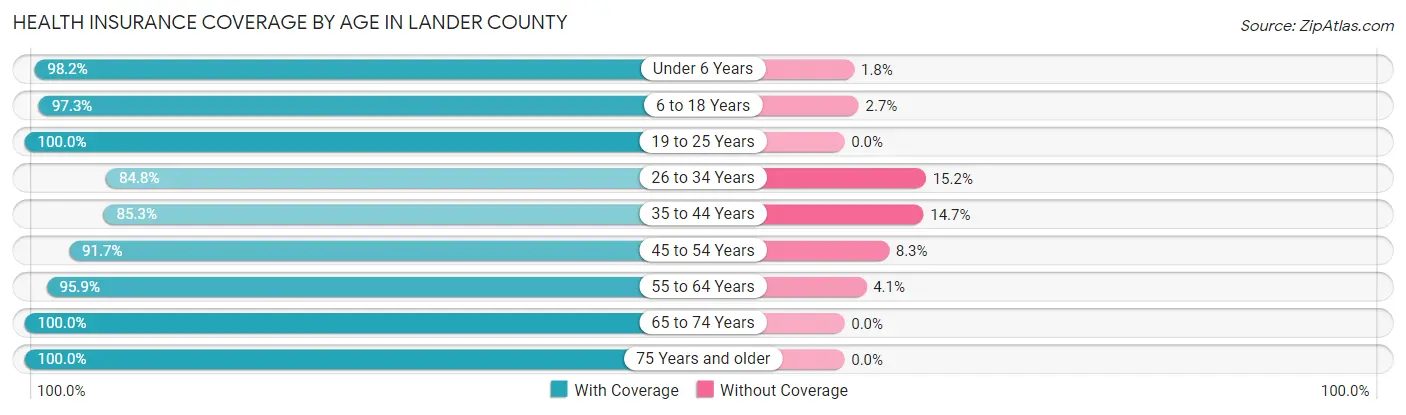
| Age Bracket | With Coverage | Without Coverage |
| Under 6 Years | 216 (98.2%) | 4 (1.8%) |
| 6 to 18 Years | 1,350 (97.3%) | 37 (2.7%) |
| 19 to 25 Years | 290 (100.0%) | 0 (0.0%) |
| 26 to 34 Years | 575 (84.8%) | 103 (15.2%) |
| 35 to 44 Years | 637 (85.3%) | 110 (14.7%) |
| 45 to 54 Years | 686 (91.7%) | 62 (8.3%) |
| 55 to 64 Years | 798 (95.9%) | 34 (4.1%) |
| 65 to 74 Years | 565 (100.0%) | 0 (0.0%) |
| 75 Years and older | 215 (100.0%) | 0 (0.0%) |
| Total | 5,332 (93.8%) | 350 (6.2%) |
Health Insurance Coverage by Citizenship Status in Lander County
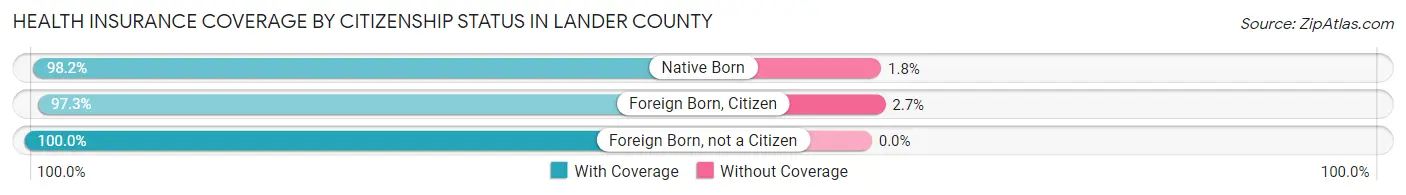
| Citizenship Status | With Coverage | Without Coverage |
| Native Born | 216 (98.2%) | 4 (1.8%) |
| Foreign Born, Citizen | 1,350 (97.3%) | 37 (2.7%) |
| Foreign Born, not a Citizen | 290 (100.0%) | 0 (0.0%) |
Health Insurance Coverage by Household Income in Lander County
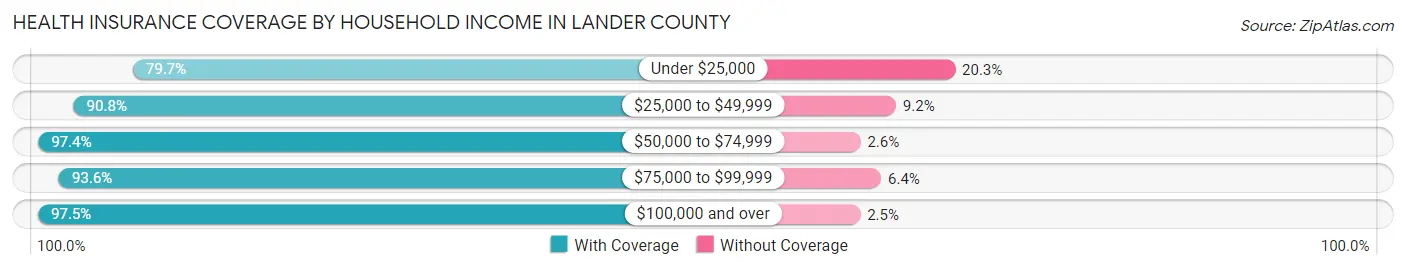
| Household Income | With Coverage | Without Coverage |
| Under $25,000 | 444 (79.7%) | 113 (20.3%) |
| $25,000 to $49,999 | 898 (90.8%) | 91 (9.2%) |
| $50,000 to $74,999 | 190 (97.4%) | 5 (2.6%) |
| $75,000 to $99,999 | 990 (93.6%) | 68 (6.4%) |
| $100,000 and over | 2,798 (97.5%) | 72 (2.5%) |
Public vs Private Health Insurance Coverage by Age in Lander County
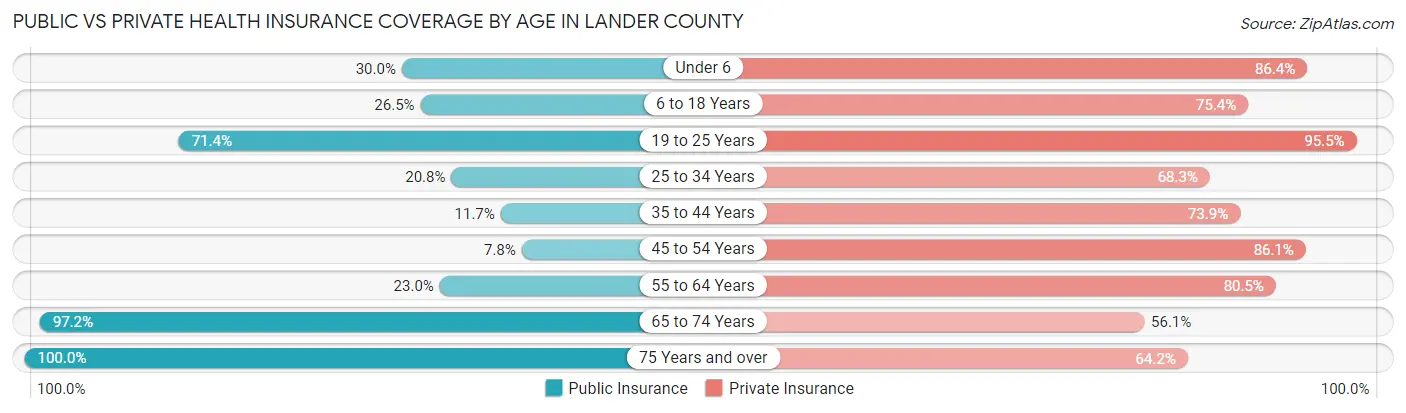
| Age Bracket | Public Insurance | Private Insurance |
| Under 6 | 66 (30.0%) | 190 (86.4%) |
| 6 to 18 Years | 368 (26.5%) | 1,046 (75.4%) |
| 19 to 25 Years | 207 (71.4%) | 277 (95.5%) |
| 25 to 34 Years | 141 (20.8%) | 463 (68.3%) |
| 35 to 44 Years | 87 (11.7%) | 552 (73.9%) |
| 45 to 54 Years | 58 (7.7%) | 644 (86.1%) |
| 55 to 64 Years | 191 (23.0%) | 670 (80.5%) |
| 65 to 74 Years | 549 (97.2%) | 317 (56.1%) |
| 75 Years and over | 215 (100.0%) | 138 (64.2%) |
| Total | 1,882 (33.1%) | 4,297 (75.6%) |
Disability Status by Sex by Age in Lander County
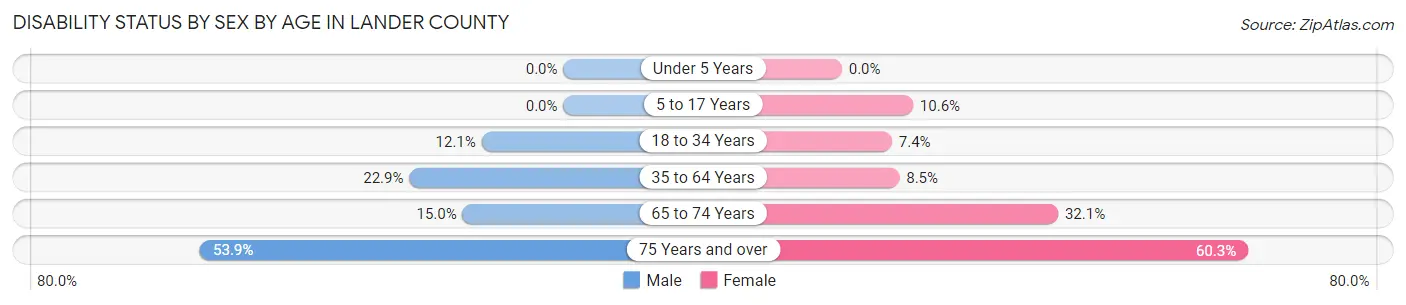
| Age Bracket | Male | Female |
| Under 5 Years | 0 (0.0%) | 0 (0.0%) |
| 5 to 17 Years | 0 (0.0%) | 62 (10.6%) |
| 18 to 34 Years | 84 (12.1%) | 28 (7.4%) |
| 35 to 64 Years | 286 (22.9%) | 92 (8.5%) |
| 65 to 74 Years | 44 (15.0%) | 87 (32.1%) |
| 75 Years and over | 48 (53.9%) | 76 (60.3%) |
Disability Class by Sex by Age in Lander County
Disability Class: Hearing Difficulty
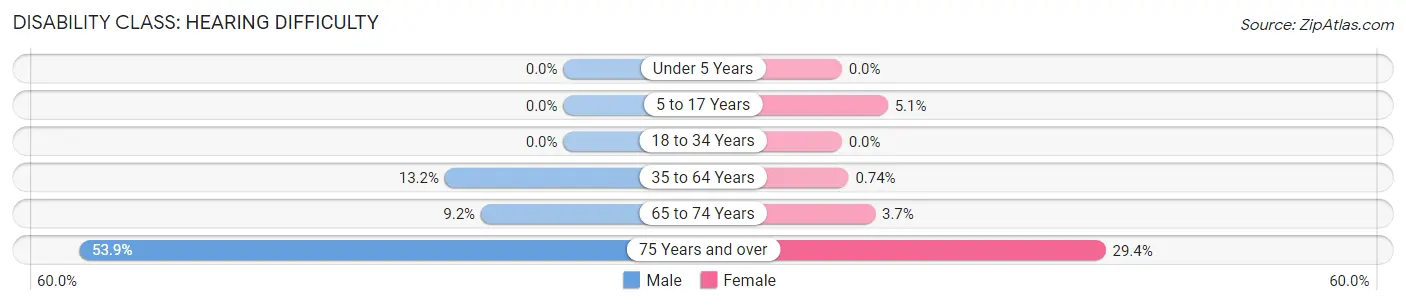
| Age Bracket | Male | Female |
| Under 5 Years | 0 (0.0%) | 0 (0.0%) |
| 5 to 17 Years | 0 (0.0%) | 30 (5.1%) |
| 18 to 34 Years | 0 (0.0%) | 0 (0.0%) |
| 35 to 64 Years | 165 (13.2%) | 8 (0.7%) |
| 65 to 74 Years | 27 (9.2%) | 10 (3.7%) |
| 75 Years and over | 48 (53.9%) | 37 (29.4%) |
Disability Class: Vision Difficulty
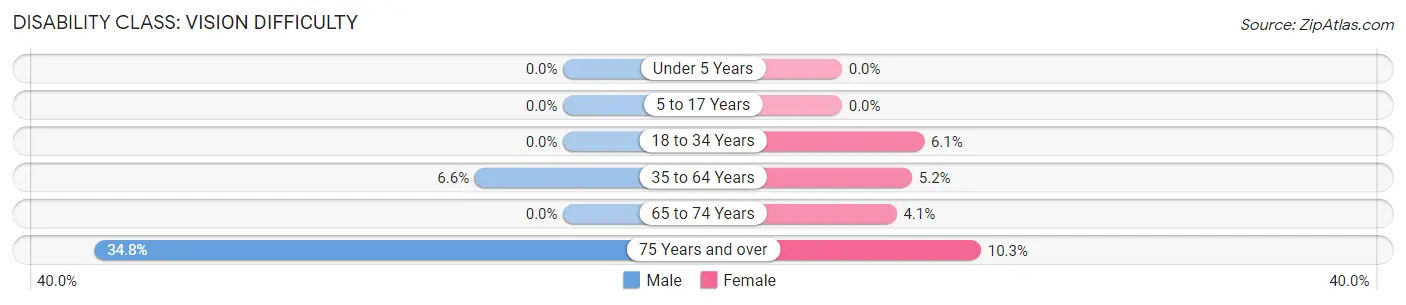
| Age Bracket | Male | Female |
| Under 5 Years | 0 (0.0%) | 0 (0.0%) |
| 5 to 17 Years | 0 (0.0%) | 0 (0.0%) |
| 18 to 34 Years | 0 (0.0%) | 23 (6.1%) |
| 35 to 64 Years | 82 (6.6%) | 56 (5.2%) |
| 65 to 74 Years | 0 (0.0%) | 11 (4.1%) |
| 75 Years and over | 31 (34.8%) | 13 (10.3%) |
Disability Class: Cognitive Difficulty
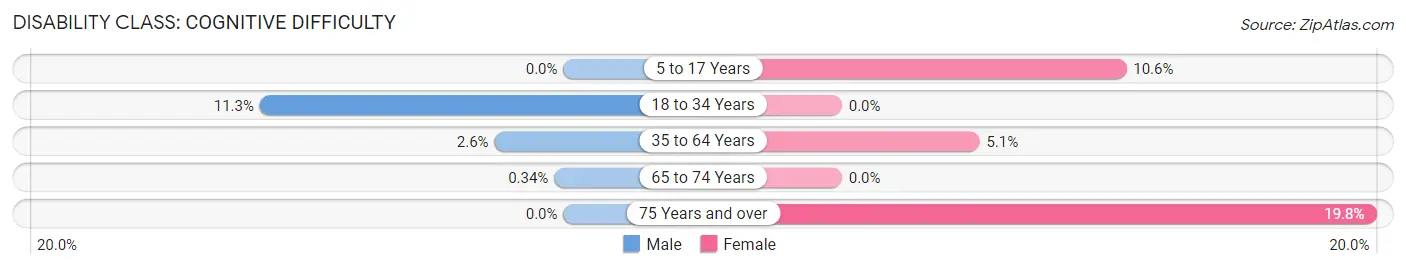
| Age Bracket | Male | Female |
| 5 to 17 Years | 0 (0.0%) | 62 (10.6%) |
| 18 to 34 Years | 78 (11.3%) | 0 (0.0%) |
| 35 to 64 Years | 32 (2.6%) | 55 (5.1%) |
| 65 to 74 Years | 1 (0.3%) | 0 (0.0%) |
| 75 Years and over | 0 (0.0%) | 25 (19.8%) |
Disability Class: Ambulatory Difficulty
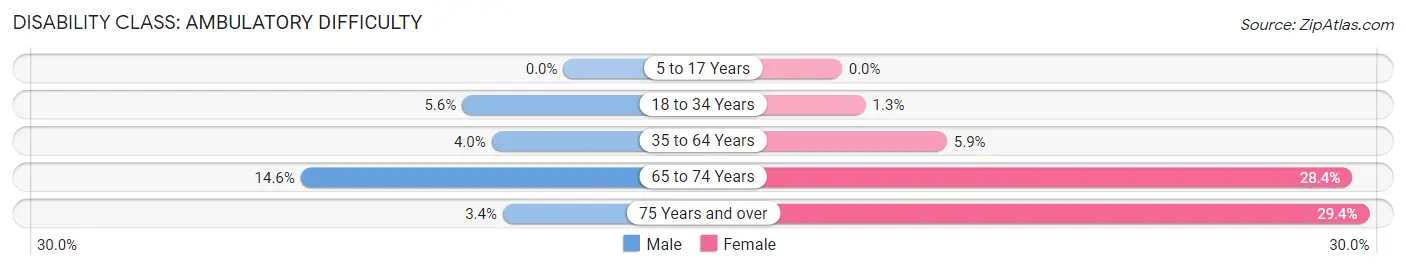
| Age Bracket | Male | Female |
| 5 to 17 Years | 0 (0.0%) | 0 (0.0%) |
| 18 to 34 Years | 39 (5.6%) | 5 (1.3%) |
| 35 to 64 Years | 50 (4.0%) | 63 (5.9%) |
| 65 to 74 Years | 43 (14.6%) | 77 (28.4%) |
| 75 Years and over | 3 (3.4%) | 37 (29.4%) |
Disability Class: Self-Care Difficulty
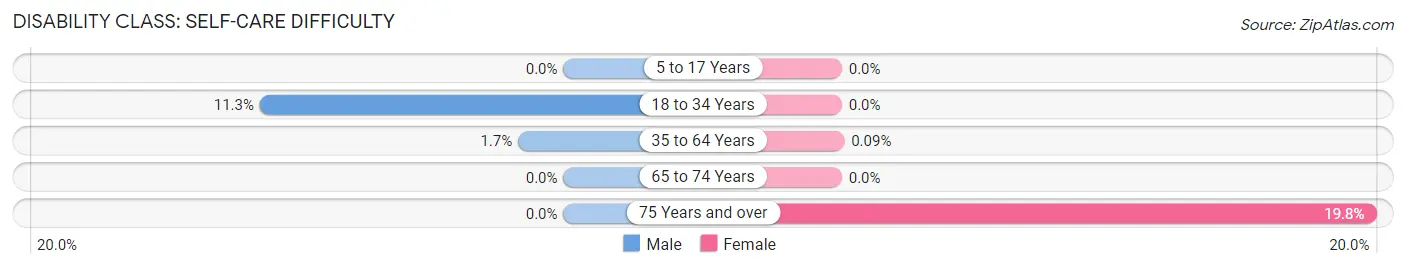
| Age Bracket | Male | Female |
| 5 to 17 Years | 0 (0.0%) | 0 (0.0%) |
| 18 to 34 Years | 78 (11.3%) | 0 (0.0%) |
| 35 to 64 Years | 21 (1.7%) | 1 (0.1%) |
| 65 to 74 Years | 0 (0.0%) | 0 (0.0%) |
| 75 Years and over | 0 (0.0%) | 25 (19.8%) |
Technology Access in Lander County
Computing Device Access in Lander County
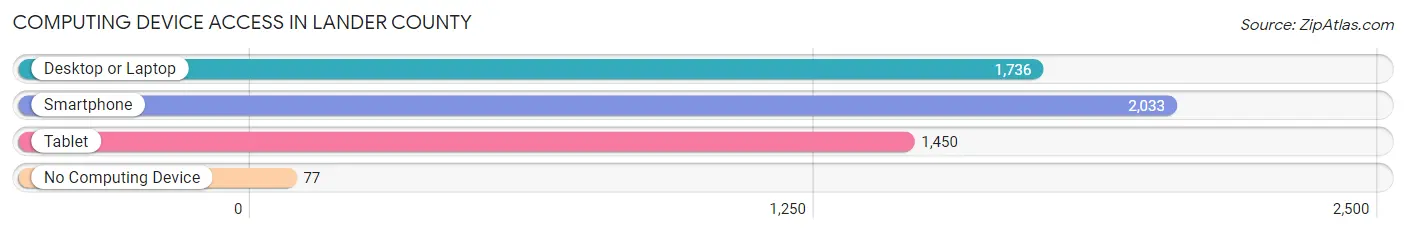
| Device Type | # Households | % Households |
| Desktop or Laptop | 1,736 | 76.9% |
| Smartphone | 2,033 | 90.1% |
| Tablet | 1,450 | 64.3% |
| No Computing Device | 77 | 3.4% |
| Total | 2,256 | 100.0% |
Internet Access in Lander County
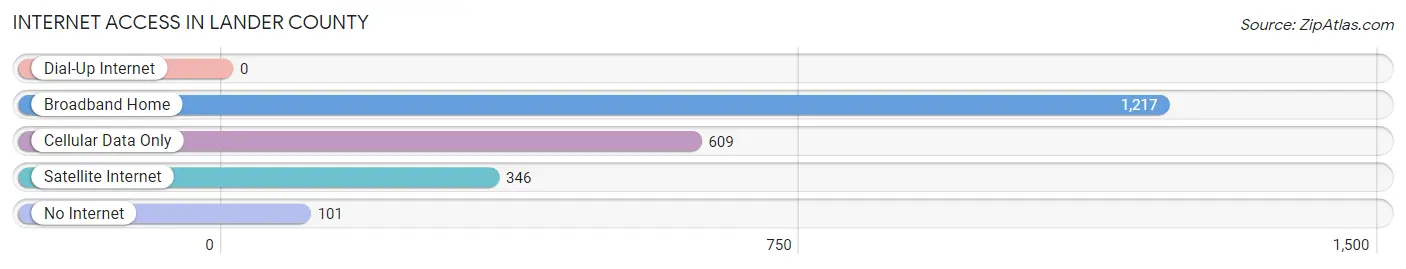
| Internet Type | # Households | % Households |
| Dial-Up Internet | 0 | 0.0% |
| Broadband Home | 1,217 | 53.9% |
| Cellular Data Only | 609 | 27.0% |
| Satellite Internet | 346 | 15.3% |
| No Internet | 101 | 4.5% |
| Total | 2,256 | 100.0% |
Lander County Summary
Lander County is located in the western part of the state of Nevada, and is bordered by Nye County to the south, Eureka County to the north, and Humboldt County to the east. The county seat is Battle Mountain, and the largest city is Austin. The county was established in 1862 and named after Frederick W. Lander, a Union general in the American Civil War.
Geography
Lander County covers an area of 5,567 square miles, making it the fourth largest county in Nevada. The county is located in the Basin and Range Province, and is characterized by a series of mountain ranges and valleys. The highest point in the county is Mount Lewis, which has an elevation of 8,945 feet. The county is home to several mountain ranges, including the Toiyabe Range, the Shoshone Range, and the Monitor Range. The county also contains several valleys, including the Reese River Valley, the Austin Valley, and the Battle Mountain Valley.
The county is home to several rivers and streams, including the Reese River, the Humboldt River, and the Quinn River. The county also contains several lakes, including Cave Lake, Big Creek Lake, and Little Fish Lake.
Climate
Lander County has a semi-arid climate, with hot summers and cold winters. The average annual temperature is 54°F, and the average annual precipitation is 8.5 inches.
Demographics
As of the 2010 census, the population of Lander County was 5,775. The racial makeup of the county was 84.3% White, 0.7% African American, 1.2% Native American, 0.4% Asian, 0.1% Pacific Islander, 10.7% from other races, and 2.6% from two or more races. Hispanic or Latino of any race were 20.3% of the population.
Economy
The economy of Lander County is largely based on mining and agriculture. The county is home to several gold and silver mines, and is also a major producer of copper, lead, and zinc. The county is also home to several ranches and farms, which produce hay, alfalfa, and other crops.
The county is also home to several businesses, including restaurants, hotels, and retail stores. The county is also home to several casinos, which provide employment and entertainment to the local population.
History
Lander County was established in 1862, and was named after Union general Frederick W. Lander. The county was originally part of Nye County, but was split off in 1864.
The county was home to several Native American tribes, including the Shoshone, Paiute, and Washoe. The first settlers in the county were miners, who arrived in the late 1860s in search of gold and silver. The county was also home to several ranches, which were established in the late 19th century.
The county experienced a population boom in the early 20th century, due to the discovery of copper and lead deposits. The county also experienced a population decline in the mid-20th century, due to the closure of several mines.
Today, Lander County is a rural county, with a population of just over 5,000. The county is home to several ranches and farms, as well as several mining operations. The county is also home to several businesses, including restaurants, hotels, and retail stores.
Common Questions
What is Per Capita Income in Lander County?
Per Capita income in Lander County is $41,561.
What is the Median Family Income in Lander County?
Median Family Income in Lander County is $101,968.
What is the Median Household income in Lander County?
Median Household Income in Lander County is $92,388.
What is Income or Wage Gap in Lander County?
Income or Wage Gap in Lander County is 41.0%.
Women in Lander County earn 59.0 cents for every dollar earned by a man.
What is Inequality or Gini Index in Lander County?
Inequality or Gini Index in Lander County is 0.40.
What is the Total Population of Lander County?
Total Population of Lander County is 5,728.
What is the Total Male Population of Lander County?
Total Male Population of Lander County is 3,109.
What is the Total Female Population of Lander County?
Total Female Population of Lander County is 2,619.
What is the Ratio of Males per 100 Females in Lander County?
There are 118.71 Males per 100 Females in Lander County.
What is the Ratio of Females per 100 Males in Lander County?
There are 84.24 Females per 100 Males in Lander County.
What is the Median Population Age in Lander County?
Median Population Age in Lander County is 40.0 Years.
What is the Average Family Size in Lander County
Average Family Size in Lander County is 3.0 People.
What is the Average Household Size in Lander County
Average Household Size in Lander County is 2.5 People.
How Large is the Labor Force in Lander County?
There are 2,644 People in the Labor Forcein in Lander County.
What is the Percentage of People in the Labor Force in Lander County?
60.1% of People are in the Labor Force in Lander County.
What is the Unemployment Rate in Lander County?
Unemployment Rate in Lander County is 11.7%.