Humboldt County, NV Map & Demographics
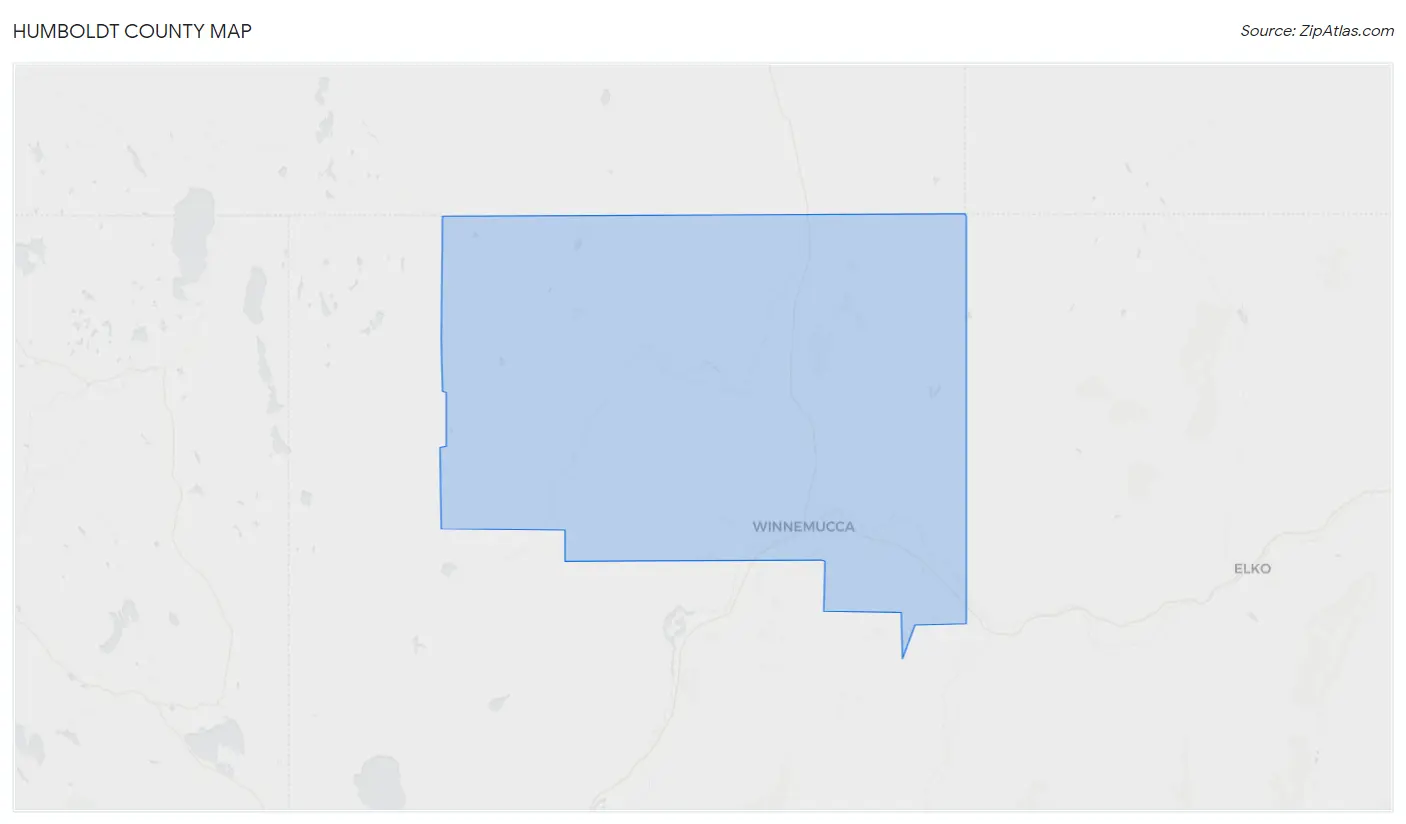
Humboldt County Map
Humboldt County Overview
$35,979
PER CAPITA INCOME
$86,944
AVG FAMILY INCOME
$75,574
AVG HOUSEHOLD INCOME
62.4%
WAGE / INCOME GAP [ % ]
37.6¢/ $1
WAGE / INCOME GAP [ $ ]
$10,196
FAMILY INCOME DEFICIT
0.45
INEQUALITY / GINI INDEX
17,266
TOTAL POPULATION
9,009
MALE POPULATION
8,257
FEMALE POPULATION
109.11
MALES / 100 FEMALES
91.65
FEMALES / 100 MALES
37.0
MEDIAN AGE
3.1
AVG FAMILY SIZE
2.4
AVG HOUSEHOLD SIZE
8,704
LABOR FORCE [ PEOPLE ]
65.6%
PERCENT IN LABOR FORCE
4.3%
UNEMPLOYMENT RATE
Humboldt County Area Codes
Income in Humboldt County
Income Overview in Humboldt County
Per Capita Income in Humboldt County is $35,979, while median incomes of families and households are $86,944 and $75,574 respectively.
| Characteristic | Number | Measure |
| Per Capita Income | 17,266 | $35,979 |
| Median Family Income | 4,564 | $86,944 |
| Mean Family Income | 4,564 | $97,707 |
| Median Household Income | 6,986 | $75,574 |
| Mean Household Income | 6,986 | $92,454 |
| Income Deficit | 4,564 | $10,196 |
| Wage / Income Gap (%) | 17,266 | 62.45% |
| Wage / Income Gap ($) | 17,266 | 37.55¢ per $1 |
| Gini / Inequality Index | 17,266 | 0.45 |
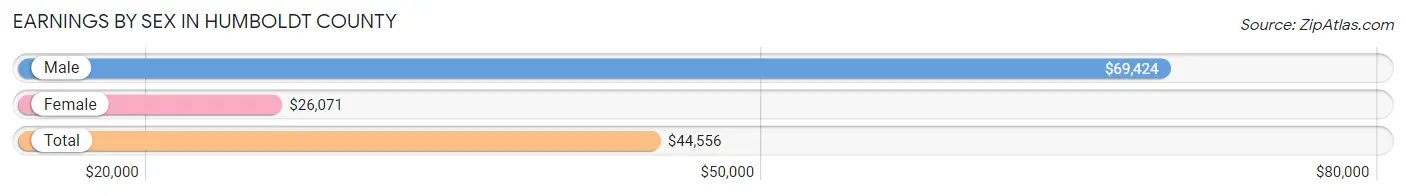
Earnings by Sex in Humboldt County
Average Earnings in Humboldt County are $44,556, $69,424 for men and $26,071 for women, a difference of 62.5%.
| Sex | Number | Average Earnings |
| Male | 5,211 (57.9%) | $69,424 |
| Female | 3,790 (42.1%) | $26,071 |
| Total | 9,001 (100.0%) | $44,556 |
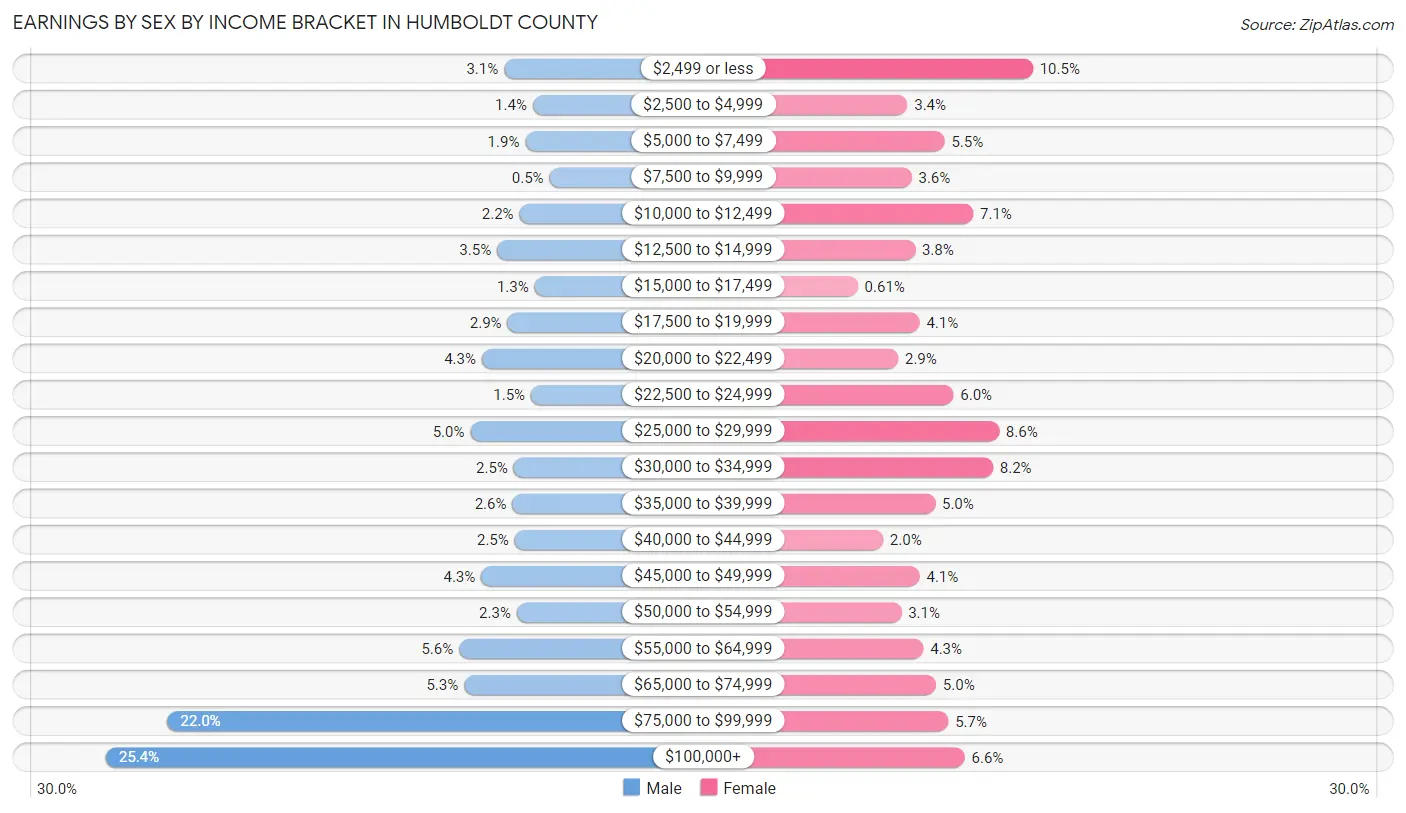
Earnings by Sex by Income Bracket in Humboldt County
The most common earnings brackets in Humboldt County are $100,000+ for men (1,325 | 25.4%) and $2,499 or less for women (396 | 10.4%).
| Income | Male | Female |
| $2,499 or less | 159 (3.0%) | 396 (10.4%) |
| $2,500 to $4,999 | 75 (1.4%) | 129 (3.4%) |
| $5,000 to $7,499 | 97 (1.9%) | 208 (5.5%) |
| $7,500 to $9,999 | 26 (0.5%) | 138 (3.6%) |
| $10,000 to $12,499 | 114 (2.2%) | 269 (7.1%) |
| $12,500 to $14,999 | 180 (3.5%) | 145 (3.8%) |
| $15,000 to $17,499 | 70 (1.3%) | 23 (0.6%) |
| $17,500 to $19,999 | 149 (2.9%) | 155 (4.1%) |
| $20,000 to $22,499 | 224 (4.3%) | 109 (2.9%) |
| $22,500 to $24,999 | 80 (1.5%) | 227 (6.0%) |
| $25,000 to $29,999 | 258 (5.0%) | 324 (8.6%) |
| $30,000 to $34,999 | 131 (2.5%) | 311 (8.2%) |
| $35,000 to $39,999 | 135 (2.6%) | 188 (5.0%) |
| $40,000 to $44,999 | 128 (2.5%) | 77 (2.0%) |
| $45,000 to $49,999 | 226 (4.3%) | 155 (4.1%) |
| $50,000 to $54,999 | 122 (2.3%) | 116 (3.1%) |
| $55,000 to $64,999 | 291 (5.6%) | 163 (4.3%) |
| $65,000 to $74,999 | 276 (5.3%) | 190 (5.0%) |
| $75,000 to $99,999 | 1,145 (22.0%) | 216 (5.7%) |
| $100,000+ | 1,325 (25.4%) | 251 (6.6%) |
| Total | 5,211 (100.0%) | 3,790 (100.0%) |
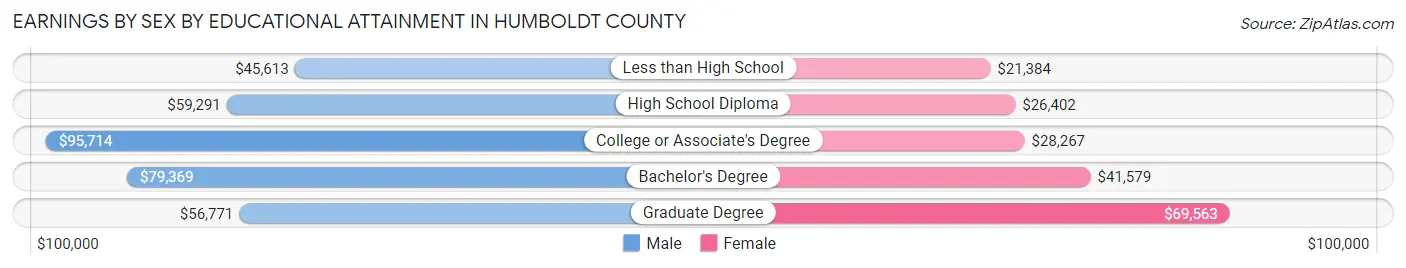
Earnings by Sex by Educational Attainment in Humboldt County
Average earnings in Humboldt County are $77,598 for men and $30,701 for women, a difference of 60.4%. Men with an educational attainment of college or associate's degree enjoy the highest average annual earnings of $95,714, while those with less than high school education earn the least with $45,613. Women with an educational attainment of graduate degree earn the most with the average annual earnings of $69,563, while those with less than high school education have the smallest earnings of $21,384.
| Educational Attainment | Male Income | Female Income |
| Less than High School | $45,613 | $21,384 |
| High School Diploma | $59,291 | $26,402 |
| College or Associate's Degree | $95,714 | $28,267 |
| Bachelor's Degree | $79,369 | $41,579 |
| Graduate Degree | $56,771 | $69,563 |
| Total | $77,598 | $30,701 |
Family Income in Humboldt County
Family Income Brackets in Humboldt County
According to the Humboldt County family income data, there are 1,100 families falling into the $100,000 to $149,999 income range, which is the most common income bracket and makes up 24.1% of all families. Conversely, the $10,000 to $14,999 income bracket is the least frequent group with only 68 families (1.5%) belonging to this category.
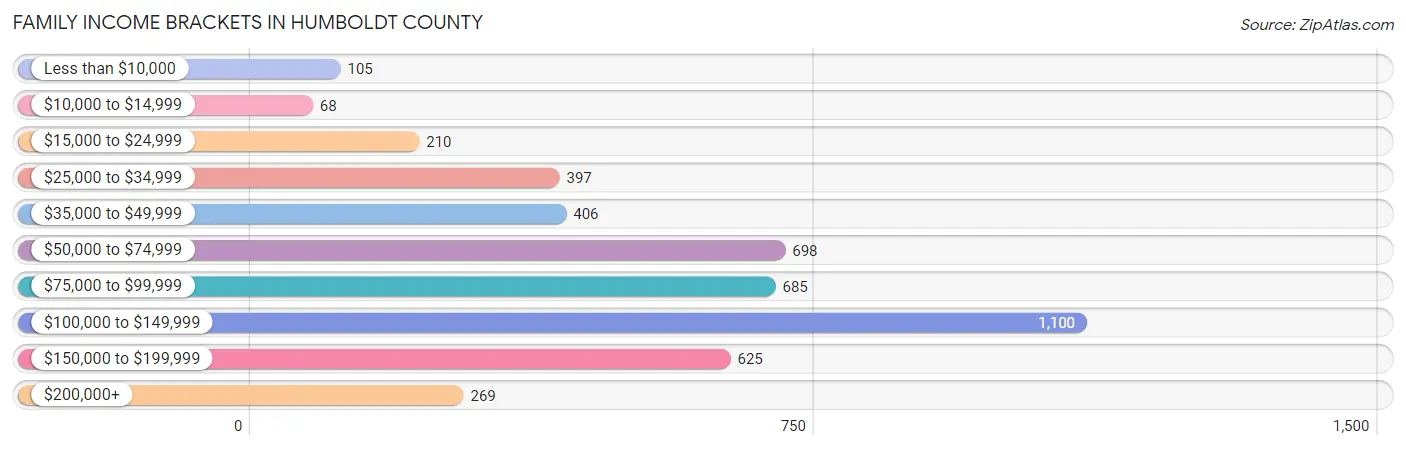
| Income Bracket | # Families | % Families |
| Less than $10,000 | 105 | 2.3% |
| $10,000 to $14,999 | 68 | 1.5% |
| $15,000 to $24,999 | 210 | 4.6% |
| $25,000 to $34,999 | 397 | 8.7% |
| $35,000 to $49,999 | 406 | 8.9% |
| $50,000 to $74,999 | 698 | 15.3% |
| $75,000 to $99,999 | 685 | 15.0% |
| $100,000 to $149,999 | 1,100 | 24.1% |
| $150,000 to $199,999 | 625 | 13.7% |
| $200,000+ | 269 | 5.9% |
Family Income by Famaliy Size in Humboldt County
4-person families (980 | 21.5%) account for the highest median family income in Humboldt County with $116,535 per family, while 2-person families (2,176 | 47.7%) have the highest median income of $41,909 per family member.
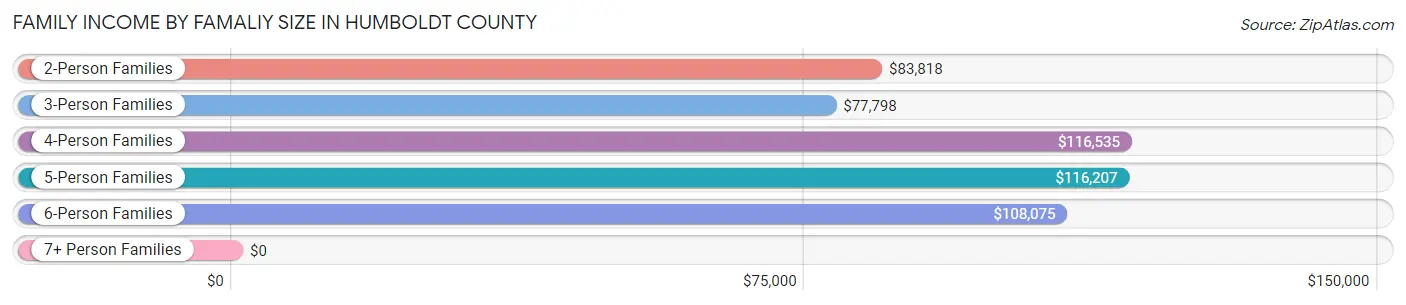
| Income Bracket | # Families | Median Income |
| 2-Person Families | 2,176 (47.7%) | $83,818 |
| 3-Person Families | 803 (17.6%) | $77,798 |
| 4-Person Families | 980 (21.5%) | $116,535 |
| 5-Person Families | 362 (7.9%) | $116,207 |
| 6-Person Families | 191 (4.2%) | $108,075 |
| 7+ Person Families | 52 (1.1%) | $0 |
| Total | 4,564 (100.0%) | $86,944 |
Family Income by Number of Earners in Humboldt County
The median family income in Humboldt County is $86,944, with families comprising 3+ earners (343) having the highest median family income of $131,230, while families with no earners (498) have the lowest median family income of $47,614, accounting for 7.5% and 10.9% of families, respectively.
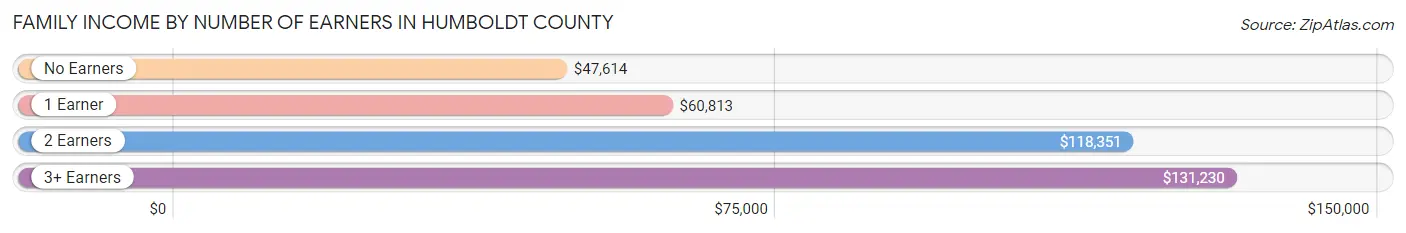
| Number of Earners | # Families | Median Income |
| No Earners | 498 (10.9%) | $47,614 |
| 1 Earner | 1,449 (31.8%) | $60,813 |
| 2 Earners | 2,274 (49.8%) | $118,351 |
| 3+ Earners | 343 (7.5%) | $131,230 |
| Total | 4,564 (100.0%) | $86,944 |
Household Income in Humboldt County
Household Income Brackets in Humboldt County
With 1,320 households falling in the category, the $100,000 to $149,999 income range is the most frequent in Humboldt County, accounting for 18.9% of all households. In contrast, only 335 households (4.8%) fall into the $10,000 to $14,999 income bracket, making it the least populous group.
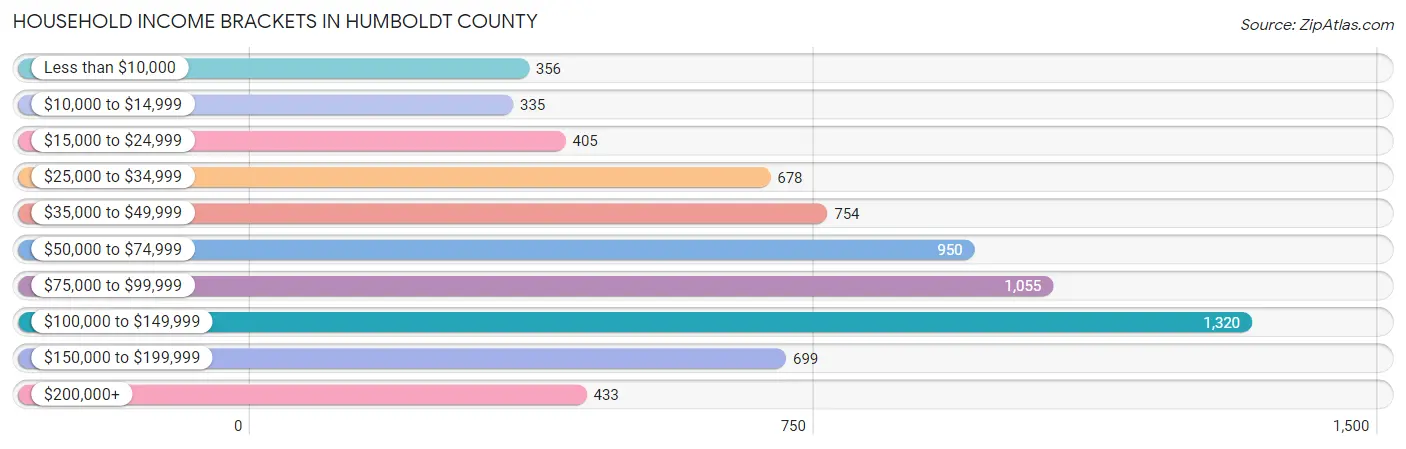
| Income Bracket | # Households | % Households |
| Less than $10,000 | 356 | 5.1% |
| $10,000 to $14,999 | 335 | 4.8% |
| $15,000 to $24,999 | 405 | 5.8% |
| $25,000 to $34,999 | 678 | 9.7% |
| $35,000 to $49,999 | 754 | 10.8% |
| $50,000 to $74,999 | 950 | 13.6% |
| $75,000 to $99,999 | 1,055 | 15.1% |
| $100,000 to $149,999 | 1,320 | 18.9% |
| $150,000 to $199,999 | 699 | 10.0% |
| $200,000+ | 433 | 6.2% |
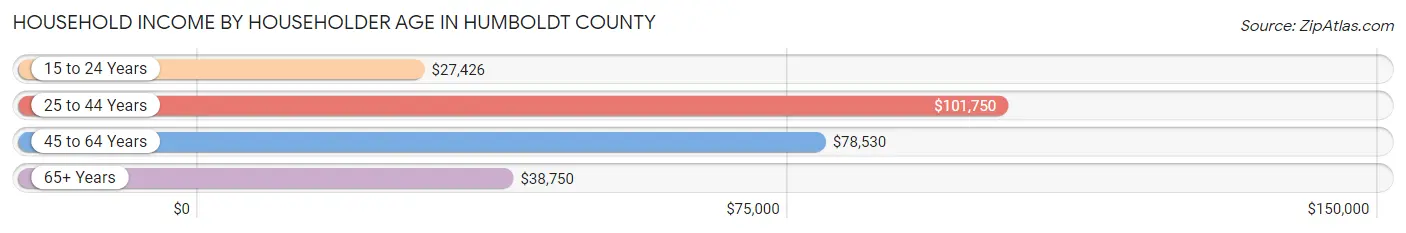
Household Income by Householder Age in Humboldt County
The median household income in Humboldt County is $75,574, with the highest median household income of $101,750 found in the 25 to 44 years age bracket for the primary householder. A total of 2,328 households (33.3%) fall into this category. Meanwhile, the 15 to 24 years age bracket for the primary householder has the lowest median household income of $27,426, with 349 households (5.0%) in this group.
| Income Bracket | # Households | Median Income |
| 15 to 24 Years | 349 (5.0%) | $27,426 |
| 25 to 44 Years | 2,328 (33.3%) | $101,750 |
| 45 to 64 Years | 2,633 (37.7%) | $78,530 |
| 65+ Years | 1,676 (24.0%) | $38,750 |
| Total | 6,986 (100.0%) | $75,574 |
Poverty in Humboldt County
Income Below Poverty by Sex and Age in Humboldt County
With 11.2% poverty level for males and 17.7% for females among the residents of Humboldt County, 16 and 17 year old males and 16 and 17 year old females are the most vulnerable to poverty, with 128 males (45.1%) and 106 females (38.8%) in their respective age groups living below the poverty level.
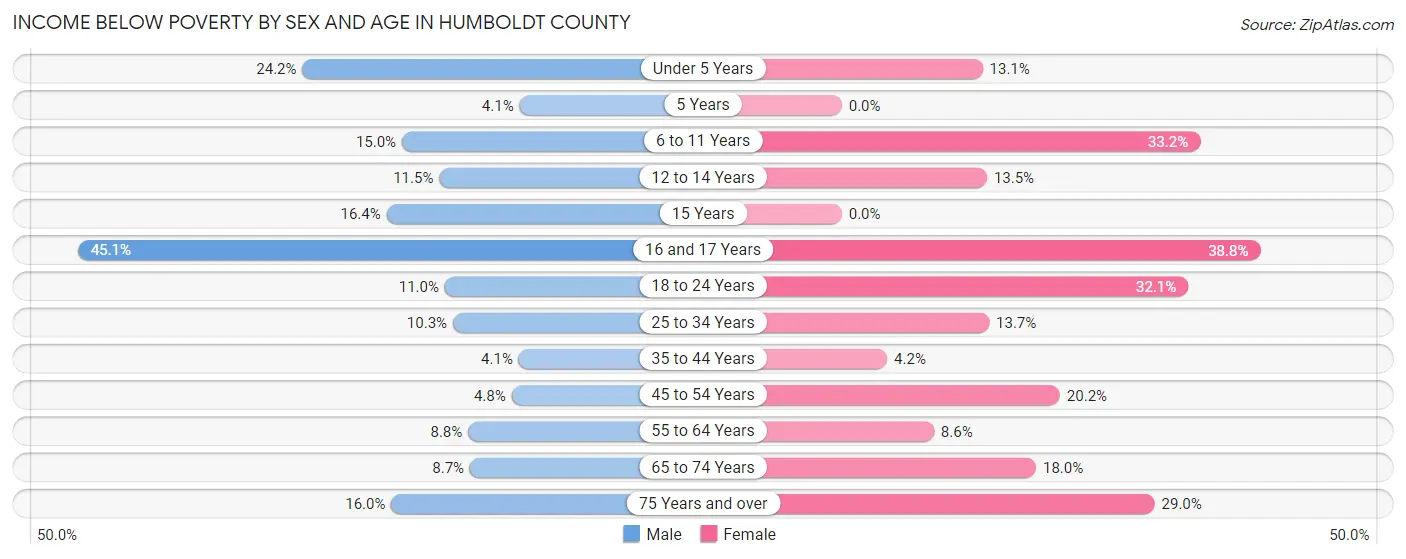
| Age Bracket | Male | Female |
| Under 5 Years | 132 (24.2%) | 83 (13.1%) |
| 5 Years | 5 (4.1%) | 0 (0.0%) |
| 6 to 11 Years | 102 (15.0%) | 230 (33.2%) |
| 12 to 14 Years | 62 (11.5%) | 59 (13.5%) |
| 15 Years | 21 (16.4%) | 0 (0.0%) |
| 16 and 17 Years | 128 (45.1%) | 106 (38.8%) |
| 18 to 24 Years | 76 (11.0%) | 215 (32.1%) |
| 25 to 34 Years | 125 (10.2%) | 140 (13.7%) |
| 35 to 44 Years | 44 (4.1%) | 40 (4.2%) |
| 45 to 54 Years | 55 (4.8%) | 222 (20.2%) |
| 55 to 64 Years | 92 (8.8%) | 87 (8.6%) |
| 65 to 74 Years | 87 (8.7%) | 132 (18.0%) |
| 75 Years and over | 61 (16.0%) | 144 (29.0%) |
| Total | 990 (11.2%) | 1,458 (17.7%) |
Income Above Poverty by Sex and Age in Humboldt County
According to the poverty statistics in Humboldt County, males aged 5 years and females aged 5 years are the age groups that are most secure financially, with 95.9% of males and 100.0% of females in these age groups living above the poverty line.
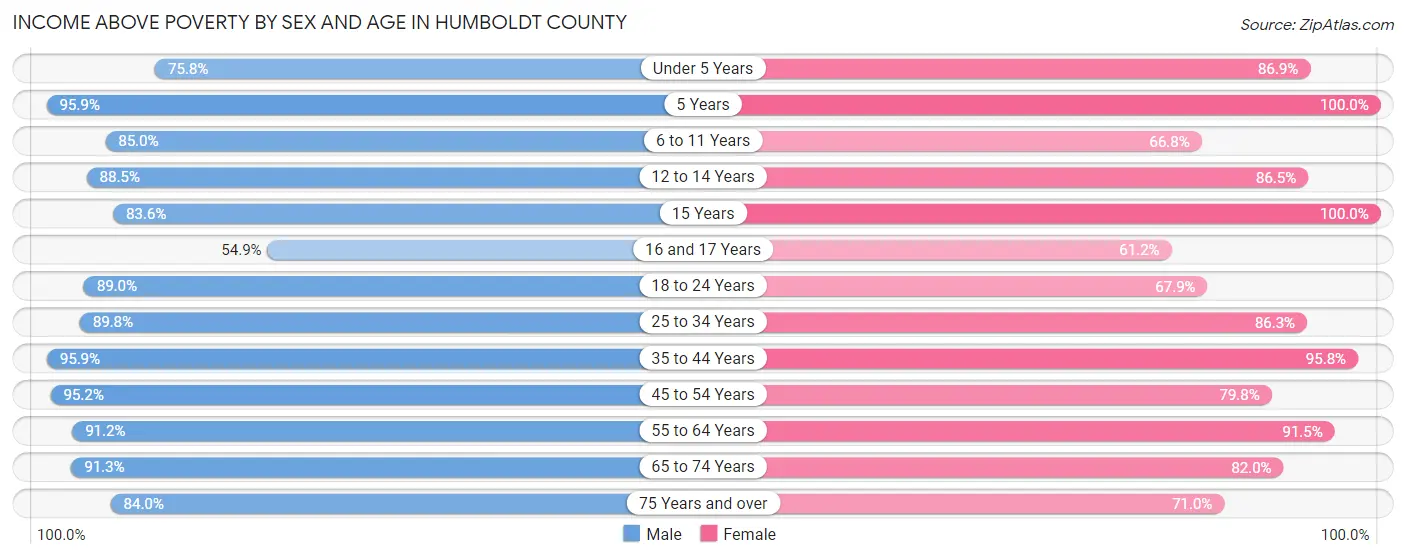
| Age Bracket | Male | Female |
| Under 5 Years | 413 (75.8%) | 552 (86.9%) |
| 5 Years | 118 (95.9%) | 148 (100.0%) |
| 6 to 11 Years | 579 (85.0%) | 462 (66.8%) |
| 12 to 14 Years | 476 (88.5%) | 379 (86.5%) |
| 15 Years | 107 (83.6%) | 69 (100.0%) |
| 16 and 17 Years | 156 (54.9%) | 167 (61.2%) |
| 18 to 24 Years | 615 (89.0%) | 454 (67.9%) |
| 25 to 34 Years | 1,094 (89.7%) | 884 (86.3%) |
| 35 to 44 Years | 1,018 (95.9%) | 911 (95.8%) |
| 45 to 54 Years | 1,089 (95.2%) | 875 (79.8%) |
| 55 to 64 Years | 949 (91.2%) | 930 (91.4%) |
| 65 to 74 Years | 916 (91.3%) | 600 (82.0%) |
| 75 Years and over | 321 (84.0%) | 352 (71.0%) |
| Total | 7,851 (88.8%) | 6,783 (82.3%) |
Income Below Poverty Among Married-Couple Families in Humboldt County
The poverty statistics for married-couple families in Humboldt County show that 3.8% or 139 of the total 3,653 families live below the poverty line. Families with 3 or 4 children have the highest poverty rate of 11.1%, comprising of 40 families. On the other hand, families with 5 or more children have the lowest poverty rate of 0.0%, which includes 0 families.
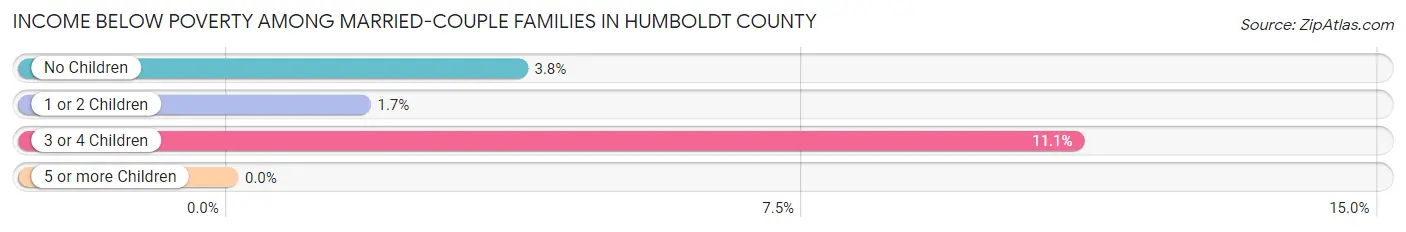
| Children | Above Poverty | Below Poverty |
| No Children | 1,988 (96.2%) | 78 (3.8%) |
| 1 or 2 Children | 1,195 (98.3%) | 21 (1.7%) |
| 3 or 4 Children | 322 (88.9%) | 40 (11.1%) |
| 5 or more Children | 9 (100.0%) | 0 (0.0%) |
| Total | 3,514 (96.2%) | 139 (3.8%) |
Income Below Poverty Among Single-Parent Households in Humboldt County
According to the poverty data in Humboldt County, 40.6% or 164 single-father households and 30.0% or 152 single-mother households are living below the poverty line. Among single-father households, those with 3 or 4 children have the highest poverty rate, with 54 households (81.8%) experiencing poverty. Likewise, among single-mother households, those with 5 or more children have the highest poverty rate, with 44 households (88.0%) falling below the poverty line.
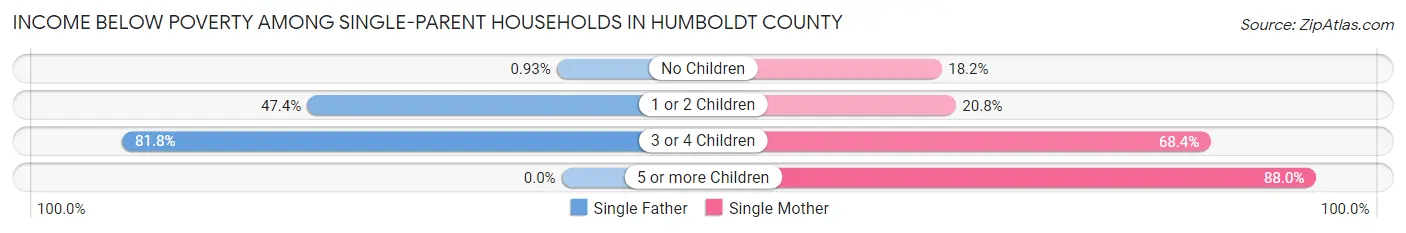
| Children | Single Father | Single Mother |
| No Children | 1 (0.9%) | 36 (18.2%) |
| 1 or 2 Children | 109 (47.4%) | 46 (20.8%) |
| 3 or 4 Children | 54 (81.8%) | 26 (68.4%) |
| 5 or more Children | 0 (0.0%) | 44 (88.0%) |
| Total | 164 (40.6%) | 152 (30.0%) |
Income Below Poverty Among Married-Couple vs Single-Parent Households in Humboldt County
The poverty data for Humboldt County shows that 139 of the married-couple family households (3.8%) and 316 of the single-parent households (34.7%) are living below the poverty level. Within the married-couple family households, those with 3 or 4 children have the highest poverty rate, with 40 households (11.1%) falling below the poverty line. Among the single-parent households, those with 5 or more children have the highest poverty rate, with 44 household (86.3%) living below poverty.
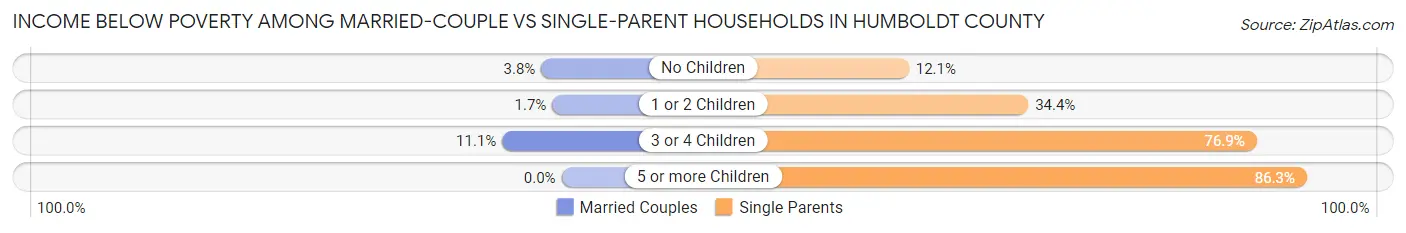
| Children | Married-Couple Families | Single-Parent Households |
| No Children | 78 (3.8%) | 37 (12.1%) |
| 1 or 2 Children | 21 (1.7%) | 155 (34.4%) |
| 3 or 4 Children | 40 (11.1%) | 80 (76.9%) |
| 5 or more Children | 0 (0.0%) | 44 (86.3%) |
| Total | 139 (3.8%) | 316 (34.7%) |
Race in Humboldt County
The most populous races in Humboldt County are White / Caucasian (13,091 | 75.8%), Hispanic or Latino (4,815 | 27.9%), and Some other Race (1,569 | 9.1%).
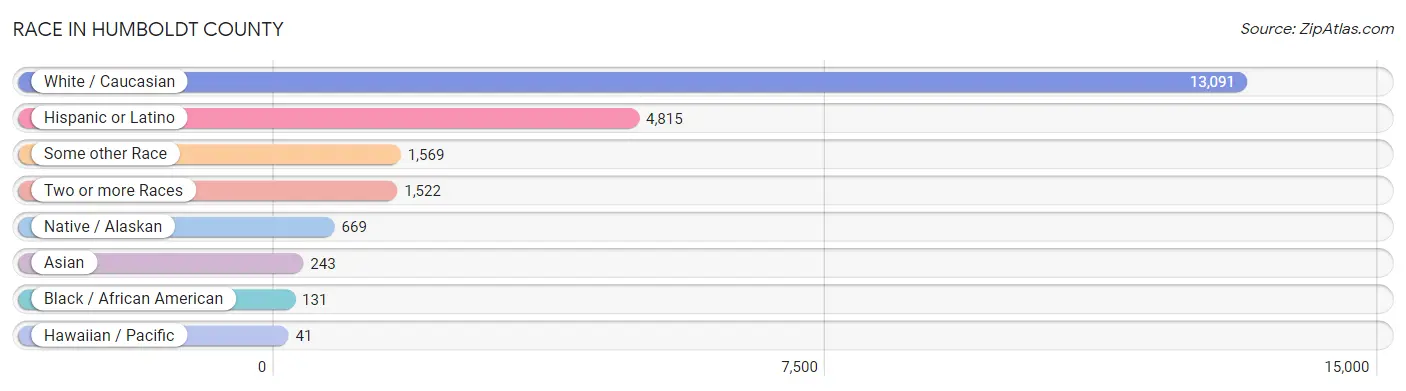
| Race | # Population | % Population |
| Asian | 243 | 1.4% |
| Black / African American | 131 | 0.8% |
| Hawaiian / Pacific | 41 | 0.2% |
| Hispanic or Latino | 4,815 | 27.9% |
| Native / Alaskan | 669 | 3.9% |
| White / Caucasian | 13,091 | 75.8% |
| Two or more Races | 1,522 | 8.8% |
| Some other Race | 1,569 | 9.1% |
| Total | 17,266 | 100.0% |
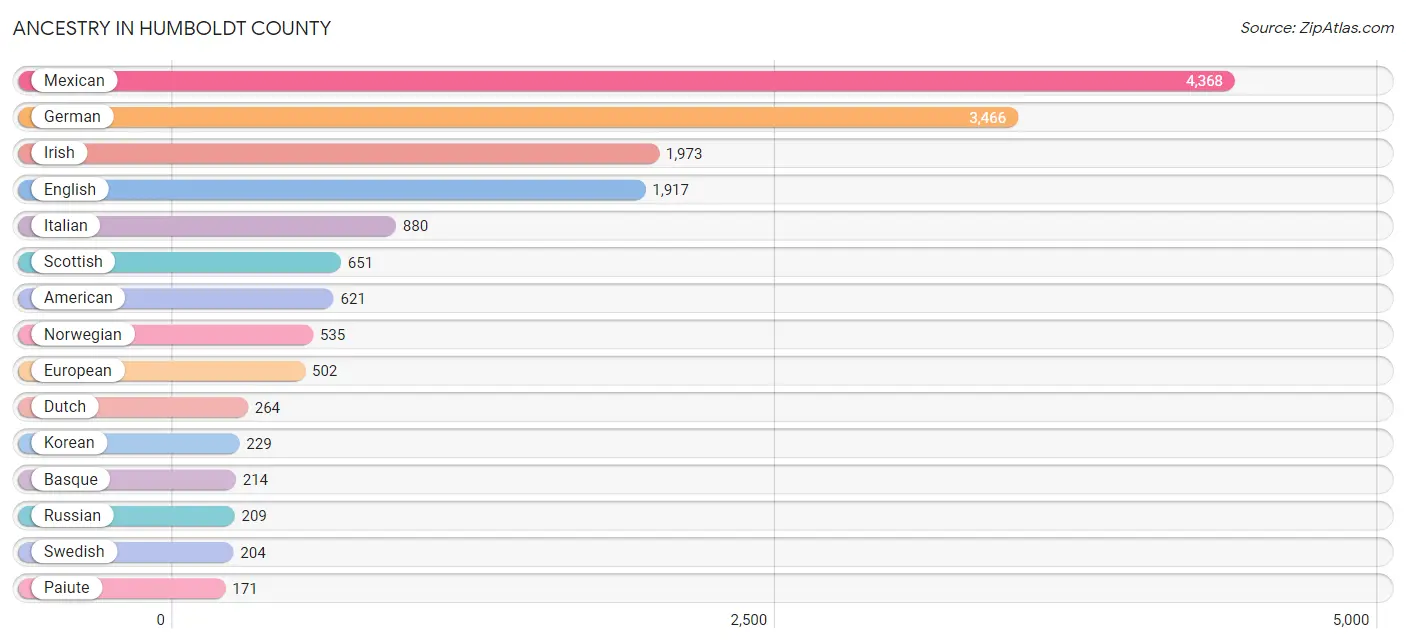
Ancestry in Humboldt County
The most populous ancestries reported in Humboldt County are Mexican (4,368 | 25.3%), German (3,466 | 20.1%), Irish (1,973 | 11.4%), English (1,917 | 11.1%), and Italian (880 | 5.1%), together accounting for 73.0% of all Humboldt County residents.
| Ancestry | # Population | % Population |
| African | 15 | 0.1% |
| Aleut | 32 | 0.2% |
| American | 621 | 3.6% |
| Arab | 37 | 0.2% |
| Austrian | 12 | 0.1% |
| Basque | 214 | 1.2% |
| Bhutanese | 2 | 0.0% |
| British | 86 | 0.5% |
| Burmese | 12 | 0.1% |
| Canadian | 29 | 0.2% |
| Central American | 73 | 0.4% |
| Cherokee | 152 | 0.9% |
| Chippewa | 13 | 0.1% |
| Choctaw | 13 | 0.1% |
| Danish | 27 | 0.2% |
| Dutch | 264 | 1.5% |
| Dutch West Indian | 11 | 0.1% |
| Eastern European | 14 | 0.1% |
| Egyptian | 5 | 0.0% |
| English | 1,917 | 11.1% |
| European | 502 | 2.9% |
| French | 168 | 1.0% |
| French Canadian | 50 | 0.3% |
| German | 3,466 | 20.1% |
| Ghanaian | 20 | 0.1% |
| Greek | 9 | 0.1% |
| Hungarian | 53 | 0.3% |
| Icelander | 14 | 0.1% |
| Indian (Asian) | 2 | 0.0% |
| Irish | 1,973 | 11.4% |
| Italian | 880 | 5.1% |
| Korean | 229 | 1.3% |
| Lebanese | 32 | 0.2% |
| Mexican | 4,368 | 25.3% |
| Mexican American Indian | 10 | 0.1% |
| Native Hawaiian | 45 | 0.3% |
| Navajo | 10 | 0.1% |
| Northern European | 34 | 0.2% |
| Norwegian | 535 | 3.1% |
| Paiute | 171 | 1.0% |
| Polish | 88 | 0.5% |
| Portuguese | 32 | 0.2% |
| Puerto Rican | 55 | 0.3% |
| Russian | 209 | 1.2% |
| Salvadoran | 73 | 0.4% |
| Scandinavian | 81 | 0.5% |
| Scotch-Irish | 38 | 0.2% |
| Scottish | 651 | 3.8% |
| Shoshone | 105 | 0.6% |
| Sioux | 22 | 0.1% |
| Slavic | 9 | 0.1% |
| Spaniard | 78 | 0.4% |
| Spanish | 112 | 0.6% |
| Subsaharan African | 35 | 0.2% |
| Swedish | 204 | 1.2% |
| Swiss | 76 | 0.4% |
| Welsh | 25 | 0.1% | View All 57 Rows |
Immigrants in Humboldt County
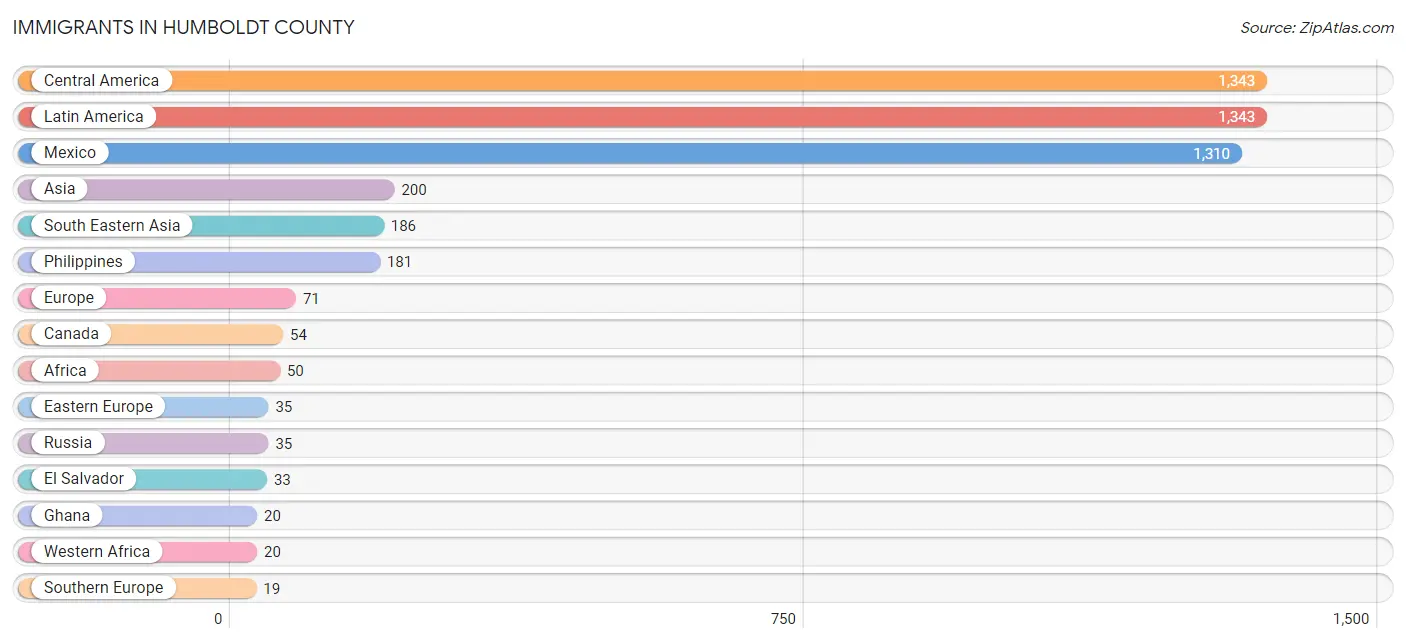
The most numerous immigrant groups reported in Humboldt County came from Central America (1,343 | 7.8%), Latin America (1,343 | 7.8%), Mexico (1,310 | 7.6%), Asia (200 | 1.2%), and South Eastern Asia (186 | 1.1%), together accounting for 25.4% of all Humboldt County residents.
| Immigration Origin | # Population | % Population |
| Africa | 50 | 0.3% |
| Asia | 200 | 1.2% |
| Canada | 54 | 0.3% |
| Central America | 1,343 | 7.8% |
| China | 2 | 0.0% |
| Eastern Africa | 12 | 0.1% |
| Eastern Asia | 14 | 0.1% |
| Eastern Europe | 35 | 0.2% |
| Egypt | 5 | 0.0% |
| El Salvador | 33 | 0.2% |
| England | 5 | 0.0% |
| Eritrea | 5 | 0.0% |
| Ethiopia | 7 | 0.0% |
| Europe | 71 | 0.4% |
| Germany | 12 | 0.1% |
| Ghana | 20 | 0.1% |
| Indonesia | 5 | 0.0% |
| Korea | 12 | 0.1% |
| Latin America | 1,343 | 7.8% |
| Mexico | 1,310 | 7.6% |
| Northern Africa | 5 | 0.0% |
| Northern Europe | 5 | 0.0% |
| Philippines | 181 | 1.1% |
| Russia | 35 | 0.2% |
| South Africa | 13 | 0.1% |
| South Eastern Asia | 186 | 1.1% |
| Southern Europe | 19 | 0.1% |
| Spain | 19 | 0.1% |
| Western Africa | 20 | 0.1% |
| Western Europe | 12 | 0.1% | View All 30 Rows |
Sex and Age in Humboldt County
Sex and Age in Humboldt County
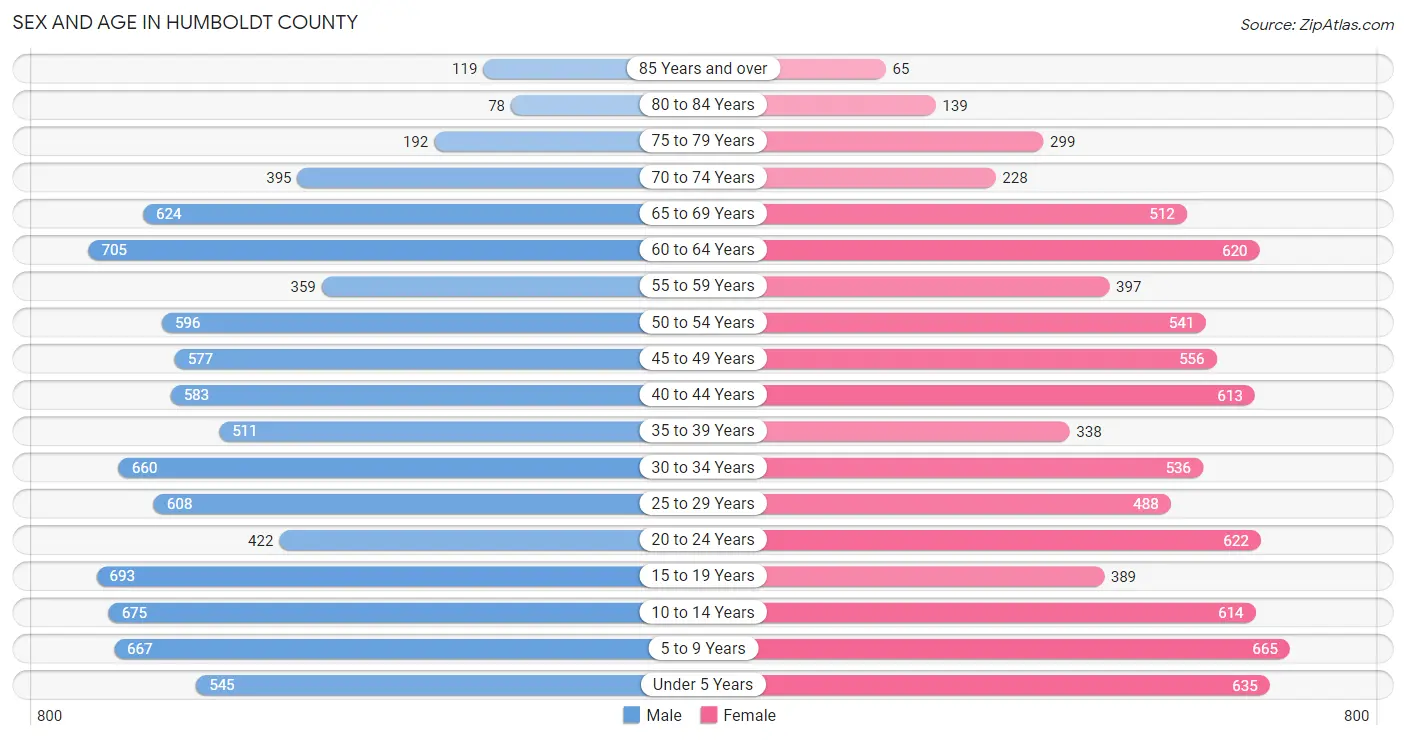
The most populous age groups in Humboldt County are 60 to 64 Years (705 | 7.8%) for men and 5 to 9 Years (665 | 8.1%) for women.
| Age Bracket | Male | Female |
| Under 5 Years | 545 (6.0%) | 635 (7.7%) |
| 5 to 9 Years | 667 (7.4%) | 665 (8.1%) |
| 10 to 14 Years | 675 (7.5%) | 614 (7.4%) |
| 15 to 19 Years | 693 (7.7%) | 389 (4.7%) |
| 20 to 24 Years | 422 (4.7%) | 622 (7.5%) |
| 25 to 29 Years | 608 (6.8%) | 488 (5.9%) |
| 30 to 34 Years | 660 (7.3%) | 536 (6.5%) |
| 35 to 39 Years | 511 (5.7%) | 338 (4.1%) |
| 40 to 44 Years | 583 (6.5%) | 613 (7.4%) |
| 45 to 49 Years | 577 (6.4%) | 556 (6.7%) |
| 50 to 54 Years | 596 (6.6%) | 541 (6.6%) |
| 55 to 59 Years | 359 (4.0%) | 397 (4.8%) |
| 60 to 64 Years | 705 (7.8%) | 620 (7.5%) |
| 65 to 69 Years | 624 (6.9%) | 512 (6.2%) |
| 70 to 74 Years | 395 (4.4%) | 228 (2.8%) |
| 75 to 79 Years | 192 (2.1%) | 299 (3.6%) |
| 80 to 84 Years | 78 (0.9%) | 139 (1.7%) |
| 85 Years and over | 119 (1.3%) | 65 (0.8%) |
| Total | 9,009 (100.0%) | 8,257 (100.0%) |
Families and Households in Humboldt County
Median Family Size in Humboldt County
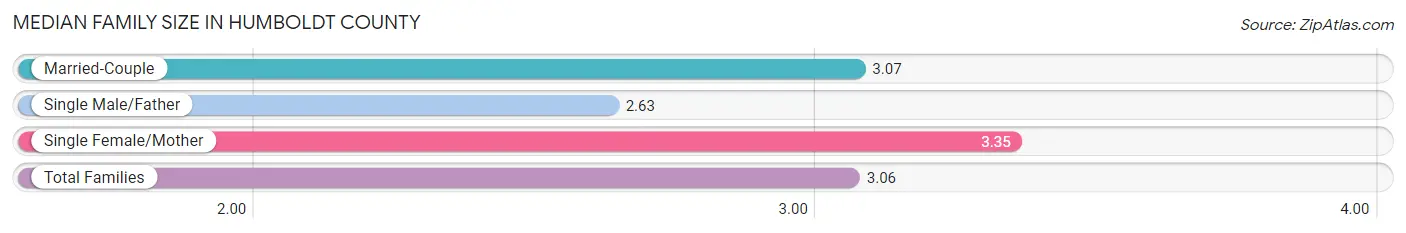
The median family size in Humboldt County is 3.06 persons per family, with single female/mother families (507 | 11.1%) accounting for the largest median family size of 3.35 persons per family. On the other hand, single male/father families (404 | 8.8%) represent the smallest median family size with 2.63 persons per family.
| Family Type | # Families | Family Size |
| Married-Couple | 3,653 (80.0%) | 3.07 |
| Single Male/Father | 404 (8.8%) | 2.63 |
| Single Female/Mother | 507 (11.1%) | 3.35 |
| Total Families | 4,564 (100.0%) | 3.06 |
Median Household Size in Humboldt County
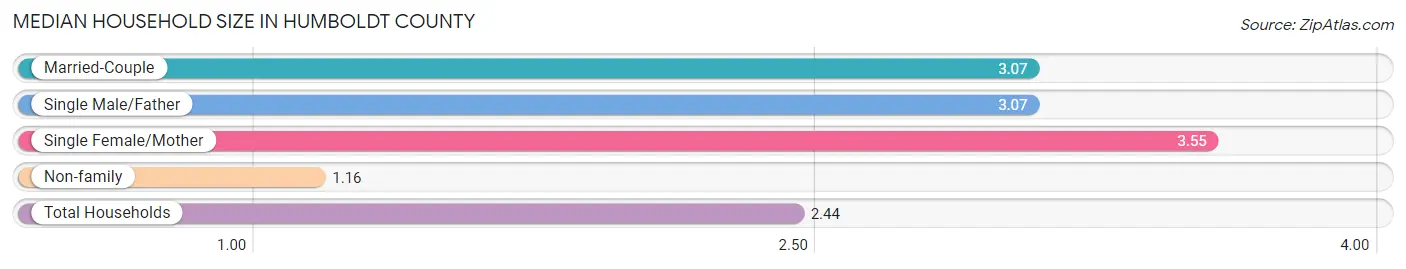
The median household size in Humboldt County is 2.44 persons per household, with single female/mother households (507 | 7.3%) accounting for the largest median household size of 3.55 persons per household. non-family households (2,422 | 34.7%) represent the smallest median household size with 1.16 persons per household.
| Household Type | # Households | Household Size |
| Married-Couple | 3,653 (52.3%) | 3.07 |
| Single Male/Father | 404 (5.8%) | 3.07 |
| Single Female/Mother | 507 (7.3%) | 3.55 |
| Non-family | 2,422 (34.7%) | 1.16 |
| Total Households | 6,986 (100.0%) | 2.44 |
Household Size by Marriage Status in Humboldt County
Out of a total of 6,986 households in Humboldt County, 4,564 (65.3%) are family households, while 2,422 (34.7%) are nonfamily households. The most numerous type of family households are 2-person households, comprising 2,092, and the most common type of nonfamily households are 1-person households, comprising 2,043.
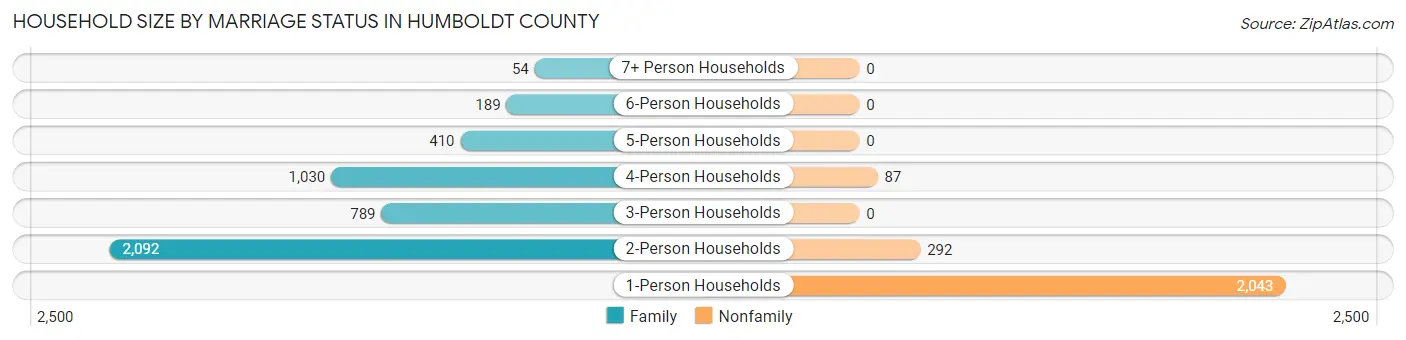
| Household Size | Family Households | Nonfamily Households |
| 1-Person Households | - | 2,043 (29.2%) |
| 2-Person Households | 2,092 (29.9%) | 292 (4.2%) |
| 3-Person Households | 789 (11.3%) | 0 (0.0%) |
| 4-Person Households | 1,030 (14.7%) | 87 (1.3%) |
| 5-Person Households | 410 (5.9%) | 0 (0.0%) |
| 6-Person Households | 189 (2.7%) | 0 (0.0%) |
| 7+ Person Households | 54 (0.8%) | 0 (0.0%) |
| Total | 4,564 (65.3%) | 2,422 (34.7%) |
Female Fertility in Humboldt County
Fertility by Age in Humboldt County
Average fertility rate in Humboldt County is 70.0 births per 1,000 women. Women in the age bracket of 20 to 34 years have the highest fertility rate with 152.0 births per 1,000 women. Women in the age bracket of 20 to 34 years acount for 98.8% of all women with births.
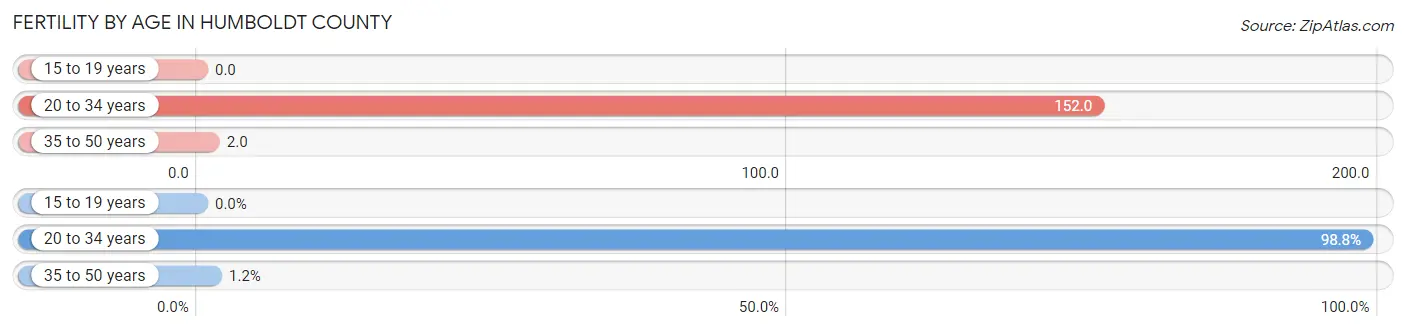
| Age Bracket | Women with Births | Births / 1,000 Women |
| 15 to 19 years | 0 (0.0%) | 0.0 |
| 20 to 34 years | 250 (98.8%) | 152.0 |
| 35 to 50 years | 3 (1.2%) | 2.0 |
| Total | 253 (100.0%) | 70.0 |
Fertility by Age by Marriage Status in Humboldt County
72.7% of women with births (253) in Humboldt County are married. The highest percentage of unmarried women with births falls into 20 to 34 years age bracket with 27.6% of them unmarried at the time of birth, while the lowest percentage of unmarried women with births belong to 35 to 50 years age bracket with 0.0% of them unmarried.
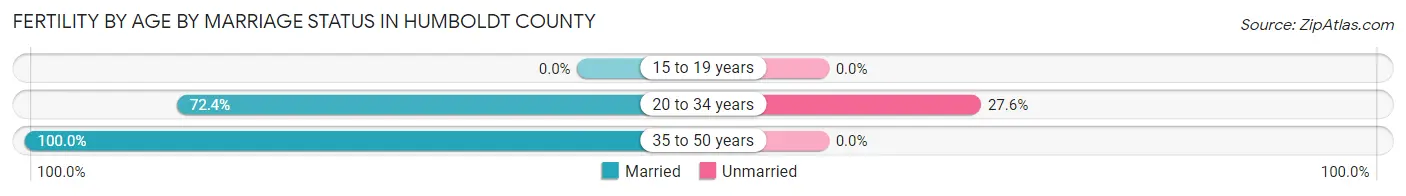
| Age Bracket | Married | Unmarried |
| 15 to 19 years | 0 (0.0%) | 0 (0.0%) |
| 20 to 34 years | 181 (72.4%) | 69 (27.6%) |
| 35 to 50 years | 3 (100.0%) | 0 (0.0%) |
| Total | 184 (72.7%) | 69 (27.3%) |
Fertility by Education in Humboldt County
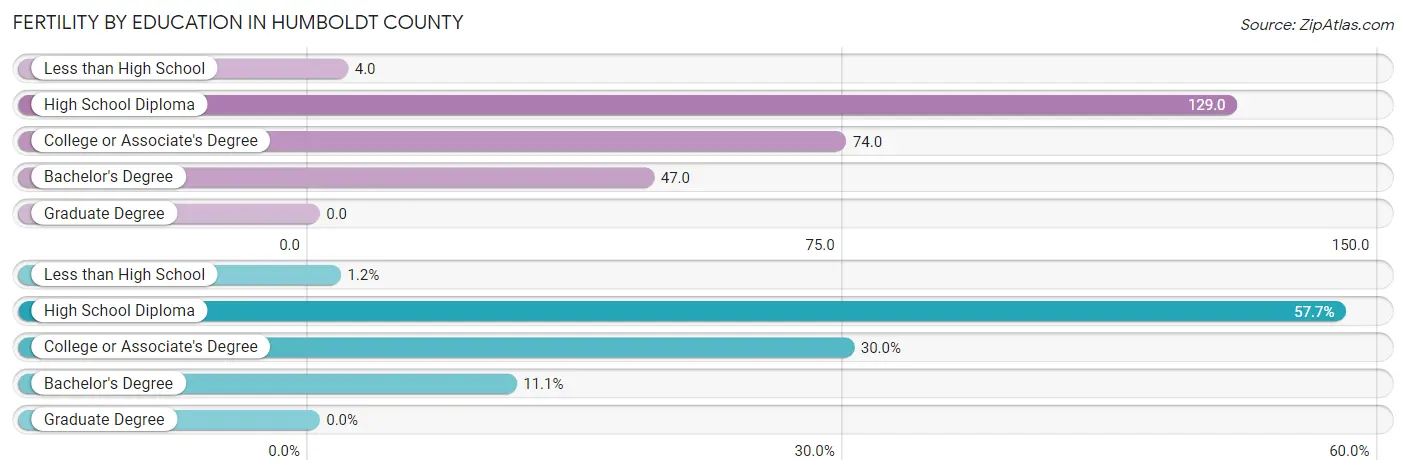
| Educational Attainment | Women with Births | Births / 1,000 Women |
| Less than High School | 3 (1.2%) | 4.0 |
| High School Diploma | 146 (57.7%) | 129.0 |
| College or Associate's Degree | 76 (30.0%) | 74.0 |
| Bachelor's Degree | 28 (11.1%) | 47.0 |
| Graduate Degree | 0 (0.0%) | 0.0 |
| Total | 253 (100.0%) | 70.0 |
Fertility by Education by Marriage Status in Humboldt County
27.3% of women with births in Humboldt County are unmarried. Women with the educational attainment of college or associate's degree are most likely to be married with 100.0% of them married at childbirth, while women with the educational attainment of less than high school are least likely to be married with 100.0% of them unmarried at childbirth.
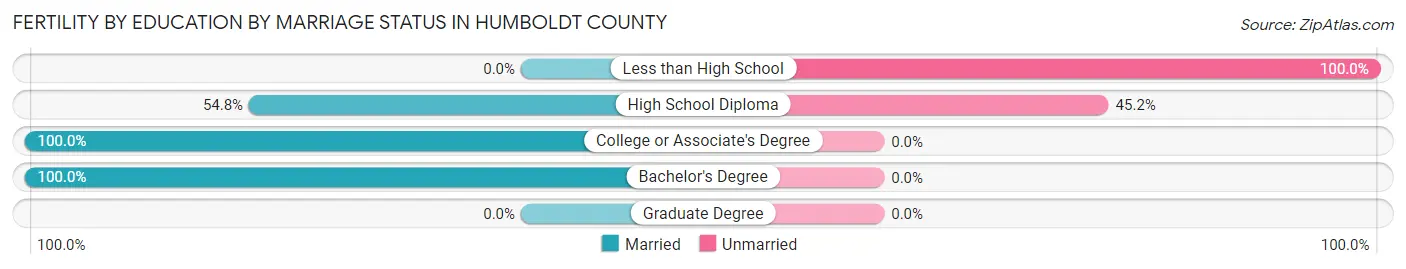
| Educational Attainment | Married | Unmarried |
| Less than High School | 0 (0.0%) | 3 (100.0%) |
| High School Diploma | 80 (54.8%) | 66 (45.2%) |
| College or Associate's Degree | 76 (100.0%) | 0 (0.0%) |
| Bachelor's Degree | 28 (100.0%) | 0 (0.0%) |
| Graduate Degree | 0 (0.0%) | 0 (0.0%) |
| Total | 184 (72.7%) | 69 (27.3%) |
Employment Characteristics in Humboldt County
Employment by Class of Employer in Humboldt County
Among the 8,176 employed individuals in Humboldt County, private company employees (5,145 | 62.9%), local government employees (860 | 10.5%), and self-employed (not incorporated) (605 | 7.4%) make up the most common classes of employment.
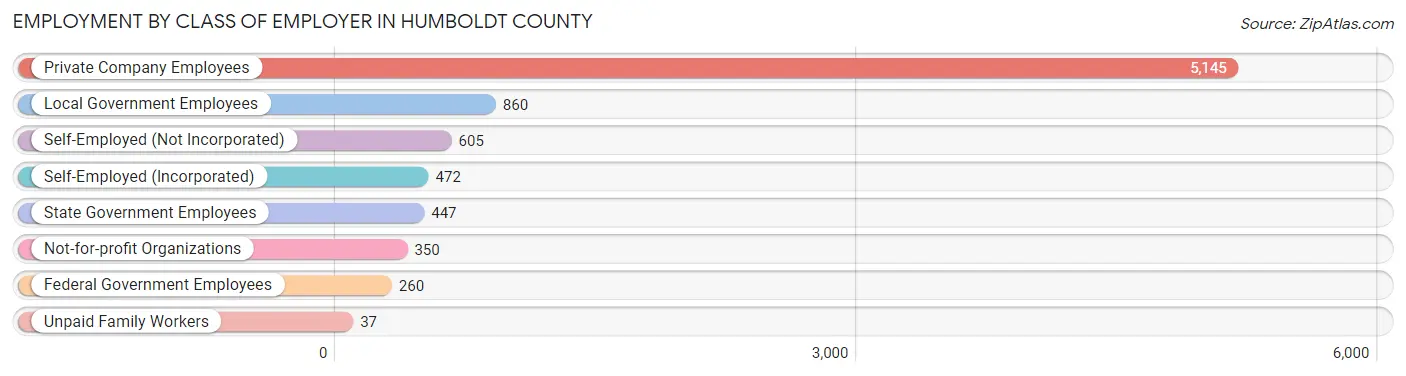
| Employer Class | # Employees | % Employees |
| Private Company Employees | 5,145 | 62.9% |
| Self-Employed (Incorporated) | 472 | 5.8% |
| Self-Employed (Not Incorporated) | 605 | 7.4% |
| Not-for-profit Organizations | 350 | 4.3% |
| Local Government Employees | 860 | 10.5% |
| State Government Employees | 447 | 5.5% |
| Federal Government Employees | 260 | 3.2% |
| Unpaid Family Workers | 37 | 0.4% |
| Total | 8,176 | 100.0% |
Employment Status by Age in Humboldt County
According to the labor force statistics for Humboldt County, out of the total population over 16 years of age (13,268), 65.6% or 8,704 individuals are in the labor force, with 4.3% or 374 of them unemployed. The age group with the highest labor force participation rate is 20 to 24 years, with 89.8% or 938 individuals in the labor force. Within the labor force, the 20 to 24 years age range has the highest percentage of unemployed individuals, with 13.0% or 122 of them being unemployed.
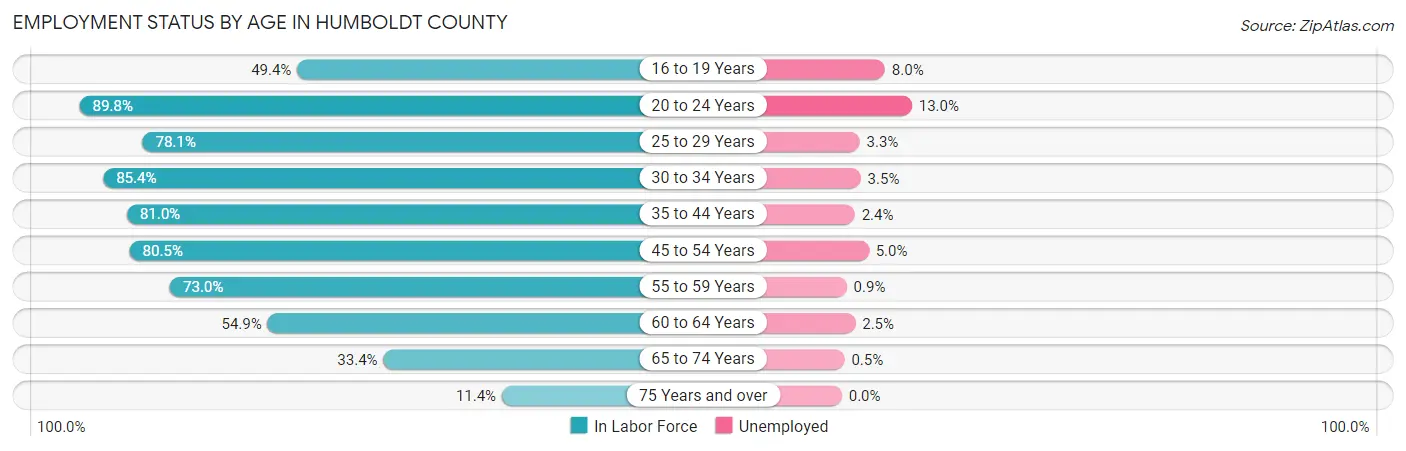
| Age Bracket | In Labor Force | Unemployed |
| 16 to 19 Years | 437 (49.4%) | 35 (8.0%) |
| 20 to 24 Years | 938 (89.8%) | 122 (13.0%) |
| 25 to 29 Years | 856 (78.1%) | 28 (3.3%) |
| 30 to 34 Years | 1,021 (85.4%) | 36 (3.5%) |
| 35 to 44 Years | 1,656 (81.0%) | 40 (2.4%) |
| 45 to 54 Years | 1,827 (80.5%) | 91 (5.0%) |
| 55 to 59 Years | 552 (73.0%) | 5 (0.9%) |
| 60 to 64 Years | 727 (54.9%) | 18 (2.5%) |
| 65 to 74 Years | 588 (33.4%) | 3 (0.5%) |
| 75 Years and over | 102 (11.4%) | 0 (0.0%) |
| Total | 8,704 (65.6%) | 374 (4.3%) |
Employment Status by Educational Attainment in Humboldt County
According to labor force statistics for Humboldt County, 76.4% of individuals (6,638) out of the total population between 25 and 64 years of age (8,688) are in the labor force, with 3.3% or 219 of them being unemployed. The group with the highest labor force participation rate are those with the educational attainment of bachelor's degree or higher, with 84.4% or 1,502 individuals in the labor force. Within the labor force, individuals with less than high school education have the highest percentage of unemployment, with 10.1% or 90 of them being unemployed.
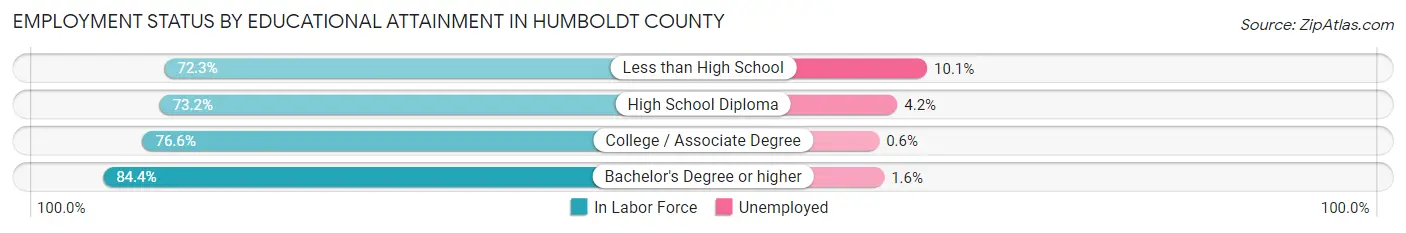
| Educational Attainment | In Labor Force | Unemployed |
| Less than High School | 887 (72.3%) | 124 (10.1%) |
| High School Diploma | 2,177 (73.2%) | 125 (4.2%) |
| College / Associate Degree | 2,074 (76.6%) | 16 (0.6%) |
| Bachelor's Degree or higher | 1,502 (84.4%) | 28 (1.6%) |
| Total | 6,638 (76.4%) | 287 (3.3%) |
Employment Occupations by Sex in Humboldt County
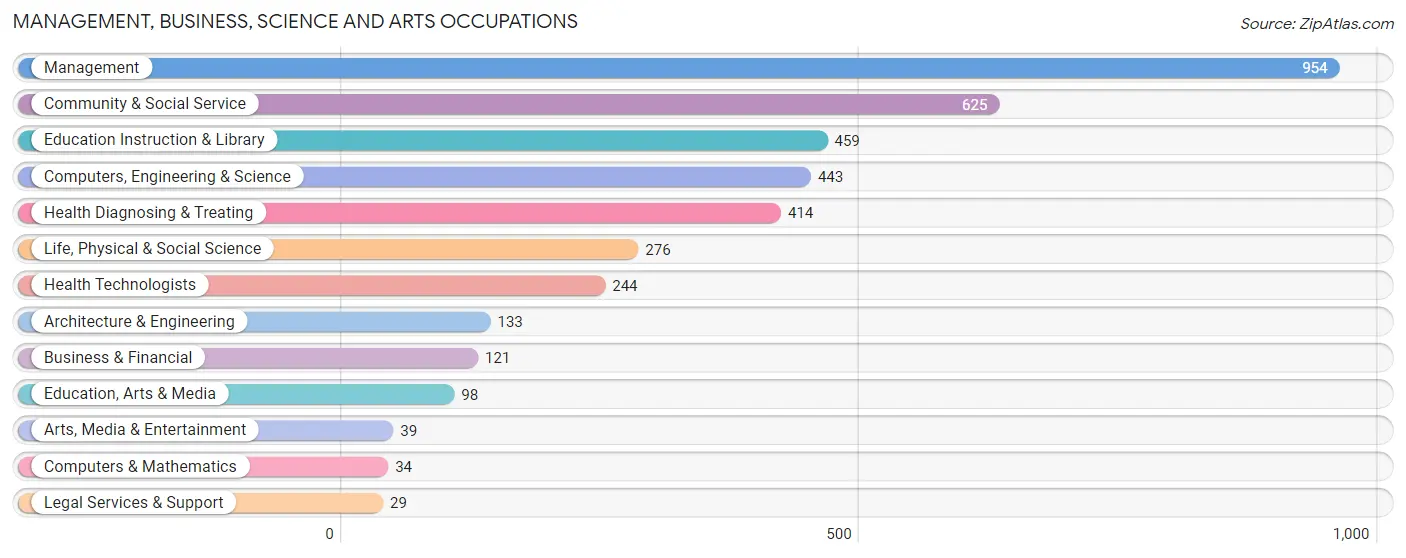
Management, Business, Science and Arts Occupations
The most common Management, Business, Science and Arts occupations in Humboldt County are Management (954 | 11.5%), Community & Social Service (625 | 7.5%), Education Instruction & Library (459 | 5.5%), Computers, Engineering & Science (443 | 5.3%), and Health Diagnosing & Treating (414 | 5.0%).
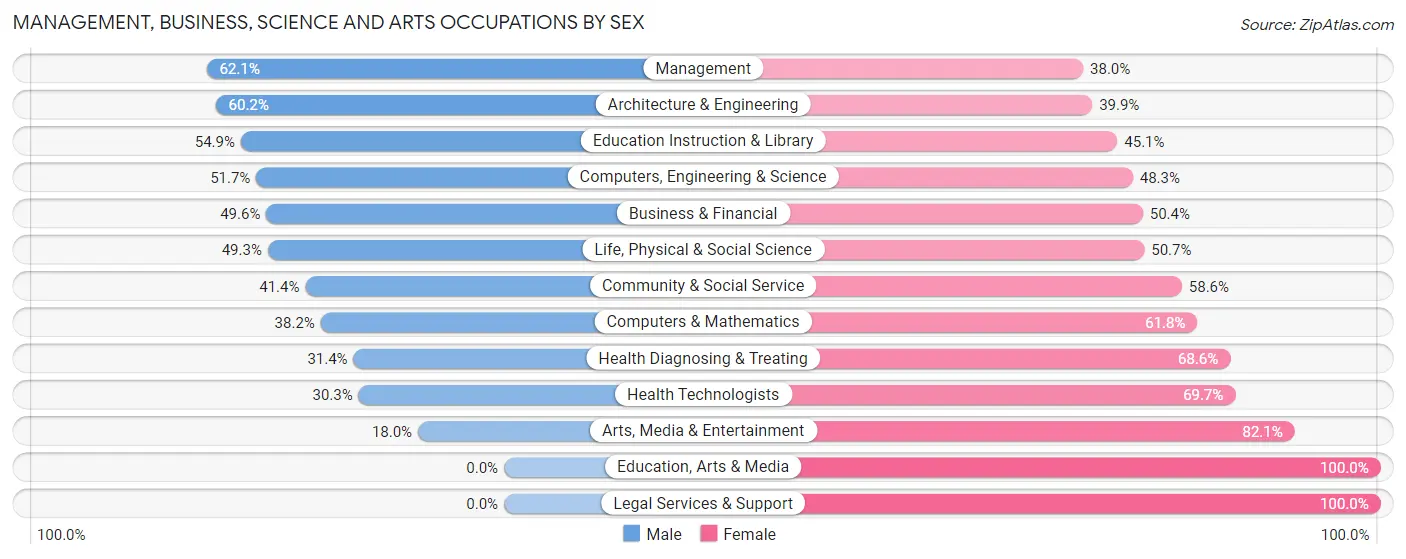
Management, Business, Science and Arts Occupations by Sex
Within the Management, Business, Science and Arts occupations in Humboldt County, the most male-oriented occupations are Management (62.1%), Architecture & Engineering (60.2%), and Education Instruction & Library (54.9%), while the most female-oriented occupations are Education, Arts & Media (100.0%), Legal Services & Support (100.0%), and Arts, Media & Entertainment (82.1%).
| Occupation | Male | Female |
| Management | 592 (62.1%) | 362 (38.0%) |
| Business & Financial | 60 (49.6%) | 61 (50.4%) |
| Computers, Engineering & Science | 229 (51.7%) | 214 (48.3%) |
| Computers & Mathematics | 13 (38.2%) | 21 (61.8%) |
| Architecture & Engineering | 80 (60.2%) | 53 (39.9%) |
| Life, Physical & Social Science | 136 (49.3%) | 140 (50.7%) |
| Community & Social Service | 259 (41.4%) | 366 (58.6%) |
| Education, Arts & Media | 0 (0.0%) | 98 (100.0%) |
| Legal Services & Support | 0 (0.0%) | 29 (100.0%) |
| Education Instruction & Library | 252 (54.9%) | 207 (45.1%) |
| Arts, Media & Entertainment | 7 (17.9%) | 32 (82.1%) |
| Health Diagnosing & Treating | 130 (31.4%) | 284 (68.6%) |
| Health Technologists | 74 (30.3%) | 170 (69.7%) |
| Total (Category) | 1,270 (49.7%) | 1,287 (50.3%) |
| Total (Overall) | 4,925 (59.2%) | 3,401 (40.8%) |
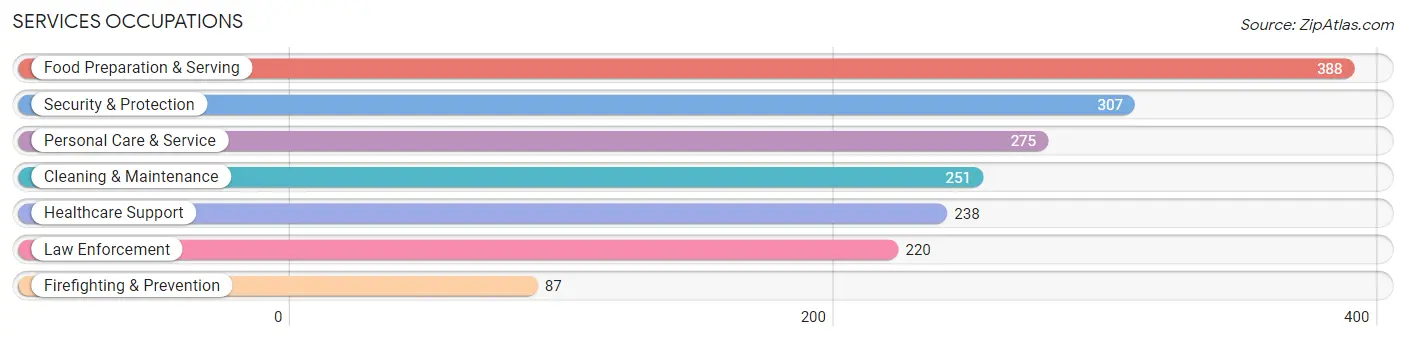
Services Occupations
The most common Services occupations in Humboldt County are Food Preparation & Serving (388 | 4.7%), Security & Protection (307 | 3.7%), Personal Care & Service (275 | 3.3%), Cleaning & Maintenance (251 | 3.0%), and Healthcare Support (238 | 2.9%).
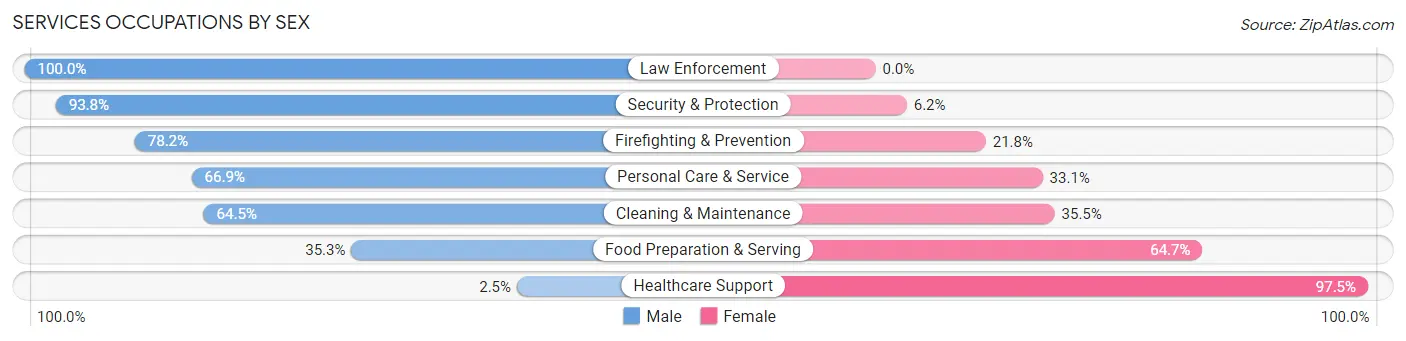
Services Occupations by Sex
Within the Services occupations in Humboldt County, the most male-oriented occupations are Law Enforcement (100.0%), Security & Protection (93.8%), and Firefighting & Prevention (78.2%), while the most female-oriented occupations are Healthcare Support (97.5%), Food Preparation & Serving (64.7%), and Cleaning & Maintenance (35.5%).
| Occupation | Male | Female |
| Healthcare Support | 6 (2.5%) | 232 (97.5%) |
| Security & Protection | 288 (93.8%) | 19 (6.2%) |
| Firefighting & Prevention | 68 (78.2%) | 19 (21.8%) |
| Law Enforcement | 220 (100.0%) | 0 (0.0%) |
| Food Preparation & Serving | 137 (35.3%) | 251 (64.7%) |
| Cleaning & Maintenance | 162 (64.5%) | 89 (35.5%) |
| Personal Care & Service | 184 (66.9%) | 91 (33.1%) |
| Total (Category) | 777 (53.3%) | 682 (46.7%) |
| Total (Overall) | 4,925 (59.2%) | 3,401 (40.8%) |
Sales and Office Occupations
The most common Sales and Office occupations in Humboldt County are Office & Administration (947 | 11.4%), and Sales & Related (525 | 6.3%).
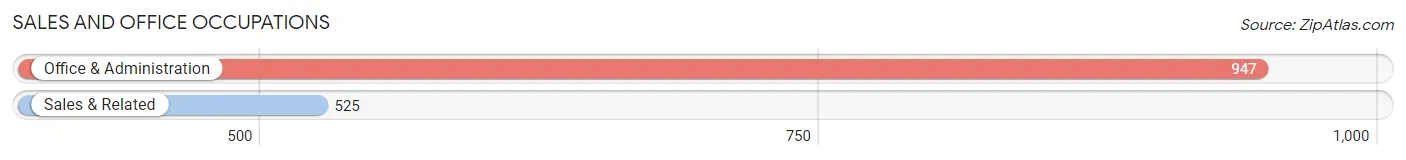
Sales and Office Occupations by Sex
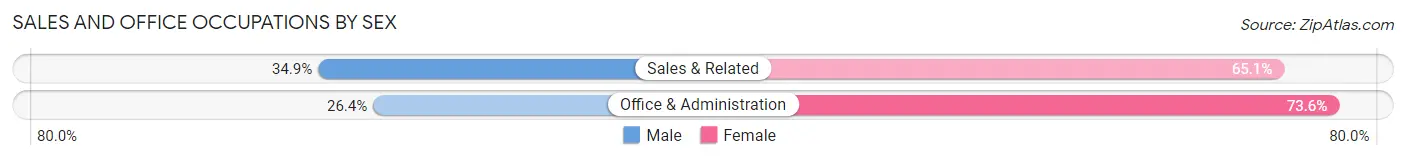
| Occupation | Male | Female |
| Sales & Related | 183 (34.9%) | 342 (65.1%) |
| Office & Administration | 250 (26.4%) | 697 (73.6%) |
| Total (Category) | 433 (29.4%) | 1,039 (70.6%) |
| Total (Overall) | 4,925 (59.2%) | 3,401 (40.8%) |
Natural Resources, Construction and Maintenance Occupations
The most common Natural Resources, Construction and Maintenance occupations in Humboldt County are Construction & Extraction (1,178 | 14.1%), Installation, Maintenance & Repair (413 | 5.0%), and Farming, Fishing & Forestry (179 | 2.1%).
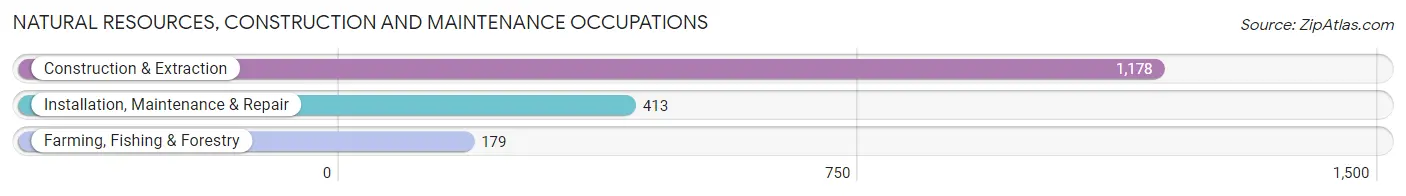
Natural Resources, Construction and Maintenance Occupations by Sex
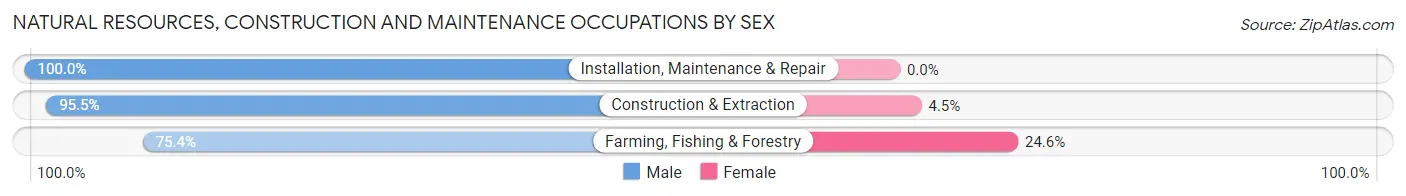
| Occupation | Male | Female |
| Farming, Fishing & Forestry | 135 (75.4%) | 44 (24.6%) |
| Construction & Extraction | 1,125 (95.5%) | 53 (4.5%) |
| Installation, Maintenance & Repair | 413 (100.0%) | 0 (0.0%) |
| Total (Category) | 1,673 (94.5%) | 97 (5.5%) |
| Total (Overall) | 4,925 (59.2%) | 3,401 (40.8%) |
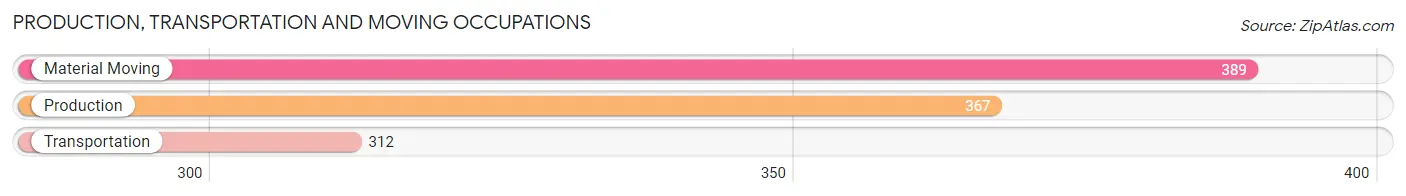
Production, Transportation and Moving Occupations
The most common Production, Transportation and Moving occupations in Humboldt County are Material Moving (389 | 4.7%), Production (367 | 4.4%), and Transportation (312 | 3.7%).
Production, Transportation and Moving Occupations by Sex
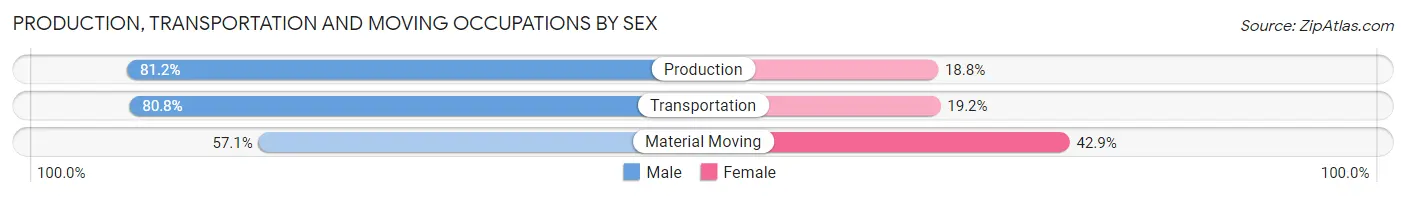
| Occupation | Male | Female |
| Production | 298 (81.2%) | 69 (18.8%) |
| Transportation | 252 (80.8%) | 60 (19.2%) |
| Material Moving | 222 (57.1%) | 167 (42.9%) |
| Total (Category) | 772 (72.3%) | 296 (27.7%) |
| Total (Overall) | 4,925 (59.2%) | 3,401 (40.8%) |
Employment Industries by Sex in Humboldt County
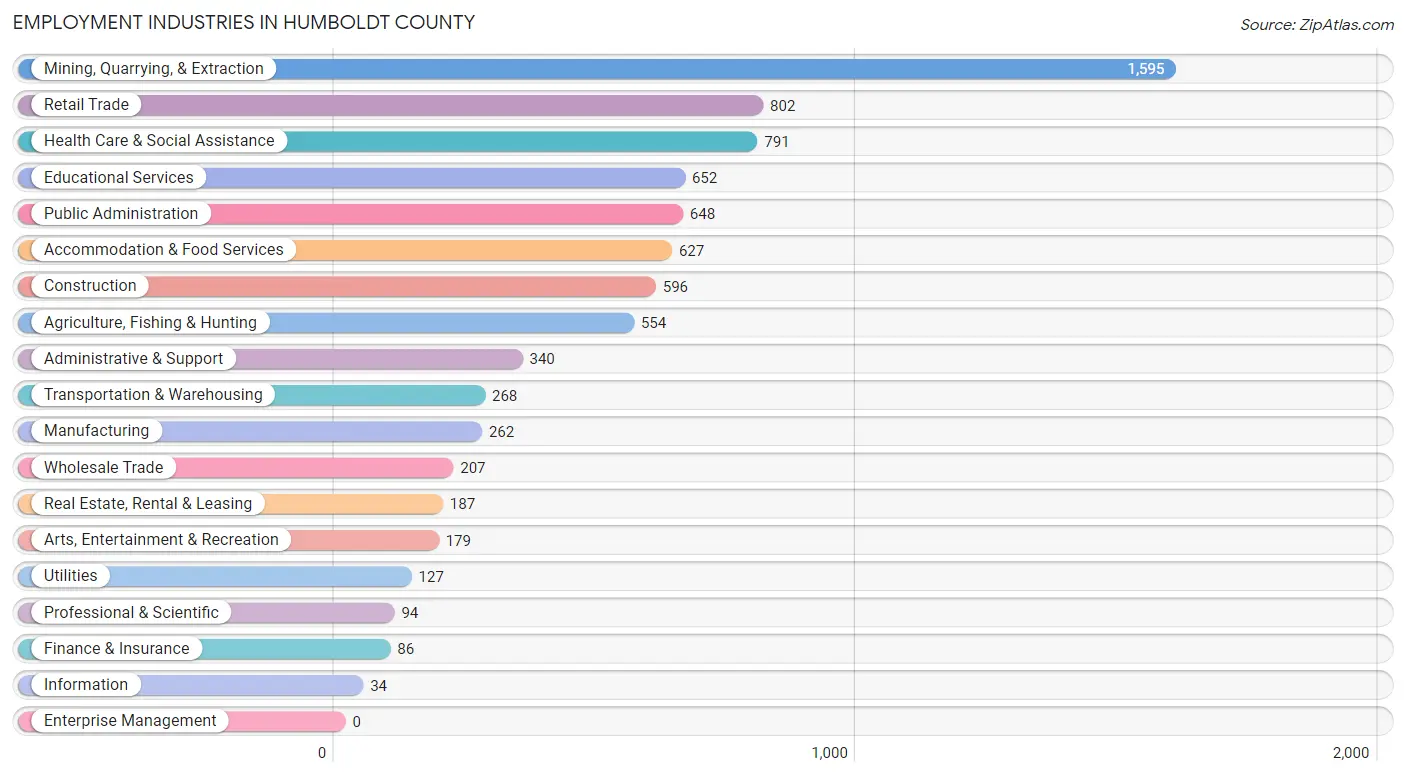
Employment Industries in Humboldt County
The major employment industries in Humboldt County include Mining, Quarrying, & Extraction (1,595 | 19.2%), Retail Trade (802 | 9.6%), Health Care & Social Assistance (791 | 9.5%), Educational Services (652 | 7.8%), and Public Administration (648 | 7.8%).
Employment Industries by Sex in Humboldt County
The Humboldt County industries that see more men than women are Utilities (100.0%), Wholesale Trade (94.7%), and Mining, Quarrying, & Extraction (88.4%), whereas the industries that tend to have a higher number of women are Finance & Insurance (88.4%), Information (82.4%), and Real Estate, Rental & Leasing (82.4%).

| Industry | Male | Female |
| Agriculture, Fishing & Hunting | 368 (66.4%) | 186 (33.6%) |
| Mining, Quarrying, & Extraction | 1,410 (88.4%) | 185 (11.6%) |
| Construction | 488 (81.9%) | 108 (18.1%) |
| Manufacturing | 180 (68.7%) | 82 (31.3%) |
| Wholesale Trade | 196 (94.7%) | 11 (5.3%) |
| Retail Trade | 291 (36.3%) | 511 (63.7%) |
| Transportation & Warehousing | 152 (56.7%) | 116 (43.3%) |
| Utilities | 127 (100.0%) | 0 (0.0%) |
| Information | 6 (17.6%) | 28 (82.4%) |
| Finance & Insurance | 10 (11.6%) | 76 (88.4%) |
| Real Estate, Rental & Leasing | 33 (17.6%) | 154 (82.4%) |
| Professional & Scientific | 26 (27.7%) | 68 (72.3%) |
| Enterprise Management | 0 (0.0%) | 0 (0.0%) |
| Administrative & Support | 211 (62.1%) | 129 (37.9%) |
| Educational Services | 260 (39.9%) | 392 (60.1%) |
| Health Care & Social Assistance | 179 (22.6%) | 612 (77.4%) |
| Arts, Entertainment & Recreation | 127 (71.0%) | 52 (29.0%) |
| Accommodation & Food Services | 295 (47.0%) | 332 (52.9%) |
| Public Administration | 468 (72.2%) | 180 (27.8%) |
| Total | 4,925 (59.2%) | 3,401 (40.8%) |
Education in Humboldt County
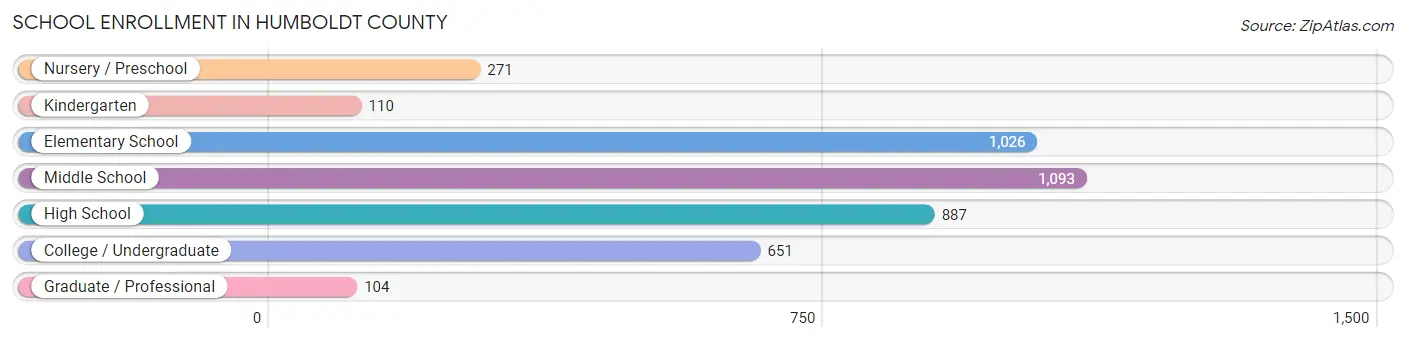
School Enrollment in Humboldt County
The most common levels of schooling among the 4,142 students in Humboldt County are middle school (1,093 | 26.4%), elementary school (1,026 | 24.8%), and high school (887 | 21.4%).
| School Level | # Students | % Students |
| Nursery / Preschool | 271 | 6.5% |
| Kindergarten | 110 | 2.7% |
| Elementary School | 1,026 | 24.8% |
| Middle School | 1,093 | 26.4% |
| High School | 887 | 21.4% |
| College / Undergraduate | 651 | 15.7% |
| Graduate / Professional | 104 | 2.5% |
| Total | 4,142 | 100.0% |
School Enrollment by Age by Funding Source in Humboldt County
Out of a total of 4,142 students who are enrolled in schools in Humboldt County, 327 (7.9%) attend a private institution, while the remaining 3,815 (92.1%) are enrolled in public schools. The age group of 3 to 4 year olds has the highest likelihood of being enrolled in private schools, with 52 (34.0% in the age bracket) enrolled. Conversely, the age group of 20 to 24 year olds has the lowest likelihood of being enrolled in a private school, with 244 (100.0% in the age bracket) attending a public institution.
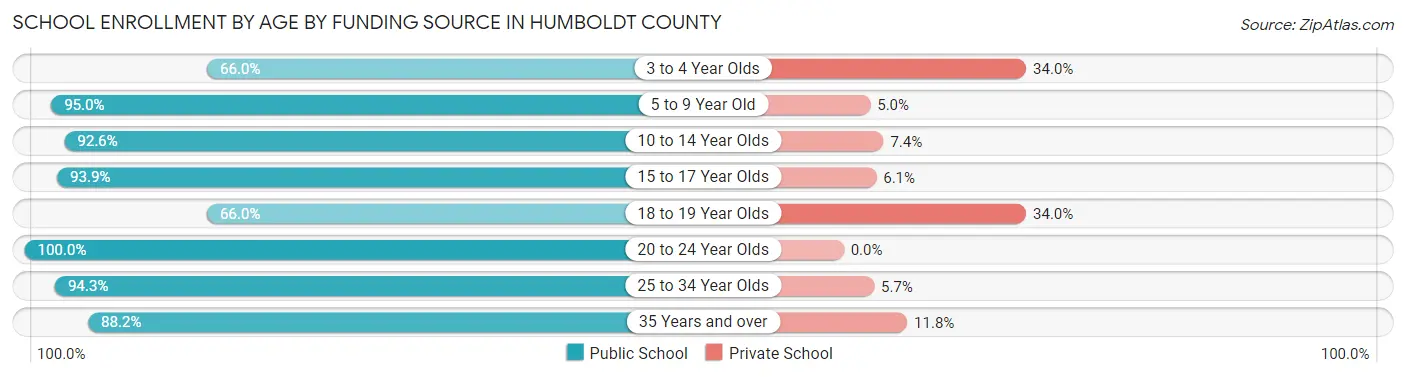
| Age Bracket | Public School | Private School |
| 3 to 4 Year Olds | 101 (66.0%) | 52 (34.0%) |
| 5 to 9 Year Old | 1,149 (95.0%) | 60 (5.0%) |
| 10 to 14 Year Olds | 1,174 (92.6%) | 94 (7.4%) |
| 15 to 17 Year Olds | 650 (93.9%) | 42 (6.1%) |
| 18 to 19 Year Olds | 68 (66.0%) | 35 (34.0%) |
| 20 to 24 Year Olds | 244 (100.0%) | 0 (0.0%) |
| 25 to 34 Year Olds | 183 (94.3%) | 11 (5.7%) |
| 35 Years and over | 246 (88.2%) | 33 (11.8%) |
| Total | 3,815 (92.1%) | 327 (7.9%) |
Educational Attainment by Field of Study in Humboldt County
Education (529 | 22.0%), arts & humanities (337 | 14.0%), bio, nature & agricultural (336 | 14.0%), business (314 | 13.1%), and science & technology (295 | 12.3%) are the most common fields of study among 2,402 individuals in Humboldt County who have obtained a bachelor's degree or higher.
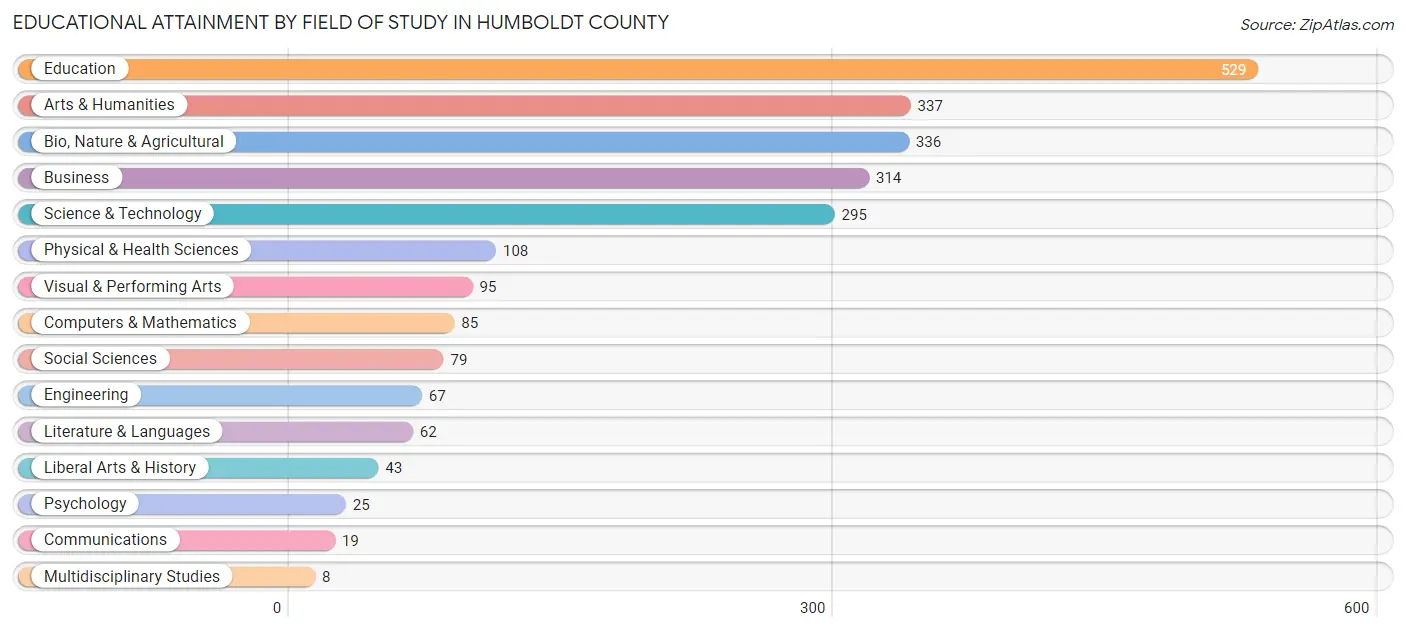
| Field of Study | # Graduates | % Graduates |
| Computers & Mathematics | 85 | 3.5% |
| Bio, Nature & Agricultural | 336 | 14.0% |
| Physical & Health Sciences | 108 | 4.5% |
| Psychology | 25 | 1.0% |
| Social Sciences | 79 | 3.3% |
| Engineering | 67 | 2.8% |
| Multidisciplinary Studies | 8 | 0.3% |
| Science & Technology | 295 | 12.3% |
| Business | 314 | 13.1% |
| Education | 529 | 22.0% |
| Literature & Languages | 62 | 2.6% |
| Liberal Arts & History | 43 | 1.8% |
| Visual & Performing Arts | 95 | 4.0% |
| Communications | 19 | 0.8% |
| Arts & Humanities | 337 | 14.0% |
| Total | 2,402 | 100.0% |
Transportation & Commute in Humboldt County
Vehicle Availability by Sex in Humboldt County
The most prevalent vehicle ownership categories in Humboldt County are males with 2 vehicles (1,735, accounting for 35.6%) and females with 2 vehicles (1,112, making up 52.6%).
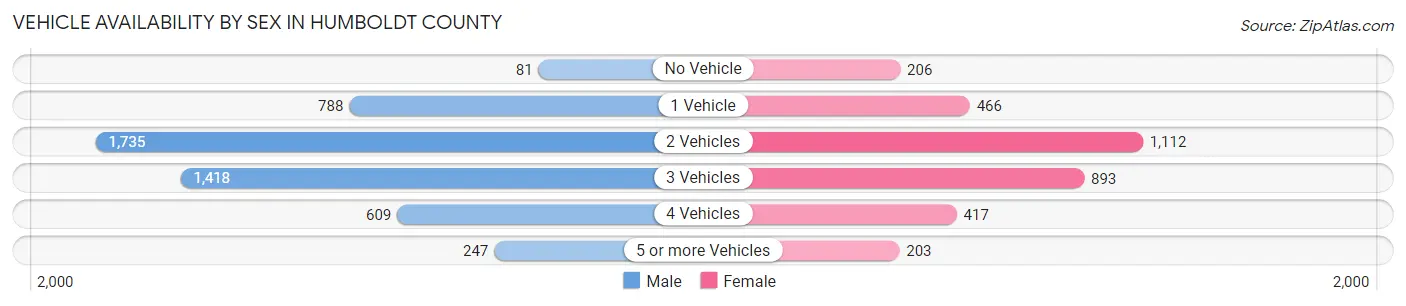
| Vehicles Available | Male | Female |
| No Vehicle | 81 (1.7%) | 206 (6.2%) |
| 1 Vehicle | 788 (16.2%) | 466 (14.1%) |
| 2 Vehicles | 1,735 (35.6%) | 1,112 (33.7%) |
| 3 Vehicles | 1,418 (29.1%) | 893 (27.1%) |
| 4 Vehicles | 609 (12.5%) | 417 (12.7%) |
| 5 or more Vehicles | 247 (5.1%) | 203 (6.2%) |
| Total | 4,878 (100.0%) | 3,297 (100.0%) |
Commute Time in Humboldt County
The most frequently occuring commute durations in Humboldt County are 10 to 14 minutes (1,893 commuters, 25.4%), 5 to 9 minutes (1,287 commuters, 17.2%), and 60 to 89 minutes (948 commuters, 12.7%).
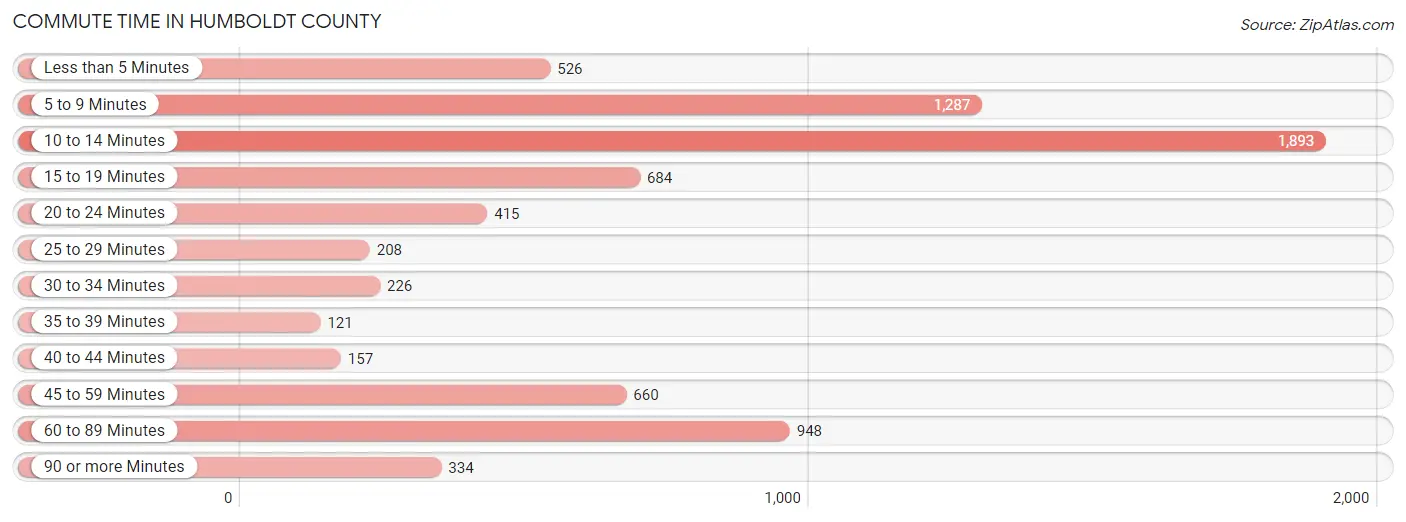
| Commute Time | # Commuters | % Commuters |
| Less than 5 Minutes | 526 | 7.0% |
| 5 to 9 Minutes | 1,287 | 17.2% |
| 10 to 14 Minutes | 1,893 | 25.4% |
| 15 to 19 Minutes | 684 | 9.2% |
| 20 to 24 Minutes | 415 | 5.6% |
| 25 to 29 Minutes | 208 | 2.8% |
| 30 to 34 Minutes | 226 | 3.0% |
| 35 to 39 Minutes | 121 | 1.6% |
| 40 to 44 Minutes | 157 | 2.1% |
| 45 to 59 Minutes | 660 | 8.8% |
| 60 to 89 Minutes | 948 | 12.7% |
| 90 or more Minutes | 334 | 4.5% |
Commute Time by Sex in Humboldt County
The most common commute times in Humboldt County are 10 to 14 minutes (926 commuters, 20.4%) for males and 10 to 14 minutes (967 commuters, 33.0%) for females.
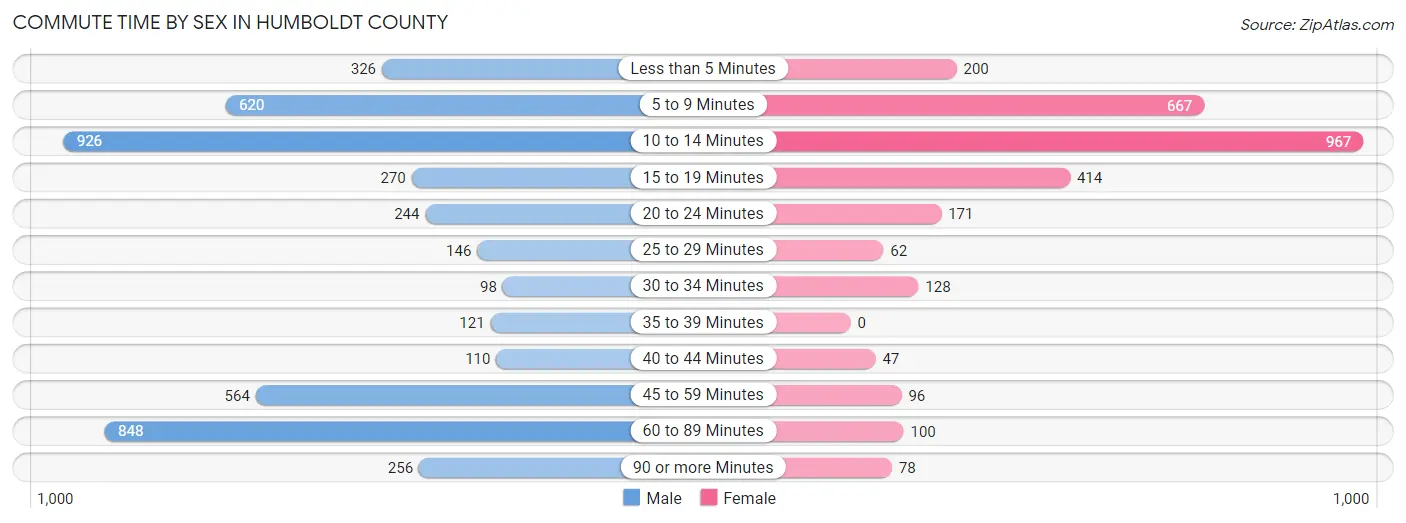
| Commute Time | Male | Female |
| Less than 5 Minutes | 326 (7.2%) | 200 (6.8%) |
| 5 to 9 Minutes | 620 (13.7%) | 667 (22.8%) |
| 10 to 14 Minutes | 926 (20.4%) | 967 (33.0%) |
| 15 to 19 Minutes | 270 (6.0%) | 414 (14.1%) |
| 20 to 24 Minutes | 244 (5.4%) | 171 (5.8%) |
| 25 to 29 Minutes | 146 (3.2%) | 62 (2.1%) |
| 30 to 34 Minutes | 98 (2.2%) | 128 (4.4%) |
| 35 to 39 Minutes | 121 (2.7%) | 0 (0.0%) |
| 40 to 44 Minutes | 110 (2.4%) | 47 (1.6%) |
| 45 to 59 Minutes | 564 (12.4%) | 96 (3.3%) |
| 60 to 89 Minutes | 848 (18.7%) | 100 (3.4%) |
| 90 or more Minutes | 256 (5.7%) | 78 (2.7%) |
Time of Departure to Work by Sex in Humboldt County
The most frequent times of departure to work in Humboldt County are 12:00 AM to 4:59 AM (1,375, 30.4%) for males and 7:30 AM to 7:59 AM (413, 14.1%) for females.
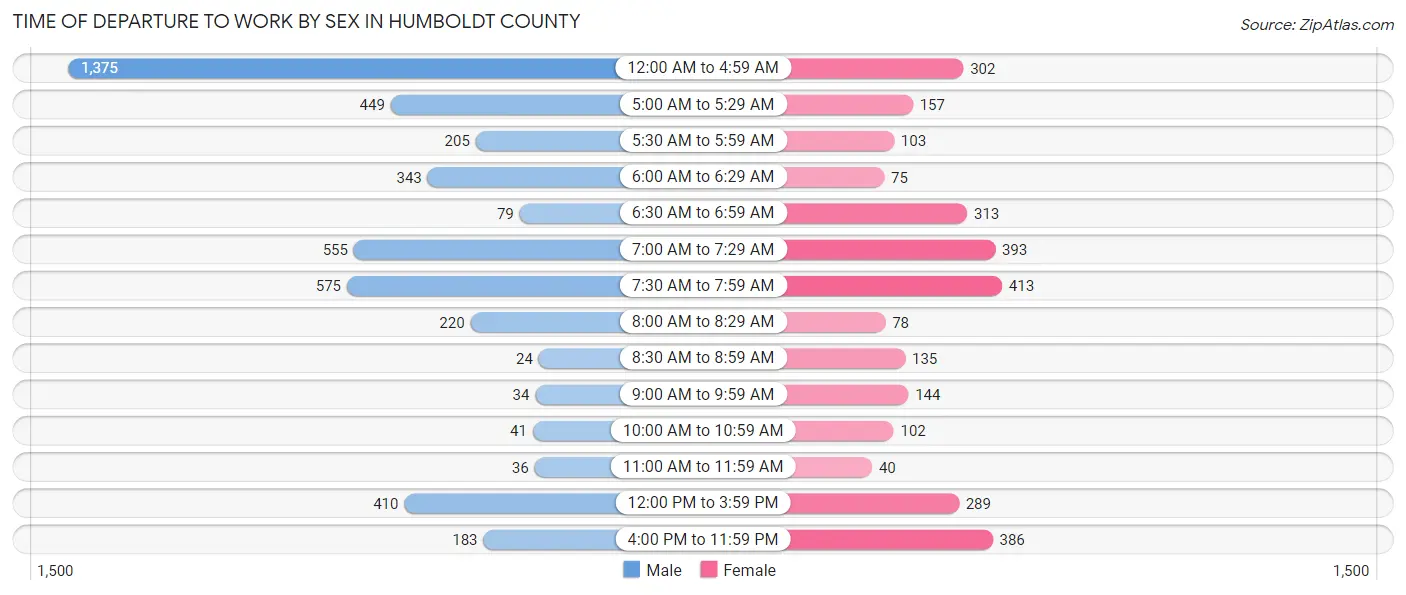
| Time of Departure | Male | Female |
| 12:00 AM to 4:59 AM | 1,375 (30.4%) | 302 (10.3%) |
| 5:00 AM to 5:29 AM | 449 (9.9%) | 157 (5.4%) |
| 5:30 AM to 5:59 AM | 205 (4.5%) | 103 (3.5%) |
| 6:00 AM to 6:29 AM | 343 (7.6%) | 75 (2.6%) |
| 6:30 AM to 6:59 AM | 79 (1.7%) | 313 (10.7%) |
| 7:00 AM to 7:29 AM | 555 (12.2%) | 393 (13.4%) |
| 7:30 AM to 7:59 AM | 575 (12.7%) | 413 (14.1%) |
| 8:00 AM to 8:29 AM | 220 (4.9%) | 78 (2.7%) |
| 8:30 AM to 8:59 AM | 24 (0.5%) | 135 (4.6%) |
| 9:00 AM to 9:59 AM | 34 (0.7%) | 144 (4.9%) |
| 10:00 AM to 10:59 AM | 41 (0.9%) | 102 (3.5%) |
| 11:00 AM to 11:59 AM | 36 (0.8%) | 40 (1.4%) |
| 12:00 PM to 3:59 PM | 410 (9.0%) | 289 (9.9%) |
| 4:00 PM to 11:59 PM | 183 (4.0%) | 386 (13.2%) |
| Total | 4,529 (100.0%) | 2,930 (100.0%) |
Housing Occupancy in Humboldt County
Occupancy by Ownership in Humboldt County
Of the total 6,986 dwellings in Humboldt County, owner-occupied units account for 4,900 (70.1%), while renter-occupied units make up 2,086 (29.9%).
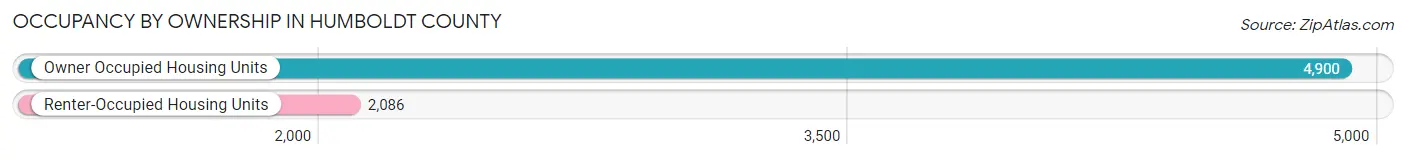
| Occupancy | # Housing Units | % Housing Units |
| Owner Occupied Housing Units | 4,900 | 70.1% |
| Renter-Occupied Housing Units | 2,086 | 29.9% |
| Total Occupied Housing Units | 6,986 | 100.0% |
Occupancy by Household Size in Humboldt County
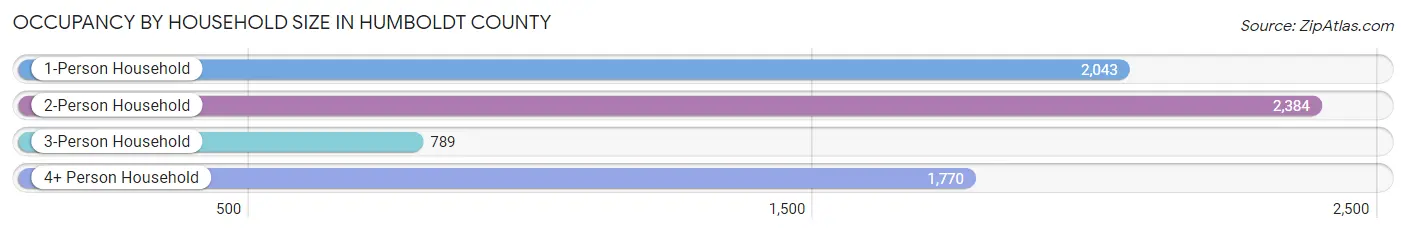
| Household Size | # Housing Units | % Housing Units |
| 1-Person Household | 2,043 | 29.2% |
| 2-Person Household | 2,384 | 34.1% |
| 3-Person Household | 789 | 11.3% |
| 4+ Person Household | 1,770 | 25.3% |
| Total Housing Units | 6,986 | 100.0% |
Occupancy by Ownership by Household Size in Humboldt County
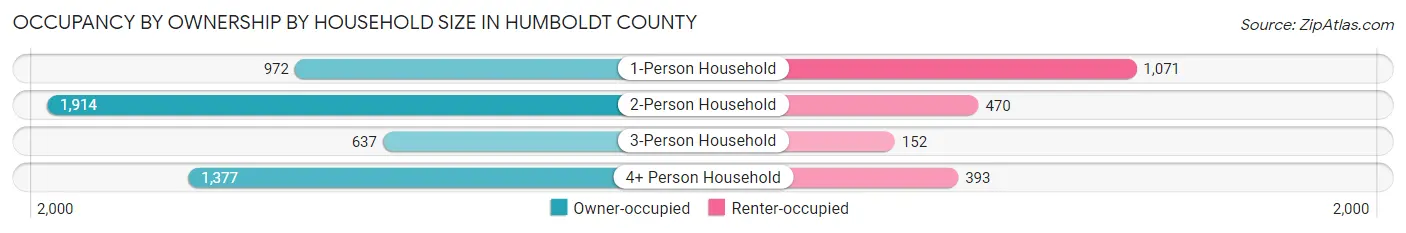
| Household Size | Owner-occupied | Renter-occupied |
| 1-Person Household | 972 (47.6%) | 1,071 (52.4%) |
| 2-Person Household | 1,914 (80.3%) | 470 (19.7%) |
| 3-Person Household | 637 (80.7%) | 152 (19.3%) |
| 4+ Person Household | 1,377 (77.8%) | 393 (22.2%) |
| Total Housing Units | 4,900 (70.1%) | 2,086 (29.9%) |
Occupancy by Educational Attainment in Humboldt County
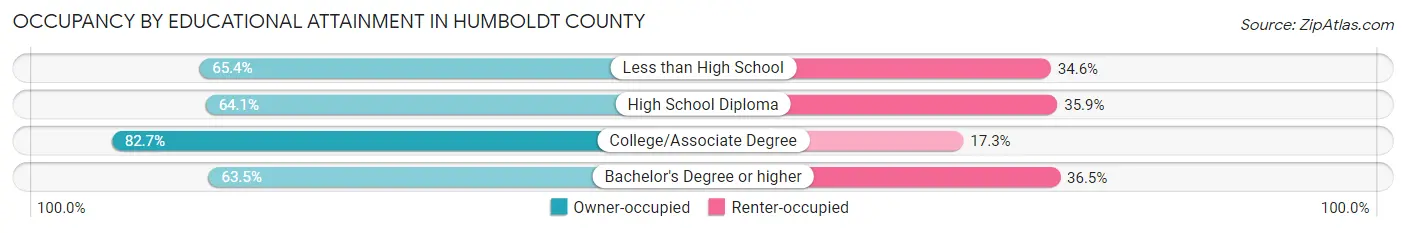
| Household Size | Owner-occupied | Renter-occupied |
| Less than High School | 685 (65.4%) | 363 (34.6%) |
| High School Diploma | 1,294 (64.1%) | 725 (35.9%) |
| College/Associate Degree | 1,860 (82.7%) | 389 (17.3%) |
| Bachelor's Degree or higher | 1,061 (63.5%) | 609 (36.5%) |
Occupancy by Age of Householder in Humboldt County
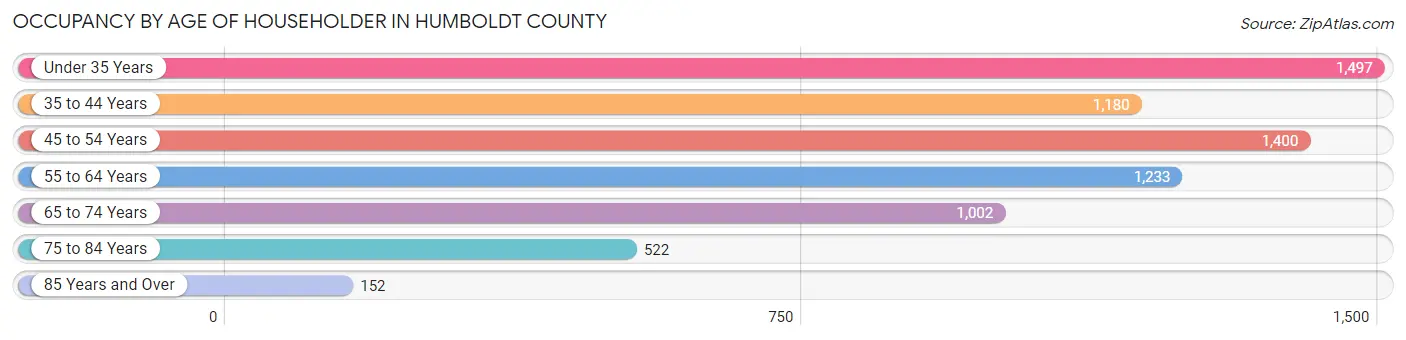
| Age Bracket | # Households | % Households |
| Under 35 Years | 1,497 | 21.4% |
| 35 to 44 Years | 1,180 | 16.9% |
| 45 to 54 Years | 1,400 | 20.0% |
| 55 to 64 Years | 1,233 | 17.6% |
| 65 to 74 Years | 1,002 | 14.3% |
| 75 to 84 Years | 522 | 7.5% |
| 85 Years and Over | 152 | 2.2% |
| Total | 6,986 | 100.0% |
Housing Finances in Humboldt County
Median Income by Occupancy in Humboldt County
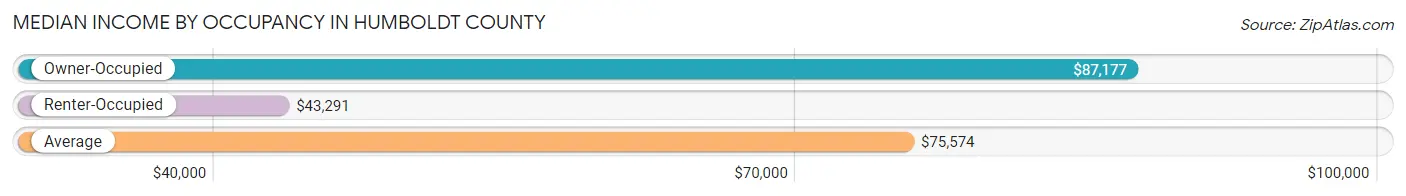
| Occupancy Type | # Households | Median Income |
| Owner-Occupied | 4,900 (70.1%) | $87,177 |
| Renter-Occupied | 2,086 (29.9%) | $43,291 |
| Average | 6,986 (100.0%) | $75,574 |
Occupancy by Householder Income Bracket in Humboldt County
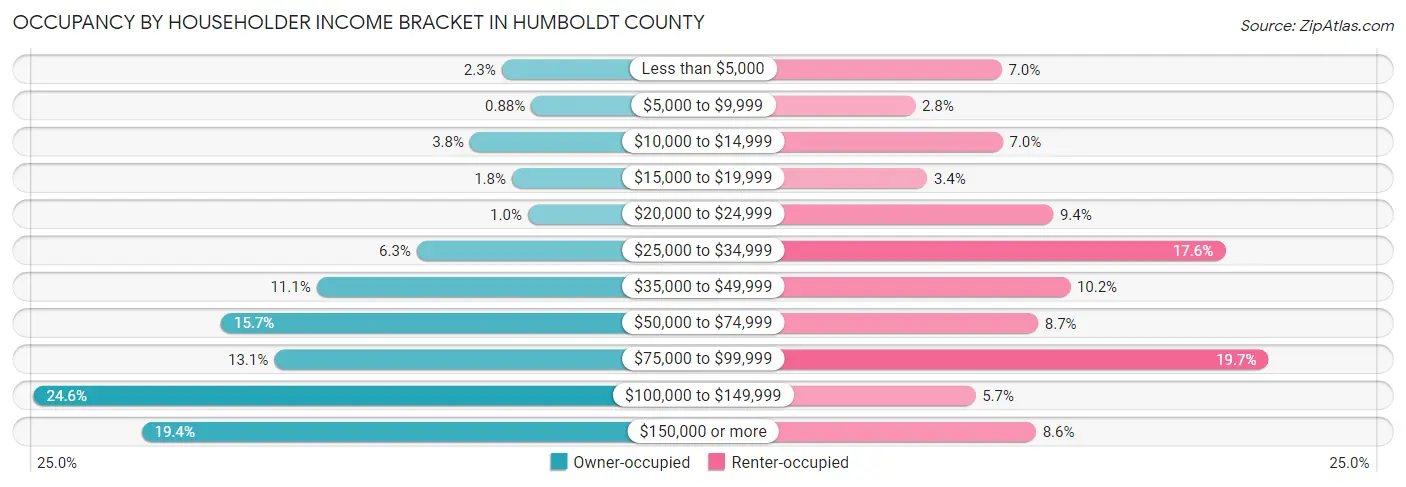
| Income Bracket | Owner-occupied | Renter-occupied |
| Less than $5,000 | 112 (2.3%) | 145 (7.0%) |
| $5,000 to $9,999 | 43 (0.9%) | 59 (2.8%) |
| $10,000 to $14,999 | 186 (3.8%) | 146 (7.0%) |
| $15,000 to $19,999 | 88 (1.8%) | 71 (3.4%) |
| $20,000 to $24,999 | 51 (1.0%) | 196 (9.4%) |
| $25,000 to $34,999 | 310 (6.3%) | 367 (17.6%) |
| $35,000 to $49,999 | 544 (11.1%) | 213 (10.2%) |
| $50,000 to $74,999 | 767 (15.7%) | 181 (8.7%) |
| $75,000 to $99,999 | 643 (13.1%) | 410 (19.7%) |
| $100,000 to $149,999 | 1,204 (24.6%) | 119 (5.7%) |
| $150,000 or more | 952 (19.4%) | 179 (8.6%) |
| Total | 4,900 (100.0%) | 2,086 (100.0%) |
Monthly Housing Cost Tiers in Humboldt County
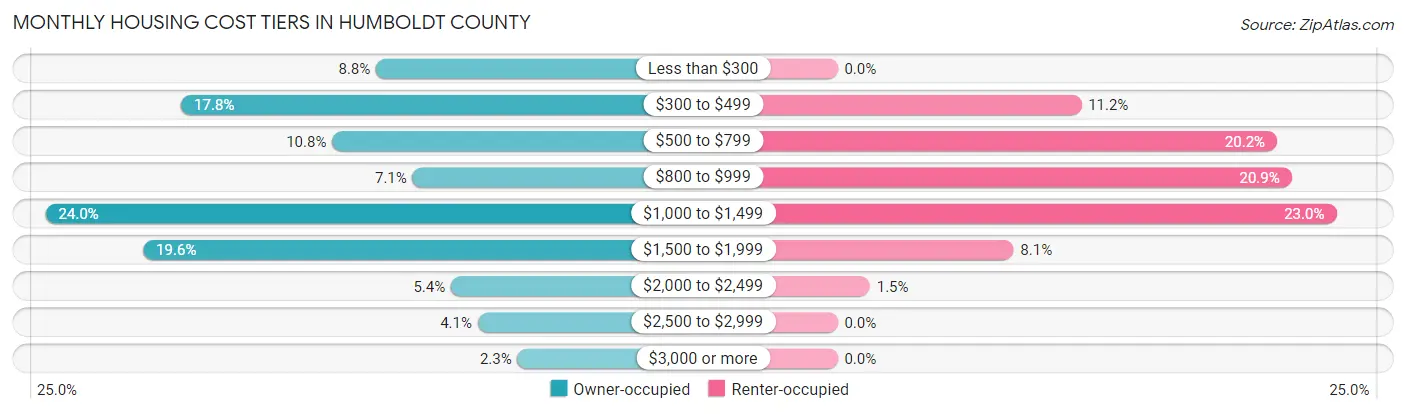
| Monthly Cost | Owner-occupied | Renter-occupied |
| Less than $300 | 432 (8.8%) | 0 (0.0%) |
| $300 to $499 | 872 (17.8%) | 234 (11.2%) |
| $500 to $799 | 531 (10.8%) | 422 (20.2%) |
| $800 to $999 | 350 (7.1%) | 436 (20.9%) |
| $1,000 to $1,499 | 1,178 (24.0%) | 479 (23.0%) |
| $1,500 to $1,999 | 958 (19.6%) | 169 (8.1%) |
| $2,000 to $2,499 | 263 (5.4%) | 31 (1.5%) |
| $2,500 to $2,999 | 203 (4.1%) | 0 (0.0%) |
| $3,000 or more | 113 (2.3%) | 0 (0.0%) |
| Total | 4,900 (100.0%) | 2,086 (100.0%) |
Physical Housing Characteristics in Humboldt County
Housing Structures in Humboldt County
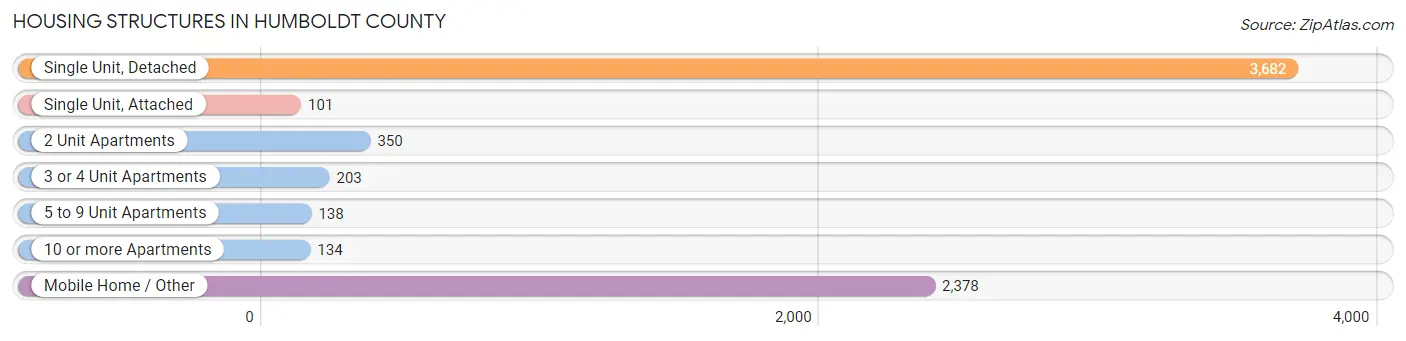
| Structure Type | # Housing Units | % Housing Units |
| Single Unit, Detached | 3,682 | 52.7% |
| Single Unit, Attached | 101 | 1.5% |
| 2 Unit Apartments | 350 | 5.0% |
| 3 or 4 Unit Apartments | 203 | 2.9% |
| 5 to 9 Unit Apartments | 138 | 2.0% |
| 10 or more Apartments | 134 | 1.9% |
| Mobile Home / Other | 2,378 | 34.0% |
| Total | 6,986 | 100.0% |
Housing Structures by Occupancy in Humboldt County
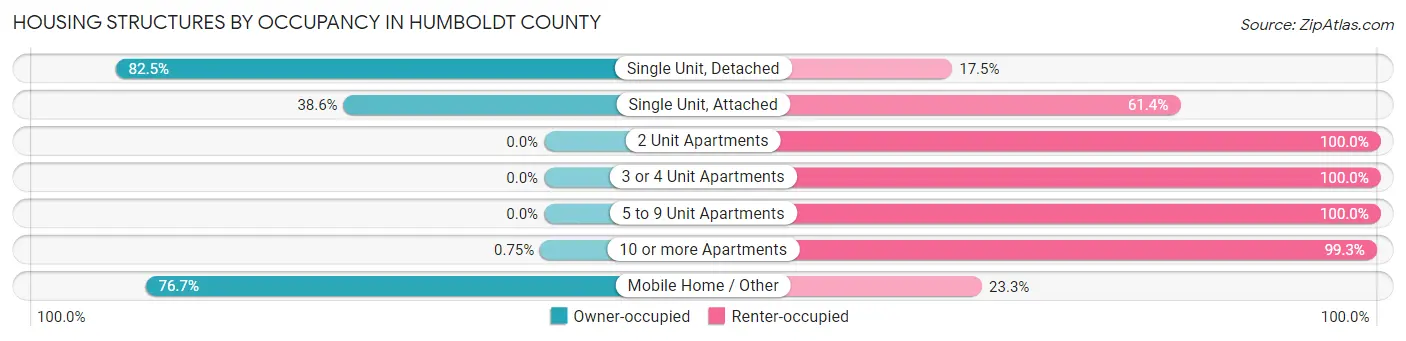
| Structure Type | Owner-occupied | Renter-occupied |
| Single Unit, Detached | 3,036 (82.5%) | 646 (17.5%) |
| Single Unit, Attached | 39 (38.6%) | 62 (61.4%) |
| 2 Unit Apartments | 0 (0.0%) | 350 (100.0%) |
| 3 or 4 Unit Apartments | 0 (0.0%) | 203 (100.0%) |
| 5 to 9 Unit Apartments | 0 (0.0%) | 138 (100.0%) |
| 10 or more Apartments | 1 (0.7%) | 133 (99.3%) |
| Mobile Home / Other | 1,824 (76.7%) | 554 (23.3%) |
| Total | 4,900 (70.1%) | 2,086 (29.9%) |
Housing Structures by Number of Rooms in Humboldt County
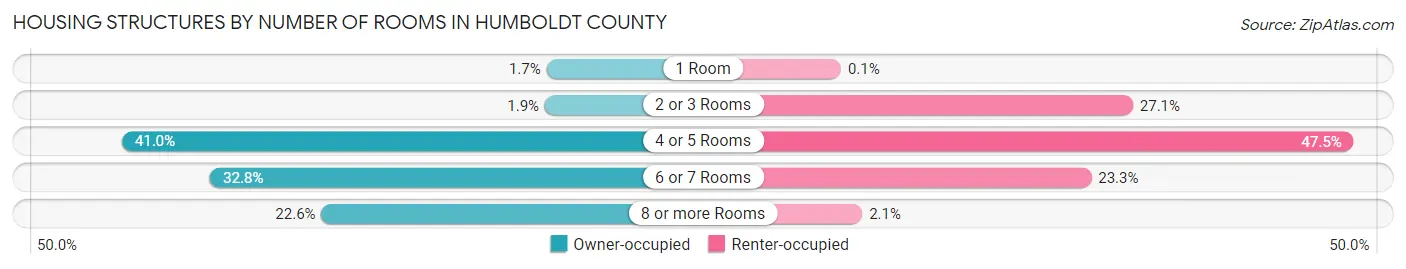
| Number of Rooms | Owner-occupied | Renter-occupied |
| 1 Room | 85 (1.7%) | 2 (0.1%) |
| 2 or 3 Rooms | 92 (1.9%) | 565 (27.1%) |
| 4 or 5 Rooms | 2,009 (41.0%) | 991 (47.5%) |
| 6 or 7 Rooms | 1,609 (32.8%) | 485 (23.3%) |
| 8 or more Rooms | 1,105 (22.6%) | 43 (2.1%) |
| Total | 4,900 (100.0%) | 2,086 (100.0%) |
Housing Structure by Heating Type in Humboldt County
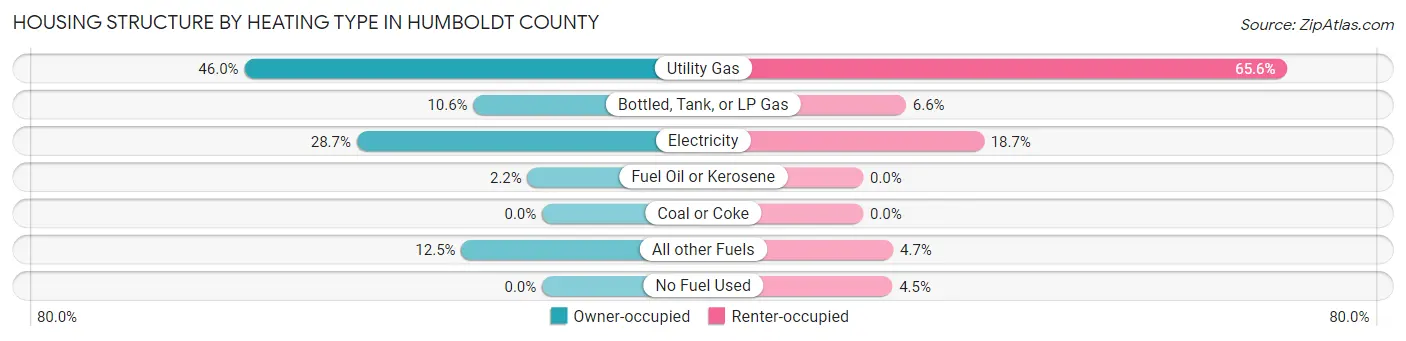
| Heating Type | Owner-occupied | Renter-occupied |
| Utility Gas | 2,255 (46.0%) | 1,368 (65.6%) |
| Bottled, Tank, or LP Gas | 520 (10.6%) | 138 (6.6%) |
| Electricity | 1,404 (28.6%) | 389 (18.6%) |
| Fuel Oil or Kerosene | 110 (2.2%) | 0 (0.0%) |
| Coal or Coke | 0 (0.0%) | 0 (0.0%) |
| All other Fuels | 611 (12.5%) | 97 (4.6%) |
| No Fuel Used | 0 (0.0%) | 94 (4.5%) |
| Total | 4,900 (100.0%) | 2,086 (100.0%) |
Household Vehicle Usage in Humboldt County
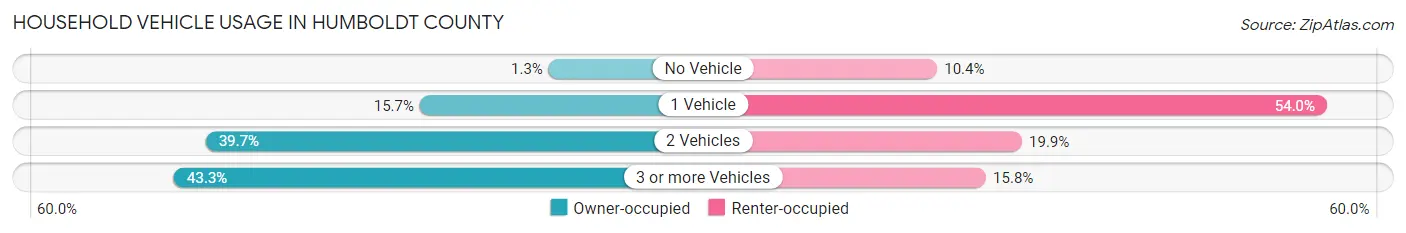
| Vehicles per Household | Owner-occupied | Renter-occupied |
| No Vehicle | 63 (1.3%) | 216 (10.3%) |
| 1 Vehicle | 771 (15.7%) | 1,126 (54.0%) |
| 2 Vehicles | 1,946 (39.7%) | 414 (19.9%) |
| 3 or more Vehicles | 2,120 (43.3%) | 330 (15.8%) |
| Total | 4,900 (100.0%) | 2,086 (100.0%) |
Real Estate & Mortgages in Humboldt County
Real Estate and Mortgage Overview in Humboldt County
| Characteristic | Without Mortgage | With Mortgage |
| Housing Units | 1,983 | 2,917 |
| Median Property Value | $197,900 | $260,400 |
| Median Household Income | $50,588 | $805 |
| Monthly Housing Costs | $427 | $104 |
| Real Estate Taxes | $1,249 | $167 |
Property Value by Mortgage Status in Humboldt County
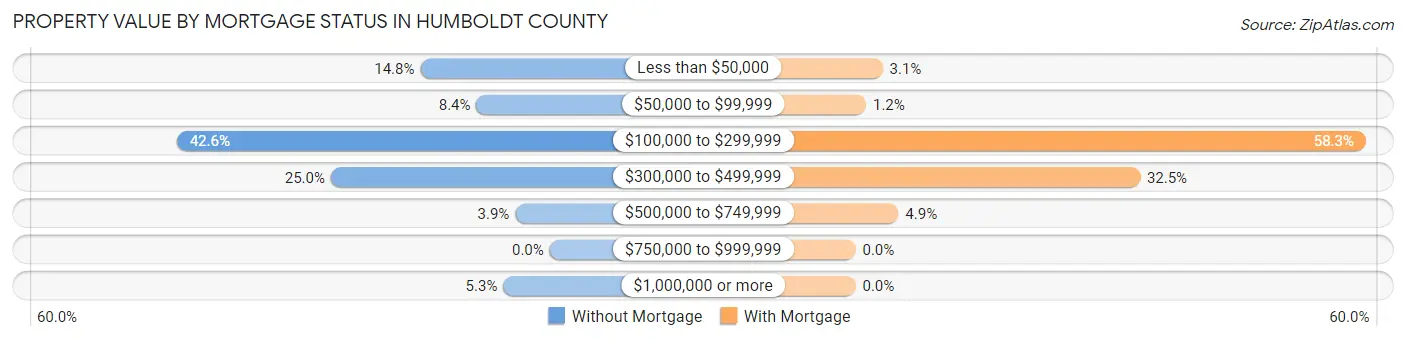
| Property Value | Without Mortgage | With Mortgage |
| Less than $50,000 | 293 (14.8%) | 90 (3.1%) |
| $50,000 to $99,999 | 166 (8.4%) | 35 (1.2%) |
| $100,000 to $299,999 | 845 (42.6%) | 1,701 (58.3%) |
| $300,000 to $499,999 | 496 (25.0%) | 948 (32.5%) |
| $500,000 to $749,999 | 78 (3.9%) | 143 (4.9%) |
| $750,000 to $999,999 | 0 (0.0%) | 0 (0.0%) |
| $1,000,000 or more | 105 (5.3%) | 0 (0.0%) |
| Total | 1,983 (100.0%) | 2,917 (100.0%) |
Household Income by Mortgage Status in Humboldt County
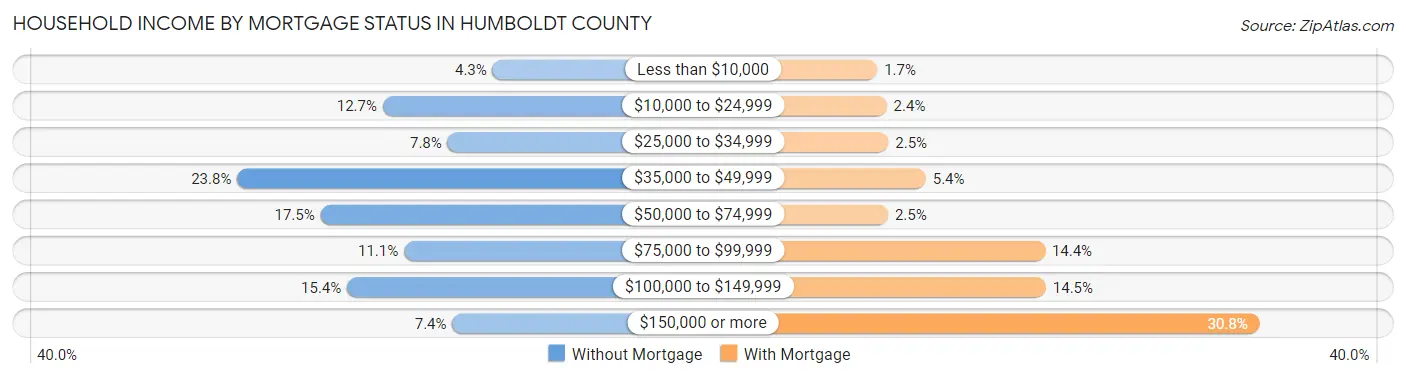
| Household Income | Without Mortgage | With Mortgage |
| Less than $10,000 | 86 (4.3%) | 48 (1.7%) |
| $10,000 to $24,999 | 252 (12.7%) | 69 (2.4%) |
| $25,000 to $34,999 | 154 (7.8%) | 73 (2.5%) |
| $35,000 to $49,999 | 472 (23.8%) | 156 (5.3%) |
| $50,000 to $74,999 | 346 (17.4%) | 72 (2.5%) |
| $75,000 to $99,999 | 220 (11.1%) | 421 (14.4%) |
| $100,000 to $149,999 | 306 (15.4%) | 423 (14.5%) |
| $150,000 or more | 147 (7.4%) | 898 (30.8%) |
| Total | 1,983 (100.0%) | 2,917 (100.0%) |
Property Value to Household Income Ratio in Humboldt County
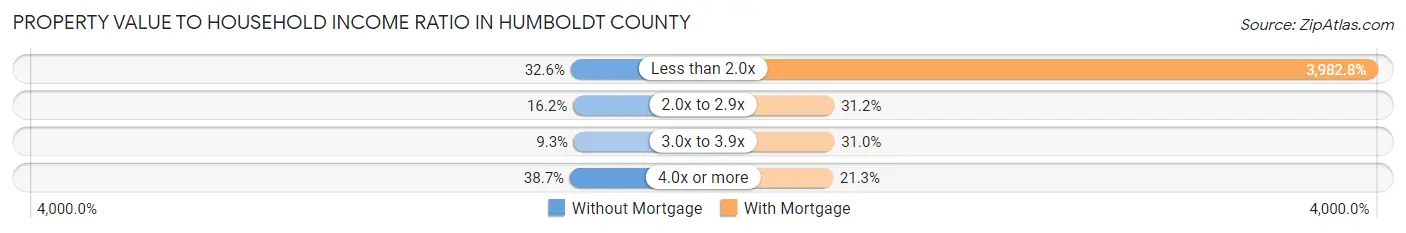
| Value-to-Income Ratio | Without Mortgage | With Mortgage |
| Less than 2.0x | 647 (32.6%) | 116,177 (3,982.8%) |
| 2.0x to 2.9x | 322 (16.2%) | 911 (31.2%) |
| 3.0x to 3.9x | 185 (9.3%) | 904 (31.0%) |
| 4.0x or more | 767 (38.7%) | 622 (21.3%) |
| Total | 1,983 (100.0%) | 2,917 (100.0%) |
Real Estate Taxes by Mortgage Status in Humboldt County
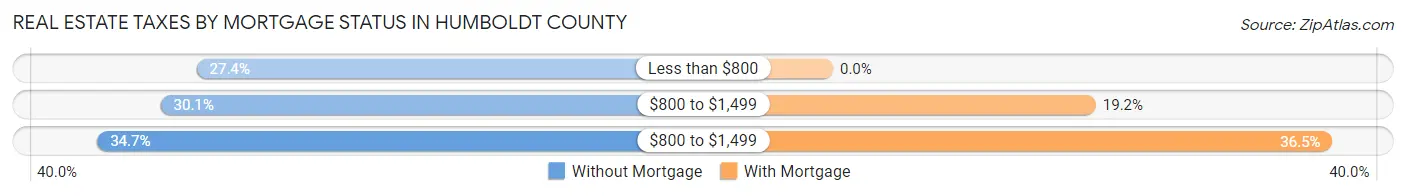
| Property Taxes | Without Mortgage | With Mortgage |
| Less than $800 | 544 (27.4%) | 0 (0.0%) |
| $800 to $1,499 | 596 (30.1%) | 560 (19.2%) |
| $800 to $1,499 | 688 (34.7%) | 1,064 (36.5%) |
| Total | 1,983 (100.0%) | 2,917 (100.0%) |
Health & Disability in Humboldt County
Health Insurance Coverage by Age in Humboldt County
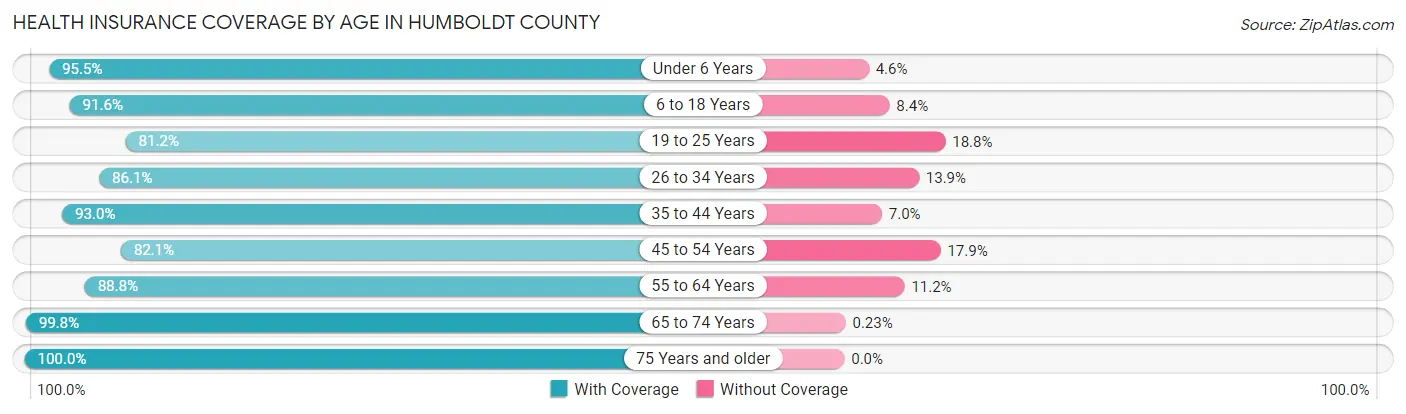
| Age Bracket | With Coverage | Without Coverage |
| Under 6 Years | 1,385 (95.5%) | 66 (4.5%) |
| 6 to 18 Years | 3,037 (91.6%) | 279 (8.4%) |
| 19 to 25 Years | 1,129 (81.2%) | 262 (18.8%) |
| 26 to 34 Years | 1,722 (86.1%) | 278 (13.9%) |
| 35 to 44 Years | 1,872 (93.0%) | 141 (7.0%) |
| 45 to 54 Years | 1,839 (82.1%) | 402 (17.9%) |
| 55 to 64 Years | 1,827 (88.8%) | 231 (11.2%) |
| 65 to 74 Years | 1,731 (99.8%) | 4 (0.2%) |
| 75 Years and older | 878 (100.0%) | 0 (0.0%) |
| Total | 15,420 (90.3%) | 1,663 (9.7%) |
Health Insurance Coverage by Citizenship Status in Humboldt County
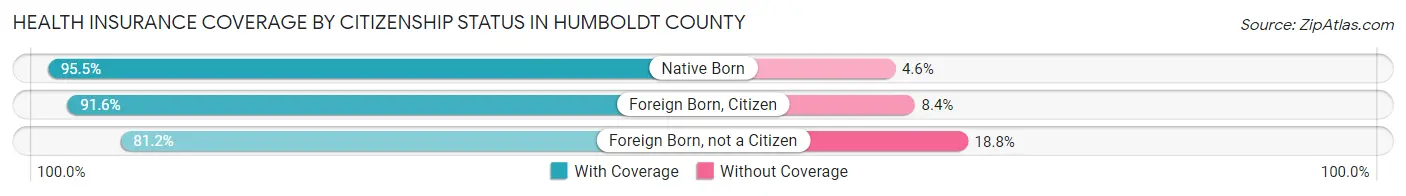
| Citizenship Status | With Coverage | Without Coverage |
| Native Born | 1,385 (95.5%) | 66 (4.5%) |
| Foreign Born, Citizen | 3,037 (91.6%) | 279 (8.4%) |
| Foreign Born, not a Citizen | 1,129 (81.2%) | 262 (18.8%) |
Health Insurance Coverage by Household Income in Humboldt County
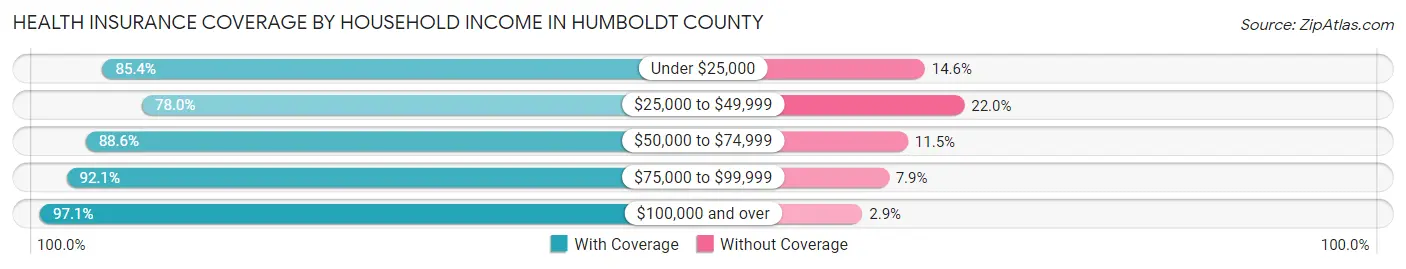
| Household Income | With Coverage | Without Coverage |
| Under $25,000 | 1,542 (85.4%) | 264 (14.6%) |
| $25,000 to $49,999 | 2,679 (78.0%) | 756 (22.0%) |
| $50,000 to $74,999 | 1,895 (88.5%) | 245 (11.5%) |
| $75,000 to $99,999 | 2,156 (92.1%) | 184 (7.9%) |
| $100,000 and over | 7,143 (97.1%) | 214 (2.9%) |
Public vs Private Health Insurance Coverage by Age in Humboldt County
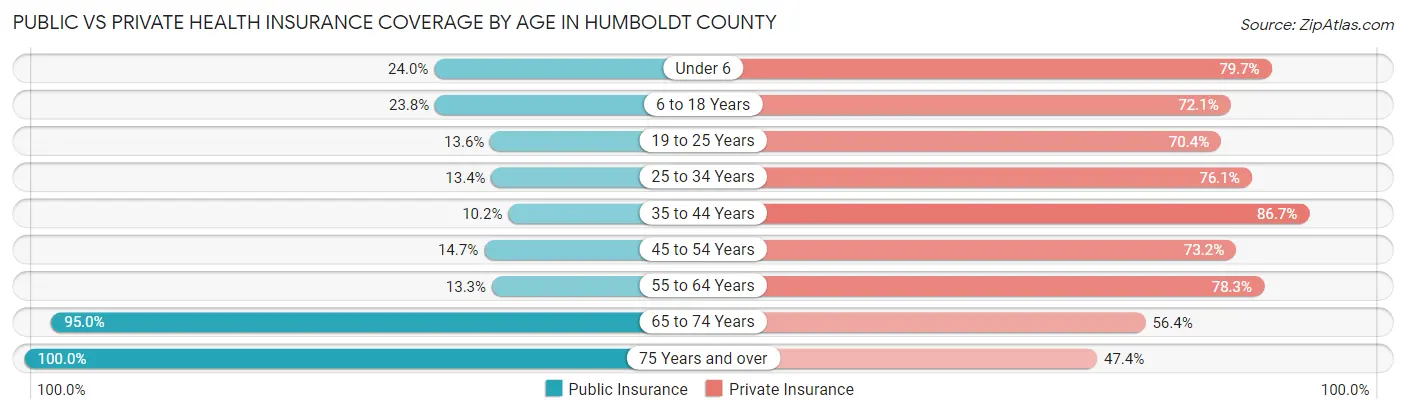
| Age Bracket | Public Insurance | Private Insurance |
| Under 6 | 348 (24.0%) | 1,157 (79.7%) |
| 6 to 18 Years | 790 (23.8%) | 2,392 (72.1%) |
| 19 to 25 Years | 189 (13.6%) | 979 (70.4%) |
| 25 to 34 Years | 267 (13.4%) | 1,521 (76.0%) |
| 35 to 44 Years | 206 (10.2%) | 1,746 (86.7%) |
| 45 to 54 Years | 330 (14.7%) | 1,640 (73.2%) |
| 55 to 64 Years | 273 (13.3%) | 1,612 (78.3%) |
| 65 to 74 Years | 1,649 (95.0%) | 978 (56.4%) |
| 75 Years and over | 878 (100.0%) | 416 (47.4%) |
| Total | 4,930 (28.9%) | 12,441 (72.8%) |
Disability Status by Sex by Age in Humboldt County
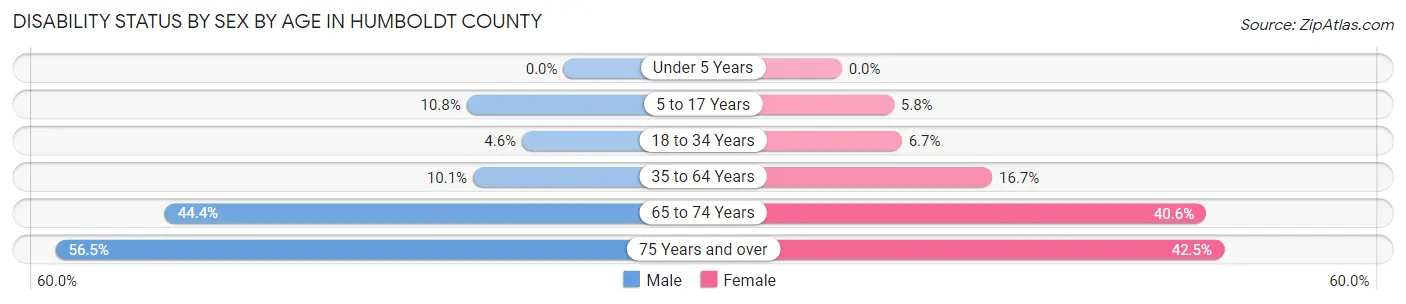
| Age Bracket | Male | Female |
| Under 5 Years | 0 (0.0%) | 0 (0.0%) |
| 5 to 17 Years | 189 (10.8%) | 94 (5.8%) |
| 18 to 34 Years | 88 (4.6%) | 113 (6.7%) |
| 35 to 64 Years | 327 (10.1%) | 513 (16.7%) |
| 65 to 74 Years | 445 (44.4%) | 297 (40.6%) |
| 75 Years and over | 216 (56.5%) | 211 (42.5%) |
Disability Class by Sex by Age in Humboldt County
Disability Class: Hearing Difficulty
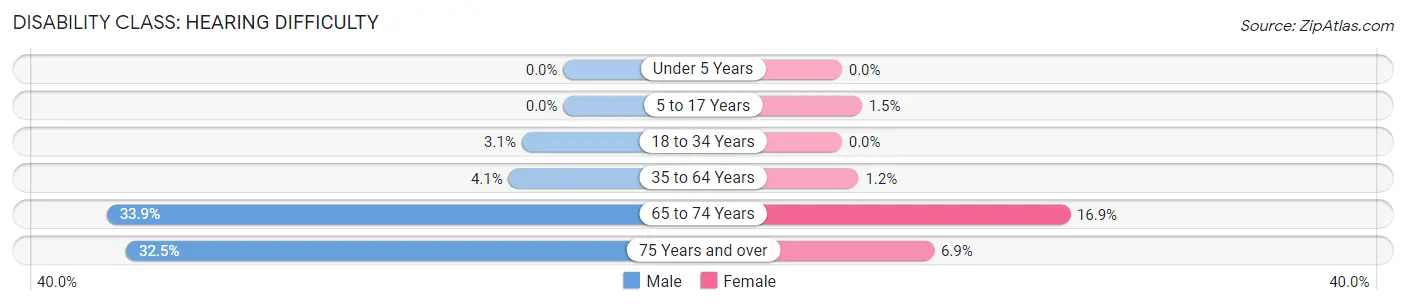
| Age Bracket | Male | Female |
| Under 5 Years | 0 (0.0%) | 0 (0.0%) |
| 5 to 17 Years | 0 (0.0%) | 24 (1.5%) |
| 18 to 34 Years | 59 (3.1%) | 0 (0.0%) |
| 35 to 64 Years | 132 (4.1%) | 38 (1.2%) |
| 65 to 74 Years | 340 (33.9%) | 124 (16.9%) |
| 75 Years and over | 124 (32.5%) | 34 (6.9%) |
Disability Class: Vision Difficulty
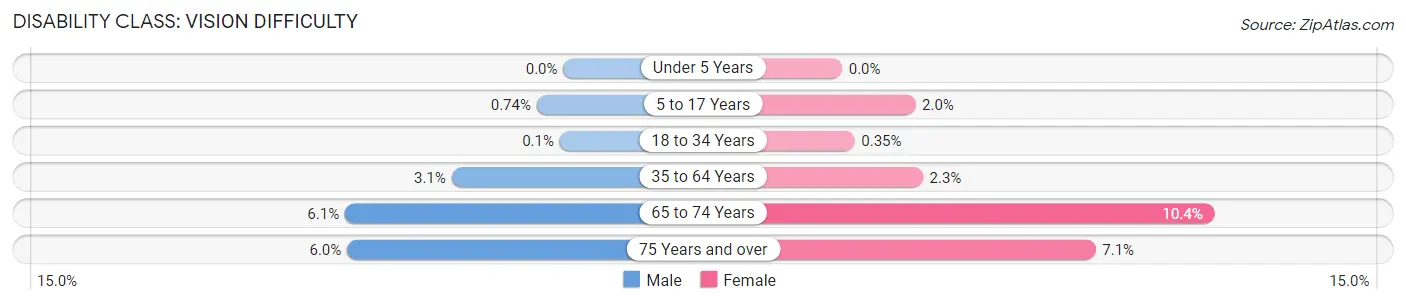
| Age Bracket | Male | Female |
| Under 5 Years | 0 (0.0%) | 0 (0.0%) |
| 5 to 17 Years | 13 (0.7%) | 33 (2.0%) |
| 18 to 34 Years | 2 (0.1%) | 6 (0.4%) |
| 35 to 64 Years | 101 (3.1%) | 69 (2.2%) |
| 65 to 74 Years | 61 (6.1%) | 76 (10.4%) |
| 75 Years and over | 23 (6.0%) | 35 (7.1%) |
Disability Class: Cognitive Difficulty
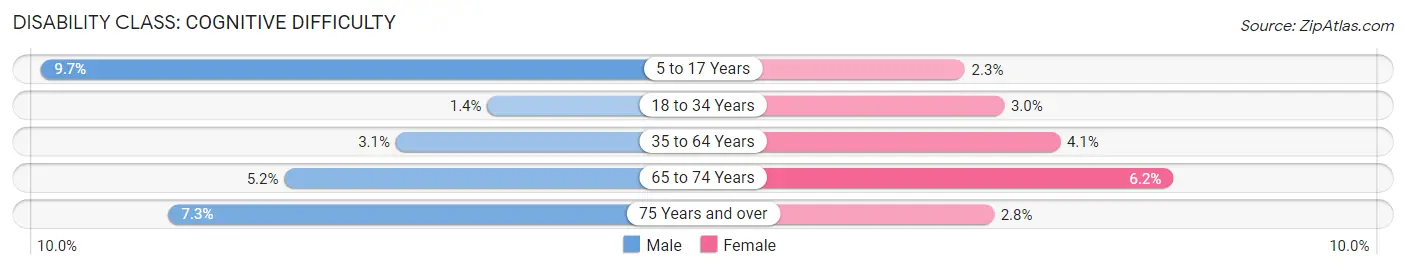
| Age Bracket | Male | Female |
| 5 to 17 Years | 170 (9.7%) | 37 (2.3%) |
| 18 to 34 Years | 27 (1.4%) | 51 (3.0%) |
| 35 to 64 Years | 101 (3.1%) | 124 (4.1%) |
| 65 to 74 Years | 52 (5.2%) | 45 (6.1%) |
| 75 Years and over | 28 (7.3%) | 14 (2.8%) |
Disability Class: Ambulatory Difficulty
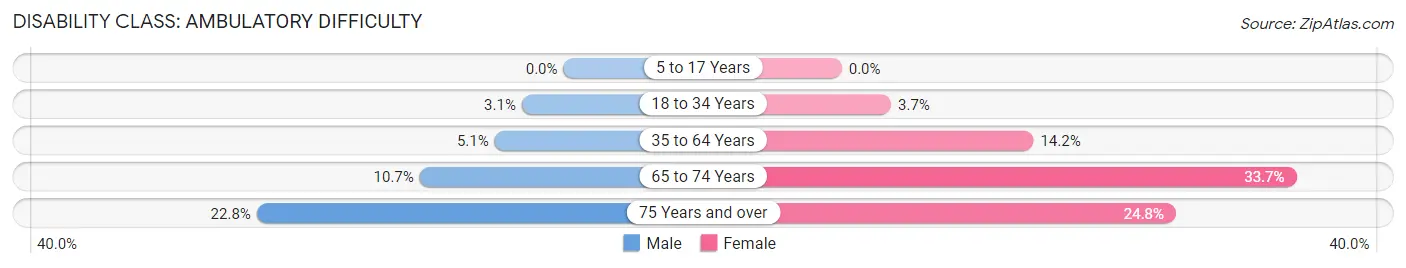
| Age Bracket | Male | Female |
| 5 to 17 Years | 0 (0.0%) | 0 (0.0%) |
| 18 to 34 Years | 59 (3.1%) | 62 (3.7%) |
| 35 to 64 Years | 166 (5.1%) | 436 (14.2%) |
| 65 to 74 Years | 107 (10.7%) | 247 (33.7%) |
| 75 Years and over | 87 (22.8%) | 123 (24.8%) |
Disability Class: Self-Care Difficulty
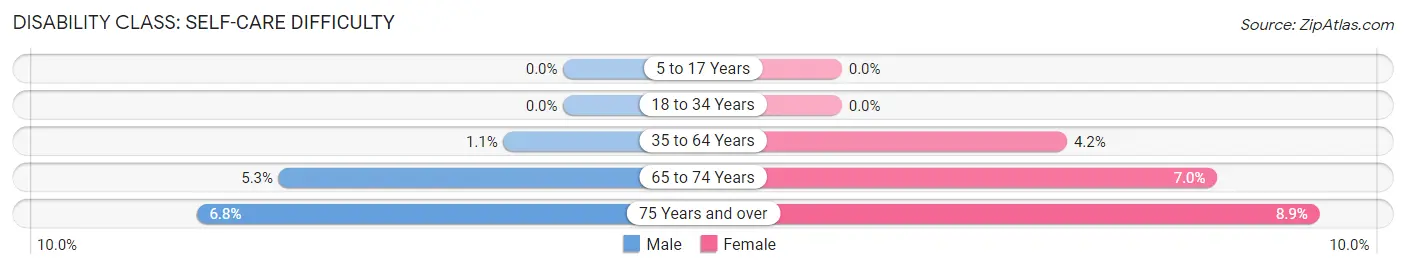
| Age Bracket | Male | Female |
| 5 to 17 Years | 0 (0.0%) | 0 (0.0%) |
| 18 to 34 Years | 0 (0.0%) | 0 (0.0%) |
| 35 to 64 Years | 36 (1.1%) | 128 (4.2%) |
| 65 to 74 Years | 53 (5.3%) | 51 (7.0%) |
| 75 Years and over | 26 (6.8%) | 44 (8.9%) |
Technology Access in Humboldt County
Computing Device Access in Humboldt County
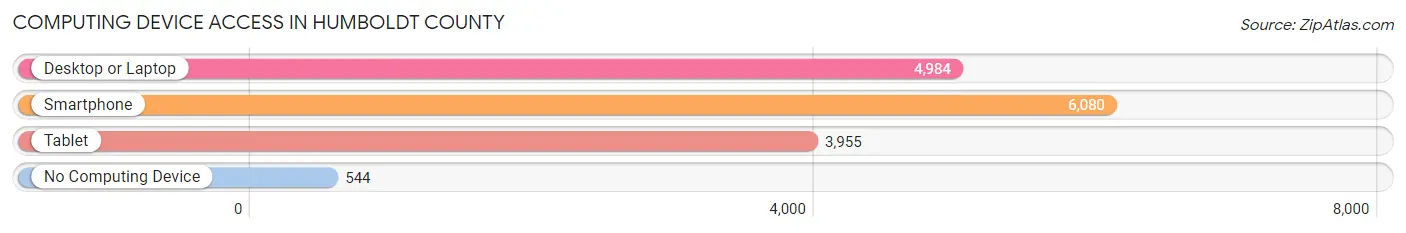
| Device Type | # Households | % Households |
| Desktop or Laptop | 4,984 | 71.3% |
| Smartphone | 6,080 | 87.0% |
| Tablet | 3,955 | 56.6% |
| No Computing Device | 544 | 7.8% |
| Total | 6,986 | 100.0% |
Internet Access in Humboldt County
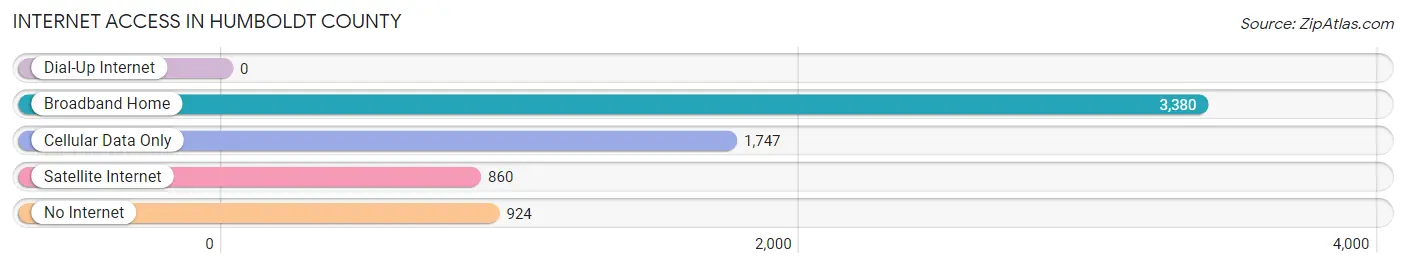
| Internet Type | # Households | % Households |
| Dial-Up Internet | 0 | 0.0% |
| Broadband Home | 3,380 | 48.4% |
| Cellular Data Only | 1,747 | 25.0% |
| Satellite Internet | 860 | 12.3% |
| No Internet | 924 | 13.2% |
| Total | 6,986 | 100.0% |
Humboldt County Summary
Humboldt County is located in the northwestern corner of Nevada, and is the fourth largest county in the state. It is bordered by Oregon to the north, Lander County to the east, Pershing County to the south, and Washoe County to the west. The county seat is Winnemucca, and the largest city is Elko. The county was named after the German naturalist and explorer Alexander von Humboldt.
Geography
Humboldt County covers an area of 10,542 square miles, making it the fourth largest county in Nevada. The county is located in the Great Basin region of the state, and is mostly desert. The county is home to the Humboldt National Forest, which covers an area of 1,845 square miles. The forest is home to a variety of wildlife, including elk, deer, and bighorn sheep. The county also contains the Santa Rosa Range, the Ruby Mountains, and the East Humboldt Range.
The county is divided into two distinct regions: the northern region, which is mostly desert, and the southern region, which is more mountainous. The northern region is home to the Humboldt River, which flows through the county from north to south. The river is a major source of irrigation for the county's agricultural industry.
Climate
Humboldt County has a semi-arid climate, with hot summers and cold winters. The average high temperature in July is 92°F, and the average low temperature in January is 18°F. The county receives an average of 8.5 inches of precipitation per year, with most of it falling in the winter months.
Demographics
As of the 2010 census, Humboldt County had a population of 16,528. The population was spread out, with 48.2% male and 51.8% female. The median age was 38.2 years. The racial makeup of the county was 79.2% White, 0.7% African American, 1.2% Native American, 0.4% Asian, 0.1% Pacific Islander, 16.2% from other races, and 2.2% from two or more races. Hispanic or Latino of any race were 28.2% of the population.
Economy
Humboldt County's economy is largely based on agriculture and mining. The county is home to several large ranches, and is a major producer of beef, hay, and alfalfa. Mining is also an important part of the county's economy, with gold, silver, and copper being the main minerals mined. Tourism is also an important part of the county's economy, with visitors coming to enjoy the area's natural beauty and outdoor recreation opportunities.
Conclusion
Humboldt County is a large and diverse county located in the northwestern corner of Nevada. The county is home to a variety of landscapes, from desert to mountains, and is a major producer of beef, hay, and alfalfa. Mining and tourism are also important parts of the county's economy. The county has a population of 16,528, and is home to a variety of cultures and ethnicities.
Common Questions
What is Per Capita Income in Humboldt County?
Per Capita income in Humboldt County is $35,979.
What is the Median Family Income in Humboldt County?
Median Family Income in Humboldt County is $86,944.
What is the Median Household income in Humboldt County?
Median Household Income in Humboldt County is $75,574.
What is Income or Wage Gap in Humboldt County?
Income or Wage Gap in Humboldt County is 62.4%.
Women in Humboldt County earn 37.6 cents for every dollar earned by a man.
What is Family Income Deficit in Humboldt County?
Family Income Deficit in Humboldt County is $10,196.
Families that are below poverty line in Humboldt County earn $10,196 less on average than the poverty threshold level.
What is Inequality or Gini Index in Humboldt County?
Inequality or Gini Index in Humboldt County is 0.45.
What is the Total Population of Humboldt County?
Total Population of Humboldt County is 17,266.
What is the Total Male Population of Humboldt County?
Total Male Population of Humboldt County is 9,009.
What is the Total Female Population of Humboldt County?
Total Female Population of Humboldt County is 8,257.
What is the Ratio of Males per 100 Females in Humboldt County?
There are 109.11 Males per 100 Females in Humboldt County.
What is the Ratio of Females per 100 Males in Humboldt County?
There are 91.65 Females per 100 Males in Humboldt County.
What is the Median Population Age in Humboldt County?
Median Population Age in Humboldt County is 37.0 Years.
What is the Average Family Size in Humboldt County
Average Family Size in Humboldt County is 3.1 People.
What is the Average Household Size in Humboldt County
Average Household Size in Humboldt County is 2.4 People.
How Large is the Labor Force in Humboldt County?
There are 8,704 People in the Labor Forcein in Humboldt County.
What is the Percentage of People in the Labor Force in Humboldt County?
65.6% of People are in the Labor Force in Humboldt County.
What is the Unemployment Rate in Humboldt County?
Unemployment Rate in Humboldt County is 4.3%.