Eureka County, NV Map & Demographics
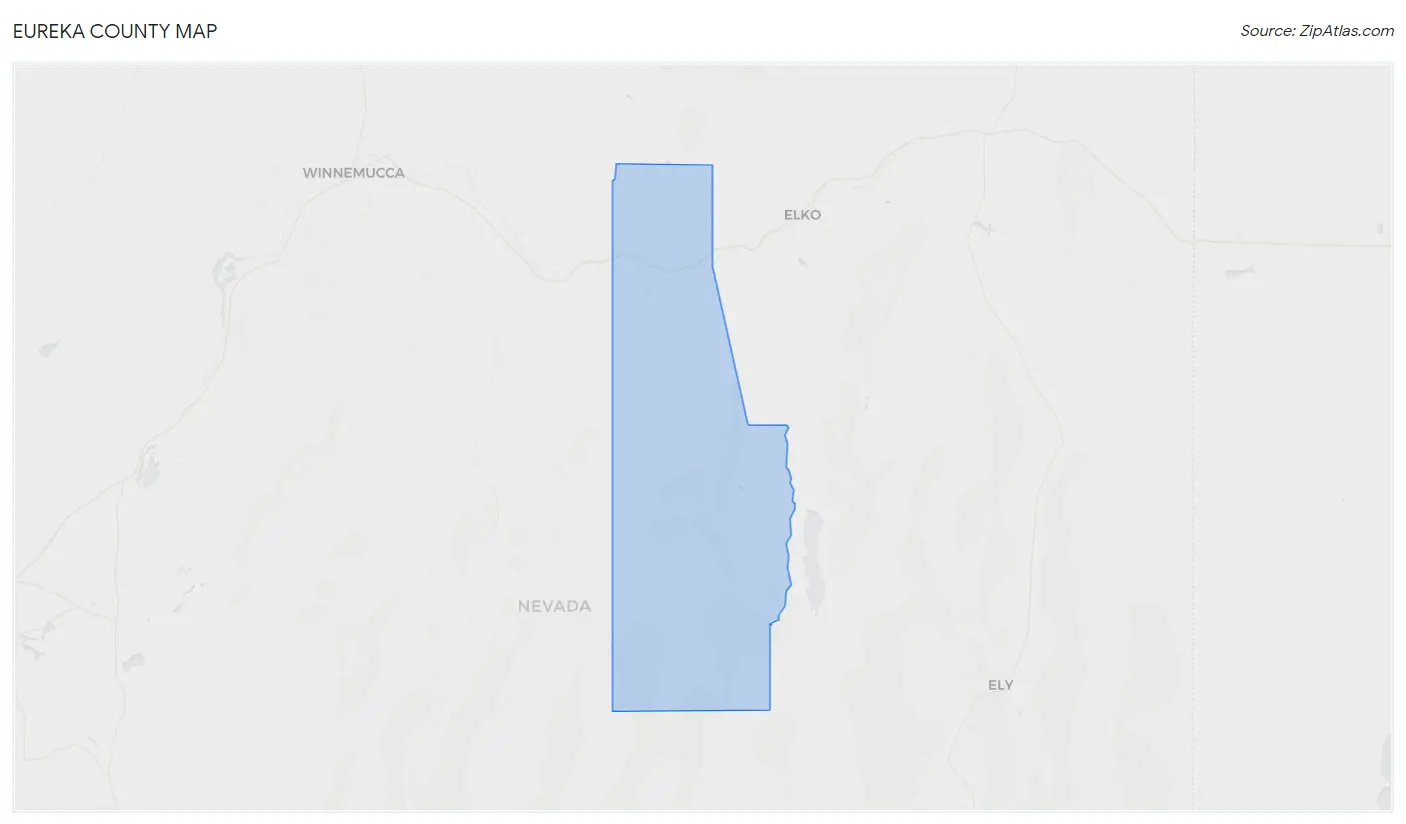
Eureka County Map
Eureka County Overview
$32,187
PER CAPITA INCOME
$74,143
AVG FAMILY INCOME
$73,929
AVG HOUSEHOLD INCOME
0.36
INEQUALITY / GINI INDEX
1,622
TOTAL POPULATION
818
MALE POPULATION
804
FEMALE POPULATION
101.74
MALES / 100 FEMALES
98.29
FEMALES / 100 MALES
48.4
MEDIAN AGE
3.0
AVG FAMILY SIZE
2.8
AVG HOUSEHOLD SIZE
579
LABOR FORCE [ PEOPLE ]
46.1%
PERCENT IN LABOR FORCE
Eureka County Area Codes
Income in Eureka County
Income Overview in Eureka County
Per Capita Income in Eureka County is $32,187, while median incomes of families and households are $74,143 and $73,929 respectively.
| Characteristic | Number | Measure |
| Per Capita Income | 1,622 | $32,187 |
| Median Family Income | 476 | $74,143 |
| Mean Family Income | 476 | $81,749 |
| Median Household Income | 570 | $73,929 |
| Mean Household Income | 570 | $88,816 |
| Income Deficit | 476 | $0 |
| Wage / Income Gap (%) | 1,622 | 0.00% |
| Wage / Income Gap ($) | 1,622 | 100.00¢ per $1 |
| Gini / Inequality Index | 1,622 | 0.36 |
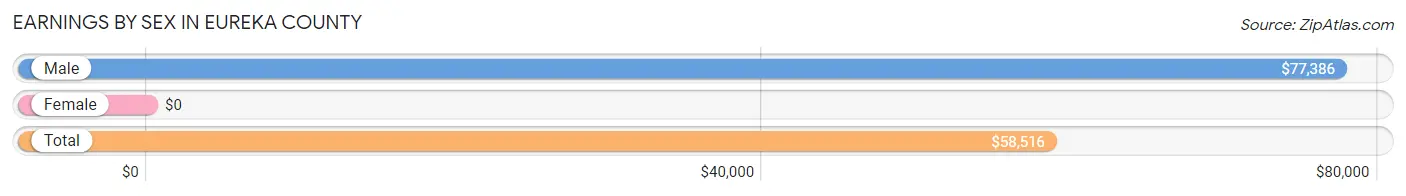
Earnings by Sex in Eureka County
| Sex | Number | Average Earnings |
| Male | 384 (63.5%) | $77,386 |
| Female | 221 (36.5%) | $0 |
| Total | 605 (100.0%) | $58,516 |
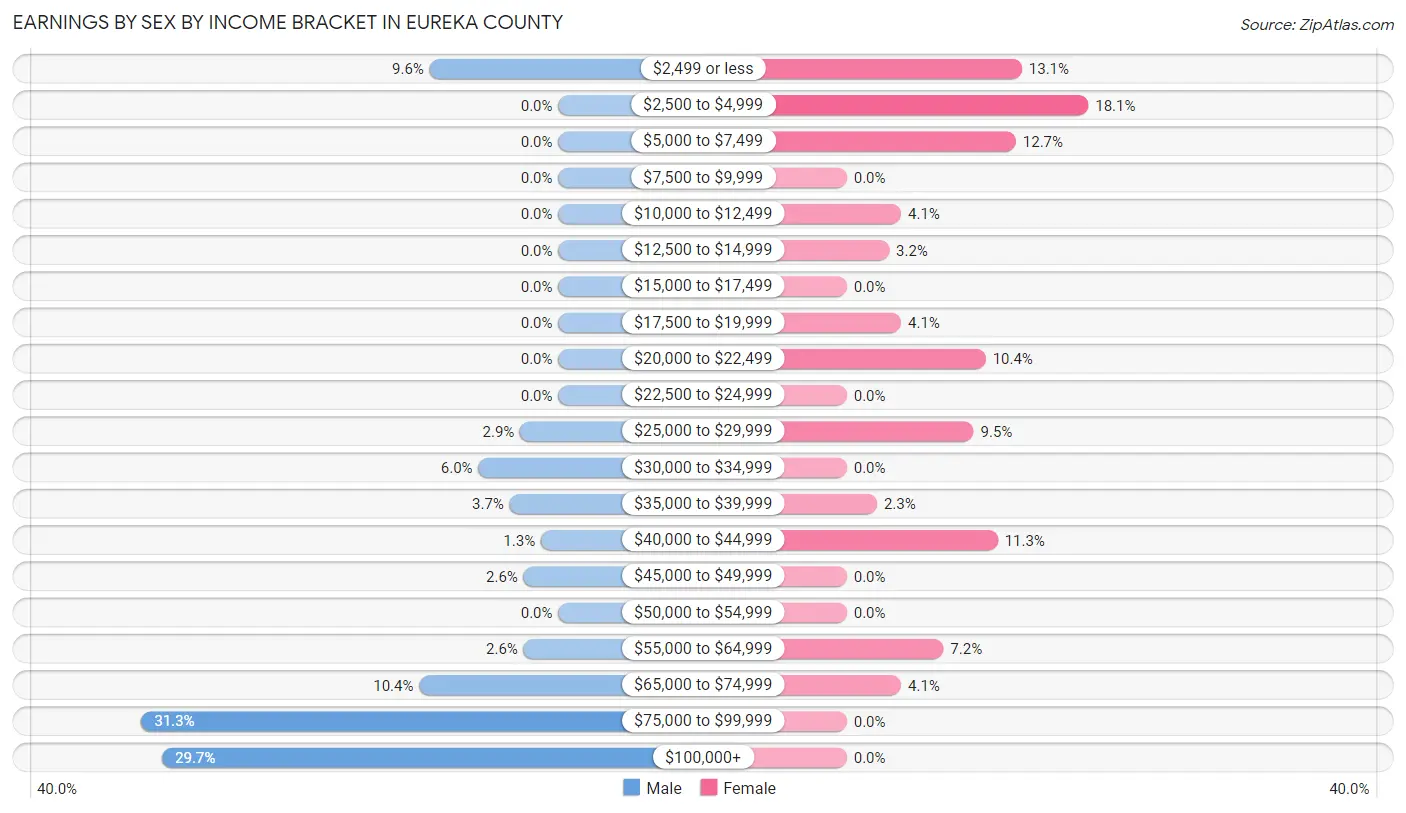
Earnings by Sex by Income Bracket in Eureka County
The most common earnings brackets in Eureka County are $75,000 to $99,999 for men (120 | 31.2%) and $2,500 to $4,999 for women (40 | 18.1%).
| Income | Male | Female |
| $2,499 or less | 37 (9.6%) | 29 (13.1%) |
| $2,500 to $4,999 | 0 (0.0%) | 40 (18.1%) |
| $5,000 to $7,499 | 0 (0.0%) | 28 (12.7%) |
| $7,500 to $9,999 | 0 (0.0%) | 0 (0.0%) |
| $10,000 to $12,499 | 0 (0.0%) | 9 (4.1%) |
| $12,500 to $14,999 | 0 (0.0%) | 7 (3.2%) |
| $15,000 to $17,499 | 0 (0.0%) | 0 (0.0%) |
| $17,500 to $19,999 | 0 (0.0%) | 9 (4.1%) |
| $20,000 to $22,499 | 0 (0.0%) | 23 (10.4%) |
| $22,500 to $24,999 | 0 (0.0%) | 0 (0.0%) |
| $25,000 to $29,999 | 11 (2.9%) | 21 (9.5%) |
| $30,000 to $34,999 | 23 (6.0%) | 0 (0.0%) |
| $35,000 to $39,999 | 14 (3.6%) | 5 (2.3%) |
| $40,000 to $44,999 | 5 (1.3%) | 25 (11.3%) |
| $45,000 to $49,999 | 10 (2.6%) | 0 (0.0%) |
| $50,000 to $54,999 | 0 (0.0%) | 0 (0.0%) |
| $55,000 to $64,999 | 10 (2.6%) | 16 (7.2%) |
| $65,000 to $74,999 | 40 (10.4%) | 9 (4.1%) |
| $75,000 to $99,999 | 120 (31.2%) | 0 (0.0%) |
| $100,000+ | 114 (29.7%) | 0 (0.0%) |
| Total | 384 (100.0%) | 221 (100.0%) |
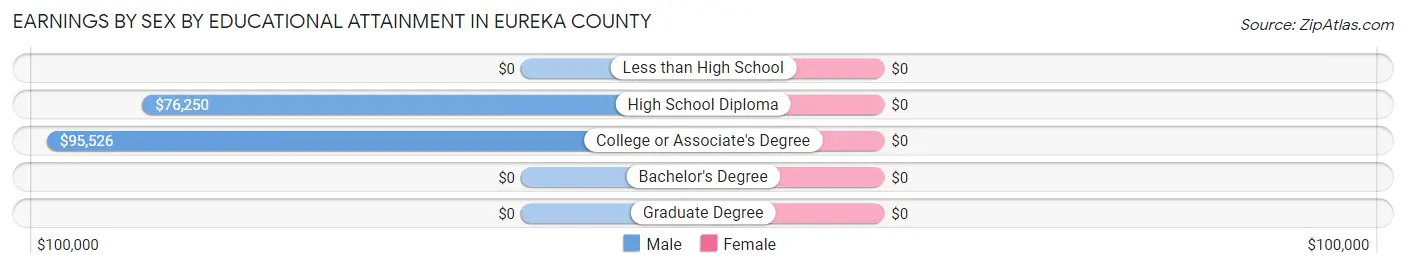
Earnings by Sex by Educational Attainment in Eureka County
| Educational Attainment | Male Income | Female Income |
| Less than High School | - | - |
| High School Diploma | $76,250 | $0 |
| College or Associate's Degree | $95,526 | $0 |
| Bachelor's Degree | - | - |
| Graduate Degree | - | - |
| Total | $82,974 | $20,598 |
Family Income in Eureka County
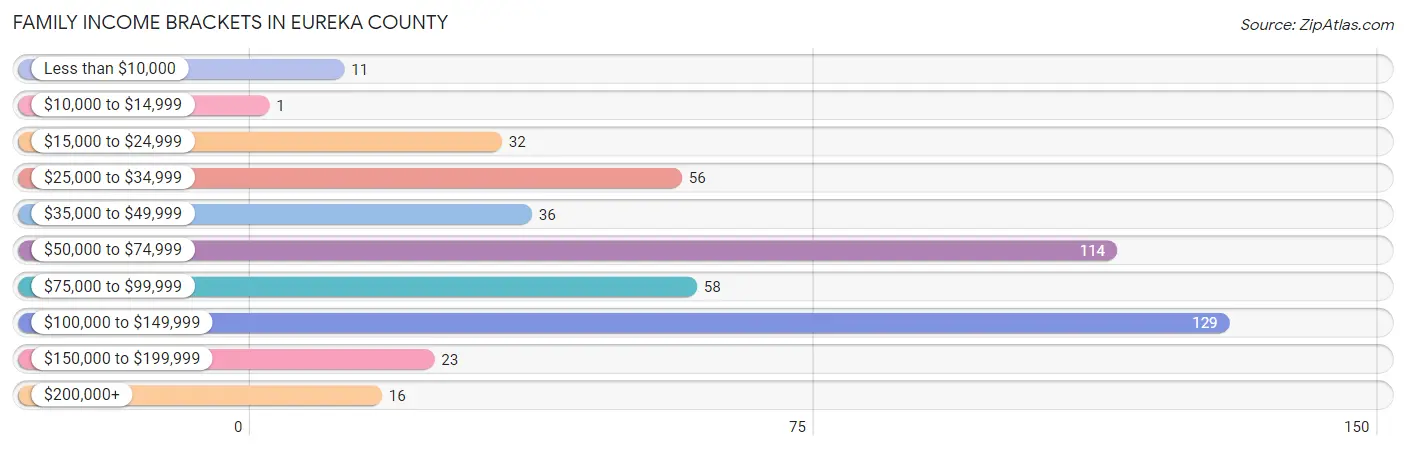
Family Income Brackets in Eureka County
According to the Eureka County family income data, there are 129 families falling into the $100,000 to $149,999 income range, which is the most common income bracket and makes up 27.1% of all families. Conversely, the $10,000 to $14,999 income bracket is the least frequent group with only 1 families (0.2%) belonging to this category.
| Income Bracket | # Families | % Families |
| Less than $10,000 | 11 | 2.3% |
| $10,000 to $14,999 | 1 | 0.2% |
| $15,000 to $24,999 | 32 | 6.7% |
| $25,000 to $34,999 | 56 | 11.8% |
| $35,000 to $49,999 | 36 | 7.6% |
| $50,000 to $74,999 | 114 | 23.9% |
| $75,000 to $99,999 | 58 | 12.2% |
| $100,000 to $149,999 | 129 | 27.1% |
| $150,000 to $199,999 | 23 | 4.8% |
| $200,000+ | 16 | 3.4% |
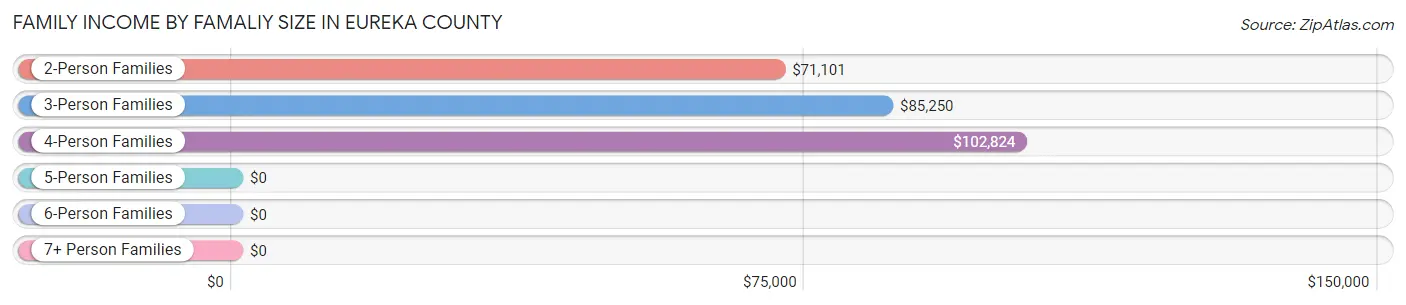
Family Income by Famaliy Size in Eureka County
4-person families (49 | 10.3%) account for the highest median family income in Eureka County with $102,824 per family, while 2-person families (291 | 61.1%) have the highest median income of $35,550 per family member.
| Income Bracket | # Families | Median Income |
| 2-Person Families | 291 (61.1%) | $71,101 |
| 3-Person Families | 76 (16.0%) | $85,250 |
| 4-Person Families | 49 (10.3%) | $102,824 |
| 5-Person Families | 30 (6.3%) | $0 |
| 6-Person Families | 0 (0.0%) | $0 |
| 7+ Person Families | 30 (6.3%) | $0 |
| Total | 476 (100.0%) | $74,143 |
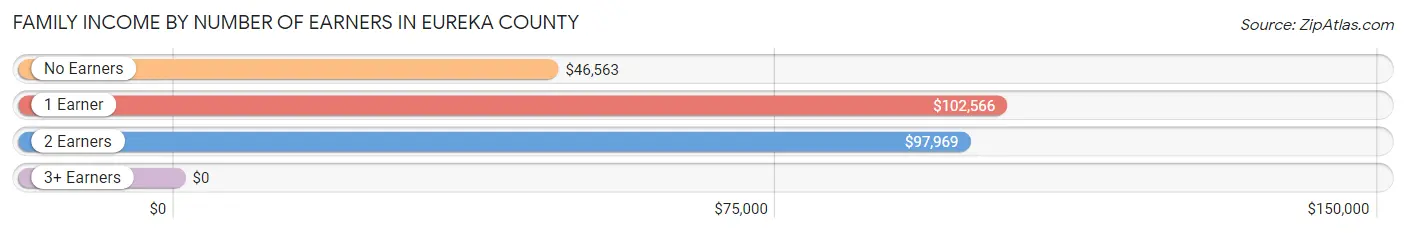
Family Income by Number of Earners in Eureka County
| Number of Earners | # Families | Median Income |
| No Earners | 173 (36.3%) | $46,563 |
| 1 Earner | 145 (30.5%) | $102,566 |
| 2 Earners | 132 (27.7%) | $97,969 |
| 3+ Earners | 26 (5.5%) | $0 |
| Total | 476 (100.0%) | $74,143 |
Household Income in Eureka County
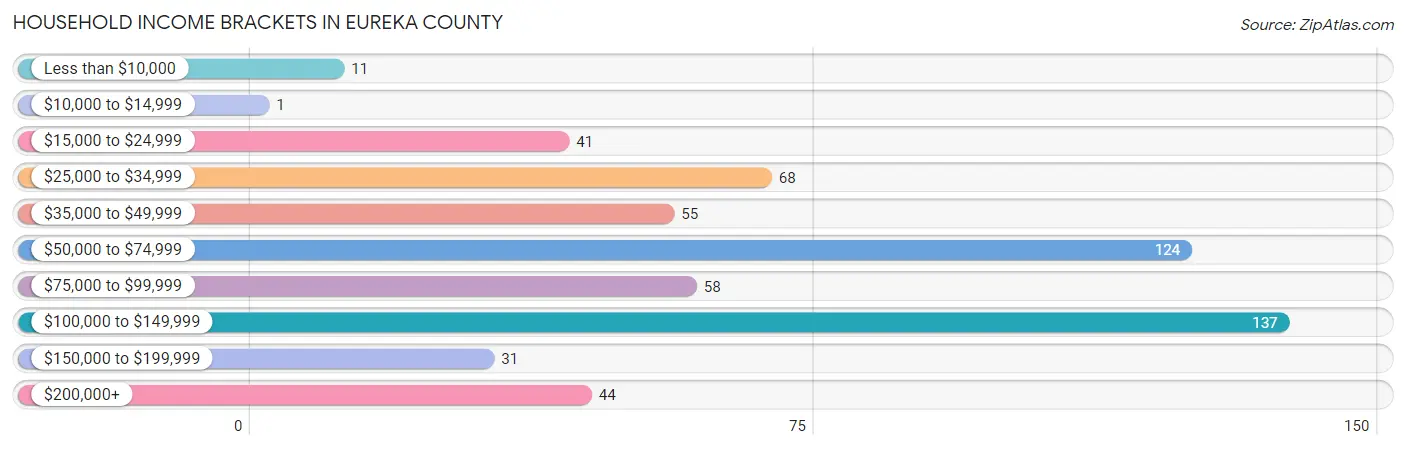
Household Income Brackets in Eureka County
With 137 households falling in the category, the $100,000 to $149,999 income range is the most frequent in Eureka County, accounting for 24.0% of all households. In contrast, only 1 households (0.2%) fall into the $10,000 to $14,999 income bracket, making it the least populous group.
| Income Bracket | # Households | % Households |
| Less than $10,000 | 11 | 1.9% |
| $10,000 to $14,999 | 1 | 0.2% |
| $15,000 to $24,999 | 41 | 7.2% |
| $25,000 to $34,999 | 68 | 11.9% |
| $35,000 to $49,999 | 55 | 9.6% |
| $50,000 to $74,999 | 124 | 21.8% |
| $75,000 to $99,999 | 58 | 10.2% |
| $100,000 to $149,999 | 137 | 24.0% |
| $150,000 to $199,999 | 31 | 5.4% |
| $200,000+ | 44 | 7.7% |
Household Income by Householder Age in Eureka County
The median household income in Eureka County is $73,929, with the highest median household income of $92,750 found in the 45 to 64 years age bracket for the primary householder. A total of 219 households (38.4%) fall into this category. Meanwhile, the 15 to 24 years age bracket for the primary householder has the lowest median household income of $0, with 27 households (4.7%) in this group.
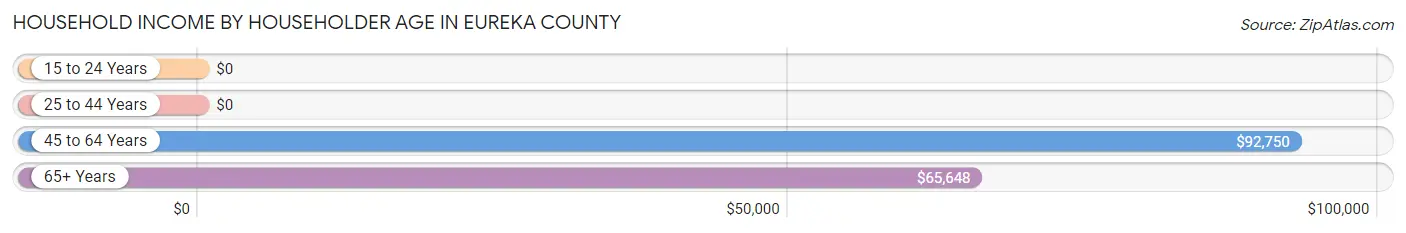
| Income Bracket | # Households | Median Income |
| 15 to 24 Years | 27 (4.7%) | $0 |
| 25 to 44 Years | 112 (19.7%) | $0 |
| 45 to 64 Years | 219 (38.4%) | $92,750 |
| 65+ Years | 212 (37.2%) | $65,648 |
| Total | 570 (100.0%) | $73,929 |
Poverty in Eureka County
Income Below Poverty by Sex and Age in Eureka County
With 16.3% poverty level for males and 19.0% for females among the residents of Eureka County, 16 and 17 year old males and 12 to 14 year old females are the most vulnerable to poverty, with 23 males (100.0%) and 25 females (96.2%) in their respective age groups living below the poverty level.
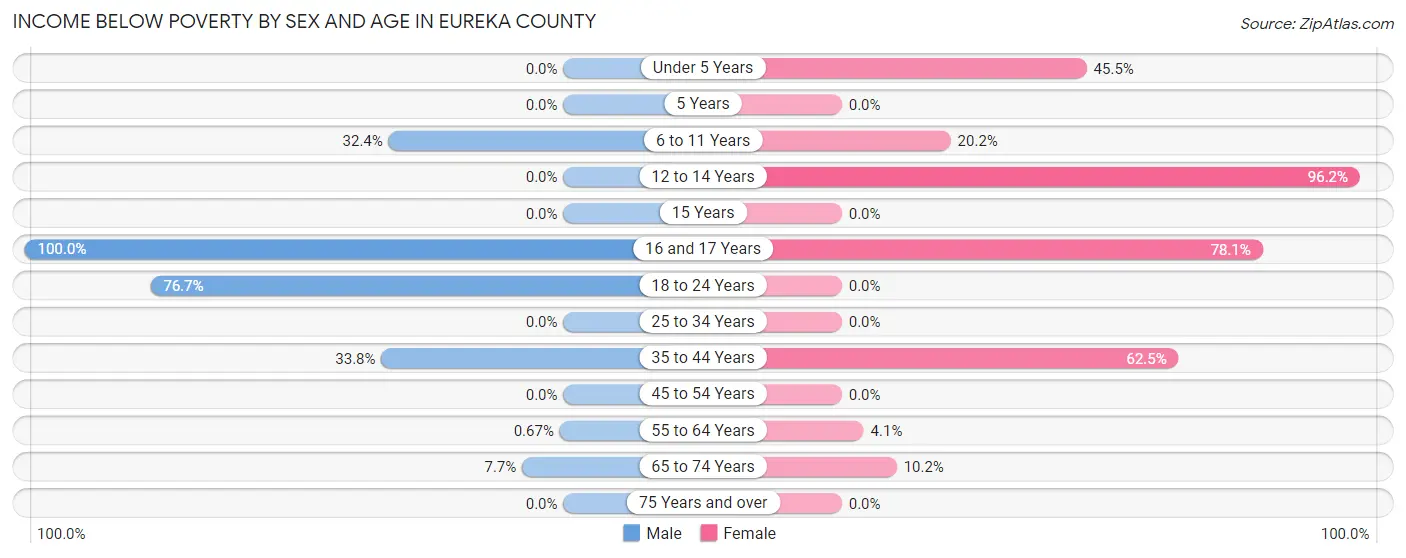
| Age Bracket | Male | Female |
| Under 5 Years | 0 (0.0%) | 20 (45.5%) |
| 5 Years | 0 (0.0%) | 0 (0.0%) |
| 6 to 11 Years | 24 (32.4%) | 19 (20.2%) |
| 12 to 14 Years | 0 (0.0%) | 25 (96.2%) |
| 15 Years | 0 (0.0%) | 0 (0.0%) |
| 16 and 17 Years | 23 (100.0%) | 25 (78.1%) |
| 18 to 24 Years | 46 (76.7%) | 0 (0.0%) |
| 25 to 34 Years | 0 (0.0%) | 0 (0.0%) |
| 35 to 44 Years | 25 (33.8%) | 45 (62.5%) |
| 45 to 54 Years | 0 (0.0%) | 0 (0.0%) |
| 55 to 64 Years | 1 (0.7%) | 8 (4.1%) |
| 65 to 74 Years | 13 (7.6%) | 11 (10.2%) |
| 75 Years and over | 0 (0.0%) | 0 (0.0%) |
| Total | 132 (16.3%) | 153 (19.0%) |
Income Above Poverty by Sex and Age in Eureka County
According to the poverty statistics in Eureka County, males aged under 5 years and females aged 5 years are the age groups that are most secure financially, with 100.0% of males and 100.0% of females in these age groups living above the poverty line.
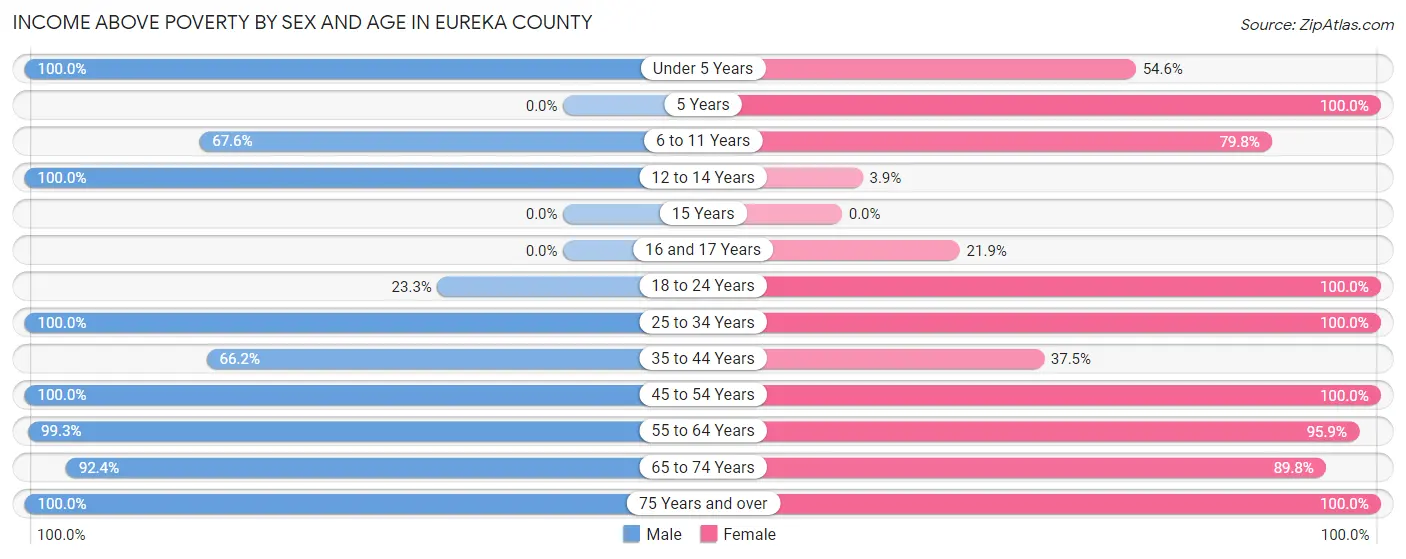
| Age Bracket | Male | Female |
| Under 5 Years | 62 (100.0%) | 24 (54.5%) |
| 5 Years | 0 (0.0%) | 21 (100.0%) |
| 6 to 11 Years | 50 (67.6%) | 75 (79.8%) |
| 12 to 14 Years | 46 (100.0%) | 1 (3.8%) |
| 15 Years | 0 (0.0%) | 0 (0.0%) |
| 16 and 17 Years | 0 (0.0%) | 7 (21.9%) |
| 18 to 24 Years | 14 (23.3%) | 27 (100.0%) |
| 25 to 34 Years | 55 (100.0%) | 46 (100.0%) |
| 35 to 44 Years | 49 (66.2%) | 27 (37.5%) |
| 45 to 54 Years | 59 (100.0%) | 48 (100.0%) |
| 55 to 64 Years | 149 (99.3%) | 189 (95.9%) |
| 65 to 74 Years | 157 (92.3%) | 97 (89.8%) |
| 75 Years and over | 39 (100.0%) | 89 (100.0%) |
| Total | 680 (83.7%) | 651 (81.0%) |
Income Below Poverty Among Married-Couple Families in Eureka County
The poverty statistics for married-couple families in Eureka County show that 8.4% or 37 of the total 439 families live below the poverty line. Families with 5 or more children have the highest poverty rate of 83.3%, comprising of 25 families. On the other hand, families with 1 or 2 children have the lowest poverty rate of 0.0%, which includes 0 families.
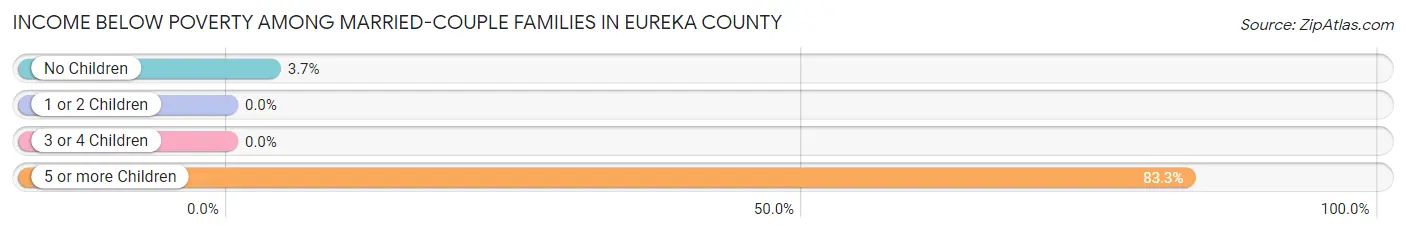
| Children | Above Poverty | Below Poverty |
| No Children | 311 (96.3%) | 12 (3.7%) |
| 1 or 2 Children | 56 (100.0%) | 0 (0.0%) |
| 3 or 4 Children | 30 (100.0%) | 0 (0.0%) |
| 5 or more Children | 5 (16.7%) | 25 (83.3%) |
| Total | 402 (91.6%) | 37 (8.4%) |
Income Below Poverty Among Single-Parent Households in Eureka County
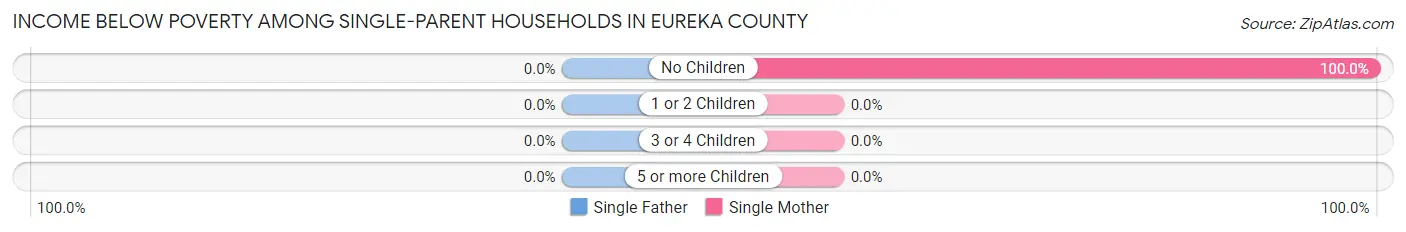
| Children | Single Father | Single Mother |
| No Children | 0 (0.0%) | 7 (100.0%) |
| 1 or 2 Children | 0 (0.0%) | 0 (0.0%) |
| 3 or 4 Children | 0 (0.0%) | 0 (0.0%) |
| 5 or more Children | 0 (0.0%) | 0 (0.0%) |
| Total | 0 (0.0%) | 7 (100.0%) |
Income Below Poverty Among Married-Couple vs Single-Parent Households in Eureka County
The poverty data for Eureka County shows that 37 of the married-couple family households (8.4%) and 7 of the single-parent households (18.9%) are living below the poverty level. Within the married-couple family households, those with 5 or more children have the highest poverty rate, with 25 households (83.3%) falling below the poverty line. Among the single-parent households, those with no children have the highest poverty rate, with 7 household (100.0%) living below poverty.
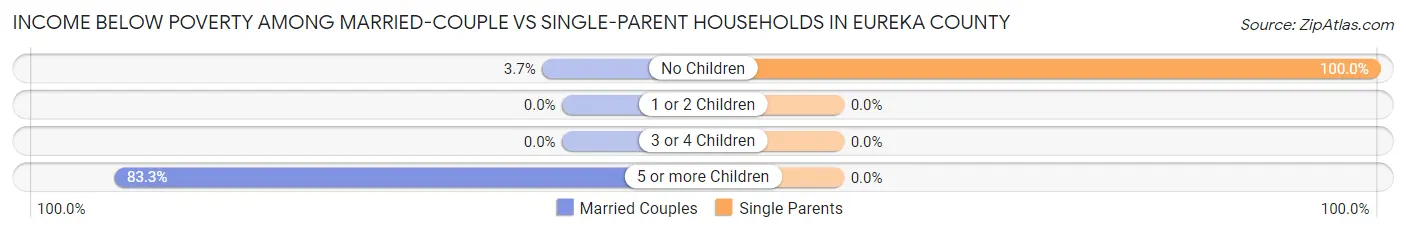
| Children | Married-Couple Families | Single-Parent Households |
| No Children | 12 (3.7%) | 7 (100.0%) |
| 1 or 2 Children | 0 (0.0%) | 0 (0.0%) |
| 3 or 4 Children | 0 (0.0%) | 0 (0.0%) |
| 5 or more Children | 25 (83.3%) | 0 (0.0%) |
| Total | 37 (8.4%) | 7 (18.9%) |
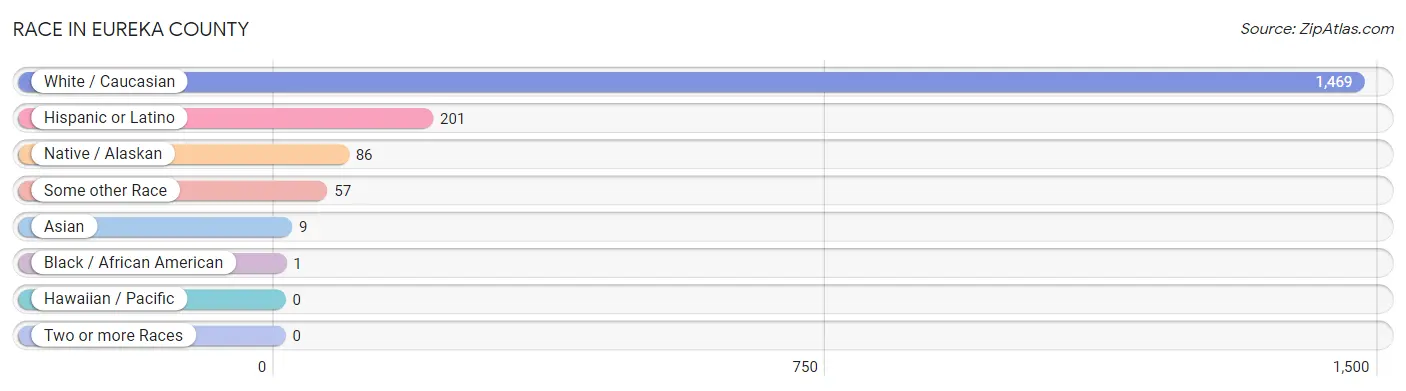
Race in Eureka County
The most populous races in Eureka County are White / Caucasian (1,469 | 90.6%), Hispanic or Latino (201 | 12.4%), and Native / Alaskan (86 | 5.3%).
| Race | # Population | % Population |
| Asian | 9 | 0.5% |
| Black / African American | 1 | 0.1% |
| Hawaiian / Pacific | 0 | 0.0% |
| Hispanic or Latino | 201 | 12.4% |
| Native / Alaskan | 86 | 5.3% |
| White / Caucasian | 1,469 | 90.6% |
| Two or more Races | 0 | 0.0% |
| Some other Race | 57 | 3.5% |
| Total | 1,622 | 100.0% |
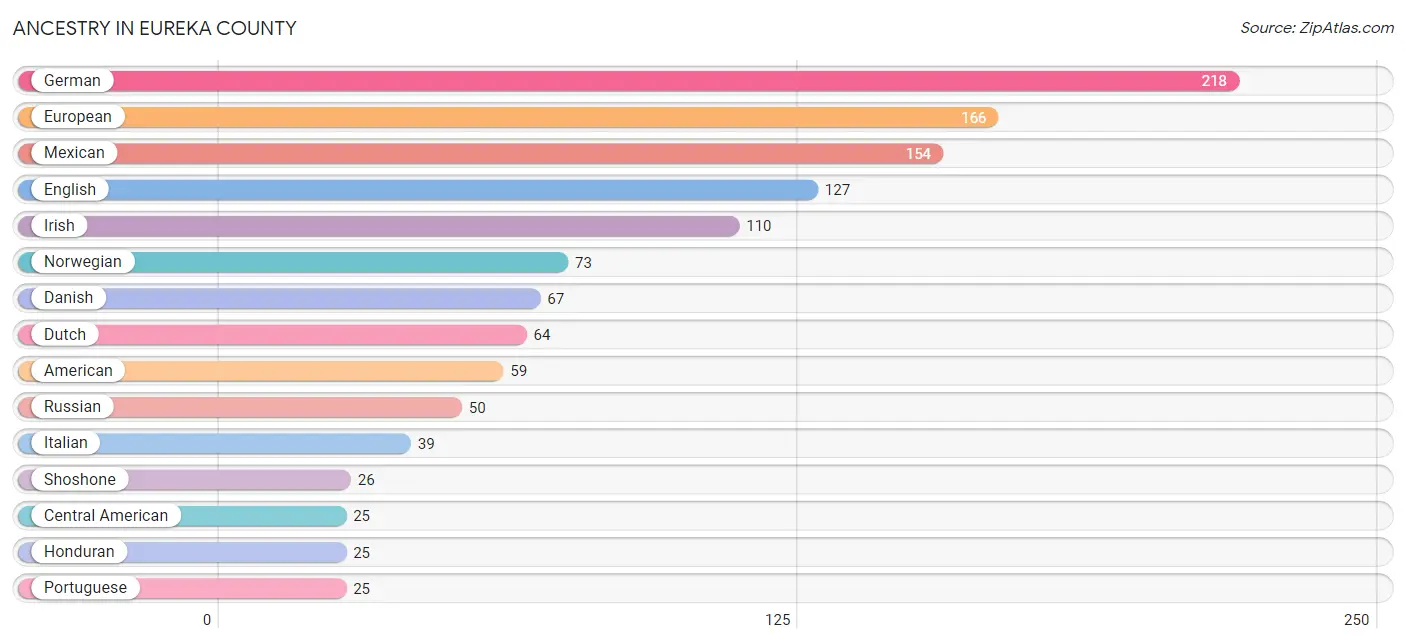
Ancestry in Eureka County
The most populous ancestries reported in Eureka County are German (218 | 13.4%), European (166 | 10.2%), Mexican (154 | 9.5%), English (127 | 7.8%), and Irish (110 | 6.8%), together accounting for 47.8% of all Eureka County residents.
| Ancestry | # Population | % Population |
| American | 59 | 3.6% |
| Central American | 25 | 1.5% |
| Central American Indian | 1 | 0.1% |
| Cuban | 1 | 0.1% |
| Danish | 67 | 4.1% |
| Dutch | 64 | 4.0% |
| English | 127 | 7.8% |
| European | 166 | 10.2% |
| German | 218 | 13.4% |
| Honduran | 25 | 1.5% |
| Hungarian | 3 | 0.2% |
| Irish | 110 | 6.8% |
| Italian | 39 | 2.4% |
| Mexican | 154 | 9.5% |
| Norwegian | 73 | 4.5% |
| Portuguese | 25 | 1.5% |
| Russian | 50 | 3.1% |
| Scotch-Irish | 13 | 0.8% |
| Shoshone | 26 | 1.6% |
| Spaniard | 8 | 0.5% |
| Sri Lankan | 9 | 0.5% |
| Ukrainian | 3 | 0.2% | View All 22 Rows |
Immigrants in Eureka County
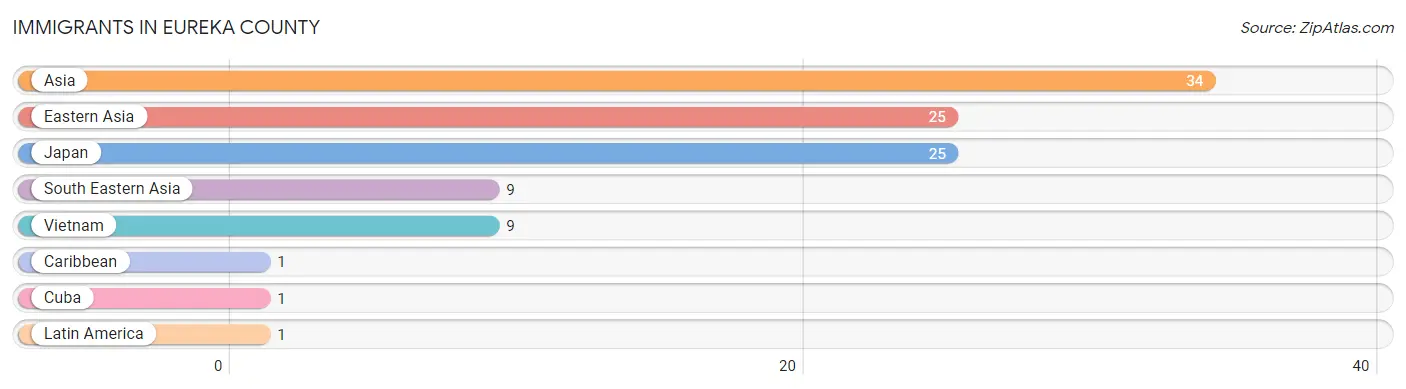
The most numerous immigrant groups reported in Eureka County came from Asia (34 | 2.1%), Eastern Asia (25 | 1.5%), Japan (25 | 1.5%), South Eastern Asia (9 | 0.5%), and Vietnam (9 | 0.5%), together accounting for 6.3% of all Eureka County residents.
| Immigration Origin | # Population | % Population |
| Asia | 34 | 2.1% |
| Caribbean | 1 | 0.1% |
| Cuba | 1 | 0.1% |
| Eastern Asia | 25 | 1.5% |
| Japan | 25 | 1.5% |
| Latin America | 1 | 0.1% |
| South Eastern Asia | 9 | 0.5% |
| Vietnam | 9 | 0.5% | View All 8 Rows |
Sex and Age in Eureka County
Sex and Age in Eureka County
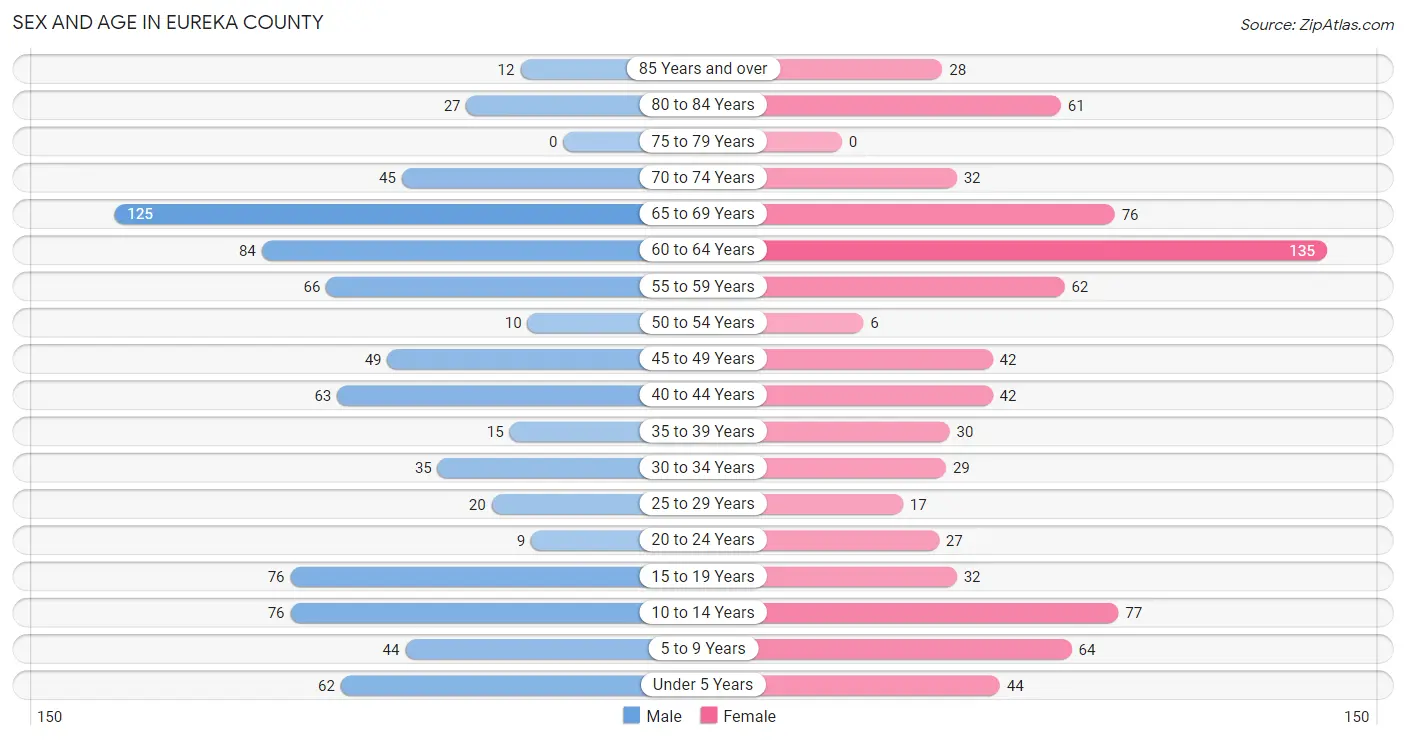
The most populous age groups in Eureka County are 65 to 69 Years (125 | 15.3%) for men and 60 to 64 Years (135 | 16.8%) for women.
| Age Bracket | Male | Female |
| Under 5 Years | 62 (7.6%) | 44 (5.5%) |
| 5 to 9 Years | 44 (5.4%) | 64 (8.0%) |
| 10 to 14 Years | 76 (9.3%) | 77 (9.6%) |
| 15 to 19 Years | 76 (9.3%) | 32 (4.0%) |
| 20 to 24 Years | 9 (1.1%) | 27 (3.4%) |
| 25 to 29 Years | 20 (2.4%) | 17 (2.1%) |
| 30 to 34 Years | 35 (4.3%) | 29 (3.6%) |
| 35 to 39 Years | 15 (1.8%) | 30 (3.7%) |
| 40 to 44 Years | 63 (7.7%) | 42 (5.2%) |
| 45 to 49 Years | 49 (6.0%) | 42 (5.2%) |
| 50 to 54 Years | 10 (1.2%) | 6 (0.7%) |
| 55 to 59 Years | 66 (8.1%) | 62 (7.7%) |
| 60 to 64 Years | 84 (10.3%) | 135 (16.8%) |
| 65 to 69 Years | 125 (15.3%) | 76 (9.5%) |
| 70 to 74 Years | 45 (5.5%) | 32 (4.0%) |
| 75 to 79 Years | 0 (0.0%) | 0 (0.0%) |
| 80 to 84 Years | 27 (3.3%) | 61 (7.6%) |
| 85 Years and over | 12 (1.5%) | 28 (3.5%) |
| Total | 818 (100.0%) | 804 (100.0%) |
Families and Households in Eureka County
Median Family Size in Eureka County
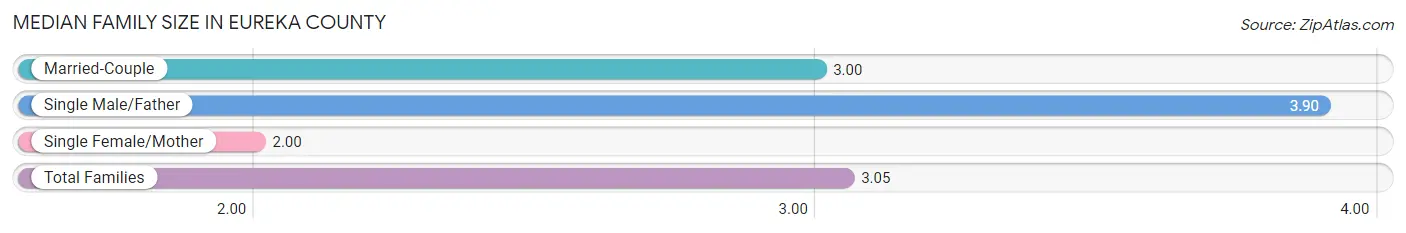
The median family size in Eureka County is 3.05 persons per family, with single male/father families (30 | 6.3%) accounting for the largest median family size of 3.9 persons per family. On the other hand, single female/mother families (7 | 1.5%) represent the smallest median family size with 2.00 persons per family.
| Family Type | # Families | Family Size |
| Married-Couple | 439 (92.2%) | 3.00 |
| Single Male/Father | 30 (6.3%) | 3.90 |
| Single Female/Mother | 7 (1.5%) | 2.00 |
| Total Families | 476 (100.0%) | 3.05 |
Median Household Size in Eureka County
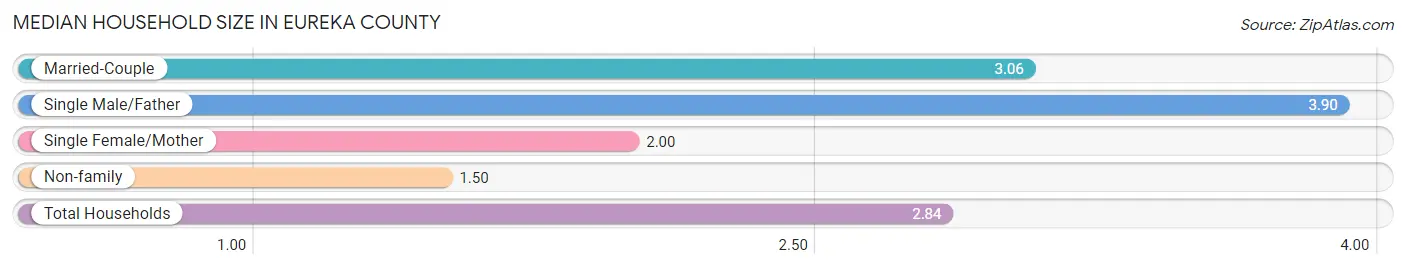
The median household size in Eureka County is 2.84 persons per household, with single male/father households (30 | 5.3%) accounting for the largest median household size of 3.9 persons per household. non-family households (94 | 16.5%) represent the smallest median household size with 1.50 persons per household.
| Household Type | # Households | Household Size |
| Married-Couple | 439 (77.0%) | 3.06 |
| Single Male/Father | 30 (5.3%) | 3.90 |
| Single Female/Mother | 7 (1.2%) | 2.00 |
| Non-family | 94 (16.5%) | 1.50 |
| Total Households | 570 (100.0%) | 2.84 |
Household Size by Marriage Status in Eureka County
Out of a total of 570 households in Eureka County, 476 (83.5%) are family households, while 94 (16.5%) are nonfamily households. The most numerous type of family households are 2-person households, comprising 291, and the most common type of nonfamily households are 1-person households, comprising 61.
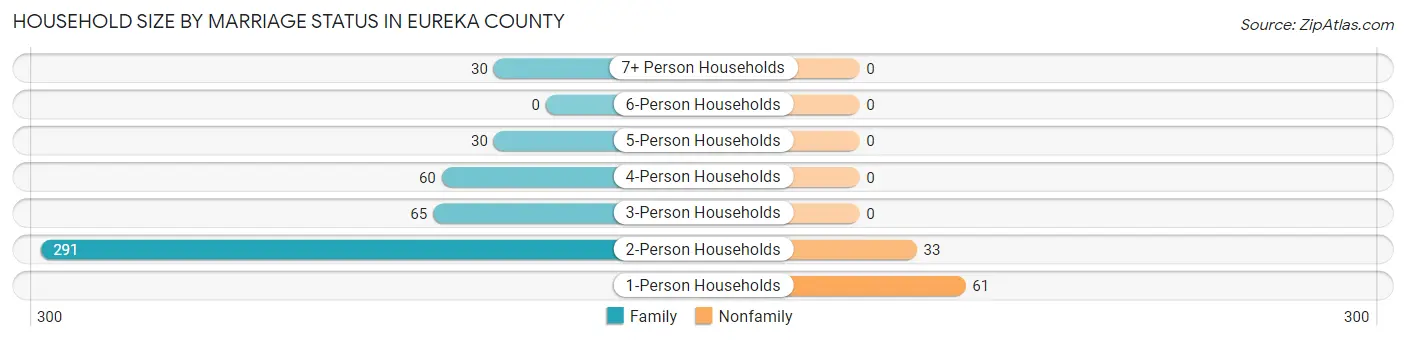
| Household Size | Family Households | Nonfamily Households |
| 1-Person Households | - | 61 (10.7%) |
| 2-Person Households | 291 (51.0%) | 33 (5.8%) |
| 3-Person Households | 65 (11.4%) | 0 (0.0%) |
| 4-Person Households | 60 (10.5%) | 0 (0.0%) |
| 5-Person Households | 30 (5.3%) | 0 (0.0%) |
| 6-Person Households | 0 (0.0%) | 0 (0.0%) |
| 7+ Person Households | 30 (5.3%) | 0 (0.0%) |
| Total | 476 (83.5%) | 94 (16.5%) |
Female Fertility in Eureka County
Fertility by Age in Eureka County
Average fertility rate in Eureka County is 160.0 births per 1,000 women. Women in the age bracket of 20 to 34 years have the highest fertility rate with 479.0 births per 1,000 women. Women in the age bracket of 20 to 34 years acount for 100.0% of all women with births.
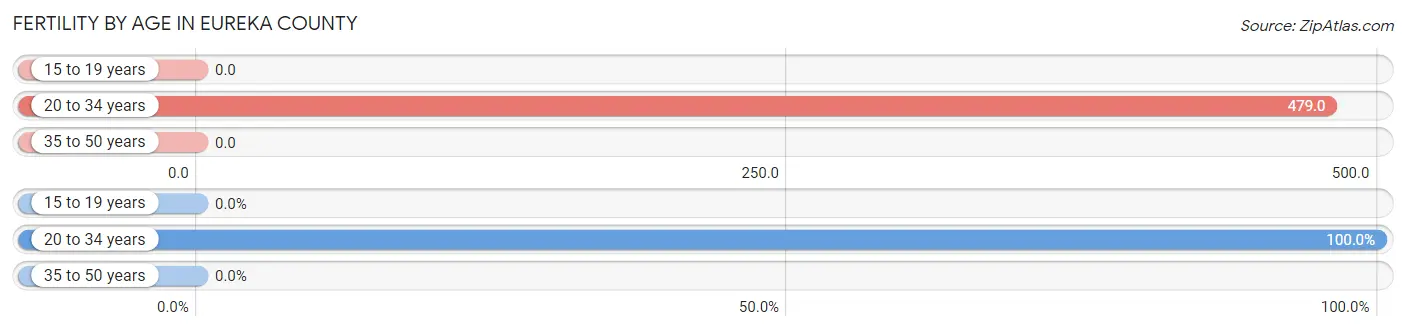
| Age Bracket | Women with Births | Births / 1,000 Women |
| 15 to 19 years | 0 (0.0%) | 0.0 |
| 20 to 34 years | 35 (100.0%) | 479.0 |
| 35 to 50 years | 0 (0.0%) | 0.0 |
| Total | 35 (100.0%) | 160.0 |
Fertility by Age by Marriage Status in Eureka County
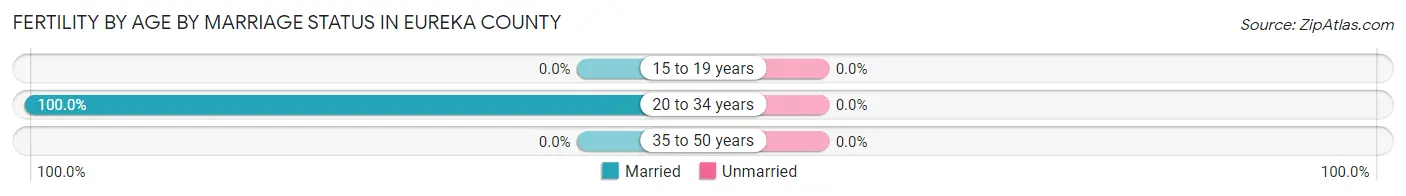
| Age Bracket | Married | Unmarried |
| 15 to 19 years | 0 (0.0%) | 0 (0.0%) |
| 20 to 34 years | 35 (100.0%) | 0 (0.0%) |
| 35 to 50 years | 0 (0.0%) | 0 (0.0%) |
| Total | 35 (100.0%) | 0 (0.0%) |
Fertility by Education in Eureka County
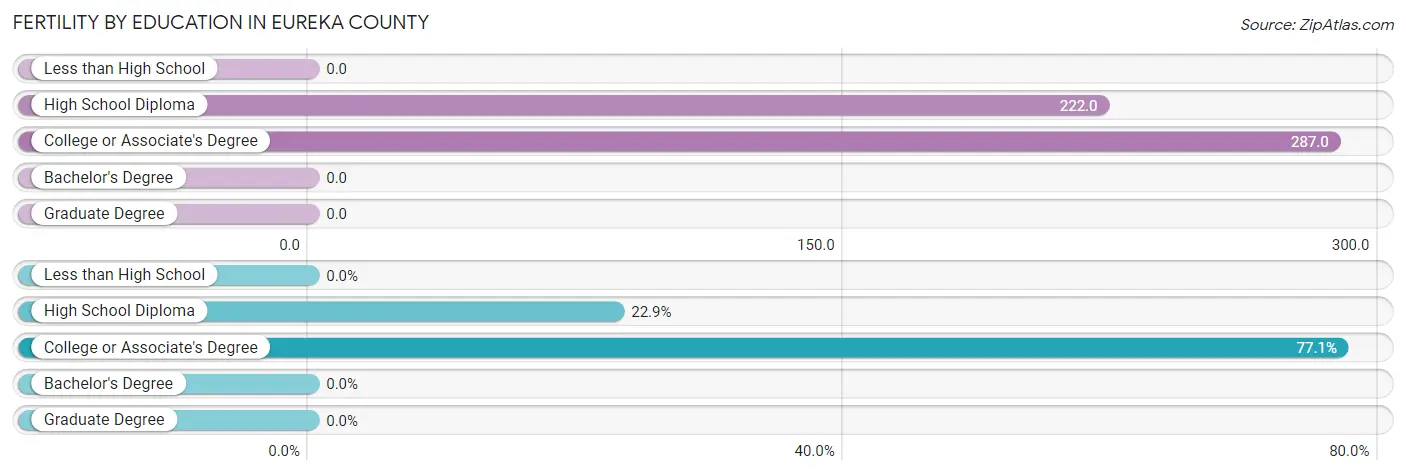
| Educational Attainment | Women with Births | Births / 1,000 Women |
| Less than High School | 0 (0.0%) | 0.0 |
| High School Diploma | 8 (22.9%) | 222.0 |
| College or Associate's Degree | 27 (77.1%) | 287.0 |
| Bachelor's Degree | 0 (0.0%) | 0.0 |
| Graduate Degree | 0 (0.0%) | 0.0 |
| Total | 35 (100.0%) | 160.0 |
Fertility by Education by Marriage Status in Eureka County
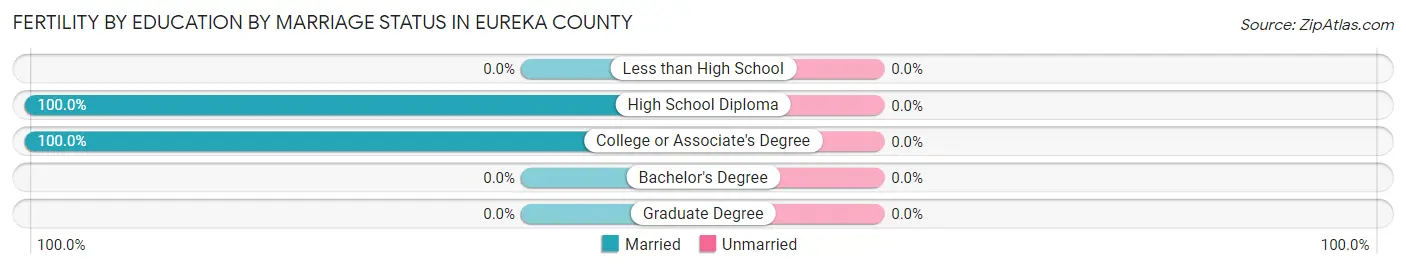
| Educational Attainment | Married | Unmarried |
| Less than High School | 0 (0.0%) | 0 (0.0%) |
| High School Diploma | 8 (100.0%) | 0 (0.0%) |
| College or Associate's Degree | 27 (100.0%) | 0 (0.0%) |
| Bachelor's Degree | 0 (0.0%) | 0 (0.0%) |
| Graduate Degree | 0 (0.0%) | 0 (0.0%) |
| Total | 35 (100.0%) | 0 (0.0%) |
Employment Characteristics in Eureka County
Employment by Class of Employer in Eureka County
Among the 579 employed individuals in Eureka County, private company employees (406 | 70.1%), local government employees (113 | 19.5%), and self-employed (not incorporated) (41 | 7.1%) make up the most common classes of employment.
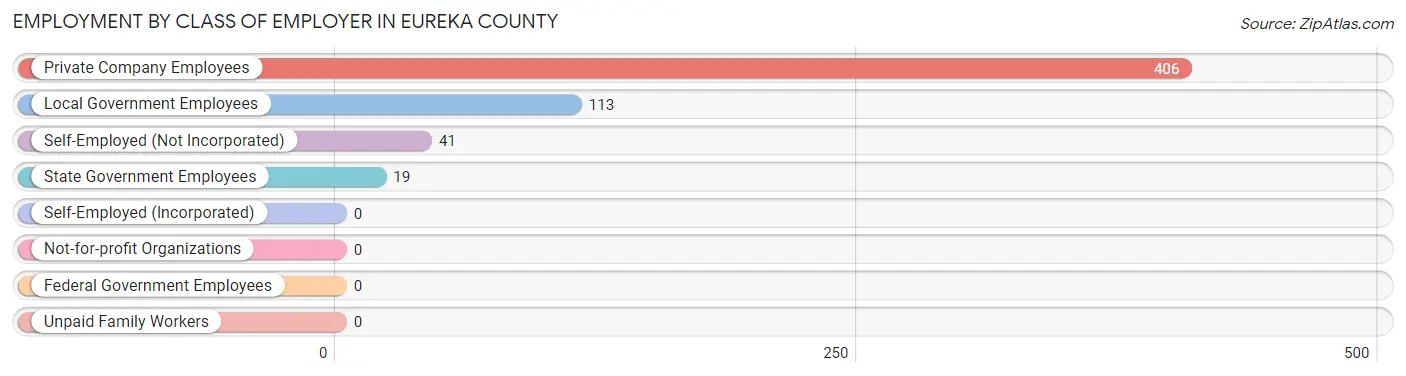
| Employer Class | # Employees | % Employees |
| Private Company Employees | 406 | 70.1% |
| Self-Employed (Incorporated) | 0 | 0.0% |
| Self-Employed (Not Incorporated) | 41 | 7.1% |
| Not-for-profit Organizations | 0 | 0.0% |
| Local Government Employees | 113 | 19.5% |
| State Government Employees | 19 | 3.3% |
| Federal Government Employees | 0 | 0.0% |
| Unpaid Family Workers | 0 | 0.0% |
| Total | 579 | 100.0% |
Employment Status by Age in Eureka County
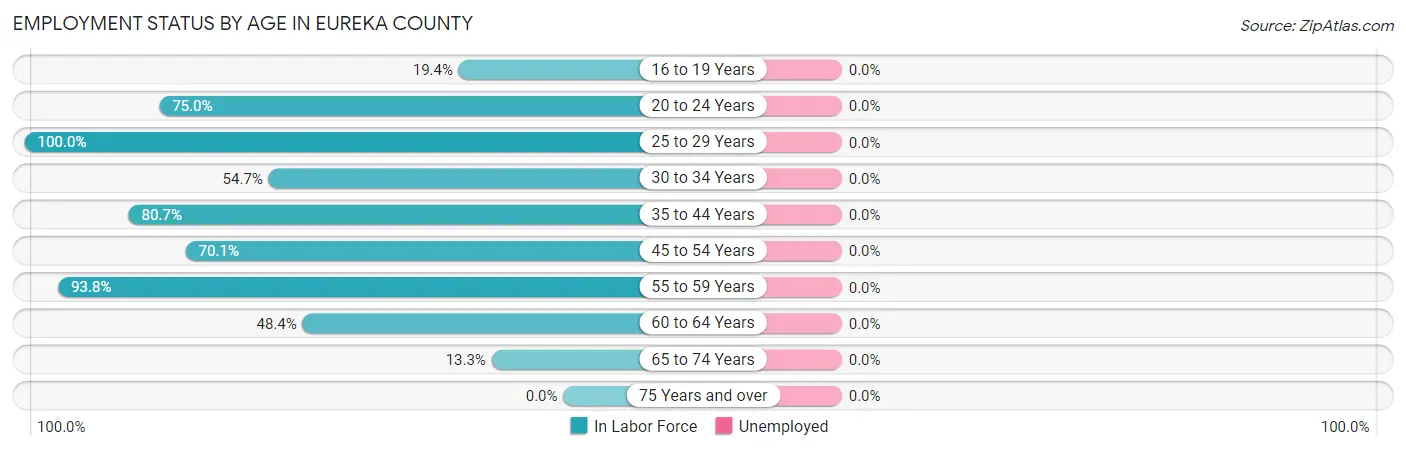
| Age Bracket | In Labor Force | Unemployed |
| 16 to 19 Years | 21 (19.4%) | 0 (0.0%) |
| 20 to 24 Years | 27 (75.0%) | 0 (0.0%) |
| 25 to 29 Years | 37 (100.0%) | 0 (0.0%) |
| 30 to 34 Years | 35 (54.7%) | 0 (0.0%) |
| 35 to 44 Years | 121 (80.7%) | 0 (0.0%) |
| 45 to 54 Years | 75 (70.1%) | 0 (0.0%) |
| 55 to 59 Years | 120 (93.8%) | 0 (0.0%) |
| 60 to 64 Years | 106 (48.4%) | 0 (0.0%) |
| 65 to 74 Years | 37 (13.3%) | 0 (0.0%) |
| 75 Years and over | 0 (0.0%) | 0 (0.0%) |
| Total | 579 (46.1%) | 0 (0.0%) |
Employment Status by Educational Attainment in Eureka County
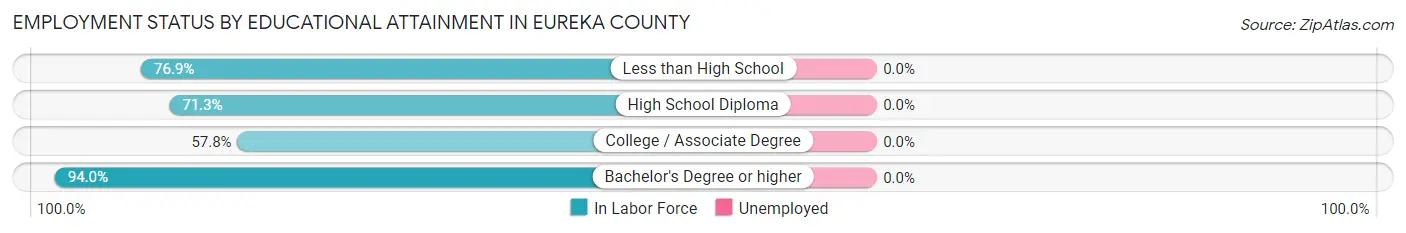
| Educational Attainment | In Labor Force | Unemployed |
| Less than High School | 30 (76.9%) | 0 (0.0%) |
| High School Diploma | 194 (71.3%) | 0 (0.0%) |
| College / Associate Degree | 160 (57.8%) | 0 (0.0%) |
| Bachelor's Degree or higher | 110 (94.0%) | 0 (0.0%) |
| Total | 494 (70.1%) | 0 (0.0%) |
Employment Occupations by Sex in Eureka County
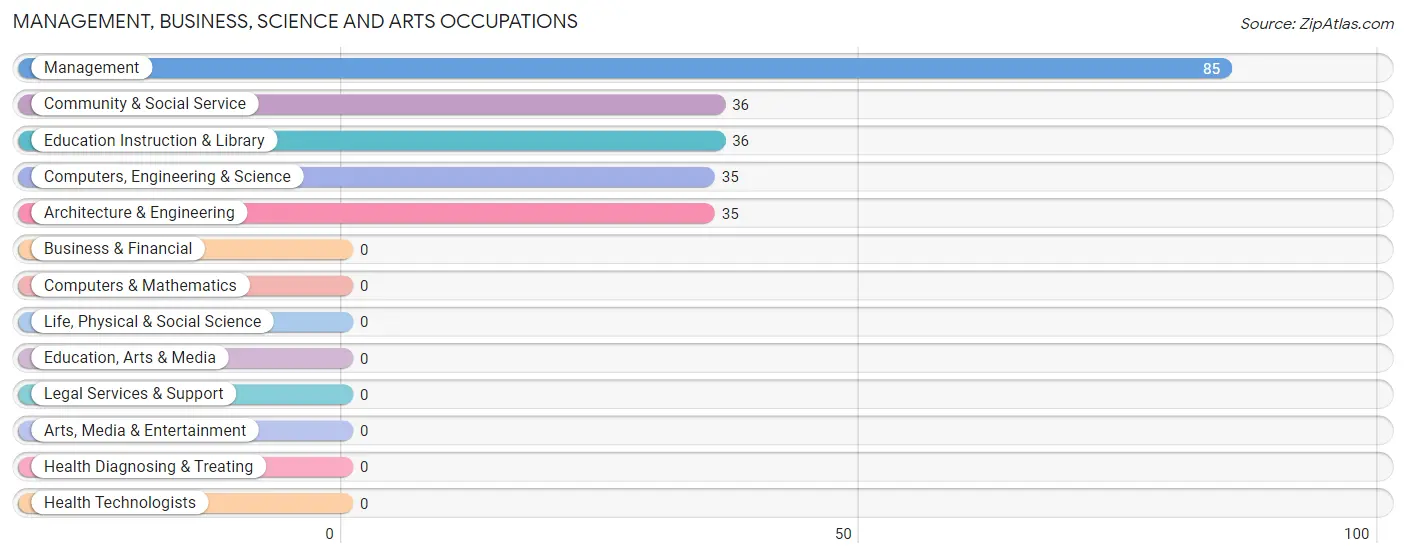
Management, Business, Science and Arts Occupations
The most common Management, Business, Science and Arts occupations in Eureka County are Management (85 | 14.7%), Community & Social Service (36 | 6.2%), Education Instruction & Library (36 | 6.2%), Computers, Engineering & Science (35 | 6.0%), and Architecture & Engineering (35 | 6.0%).
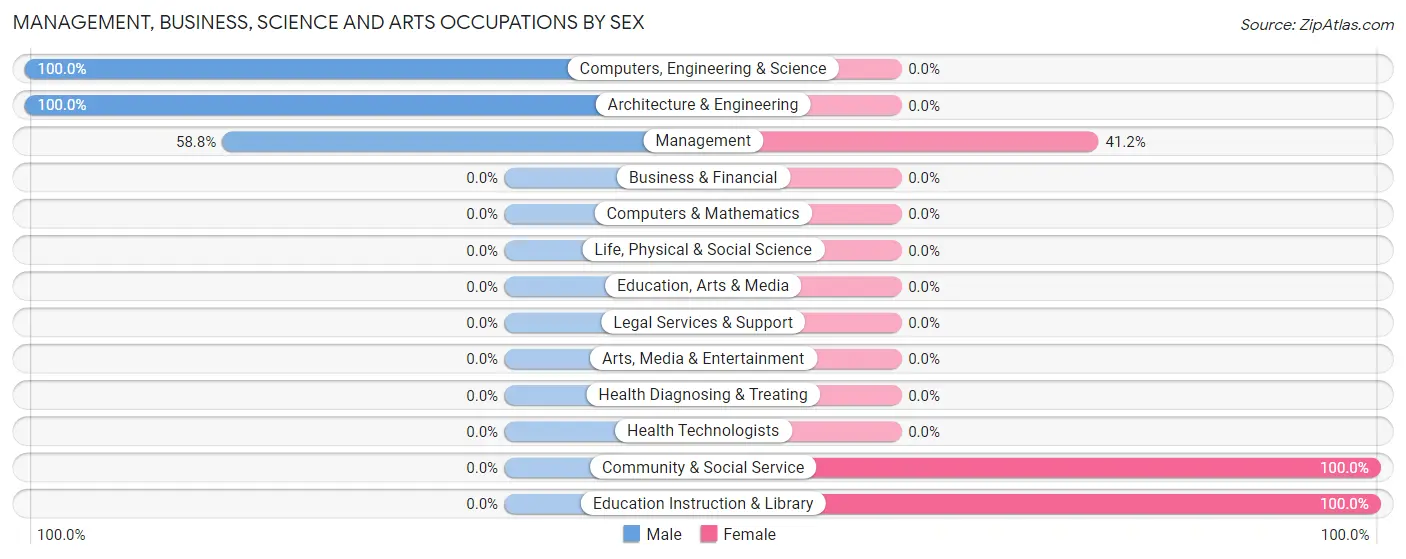
Management, Business, Science and Arts Occupations by Sex
Within the Management, Business, Science and Arts occupations in Eureka County, the most male-oriented occupations are Computers, Engineering & Science (100.0%), Architecture & Engineering (100.0%), and Management (58.8%), while the most female-oriented occupations are Community & Social Service (100.0%), Education Instruction & Library (100.0%), and Management (41.2%).
| Occupation | Male | Female |
| Management | 50 (58.8%) | 35 (41.2%) |
| Business & Financial | 0 (0.0%) | 0 (0.0%) |
| Computers, Engineering & Science | 35 (100.0%) | 0 (0.0%) |
| Computers & Mathematics | 0 (0.0%) | 0 (0.0%) |
| Architecture & Engineering | 35 (100.0%) | 0 (0.0%) |
| Life, Physical & Social Science | 0 (0.0%) | 0 (0.0%) |
| Community & Social Service | 0 (0.0%) | 36 (100.0%) |
| Education, Arts & Media | 0 (0.0%) | 0 (0.0%) |
| Legal Services & Support | 0 (0.0%) | 0 (0.0%) |
| Education Instruction & Library | 0 (0.0%) | 36 (100.0%) |
| Arts, Media & Entertainment | 0 (0.0%) | 0 (0.0%) |
| Health Diagnosing & Treating | 0 (0.0%) | 0 (0.0%) |
| Health Technologists | 0 (0.0%) | 0 (0.0%) |
| Total (Category) | 85 (54.5%) | 71 (45.5%) |
| Total (Overall) | 371 (64.1%) | 208 (35.9%) |
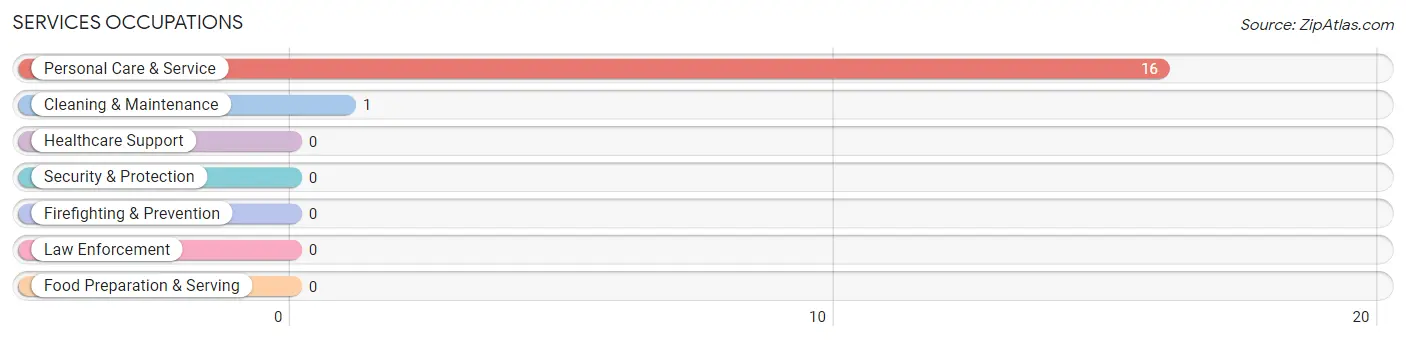
Services Occupations
The most common Services occupations in Eureka County are Personal Care & Service (16 | 2.8%), and Cleaning & Maintenance (1 | 0.2%).
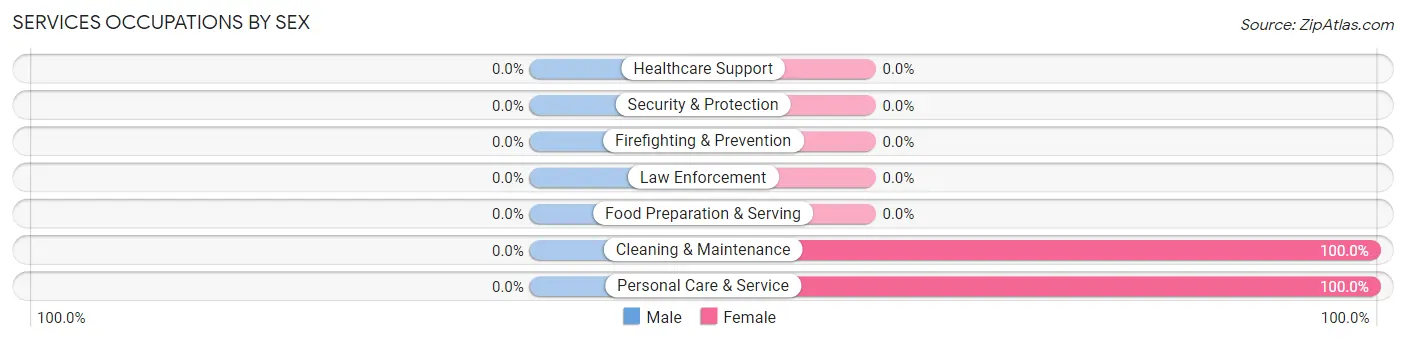
Services Occupations by Sex
| Occupation | Male | Female |
| Healthcare Support | 0 (0.0%) | 0 (0.0%) |
| Security & Protection | 0 (0.0%) | 0 (0.0%) |
| Firefighting & Prevention | 0 (0.0%) | 0 (0.0%) |
| Law Enforcement | 0 (0.0%) | 0 (0.0%) |
| Food Preparation & Serving | 0 (0.0%) | 0 (0.0%) |
| Cleaning & Maintenance | 0 (0.0%) | 1 (100.0%) |
| Personal Care & Service | 0 (0.0%) | 16 (100.0%) |
| Total (Category) | 0 (0.0%) | 17 (100.0%) |
| Total (Overall) | 371 (64.1%) | 208 (35.9%) |
Sales and Office Occupations
The most common Sales and Office occupations in Eureka County are Sales & Related (60 | 10.4%), and Office & Administration (34 | 5.9%).
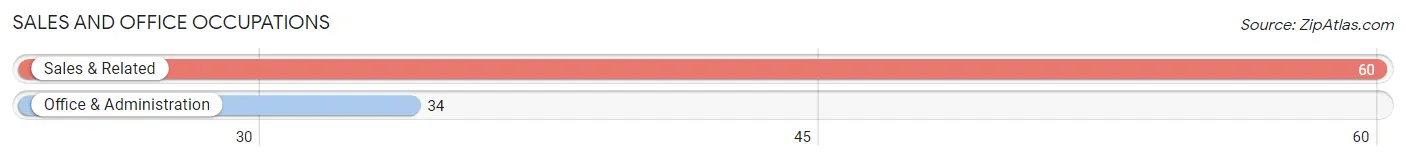
Sales and Office Occupations by Sex
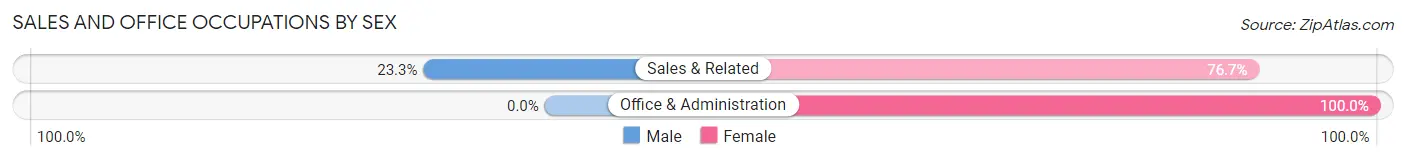
| Occupation | Male | Female |
| Sales & Related | 14 (23.3%) | 46 (76.7%) |
| Office & Administration | 0 (0.0%) | 34 (100.0%) |
| Total (Category) | 14 (14.9%) | 80 (85.1%) |
| Total (Overall) | 371 (64.1%) | 208 (35.9%) |
Natural Resources, Construction and Maintenance Occupations
The most common Natural Resources, Construction and Maintenance occupations in Eureka County are Construction & Extraction (70 | 12.1%), and Installation, Maintenance & Repair (38 | 6.6%).
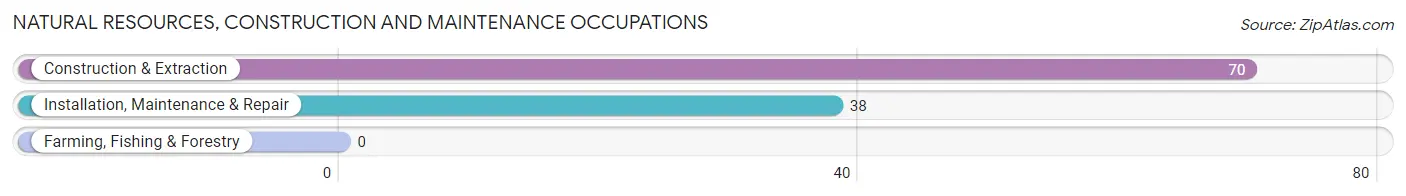
Natural Resources, Construction and Maintenance Occupations by Sex
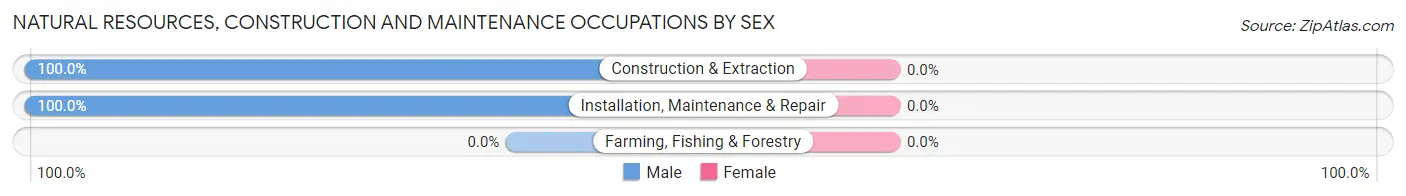
| Occupation | Male | Female |
| Farming, Fishing & Forestry | 0 (0.0%) | 0 (0.0%) |
| Construction & Extraction | 70 (100.0%) | 0 (0.0%) |
| Installation, Maintenance & Repair | 38 (100.0%) | 0 (0.0%) |
| Total (Category) | 108 (100.0%) | 0 (0.0%) |
| Total (Overall) | 371 (64.1%) | 208 (35.9%) |
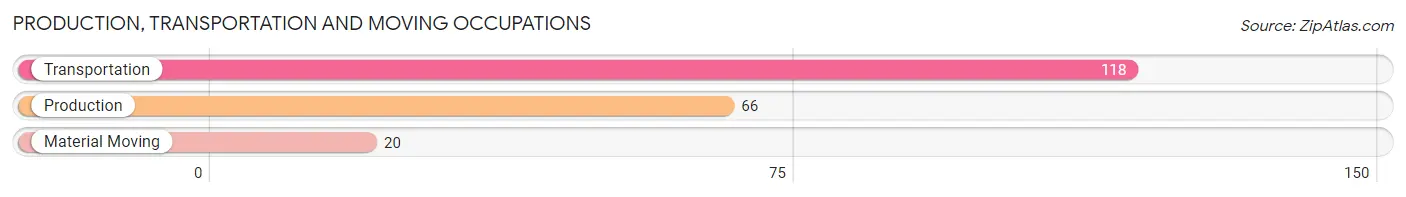
Production, Transportation and Moving Occupations
The most common Production, Transportation and Moving occupations in Eureka County are Transportation (118 | 20.4%), Production (66 | 11.4%), and Material Moving (20 | 3.5%).
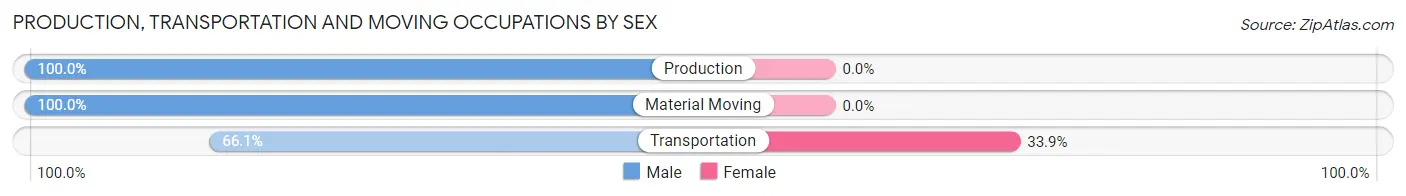
Production, Transportation and Moving Occupations by Sex
| Occupation | Male | Female |
| Production | 66 (100.0%) | 0 (0.0%) |
| Transportation | 78 (66.1%) | 40 (33.9%) |
| Material Moving | 20 (100.0%) | 0 (0.0%) |
| Total (Category) | 164 (80.4%) | 40 (19.6%) |
| Total (Overall) | 371 (64.1%) | 208 (35.9%) |
Employment Industries by Sex in Eureka County
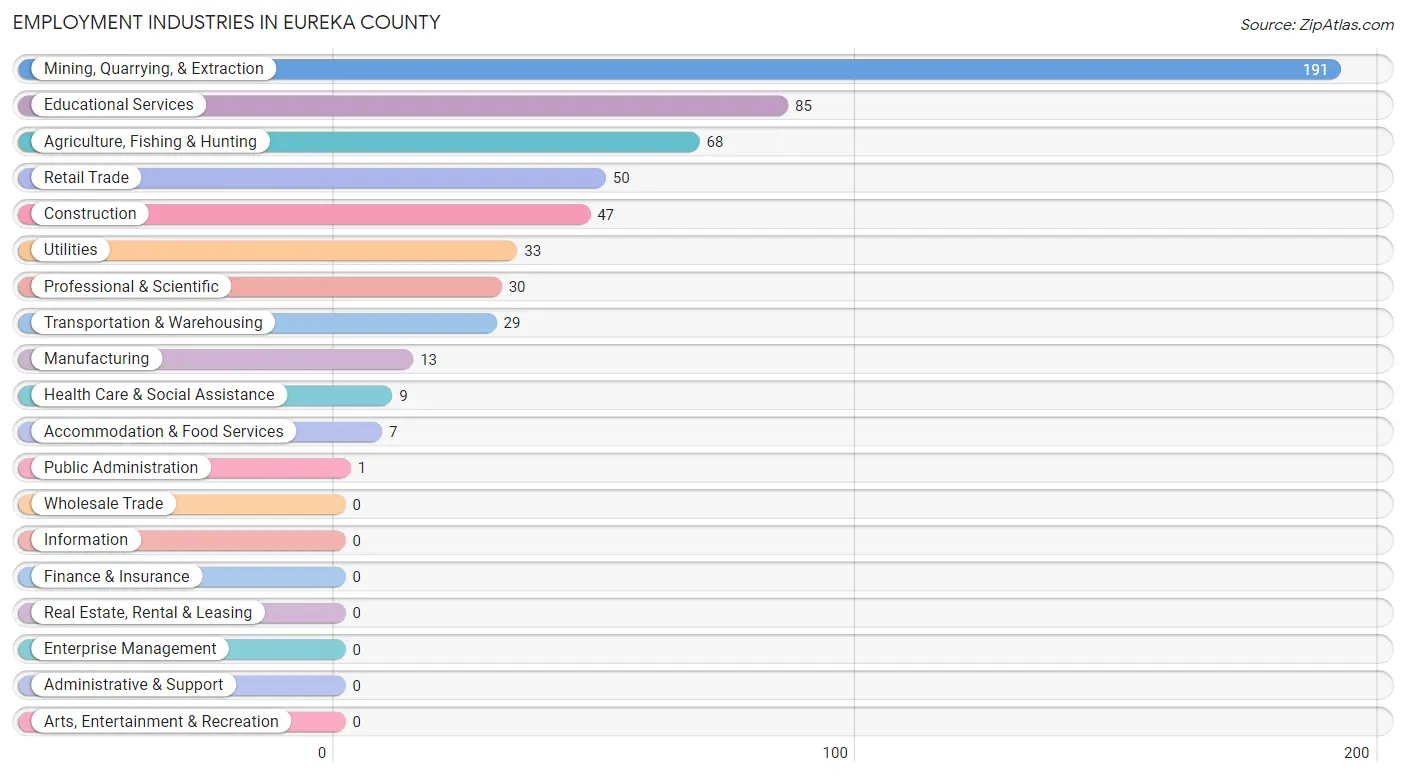
Employment Industries in Eureka County
The major employment industries in Eureka County include Mining, Quarrying, & Extraction (191 | 33.0%), Educational Services (85 | 14.7%), Agriculture, Fishing & Hunting (68 | 11.7%), Retail Trade (50 | 8.6%), and Construction (47 | 8.1%).
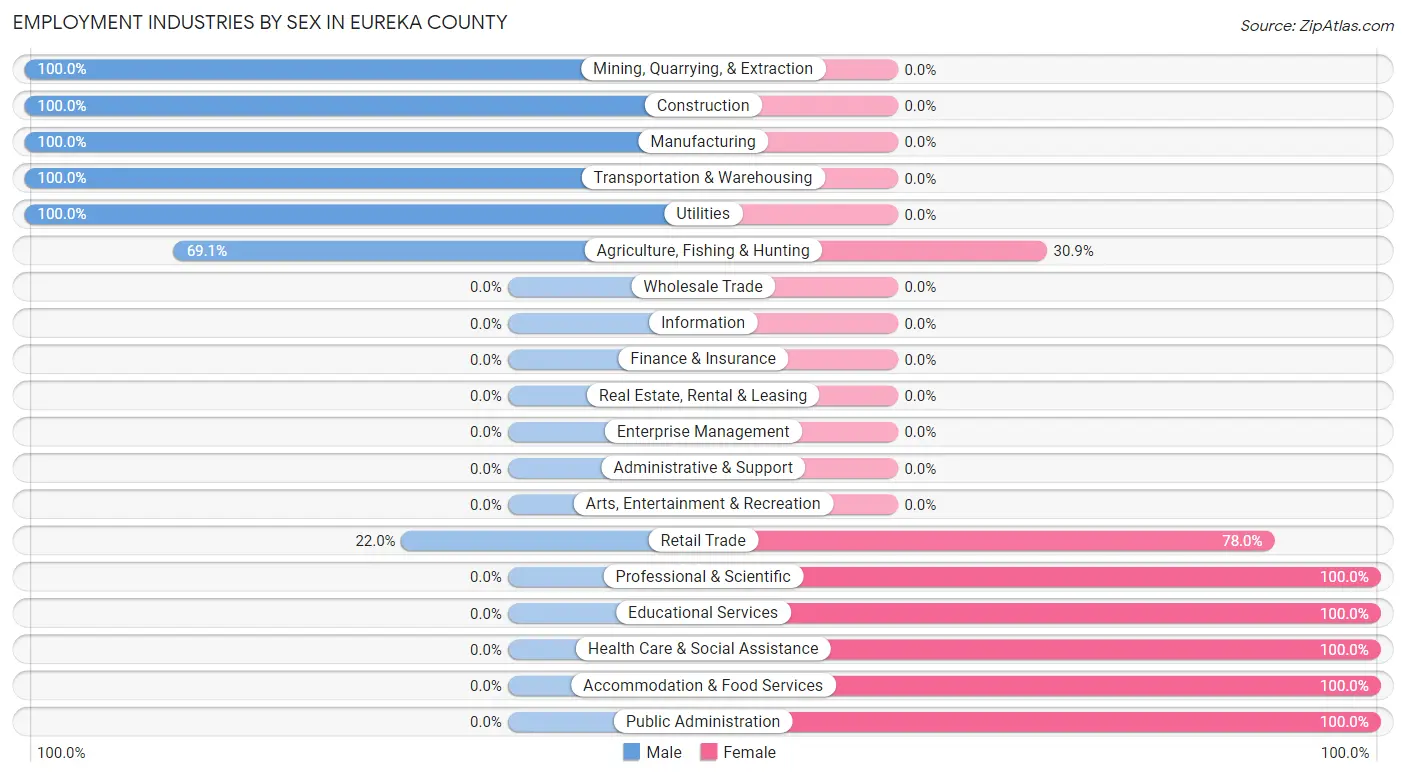
Employment Industries by Sex in Eureka County
The Eureka County industries that see more men than women are Mining, Quarrying, & Extraction (100.0%), Construction (100.0%), and Manufacturing (100.0%), whereas the industries that tend to have a higher number of women are Professional & Scientific (100.0%), Educational Services (100.0%), and Health Care & Social Assistance (100.0%).
| Industry | Male | Female |
| Agriculture, Fishing & Hunting | 47 (69.1%) | 21 (30.9%) |
| Mining, Quarrying, & Extraction | 191 (100.0%) | 0 (0.0%) |
| Construction | 47 (100.0%) | 0 (0.0%) |
| Manufacturing | 13 (100.0%) | 0 (0.0%) |
| Wholesale Trade | 0 (0.0%) | 0 (0.0%) |
| Retail Trade | 11 (22.0%) | 39 (78.0%) |
| Transportation & Warehousing | 29 (100.0%) | 0 (0.0%) |
| Utilities | 33 (100.0%) | 0 (0.0%) |
| Information | 0 (0.0%) | 0 (0.0%) |
| Finance & Insurance | 0 (0.0%) | 0 (0.0%) |
| Real Estate, Rental & Leasing | 0 (0.0%) | 0 (0.0%) |
| Professional & Scientific | 0 (0.0%) | 30 (100.0%) |
| Enterprise Management | 0 (0.0%) | 0 (0.0%) |
| Administrative & Support | 0 (0.0%) | 0 (0.0%) |
| Educational Services | 0 (0.0%) | 85 (100.0%) |
| Health Care & Social Assistance | 0 (0.0%) | 9 (100.0%) |
| Arts, Entertainment & Recreation | 0 (0.0%) | 0 (0.0%) |
| Accommodation & Food Services | 0 (0.0%) | 7 (100.0%) |
| Public Administration | 0 (0.0%) | 1 (100.0%) |
| Total | 371 (64.1%) | 208 (35.9%) |
Education in Eureka County
School Enrollment in Eureka County
The most common levels of schooling among the 385 students in Eureka County are elementary school (124 | 32.2%), middle school (91 | 23.6%), and high school (85 | 22.1%).
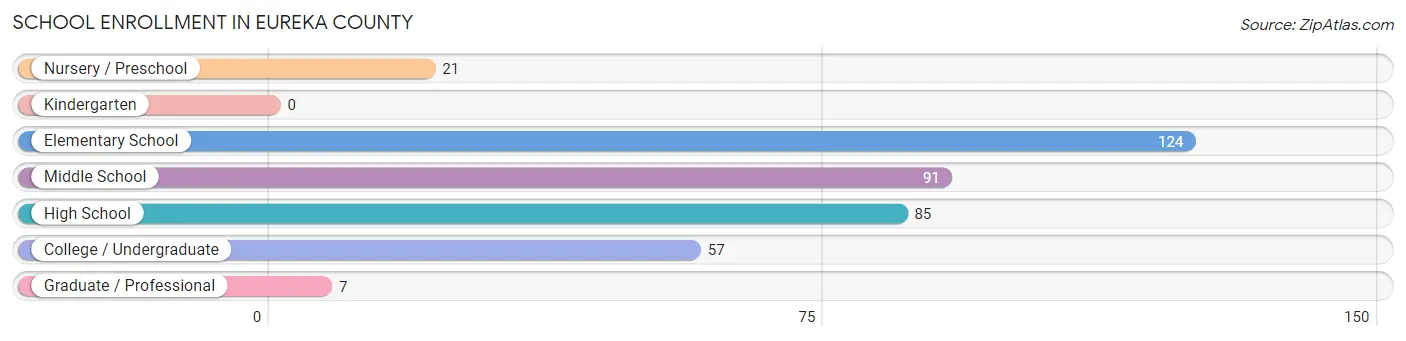
| School Level | # Students | % Students |
| Nursery / Preschool | 21 | 5.4% |
| Kindergarten | 0 | 0.0% |
| Elementary School | 124 | 32.2% |
| Middle School | 91 | 23.6% |
| High School | 85 | 22.1% |
| College / Undergraduate | 57 | 14.8% |
| Graduate / Professional | 7 | 1.8% |
| Total | 385 | 100.0% |
School Enrollment by Age by Funding Source in Eureka County
Out of a total of 385 students who are enrolled in schools in Eureka County, 36 (9.4%) attend a private institution, while the remaining 349 (90.6%) are enrolled in public schools. The age group of 35 years and over has the highest likelihood of being enrolled in private schools, with 36 (58.1% in the age bracket) enrolled. Conversely, the age group of 5 to 9 year old has the lowest likelihood of being enrolled in a private school, with 108 (100.0% in the age bracket) attending a public institution.
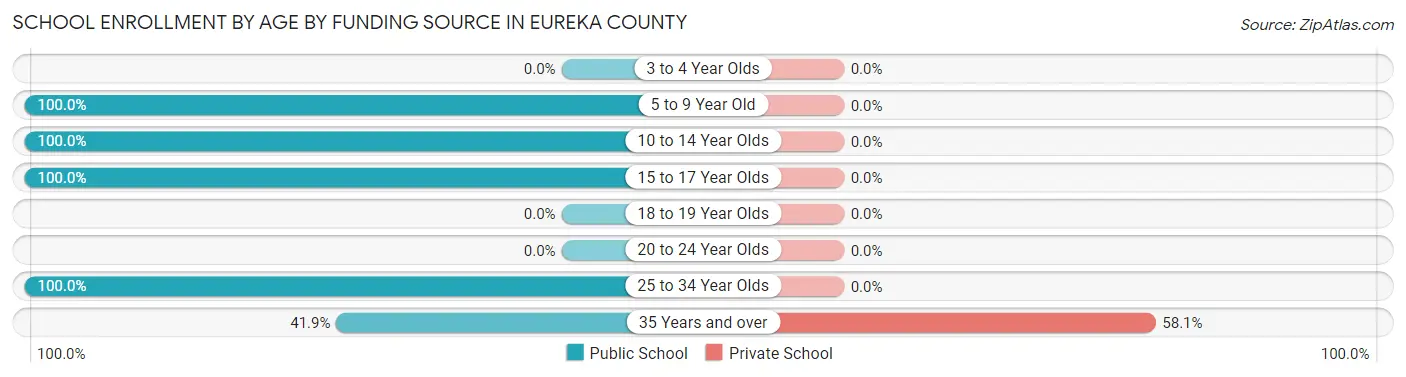
| Age Bracket | Public School | Private School |
| 3 to 4 Year Olds | 0 (0.0%) | 0 (0.0%) |
| 5 to 9 Year Old | 108 (100.0%) | 0 (0.0%) |
| 10 to 14 Year Olds | 153 (100.0%) | 0 (0.0%) |
| 15 to 17 Year Olds | 55 (100.0%) | 0 (0.0%) |
| 18 to 19 Year Olds | 0 (0.0%) | 0 (0.0%) |
| 20 to 24 Year Olds | 0 (0.0%) | 0 (0.0%) |
| 25 to 34 Year Olds | 7 (100.0%) | 0 (0.0%) |
| 35 Years and over | 26 (41.9%) | 36 (58.1%) |
| Total | 349 (90.6%) | 36 (9.4%) |
Educational Attainment by Field of Study in Eureka County
Education (47 | 27.8%), social sciences (32 | 18.9%), engineering (28 | 16.6%), bio, nature & agricultural (26 | 15.4%), and arts & humanities (21 | 12.4%) are the most common fields of study among 169 individuals in Eureka County who have obtained a bachelor's degree or higher.
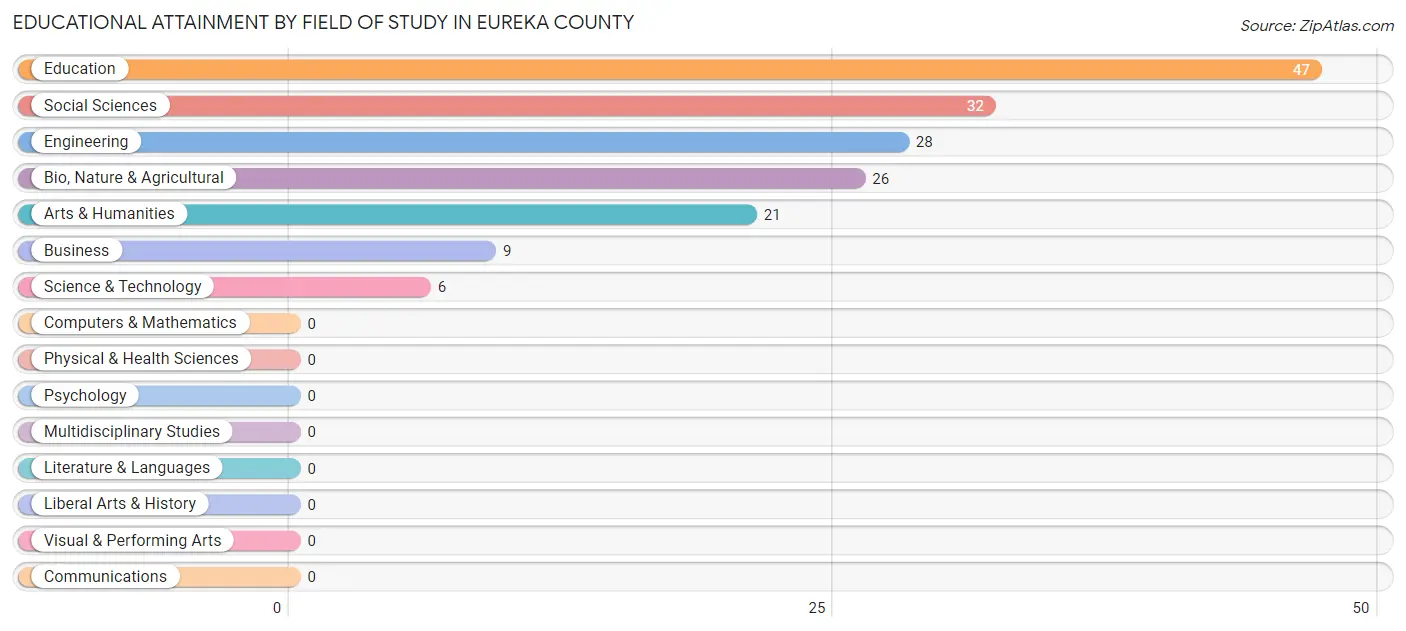
| Field of Study | # Graduates | % Graduates |
| Computers & Mathematics | 0 | 0.0% |
| Bio, Nature & Agricultural | 26 | 15.4% |
| Physical & Health Sciences | 0 | 0.0% |
| Psychology | 0 | 0.0% |
| Social Sciences | 32 | 18.9% |
| Engineering | 28 | 16.6% |
| Multidisciplinary Studies | 0 | 0.0% |
| Science & Technology | 6 | 3.5% |
| Business | 9 | 5.3% |
| Education | 47 | 27.8% |
| Literature & Languages | 0 | 0.0% |
| Liberal Arts & History | 0 | 0.0% |
| Visual & Performing Arts | 0 | 0.0% |
| Communications | 0 | 0.0% |
| Arts & Humanities | 21 | 12.4% |
| Total | 169 | 100.0% |
Transportation & Commute in Eureka County
Vehicle Availability by Sex in Eureka County
The most prevalent vehicle ownership categories in Eureka County are males with 3 vehicles (154, accounting for 41.5%) and females with 3 vehicles (82, making up 74.0%).
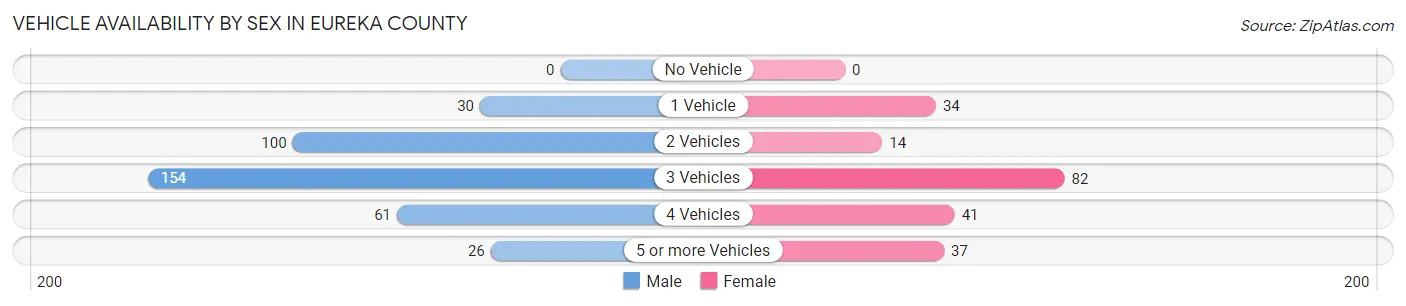
| Vehicles Available | Male | Female |
| No Vehicle | 0 (0.0%) | 0 (0.0%) |
| 1 Vehicle | 30 (8.1%) | 34 (16.4%) |
| 2 Vehicles | 100 (27.0%) | 14 (6.7%) |
| 3 Vehicles | 154 (41.5%) | 82 (39.4%) |
| 4 Vehicles | 61 (16.4%) | 41 (19.7%) |
| 5 or more Vehicles | 26 (7.0%) | 37 (17.8%) |
| Total | 371 (100.0%) | 208 (100.0%) |
Commute Time in Eureka County
The most frequently occuring commute durations in Eureka County are 5 to 9 minutes (111 commuters, 21.5%), 30 to 34 minutes (70 commuters, 13.5%), and 45 to 59 minutes (70 commuters, 13.5%).
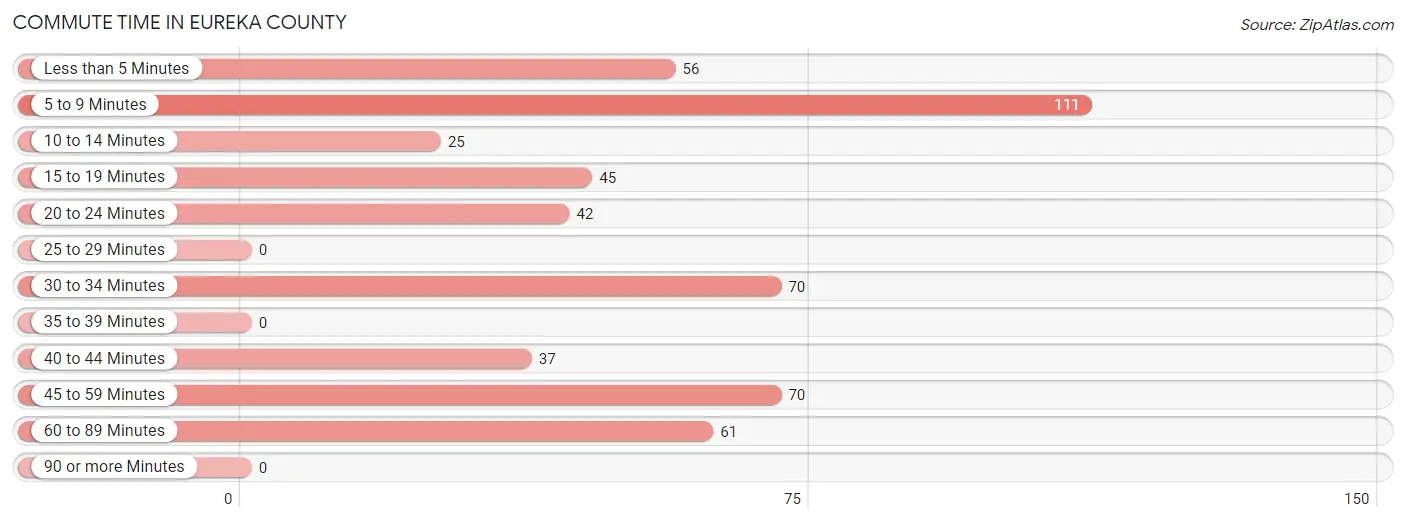
| Commute Time | # Commuters | % Commuters |
| Less than 5 Minutes | 56 | 10.8% |
| 5 to 9 Minutes | 111 | 21.5% |
| 10 to 14 Minutes | 25 | 4.8% |
| 15 to 19 Minutes | 45 | 8.7% |
| 20 to 24 Minutes | 42 | 8.1% |
| 25 to 29 Minutes | 0 | 0.0% |
| 30 to 34 Minutes | 70 | 13.5% |
| 35 to 39 Minutes | 0 | 0.0% |
| 40 to 44 Minutes | 37 | 7.2% |
| 45 to 59 Minutes | 70 | 13.5% |
| 60 to 89 Minutes | 61 | 11.8% |
| 90 or more Minutes | 0 | 0.0% |
Commute Time by Sex in Eureka County
The most common commute times in Eureka County are 5 to 9 minutes (79 commuters, 21.3%) for males and less than 5 minutes (35 commuters, 24.0%) for females.
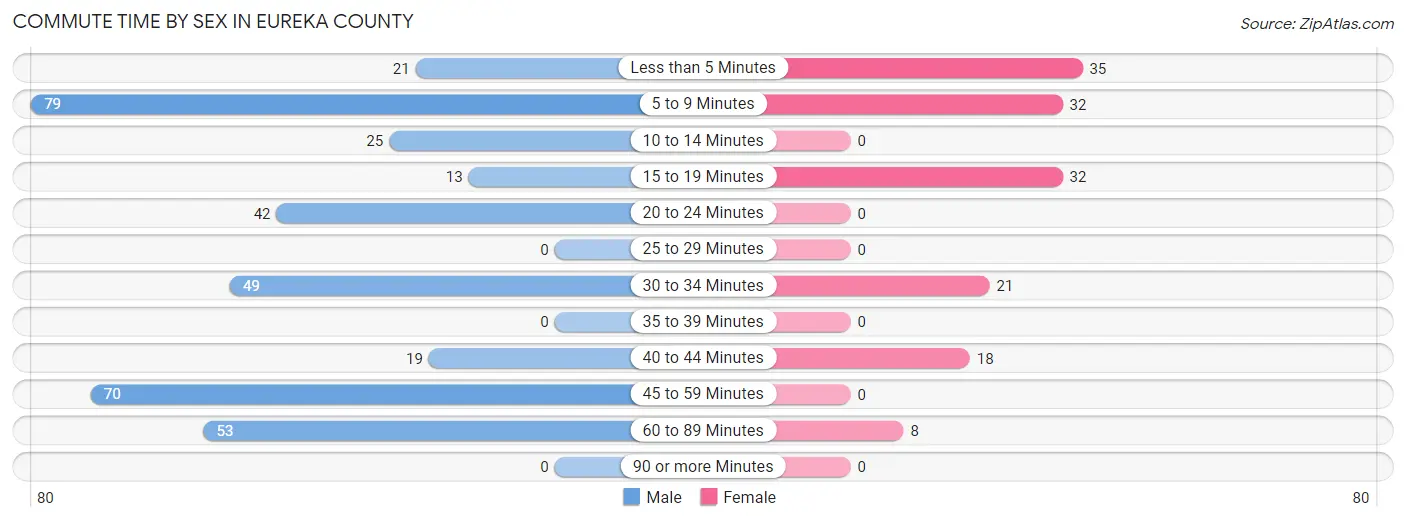
| Commute Time | Male | Female |
| Less than 5 Minutes | 21 (5.7%) | 35 (24.0%) |
| 5 to 9 Minutes | 79 (21.3%) | 32 (21.9%) |
| 10 to 14 Minutes | 25 (6.7%) | 0 (0.0%) |
| 15 to 19 Minutes | 13 (3.5%) | 32 (21.9%) |
| 20 to 24 Minutes | 42 (11.3%) | 0 (0.0%) |
| 25 to 29 Minutes | 0 (0.0%) | 0 (0.0%) |
| 30 to 34 Minutes | 49 (13.2%) | 21 (14.4%) |
| 35 to 39 Minutes | 0 (0.0%) | 0 (0.0%) |
| 40 to 44 Minutes | 19 (5.1%) | 18 (12.3%) |
| 45 to 59 Minutes | 70 (18.9%) | 0 (0.0%) |
| 60 to 89 Minutes | 53 (14.3%) | 8 (5.5%) |
| 90 or more Minutes | 0 (0.0%) | 0 (0.0%) |
Time of Departure to Work by Sex in Eureka County
The most frequent times of departure to work in Eureka County are 12:00 AM to 4:59 AM (108, 29.1%) for males and 7:00 AM to 7:29 AM (57, 39.0%) for females.
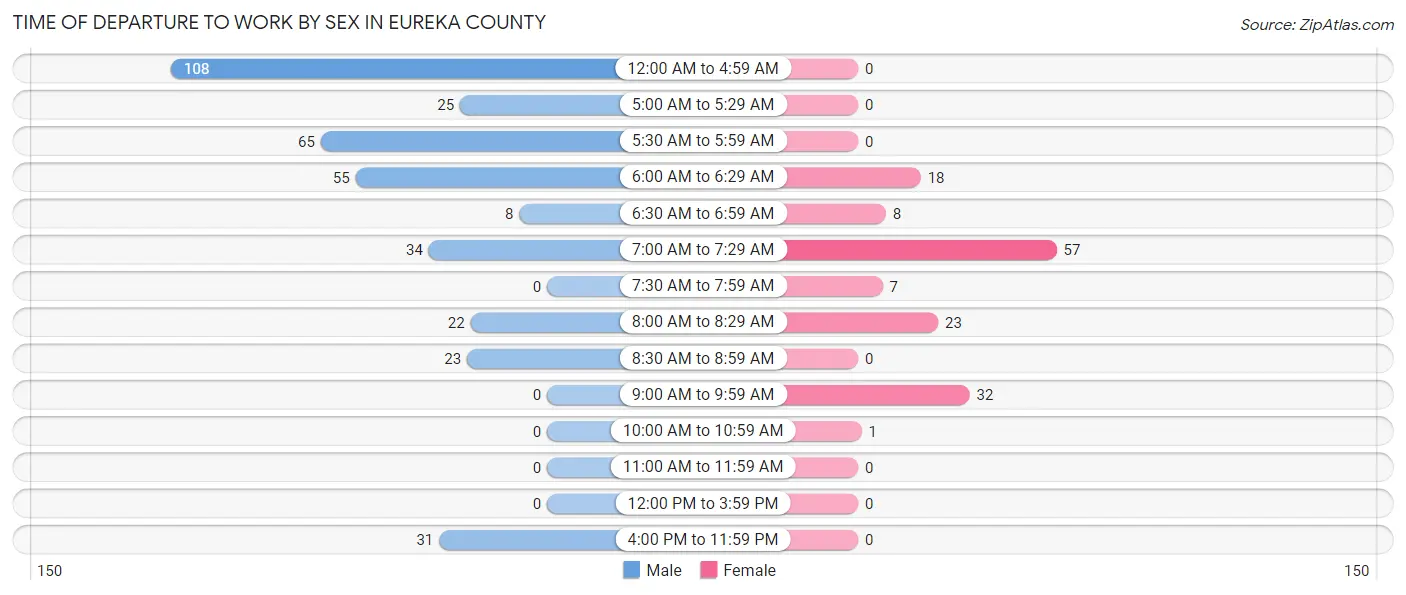
| Time of Departure | Male | Female |
| 12:00 AM to 4:59 AM | 108 (29.1%) | 0 (0.0%) |
| 5:00 AM to 5:29 AM | 25 (6.7%) | 0 (0.0%) |
| 5:30 AM to 5:59 AM | 65 (17.5%) | 0 (0.0%) |
| 6:00 AM to 6:29 AM | 55 (14.8%) | 18 (12.3%) |
| 6:30 AM to 6:59 AM | 8 (2.2%) | 8 (5.5%) |
| 7:00 AM to 7:29 AM | 34 (9.2%) | 57 (39.0%) |
| 7:30 AM to 7:59 AM | 0 (0.0%) | 7 (4.8%) |
| 8:00 AM to 8:29 AM | 22 (5.9%) | 23 (15.8%) |
| 8:30 AM to 8:59 AM | 23 (6.2%) | 0 (0.0%) |
| 9:00 AM to 9:59 AM | 0 (0.0%) | 32 (21.9%) |
| 10:00 AM to 10:59 AM | 0 (0.0%) | 1 (0.7%) |
| 11:00 AM to 11:59 AM | 0 (0.0%) | 0 (0.0%) |
| 12:00 PM to 3:59 PM | 0 (0.0%) | 0 (0.0%) |
| 4:00 PM to 11:59 PM | 31 (8.4%) | 0 (0.0%) |
| Total | 371 (100.0%) | 146 (100.0%) |
Housing Occupancy in Eureka County
Occupancy by Ownership in Eureka County
Of the total 570 dwellings in Eureka County, owner-occupied units account for 433 (76.0%), while renter-occupied units make up 137 (24.0%).
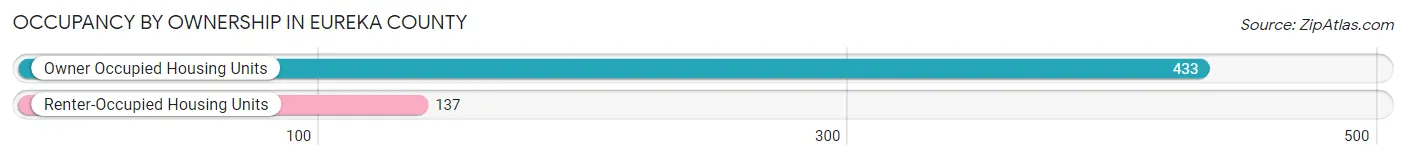
| Occupancy | # Housing Units | % Housing Units |
| Owner Occupied Housing Units | 433 | 76.0% |
| Renter-Occupied Housing Units | 137 | 24.0% |
| Total Occupied Housing Units | 570 | 100.0% |
Occupancy by Household Size in Eureka County
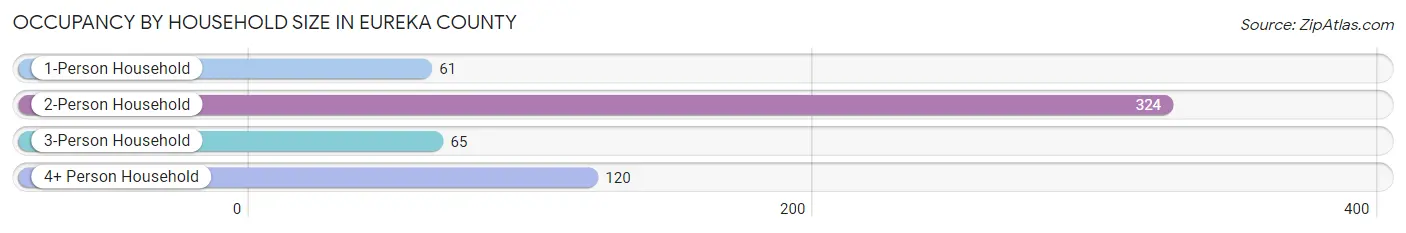
| Household Size | # Housing Units | % Housing Units |
| 1-Person Household | 61 | 10.7% |
| 2-Person Household | 324 | 56.8% |
| 3-Person Household | 65 | 11.4% |
| 4+ Person Household | 120 | 21.0% |
| Total Housing Units | 570 | 100.0% |
Occupancy by Ownership by Household Size in Eureka County
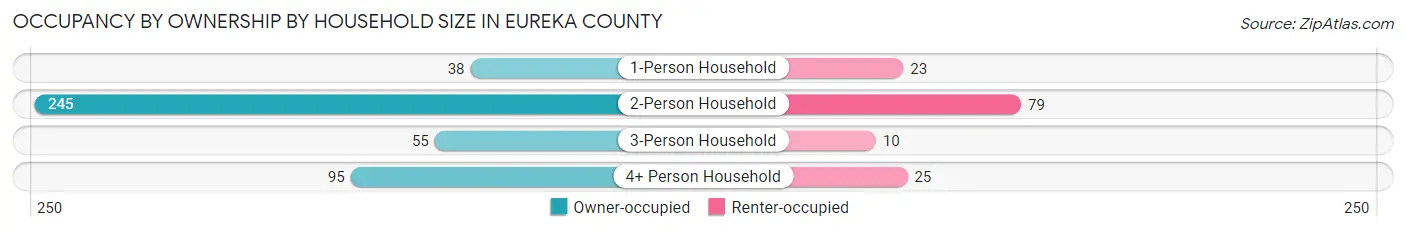
| Household Size | Owner-occupied | Renter-occupied |
| 1-Person Household | 38 (62.3%) | 23 (37.7%) |
| 2-Person Household | 245 (75.6%) | 79 (24.4%) |
| 3-Person Household | 55 (84.6%) | 10 (15.4%) |
| 4+ Person Household | 95 (79.2%) | 25 (20.8%) |
| Total Housing Units | 433 (76.0%) | 137 (24.0%) |
Occupancy by Educational Attainment in Eureka County
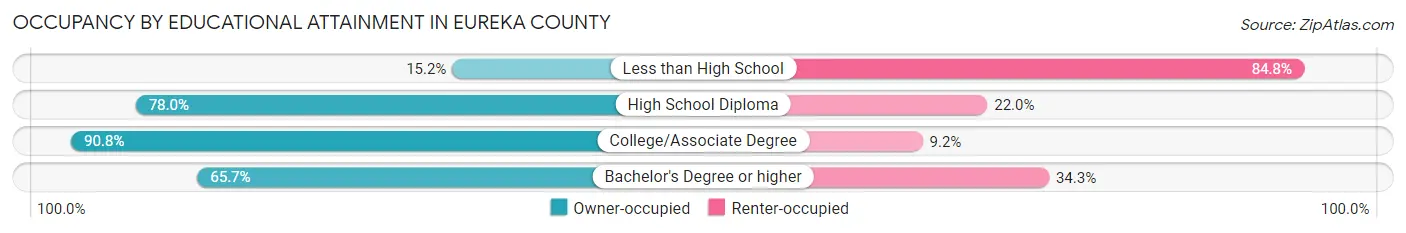
| Household Size | Owner-occupied | Renter-occupied |
| Less than High School | 7 (15.2%) | 39 (84.8%) |
| High School Diploma | 138 (78.0%) | 39 (22.0%) |
| College/Associate Degree | 217 (90.8%) | 22 (9.2%) |
| Bachelor's Degree or higher | 71 (65.7%) | 37 (34.3%) |
Occupancy by Age of Householder in Eureka County
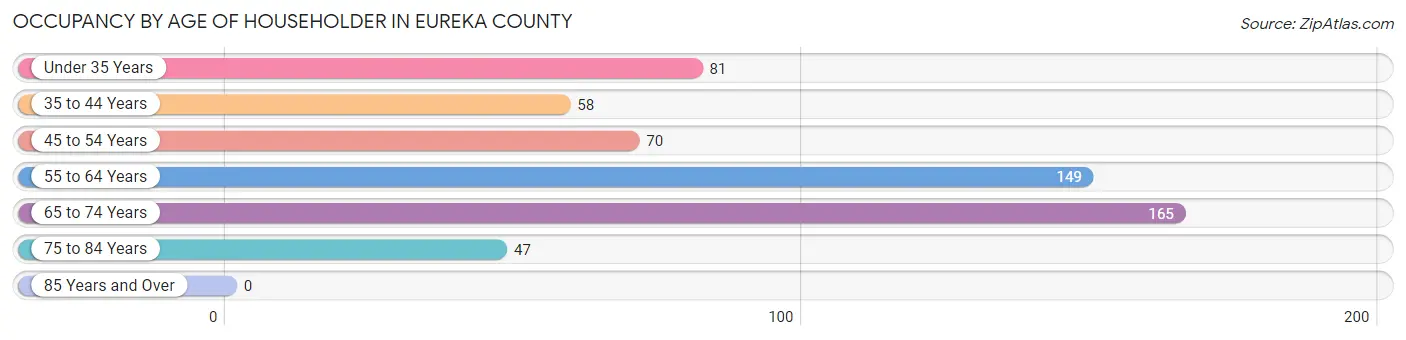
| Age Bracket | # Households | % Households |
| Under 35 Years | 81 | 14.2% |
| 35 to 44 Years | 58 | 10.2% |
| 45 to 54 Years | 70 | 12.3% |
| 55 to 64 Years | 149 | 26.1% |
| 65 to 74 Years | 165 | 28.9% |
| 75 to 84 Years | 47 | 8.3% |
| 85 Years and Over | 0 | 0.0% |
| Total | 570 | 100.0% |
Housing Finances in Eureka County
Median Income by Occupancy in Eureka County
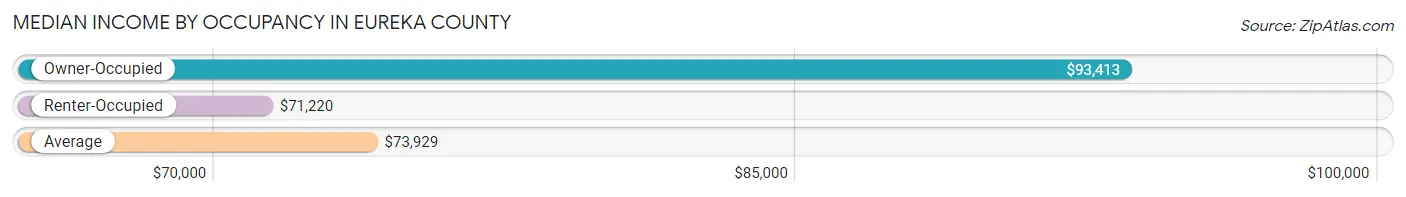
| Occupancy Type | # Households | Median Income |
| Owner-Occupied | 433 (76.0%) | $93,413 |
| Renter-Occupied | 137 (24.0%) | $71,220 |
| Average | 570 (100.0%) | $73,929 |
Occupancy by Householder Income Bracket in Eureka County
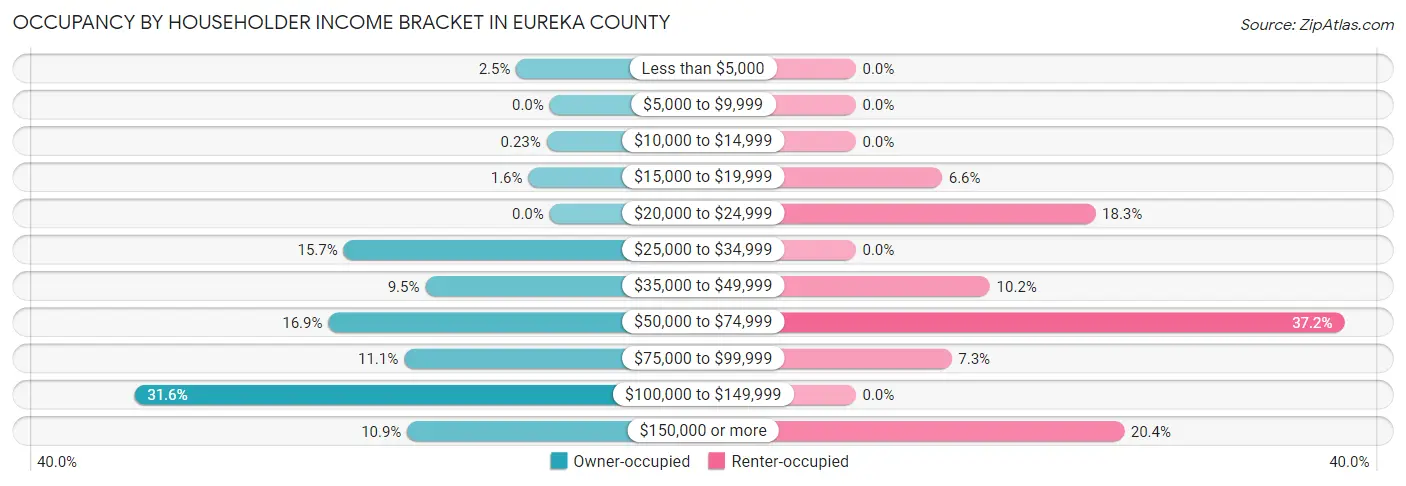
| Income Bracket | Owner-occupied | Renter-occupied |
| Less than $5,000 | 11 (2.5%) | 0 (0.0%) |
| $5,000 to $9,999 | 0 (0.0%) | 0 (0.0%) |
| $10,000 to $14,999 | 1 (0.2%) | 0 (0.0%) |
| $15,000 to $19,999 | 7 (1.6%) | 9 (6.6%) |
| $20,000 to $24,999 | 0 (0.0%) | 25 (18.2%) |
| $25,000 to $34,999 | 68 (15.7%) | 0 (0.0%) |
| $35,000 to $49,999 | 41 (9.5%) | 14 (10.2%) |
| $50,000 to $74,999 | 73 (16.9%) | 51 (37.2%) |
| $75,000 to $99,999 | 48 (11.1%) | 10 (7.3%) |
| $100,000 to $149,999 | 137 (31.6%) | 0 (0.0%) |
| $150,000 or more | 47 (10.8%) | 28 (20.4%) |
| Total | 433 (100.0%) | 137 (100.0%) |
Monthly Housing Cost Tiers in Eureka County
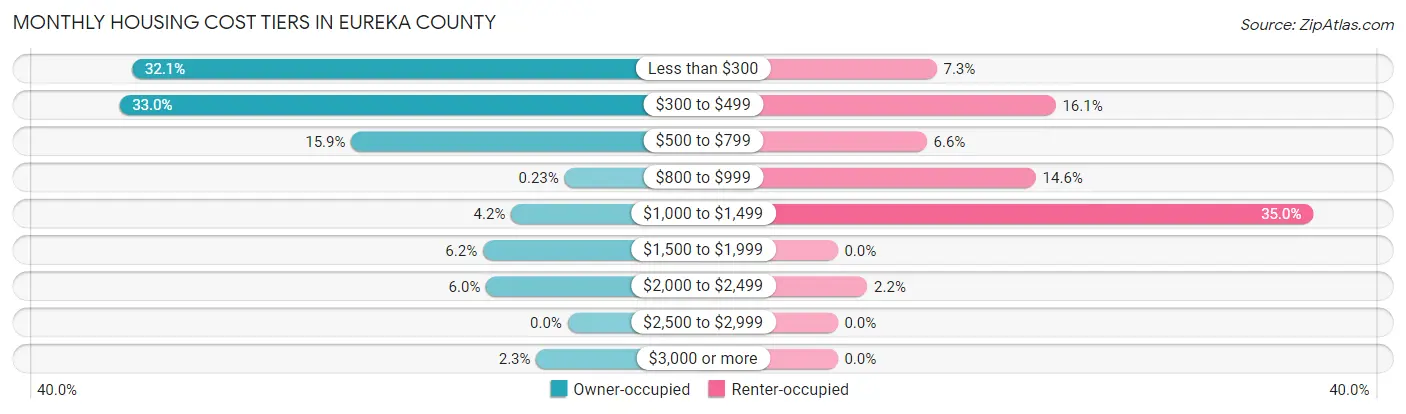
| Monthly Cost | Owner-occupied | Renter-occupied |
| Less than $300 | 139 (32.1%) | 10 (7.3%) |
| $300 to $499 | 143 (33.0%) | 22 (16.1%) |
| $500 to $799 | 69 (15.9%) | 9 (6.6%) |
| $800 to $999 | 1 (0.2%) | 20 (14.6%) |
| $1,000 to $1,499 | 18 (4.2%) | 48 (35.0%) |
| $1,500 to $1,999 | 27 (6.2%) | 0 (0.0%) |
| $2,000 to $2,499 | 26 (6.0%) | 3 (2.2%) |
| $2,500 to $2,999 | 0 (0.0%) | 0 (0.0%) |
| $3,000 or more | 10 (2.3%) | 0 (0.0%) |
| Total | 433 (100.0%) | 137 (100.0%) |
Physical Housing Characteristics in Eureka County
Housing Structures in Eureka County
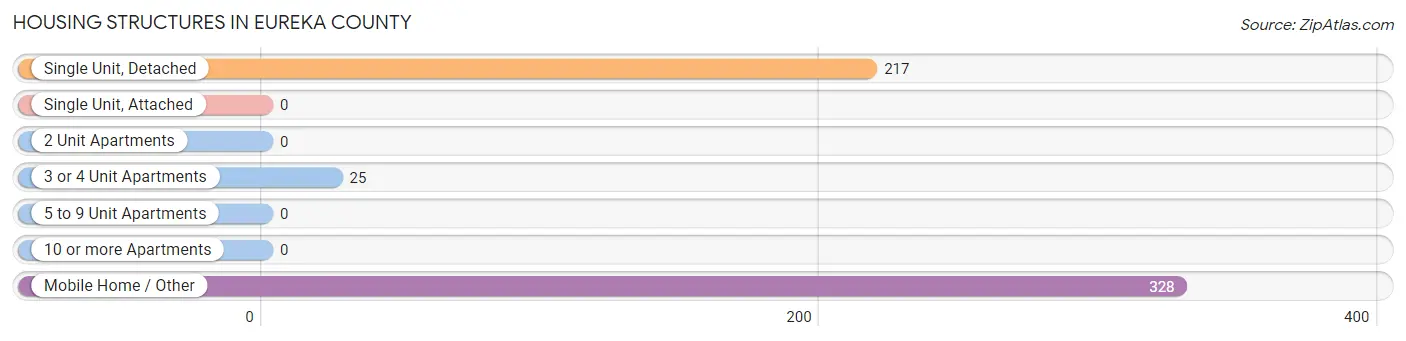
| Structure Type | # Housing Units | % Housing Units |
| Single Unit, Detached | 217 | 38.1% |
| Single Unit, Attached | 0 | 0.0% |
| 2 Unit Apartments | 0 | 0.0% |
| 3 or 4 Unit Apartments | 25 | 4.4% |
| 5 to 9 Unit Apartments | 0 | 0.0% |
| 10 or more Apartments | 0 | 0.0% |
| Mobile Home / Other | 328 | 57.5% |
| Total | 570 | 100.0% |
Housing Structures by Occupancy in Eureka County
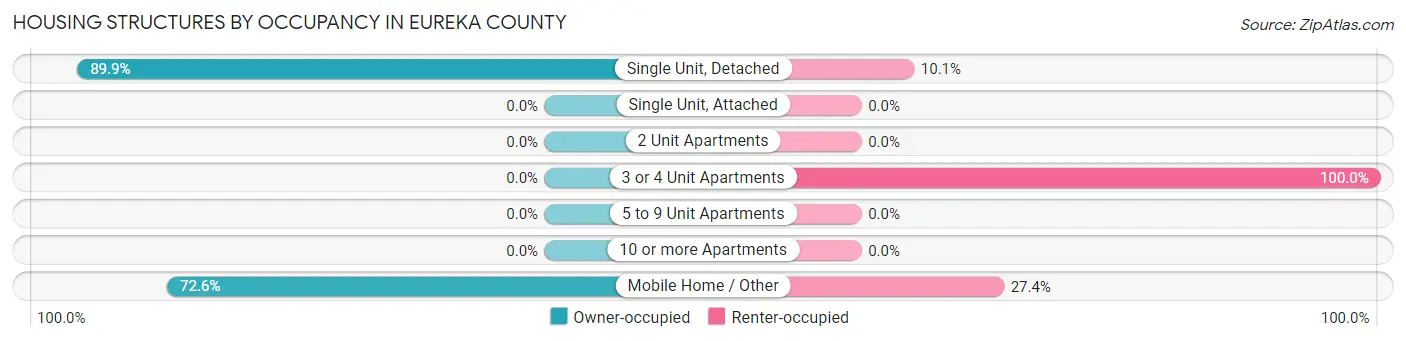
| Structure Type | Owner-occupied | Renter-occupied |
| Single Unit, Detached | 195 (89.9%) | 22 (10.1%) |
| Single Unit, Attached | 0 (0.0%) | 0 (0.0%) |
| 2 Unit Apartments | 0 (0.0%) | 0 (0.0%) |
| 3 or 4 Unit Apartments | 0 (0.0%) | 25 (100.0%) |
| 5 to 9 Unit Apartments | 0 (0.0%) | 0 (0.0%) |
| 10 or more Apartments | 0 (0.0%) | 0 (0.0%) |
| Mobile Home / Other | 238 (72.6%) | 90 (27.4%) |
| Total | 433 (76.0%) | 137 (24.0%) |
Housing Structures by Number of Rooms in Eureka County
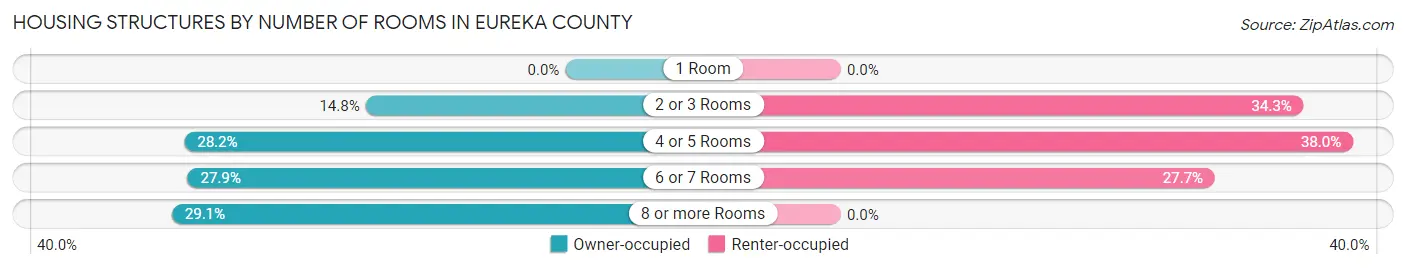
| Number of Rooms | Owner-occupied | Renter-occupied |
| 1 Room | 0 (0.0%) | 0 (0.0%) |
| 2 or 3 Rooms | 64 (14.8%) | 47 (34.3%) |
| 4 or 5 Rooms | 122 (28.2%) | 52 (38.0%) |
| 6 or 7 Rooms | 121 (27.9%) | 38 (27.7%) |
| 8 or more Rooms | 126 (29.1%) | 0 (0.0%) |
| Total | 433 (100.0%) | 137 (100.0%) |
Housing Structure by Heating Type in Eureka County
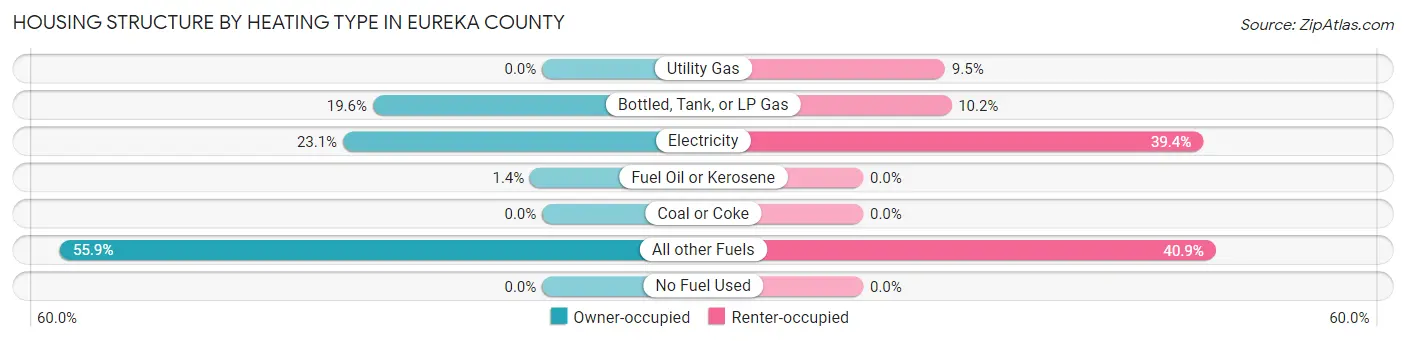
| Heating Type | Owner-occupied | Renter-occupied |
| Utility Gas | 0 (0.0%) | 13 (9.5%) |
| Bottled, Tank, or LP Gas | 85 (19.6%) | 14 (10.2%) |
| Electricity | 100 (23.1%) | 54 (39.4%) |
| Fuel Oil or Kerosene | 6 (1.4%) | 0 (0.0%) |
| Coal or Coke | 0 (0.0%) | 0 (0.0%) |
| All other Fuels | 242 (55.9%) | 56 (40.9%) |
| No Fuel Used | 0 (0.0%) | 0 (0.0%) |
| Total | 433 (100.0%) | 137 (100.0%) |
Household Vehicle Usage in Eureka County
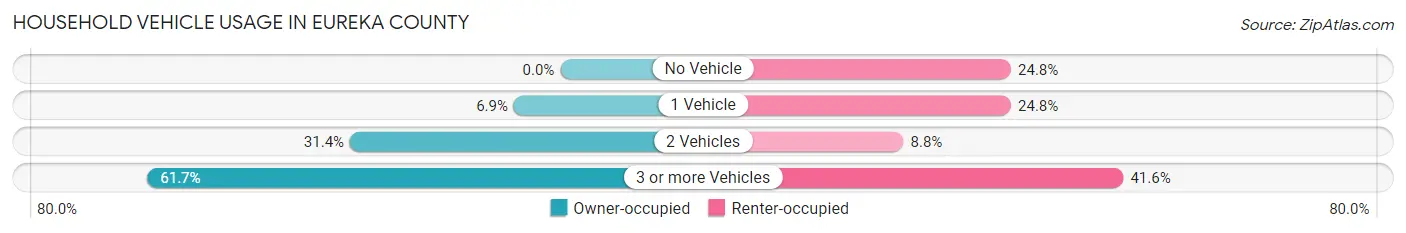
| Vehicles per Household | Owner-occupied | Renter-occupied |
| No Vehicle | 0 (0.0%) | 34 (24.8%) |
| 1 Vehicle | 30 (6.9%) | 34 (24.8%) |
| 2 Vehicles | 136 (31.4%) | 12 (8.8%) |
| 3 or more Vehicles | 267 (61.7%) | 57 (41.6%) |
| Total | 433 (100.0%) | 137 (100.0%) |
Real Estate & Mortgages in Eureka County
Real Estate and Mortgage Overview in Eureka County
| Characteristic | Without Mortgage | With Mortgage |
| Housing Units | 363 | 70 |
| Median Property Value | $145,100 | $509,600 |
| Median Household Income | $89,792 | $16 |
| Monthly Housing Costs | $343 | $10 |
| Real Estate Taxes | $433 | $0 |
Property Value by Mortgage Status in Eureka County
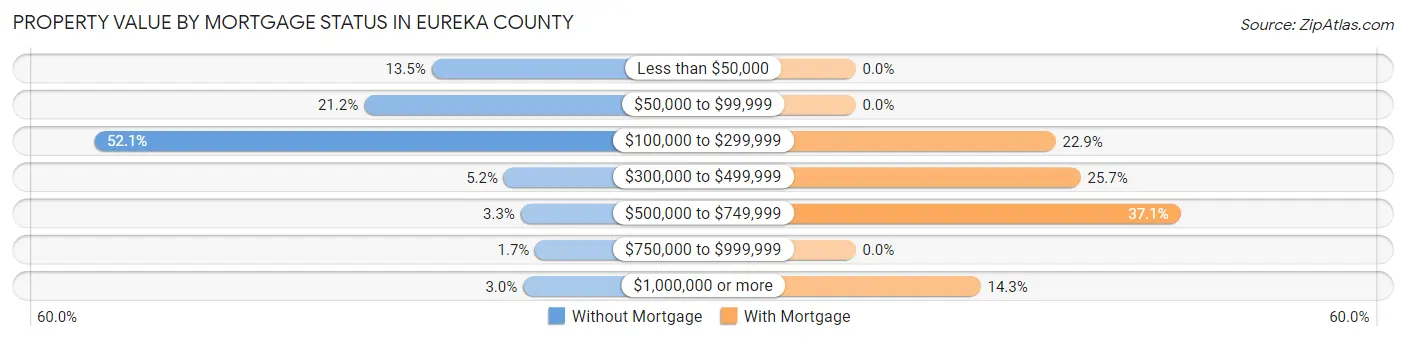
| Property Value | Without Mortgage | With Mortgage |
| Less than $50,000 | 49 (13.5%) | 0 (0.0%) |
| $50,000 to $99,999 | 77 (21.2%) | 0 (0.0%) |
| $100,000 to $299,999 | 189 (52.1%) | 16 (22.9%) |
| $300,000 to $499,999 | 19 (5.2%) | 18 (25.7%) |
| $500,000 to $749,999 | 12 (3.3%) | 26 (37.1%) |
| $750,000 to $999,999 | 6 (1.7%) | 0 (0.0%) |
| $1,000,000 or more | 11 (3.0%) | 10 (14.3%) |
| Total | 363 (100.0%) | 70 (100.0%) |
Household Income by Mortgage Status in Eureka County
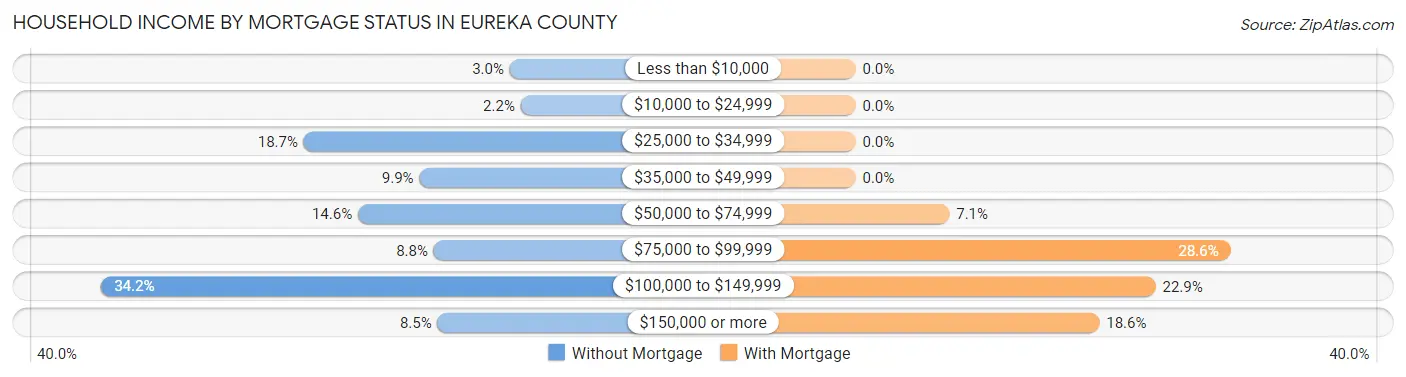
| Household Income | Without Mortgage | With Mortgage |
| Less than $10,000 | 11 (3.0%) | 0 (0.0%) |
| $10,000 to $24,999 | 8 (2.2%) | 0 (0.0%) |
| $25,000 to $34,999 | 68 (18.7%) | 0 (0.0%) |
| $35,000 to $49,999 | 36 (9.9%) | 0 (0.0%) |
| $50,000 to $74,999 | 53 (14.6%) | 5 (7.1%) |
| $75,000 to $99,999 | 32 (8.8%) | 20 (28.6%) |
| $100,000 to $149,999 | 124 (34.2%) | 16 (22.9%) |
| $150,000 or more | 31 (8.5%) | 13 (18.6%) |
| Total | 363 (100.0%) | 70 (100.0%) |
Property Value to Household Income Ratio in Eureka County
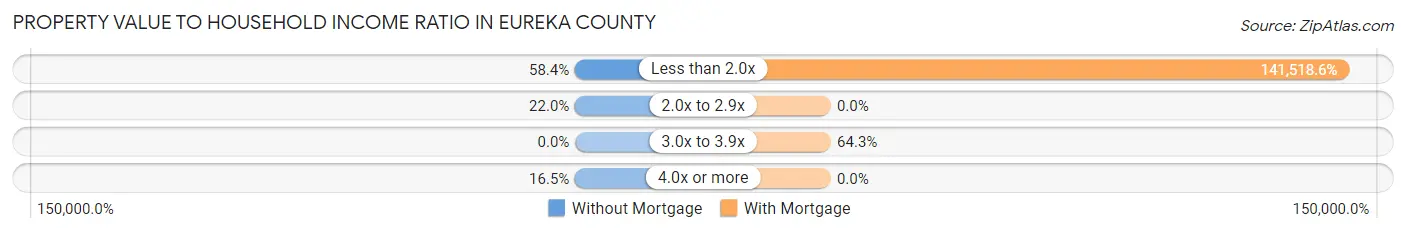
| Value-to-Income Ratio | Without Mortgage | With Mortgage |
| Less than 2.0x | 212 (58.4%) | 99,063 (141,518.6%) |
| 2.0x to 2.9x | 80 (22.0%) | 0 (0.0%) |
| 3.0x to 3.9x | 0 (0.0%) | 45 (64.3%) |
| 4.0x or more | 60 (16.5%) | 0 (0.0%) |
| Total | 363 (100.0%) | 70 (100.0%) |
Real Estate Taxes by Mortgage Status in Eureka County
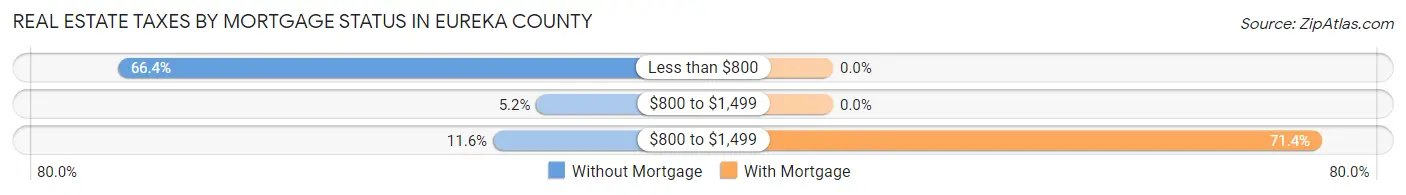
| Property Taxes | Without Mortgage | With Mortgage |
| Less than $800 | 241 (66.4%) | 0 (0.0%) |
| $800 to $1,499 | 19 (5.2%) | 0 (0.0%) |
| $800 to $1,499 | 42 (11.6%) | 50 (71.4%) |
| Total | 363 (100.0%) | 70 (100.0%) |
Health & Disability in Eureka County
Health Insurance Coverage by Age in Eureka County
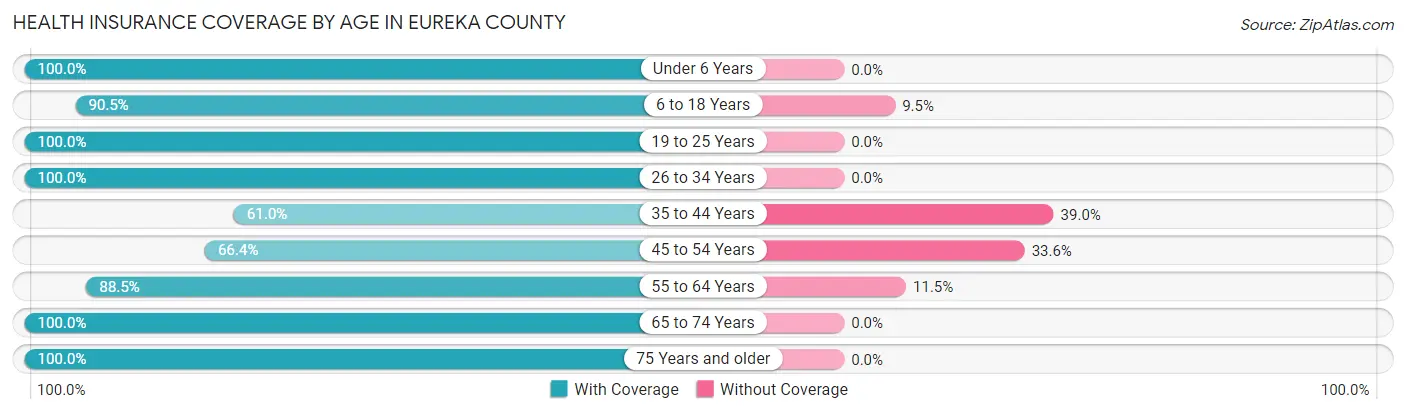
| Age Bracket | With Coverage | Without Coverage |
| Under 6 Years | 127 (100.0%) | 0 (0.0%) |
| 6 to 18 Years | 267 (90.5%) | 28 (9.5%) |
| 19 to 25 Years | 96 (100.0%) | 0 (0.0%) |
| 26 to 34 Years | 92 (100.0%) | 0 (0.0%) |
| 35 to 44 Years | 89 (61.0%) | 57 (39.0%) |
| 45 to 54 Years | 71 (66.4%) | 36 (33.6%) |
| 55 to 64 Years | 307 (88.5%) | 40 (11.5%) |
| 65 to 74 Years | 278 (100.0%) | 0 (0.0%) |
| 75 Years and older | 128 (100.0%) | 0 (0.0%) |
| Total | 1,455 (90.0%) | 161 (10.0%) |
Health Insurance Coverage by Citizenship Status in Eureka County
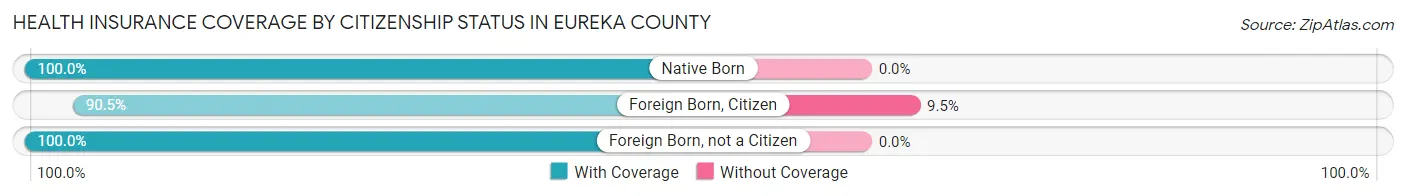
| Citizenship Status | With Coverage | Without Coverage |
| Native Born | 127 (100.0%) | 0 (0.0%) |
| Foreign Born, Citizen | 267 (90.5%) | 28 (9.5%) |
| Foreign Born, not a Citizen | 96 (100.0%) | 0 (0.0%) |
Health Insurance Coverage by Household Income in Eureka County
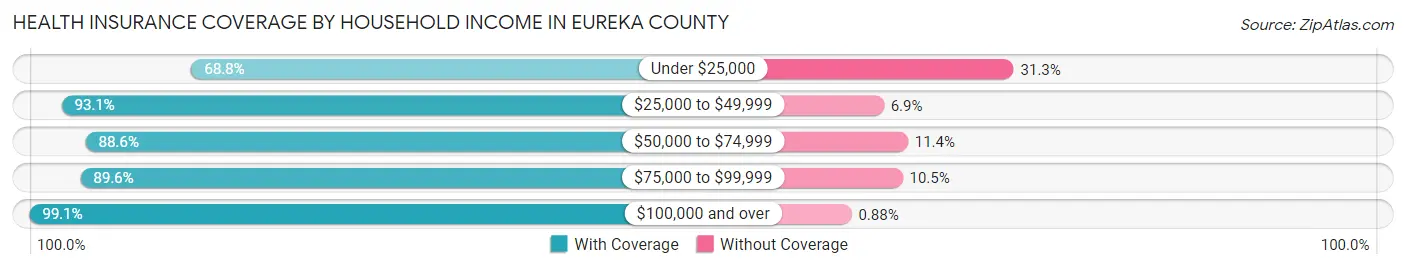
| Household Income | With Coverage | Without Coverage |
| Under $25,000 | 176 (68.8%) | 80 (31.2%) |
| $25,000 to $49,999 | 256 (93.1%) | 19 (6.9%) |
| $50,000 to $74,999 | 279 (88.6%) | 36 (11.4%) |
| $75,000 to $99,999 | 180 (89.5%) | 21 (10.4%) |
| $100,000 and over | 564 (99.1%) | 5 (0.9%) |
Public vs Private Health Insurance Coverage by Age in Eureka County
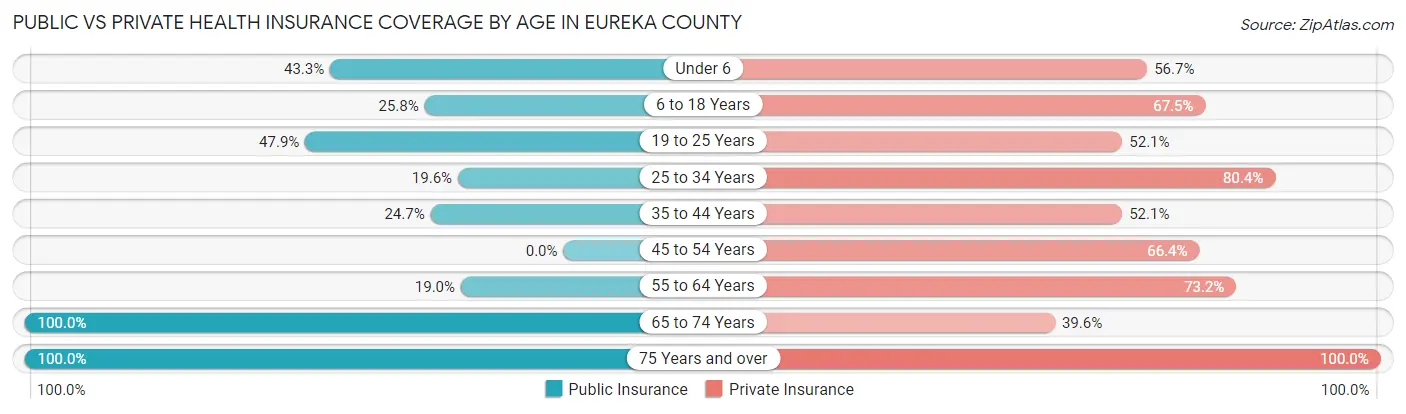
| Age Bracket | Public Insurance | Private Insurance |
| Under 6 | 55 (43.3%) | 72 (56.7%) |
| 6 to 18 Years | 76 (25.8%) | 199 (67.5%) |
| 19 to 25 Years | 46 (47.9%) | 50 (52.1%) |
| 25 to 34 Years | 18 (19.6%) | 74 (80.4%) |
| 35 to 44 Years | 36 (24.7%) | 76 (52.0%) |
| 45 to 54 Years | 0 (0.0%) | 71 (66.4%) |
| 55 to 64 Years | 66 (19.0%) | 254 (73.2%) |
| 65 to 74 Years | 278 (100.0%) | 110 (39.6%) |
| 75 Years and over | 128 (100.0%) | 128 (100.0%) |
| Total | 703 (43.5%) | 1,034 (64.0%) |
Disability Status by Sex by Age in Eureka County
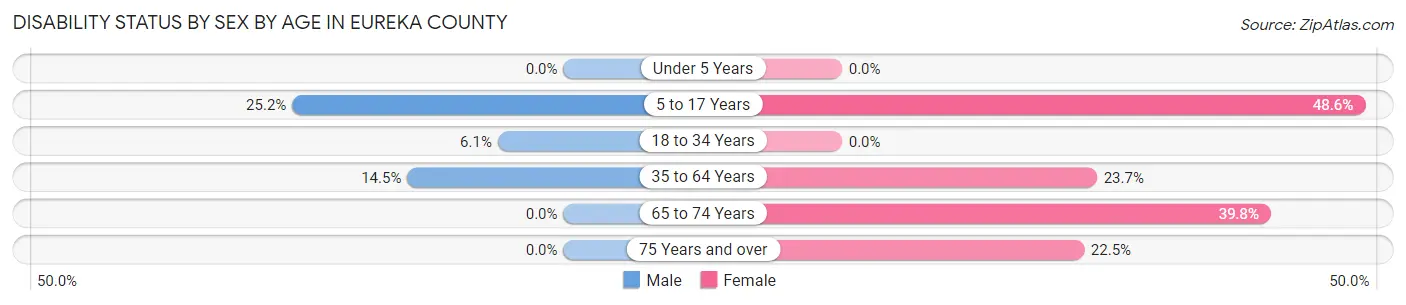
| Age Bracket | Male | Female |
| Under 5 Years | 0 (0.0%) | 0 (0.0%) |
| 5 to 17 Years | 36 (25.2%) | 84 (48.5%) |
| 18 to 34 Years | 7 (6.1%) | 0 (0.0%) |
| 35 to 64 Years | 41 (14.5%) | 75 (23.7%) |
| 65 to 74 Years | 0 (0.0%) | 43 (39.8%) |
| 75 Years and over | 0 (0.0%) | 20 (22.5%) |
Disability Class by Sex by Age in Eureka County
Disability Class: Hearing Difficulty
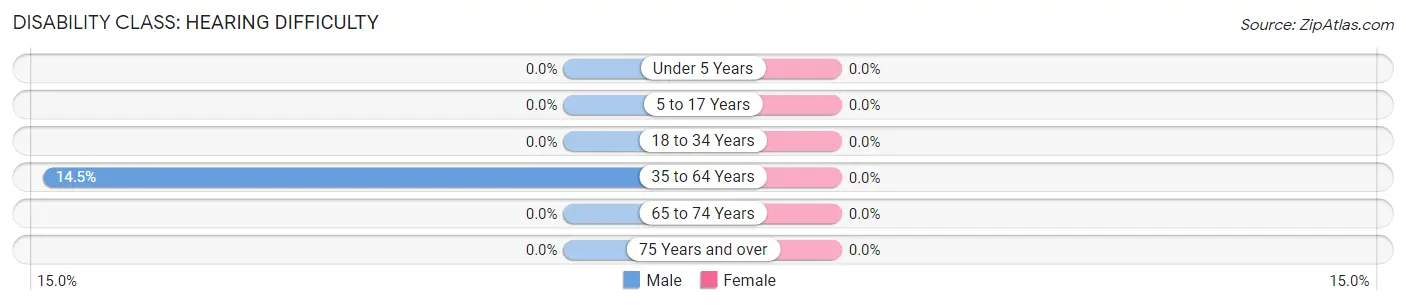
| Age Bracket | Male | Female |
| Under 5 Years | 0 (0.0%) | 0 (0.0%) |
| 5 to 17 Years | 0 (0.0%) | 0 (0.0%) |
| 18 to 34 Years | 0 (0.0%) | 0 (0.0%) |
| 35 to 64 Years | 41 (14.5%) | 0 (0.0%) |
| 65 to 74 Years | 0 (0.0%) | 0 (0.0%) |
| 75 Years and over | 0 (0.0%) | 0 (0.0%) |
Disability Class: Vision Difficulty
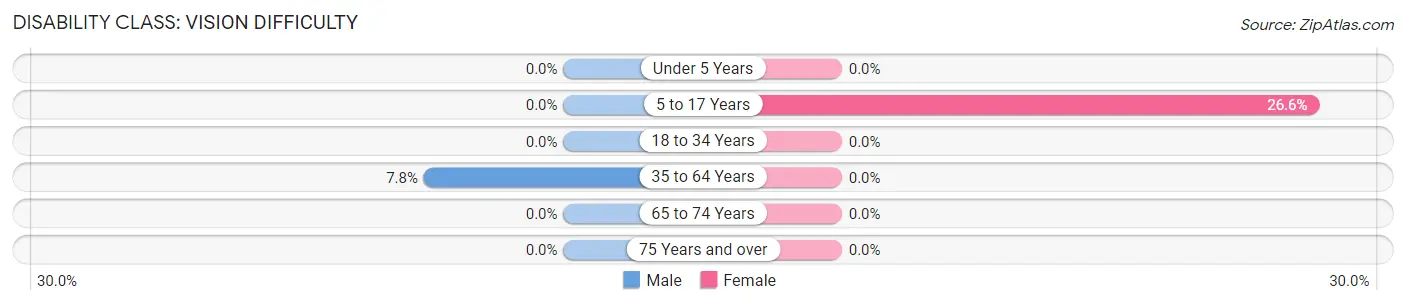
| Age Bracket | Male | Female |
| Under 5 Years | 0 (0.0%) | 0 (0.0%) |
| 5 to 17 Years | 0 (0.0%) | 46 (26.6%) |
| 18 to 34 Years | 0 (0.0%) | 0 (0.0%) |
| 35 to 64 Years | 22 (7.8%) | 0 (0.0%) |
| 65 to 74 Years | 0 (0.0%) | 0 (0.0%) |
| 75 Years and over | 0 (0.0%) | 0 (0.0%) |
Disability Class: Cognitive Difficulty
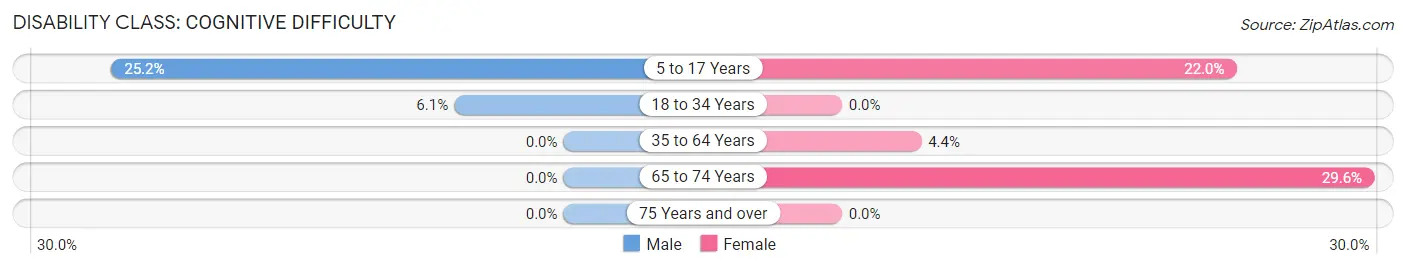
| Age Bracket | Male | Female |
| 5 to 17 Years | 36 (25.2%) | 38 (22.0%) |
| 18 to 34 Years | 7 (6.1%) | 0 (0.0%) |
| 35 to 64 Years | 0 (0.0%) | 14 (4.4%) |
| 65 to 74 Years | 0 (0.0%) | 32 (29.6%) |
| 75 Years and over | 0 (0.0%) | 0 (0.0%) |
Disability Class: Ambulatory Difficulty
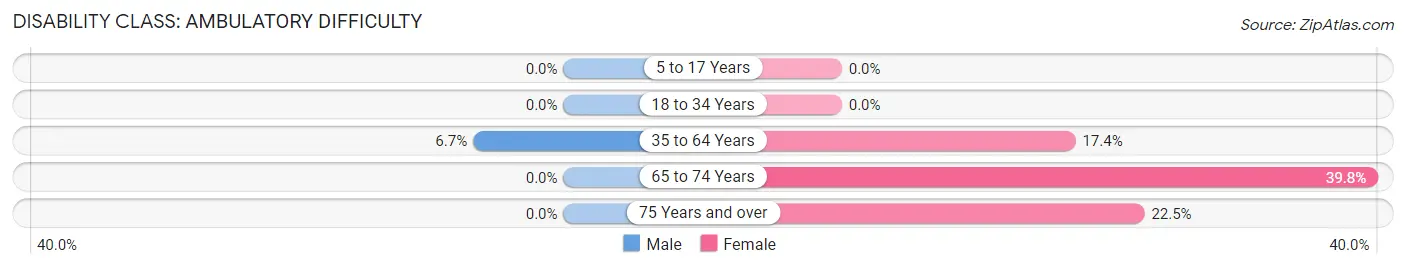
| Age Bracket | Male | Female |
| 5 to 17 Years | 0 (0.0%) | 0 (0.0%) |
| 18 to 34 Years | 0 (0.0%) | 0 (0.0%) |
| 35 to 64 Years | 19 (6.7%) | 55 (17.3%) |
| 65 to 74 Years | 0 (0.0%) | 43 (39.8%) |
| 75 Years and over | 0 (0.0%) | 20 (22.5%) |
Disability Class: Self-Care Difficulty
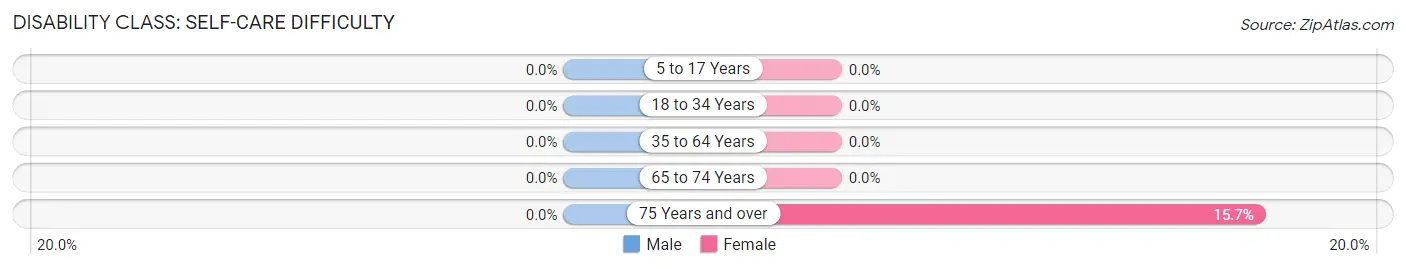
| Age Bracket | Male | Female |
| 5 to 17 Years | 0 (0.0%) | 0 (0.0%) |
| 18 to 34 Years | 0 (0.0%) | 0 (0.0%) |
| 35 to 64 Years | 0 (0.0%) | 0 (0.0%) |
| 65 to 74 Years | 0 (0.0%) | 0 (0.0%) |
| 75 Years and over | 0 (0.0%) | 14 (15.7%) |
Technology Access in Eureka County
Computing Device Access in Eureka County
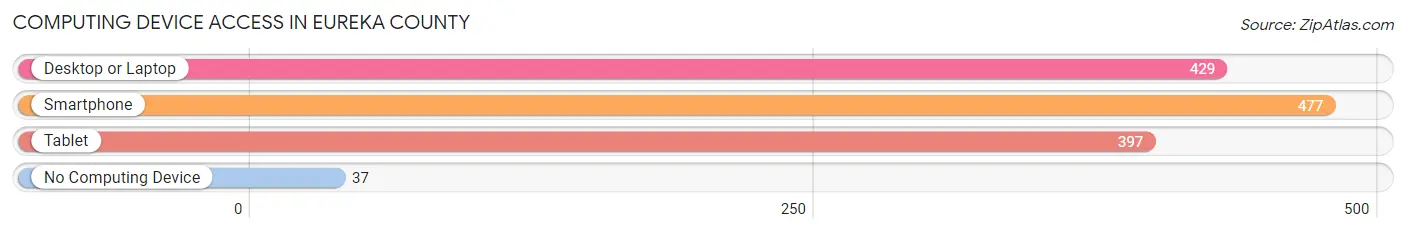
| Device Type | # Households | % Households |
| Desktop or Laptop | 429 | 75.3% |
| Smartphone | 477 | 83.7% |
| Tablet | 397 | 69.7% |
| No Computing Device | 37 | 6.5% |
| Total | 570 | 100.0% |
Internet Access in Eureka County
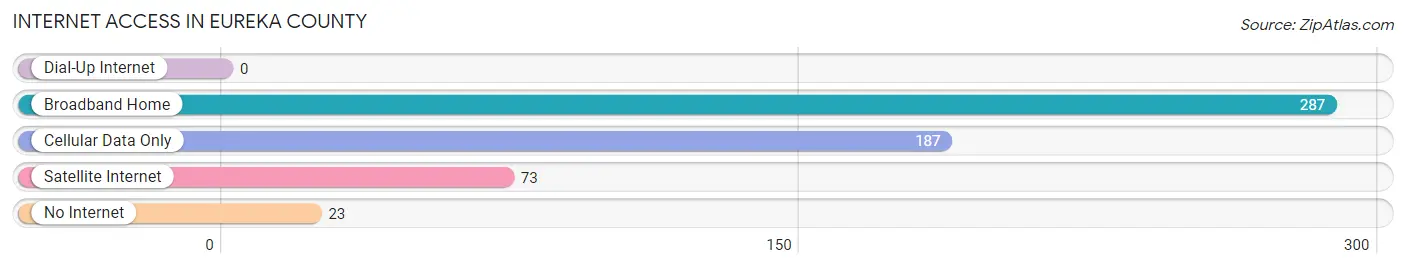
| Internet Type | # Households | % Households |
| Dial-Up Internet | 0 | 0.0% |
| Broadband Home | 287 | 50.3% |
| Cellular Data Only | 187 | 32.8% |
| Satellite Internet | 73 | 12.8% |
| No Internet | 23 | 4.0% |
| Total | 570 | 100.0% |
Eureka County Summary
Eureka County is located in the central part of Nevada, in the Great Basin region of the United States. It is bordered by Elko County to the north, White Pine County to the east, Nye County to the south, and Lander County to the west. The county seat is the town of Eureka, which is located in the center of the county. The county has a total area of 4,179 square miles, making it the fourth largest county in Nevada.
History
Eureka County was established in 1873, and was named after the Greek word for “discovery”. The county was originally part of Lander County, but was split off in 1873. The county was initially populated by miners and ranchers, who were attracted to the area by the discovery of silver and gold in the area. The county was also home to several Native American tribes, including the Shoshone, Paiute, and Washoe.
Geography
Eureka County is located in the Great Basin region of Nevada, and is characterized by its mountainous terrain. The county is home to several mountain ranges, including the Diamond Mountains, the Eureka Range, and the Toiyabe Range. The highest point in the county is Bald Mountain, which has an elevation of 9,717 feet. The county is also home to several rivers and streams, including the Humboldt River, the Reese River, and the White River.
The climate of Eureka County is semi-arid, with hot summers and cold winters. The average annual precipitation is 8.5 inches, and the average annual temperature is 50.3 degrees Fahrenheit.
Economy
The economy of Eureka County is largely based on mining and ranching. The county is home to several large gold and silver mines, including the Robinson Mine, the Eureka Mine, and the White Pine Mine. The county is also home to several large ranches, which raise cattle and sheep.
In addition to mining and ranching, the county is also home to several other industries, including tourism, manufacturing, and retail. The county is home to several tourist attractions, including the Eureka Opera House, the Eureka County Museum, and the Eureka County Historical Society. The county is also home to several manufacturing companies, including the Eureka Manufacturing Company and the Eureka Tool and Die Company.
Demographics
As of the 2010 census, the population of Eureka County was 1,987, a decrease of 4.3% from the 2000 census. The population is spread out across the county, with the largest population centers being the towns of Eureka and Diamond Valley. The racial makeup of the county is 94.3% White, 0.3% African American, 1.2% Native American, 0.2% Asian, 0.1% Pacific Islander, and 3.9% from other races. The median household income in the county is $41,944, and the median family income is $48,958. The per capita income in the county is $20,945.
Common Questions
What is Per Capita Income in Eureka County?
Per Capita income in Eureka County is $32,187.
What is the Median Family Income in Eureka County?
Median Family Income in Eureka County is $74,143.
What is the Median Household income in Eureka County?
Median Household Income in Eureka County is $73,929.
What is Inequality or Gini Index in Eureka County?
Inequality or Gini Index in Eureka County is 0.36.
What is the Total Population of Eureka County?
Total Population of Eureka County is 1,622.
What is the Total Male Population of Eureka County?
Total Male Population of Eureka County is 818.
What is the Total Female Population of Eureka County?
Total Female Population of Eureka County is 804.
What is the Ratio of Males per 100 Females in Eureka County?
There are 101.74 Males per 100 Females in Eureka County.
What is the Ratio of Females per 100 Males in Eureka County?
There are 98.29 Females per 100 Males in Eureka County.
What is the Median Population Age in Eureka County?
Median Population Age in Eureka County is 48.4 Years.
What is the Average Family Size in Eureka County
Average Family Size in Eureka County is 3.0 People.
What is the Average Household Size in Eureka County
Average Household Size in Eureka County is 2.8 People.
How Large is the Labor Force in Eureka County?
There are 579 People in the Labor Forcein in Eureka County.
What is the Percentage of People in the Labor Force in Eureka County?
46.1% of People are in the Labor Force in Eureka County.