Esmeralda County, NV Map & Demographics
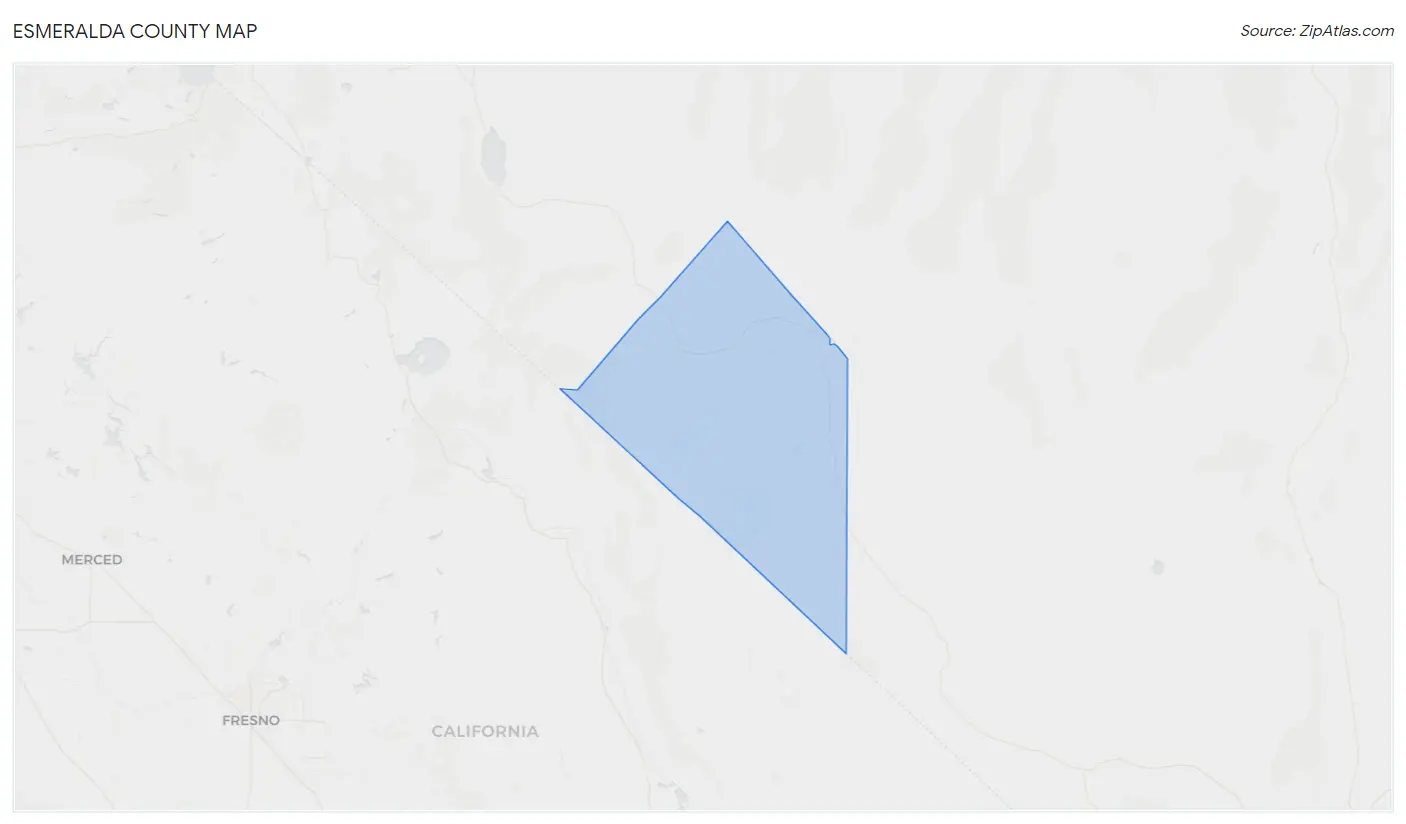
Esmeralda County Map
Esmeralda County Overview
$31,776
PER CAPITA INCOME
$102,583
AVG FAMILY INCOME
$40,694
AVG HOUSEHOLD INCOME
0.46
INEQUALITY / GINI INDEX
980
TOTAL POPULATION
529
MALE POPULATION
451
FEMALE POPULATION
117.29
MALES / 100 FEMALES
85.26
FEMALES / 100 MALES
55.0
MEDIAN AGE
2.9
AVG FAMILY SIZE
2.0
AVG HOUSEHOLD SIZE
429
LABOR FORCE [ PEOPLE ]
47.7%
PERCENT IN LABOR FORCE
4.7%
UNEMPLOYMENT RATE
Esmeralda County Area Codes
Income in Esmeralda County
Income Overview in Esmeralda County
Per Capita Income in Esmeralda County is $31,776, while median incomes of families and households are $102,583 and $40,694 respectively.
| Characteristic | Number | Measure |
| Per Capita Income | 980 | $31,776 |
| Median Family Income | 229 | $102,583 |
| Mean Family Income | 229 | $94,548 |
| Median Household Income | 485 | $40,694 |
| Mean Household Income | 485 | $61,434 |
| Income Deficit | 229 | $0 |
| Wage / Income Gap (%) | 980 | 0.00% |
| Wage / Income Gap ($) | 980 | 100.00¢ per $1 |
| Gini / Inequality Index | 980 | 0.46 |
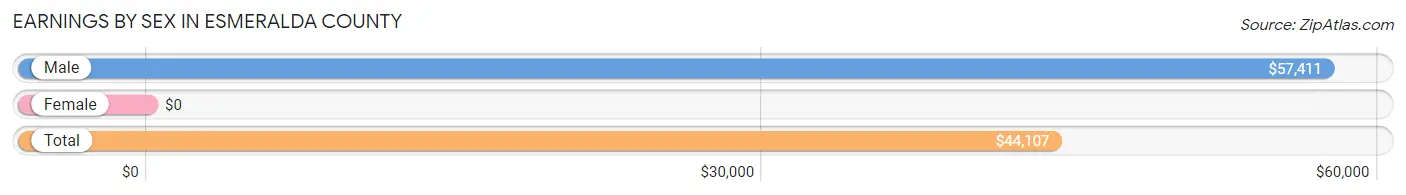
Earnings by Sex in Esmeralda County
| Sex | Number | Average Earnings |
| Male | 214 (50.6%) | $57,411 |
| Female | 209 (49.4%) | $0 |
| Total | 423 (100.0%) | $44,107 |
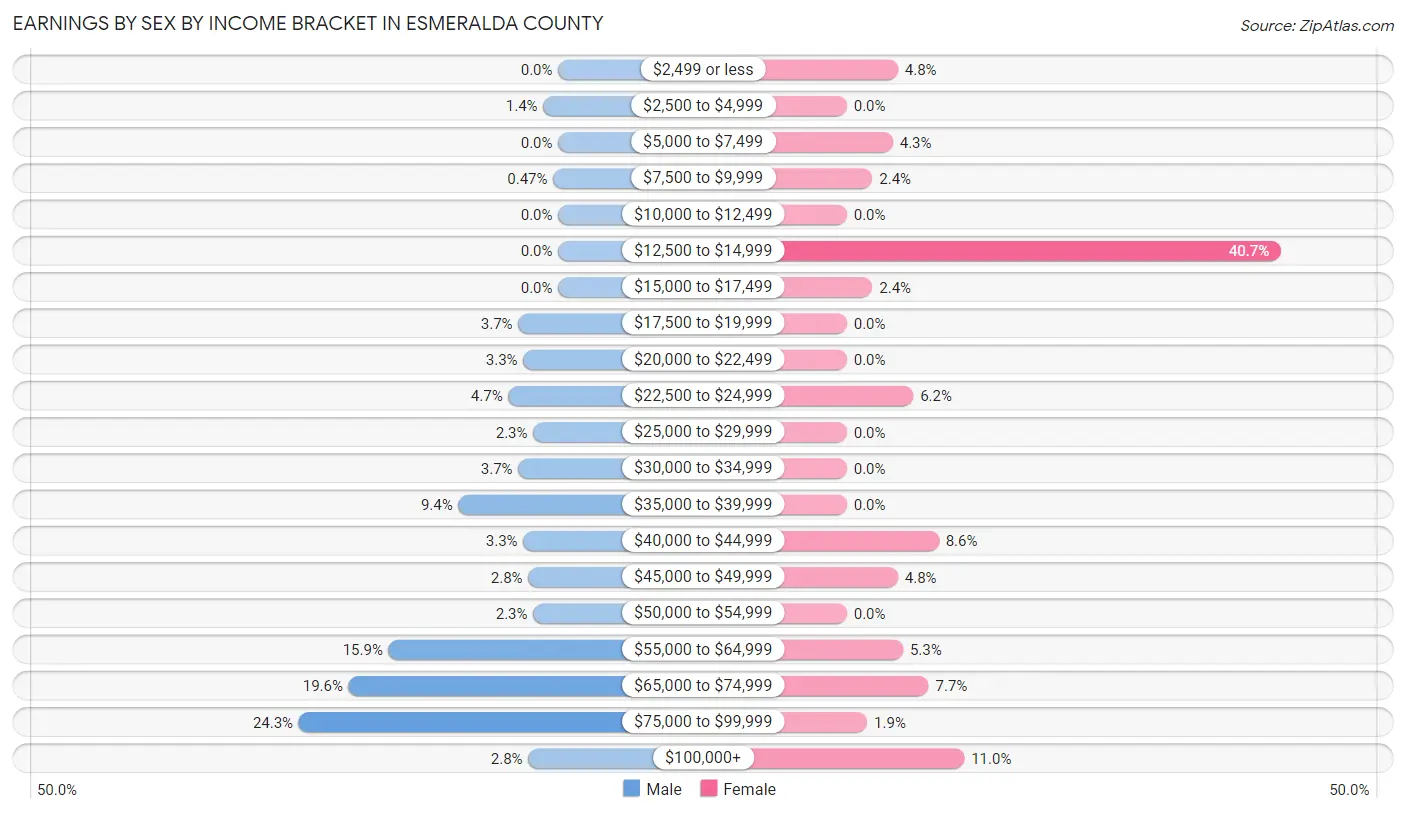
Earnings by Sex by Income Bracket in Esmeralda County
The most common earnings brackets in Esmeralda County are $75,000 to $99,999 for men (52 | 24.3%) and $12,500 to $14,999 for women (85 | 40.7%).
| Income | Male | Female |
| $2,499 or less | 0 (0.0%) | 10 (4.8%) |
| $2,500 to $4,999 | 3 (1.4%) | 0 (0.0%) |
| $5,000 to $7,499 | 0 (0.0%) | 9 (4.3%) |
| $7,500 to $9,999 | 1 (0.5%) | 5 (2.4%) |
| $10,000 to $12,499 | 0 (0.0%) | 0 (0.0%) |
| $12,500 to $14,999 | 0 (0.0%) | 85 (40.7%) |
| $15,000 to $17,499 | 0 (0.0%) | 5 (2.4%) |
| $17,500 to $19,999 | 8 (3.7%) | 0 (0.0%) |
| $20,000 to $22,499 | 7 (3.3%) | 0 (0.0%) |
| $22,500 to $24,999 | 10 (4.7%) | 13 (6.2%) |
| $25,000 to $29,999 | 5 (2.3%) | 0 (0.0%) |
| $30,000 to $34,999 | 8 (3.7%) | 0 (0.0%) |
| $35,000 to $39,999 | 20 (9.3%) | 0 (0.0%) |
| $40,000 to $44,999 | 7 (3.3%) | 18 (8.6%) |
| $45,000 to $49,999 | 6 (2.8%) | 10 (4.8%) |
| $50,000 to $54,999 | 5 (2.3%) | 0 (0.0%) |
| $55,000 to $64,999 | 34 (15.9%) | 11 (5.3%) |
| $65,000 to $74,999 | 42 (19.6%) | 16 (7.7%) |
| $75,000 to $99,999 | 52 (24.3%) | 4 (1.9%) |
| $100,000+ | 6 (2.8%) | 23 (11.0%) |
| Total | 214 (100.0%) | 209 (100.0%) |
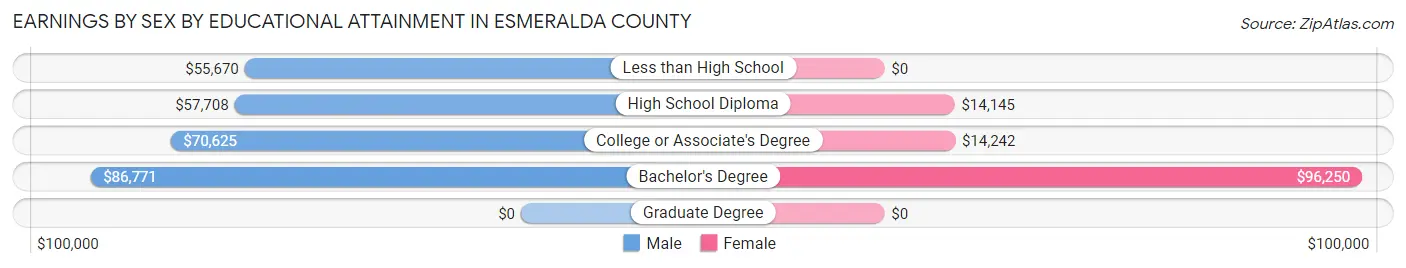
Earnings by Sex by Educational Attainment in Esmeralda County
| Educational Attainment | Male Income | Female Income |
| Less than High School | $55,670 | $0 |
| High School Diploma | $57,708 | $14,145 |
| College or Associate's Degree | $70,625 | $14,242 |
| Bachelor's Degree | $86,771 | $96,250 |
| Graduate Degree | - | - |
| Total | $57,411 | $0 |
Family Income in Esmeralda County
Family Income Brackets in Esmeralda County
According to the Esmeralda County family income data, there are 99 families falling into the $100,000 to $149,999 income range, which is the most common income bracket and makes up 43.2% of all families.
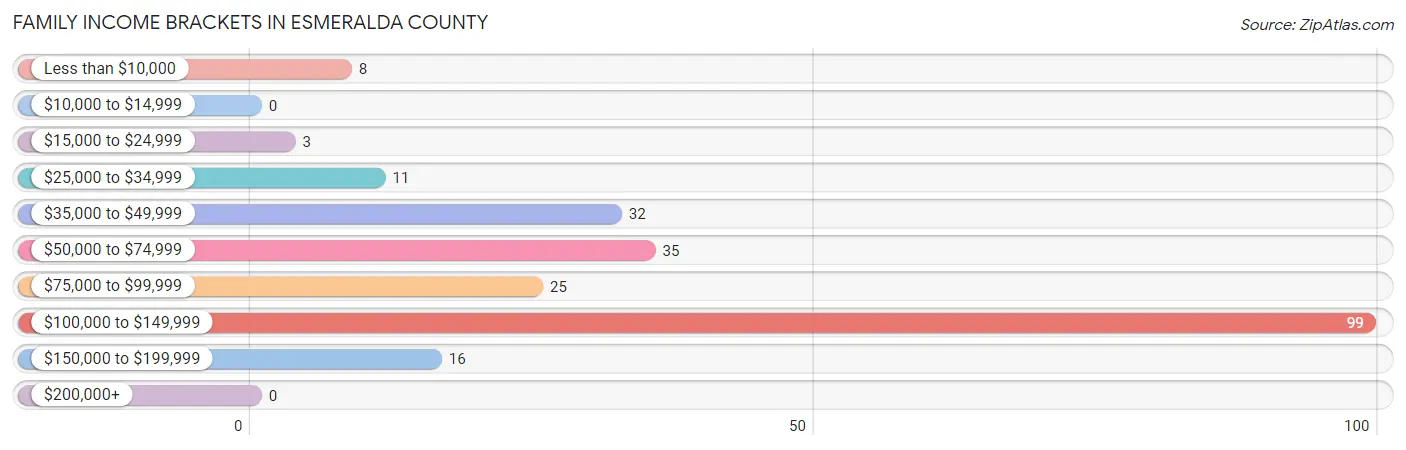
| Income Bracket | # Families | % Families |
| Less than $10,000 | 8 | 3.5% |
| $10,000 to $14,999 | 0 | 0.0% |
| $15,000 to $24,999 | 3 | 1.3% |
| $25,000 to $34,999 | 11 | 4.8% |
| $35,000 to $49,999 | 32 | 14.0% |
| $50,000 to $74,999 | 35 | 15.3% |
| $75,000 to $99,999 | 25 | 10.9% |
| $100,000 to $149,999 | 99 | 43.2% |
| $150,000 to $199,999 | 16 | 7.0% |
| $200,000+ | 0 | 0.0% |
Family Income by Famaliy Size in Esmeralda County
3-person families (12 | 5.2%) account for the highest median family income in Esmeralda County with $126,250 per family, while 2-person families (164 | 71.6%) have the highest median income of $49,062 per family member.
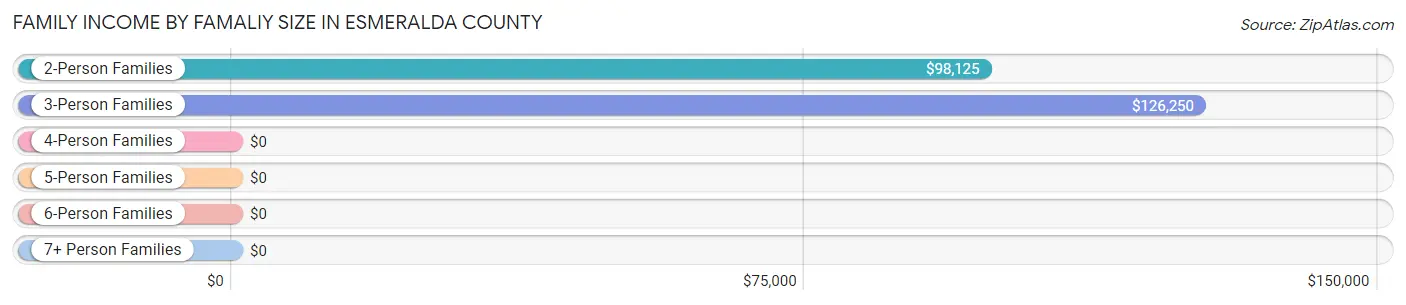
| Income Bracket | # Families | Median Income |
| 2-Person Families | 164 (71.6%) | $98,125 |
| 3-Person Families | 12 (5.2%) | $126,250 |
| 4-Person Families | 22 (9.6%) | $0 |
| 5-Person Families | 31 (13.5%) | $0 |
| 6-Person Families | 0 (0.0%) | $0 |
| 7+ Person Families | 0 (0.0%) | $0 |
| Total | 229 (100.0%) | $102,583 |
Family Income by Number of Earners in Esmeralda County
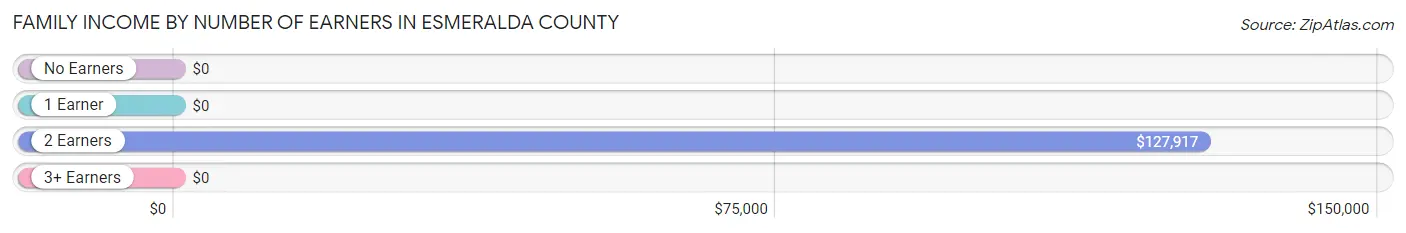
| Number of Earners | # Families | Median Income |
| No Earners | 62 (27.1%) | $0 |
| 1 Earner | 49 (21.4%) | $0 |
| 2 Earners | 103 (45.0%) | $127,917 |
| 3+ Earners | 15 (6.6%) | $0 |
| Total | 229 (100.0%) | $102,583 |
Household Income in Esmeralda County
Household Income Brackets in Esmeralda County
With 127 households falling in the category, the $10,000 to $14,999 income range is the most frequent in Esmeralda County, accounting for 26.2% of all households. In contrast, only 4 households (0.8%) fall into the less than $10,000 income bracket, making it the least populous group.
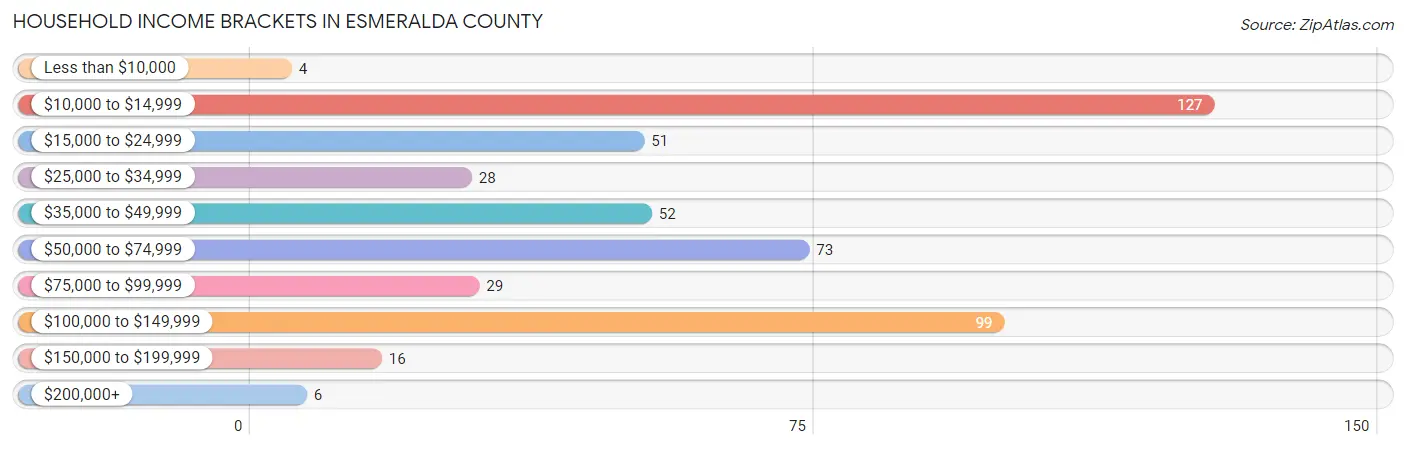
| Income Bracket | # Households | % Households |
| Less than $10,000 | 4 | 0.8% |
| $10,000 to $14,999 | 127 | 26.2% |
| $15,000 to $24,999 | 51 | 10.5% |
| $25,000 to $34,999 | 28 | 5.8% |
| $35,000 to $49,999 | 52 | 10.7% |
| $50,000 to $74,999 | 73 | 15.1% |
| $75,000 to $99,999 | 29 | 6.0% |
| $100,000 to $149,999 | 99 | 20.4% |
| $150,000 to $199,999 | 16 | 3.3% |
| $200,000+ | 6 | 1.2% |
Household Income by Householder Age in Esmeralda County
The median household income in Esmeralda County is $40,694, with the highest median household income of $71,447 found in the 25 to 44 years age bracket for the primary householder. A total of 96 households (19.8%) fall into this category.
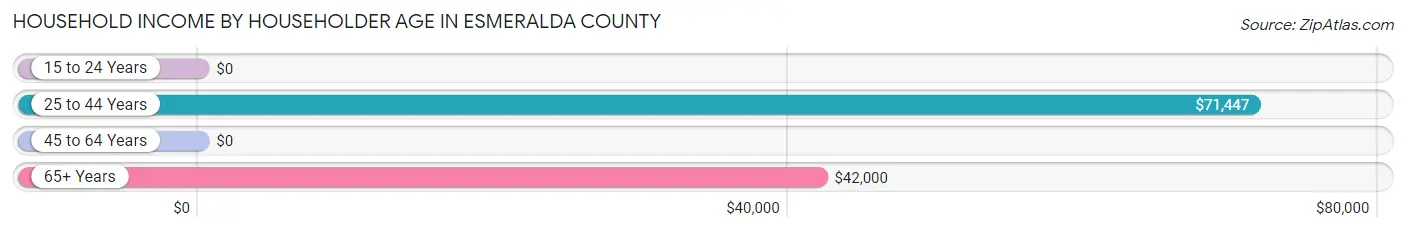
| Income Bracket | # Households | Median Income |
| 15 to 24 Years | 0 (0.0%) | $0 |
| 25 to 44 Years | 96 (19.8%) | $71,447 |
| 45 to 64 Years | 225 (46.4%) | $0 |
| 65+ Years | 164 (33.8%) | $42,000 |
| Total | 485 (100.0%) | $40,694 |
Poverty in Esmeralda County
Income Below Poverty by Sex and Age in Esmeralda County
With 24.7% poverty level for males and 6.2% for females among the residents of Esmeralda County, 55 to 64 year old males and 55 to 64 year old females are the most vulnerable to poverty, with 117 males (63.9%) and 13 females (26.5%) in their respective age groups living below the poverty level.
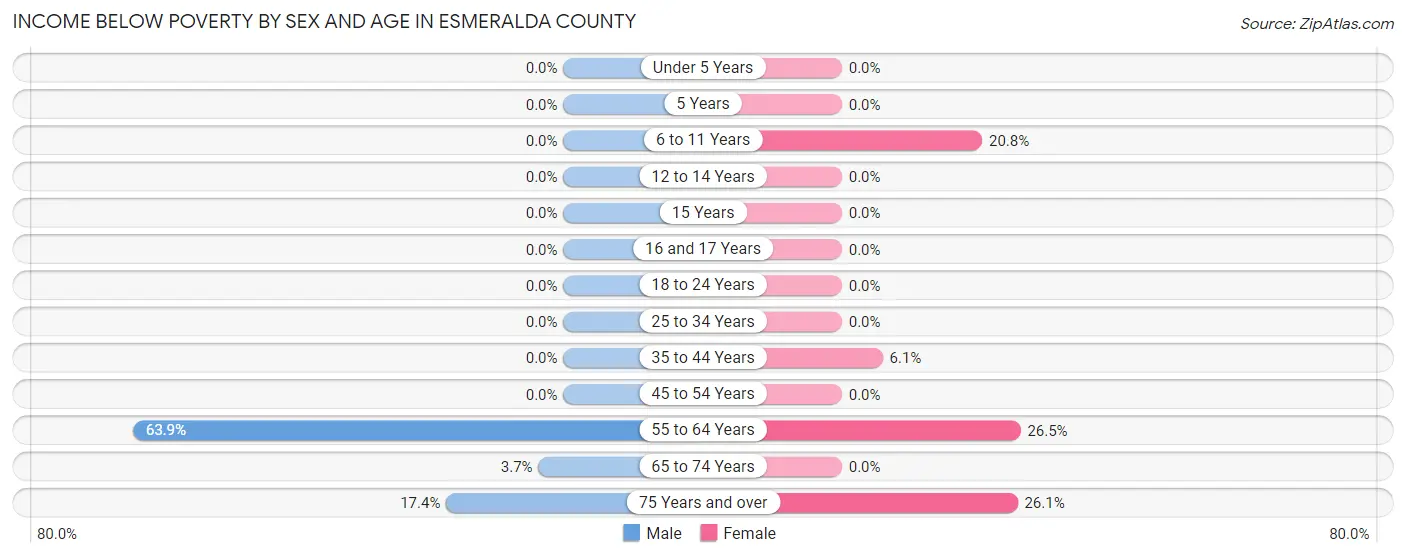
| Age Bracket | Male | Female |
| Under 5 Years | 0 (0.0%) | 0 (0.0%) |
| 5 Years | 0 (0.0%) | 0 (0.0%) |
| 6 to 11 Years | 0 (0.0%) | 5 (20.8%) |
| 12 to 14 Years | 0 (0.0%) | 0 (0.0%) |
| 15 Years | 0 (0.0%) | 0 (0.0%) |
| 16 and 17 Years | 0 (0.0%) | 0 (0.0%) |
| 18 to 24 Years | 0 (0.0%) | 0 (0.0%) |
| 25 to 34 Years | 0 (0.0%) | 0 (0.0%) |
| 35 to 44 Years | 0 (0.0%) | 4 (6.1%) |
| 45 to 54 Years | 0 (0.0%) | 0 (0.0%) |
| 55 to 64 Years | 117 (63.9%) | 13 (26.5%) |
| 65 to 74 Years | 4 (3.7%) | 0 (0.0%) |
| 75 Years and over | 8 (17.4%) | 6 (26.1%) |
| Total | 129 (24.7%) | 28 (6.2%) |
Income Above Poverty by Sex and Age in Esmeralda County
According to the poverty statistics in Esmeralda County, males aged under 5 years and females aged under 5 years are the age groups that are most secure financially, with 100.0% of males and 100.0% of females in these age groups living above the poverty line.
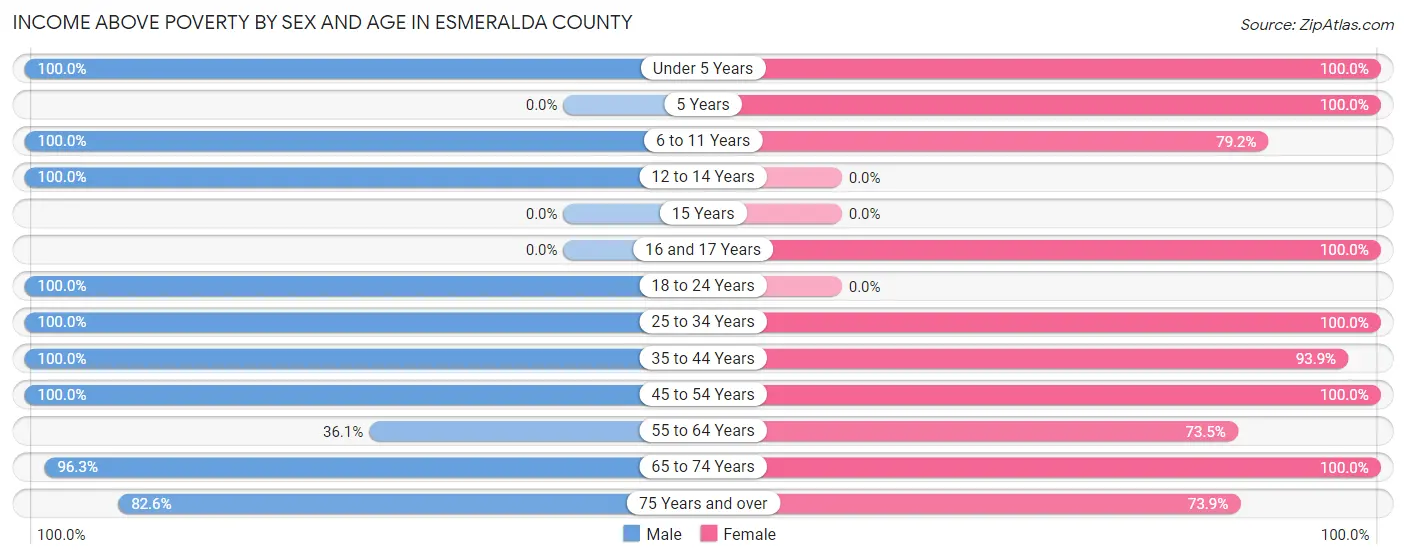
| Age Bracket | Male | Female |
| Under 5 Years | 9 (100.0%) | 11 (100.0%) |
| 5 Years | 0 (0.0%) | 6 (100.0%) |
| 6 to 11 Years | 18 (100.0%) | 19 (79.2%) |
| 12 to 14 Years | 12 (100.0%) | 0 (0.0%) |
| 15 Years | 0 (0.0%) | 0 (0.0%) |
| 16 and 17 Years | 0 (0.0%) | 16 (100.0%) |
| 18 to 24 Years | 10 (100.0%) | 0 (0.0%) |
| 25 to 34 Years | 30 (100.0%) | 44 (100.0%) |
| 35 to 44 Years | 44 (100.0%) | 62 (93.9%) |
| 45 to 54 Years | 62 (100.0%) | 132 (100.0%) |
| 55 to 64 Years | 66 (36.1%) | 36 (73.5%) |
| 65 to 74 Years | 104 (96.3%) | 80 (100.0%) |
| 75 Years and over | 38 (82.6%) | 17 (73.9%) |
| Total | 393 (75.3%) | 423 (93.8%) |
Income Below Poverty Among Married-Couple Families in Esmeralda County
The poverty statistics for married-couple families in Esmeralda County show that 1.9% or 4 of the total 207 families live below the poverty line. Families with no children have the highest poverty rate of 2.6%, comprising of 4 families. On the other hand, families with 1 or 2 children have the lowest poverty rate of 0.0%, which includes 0 families.
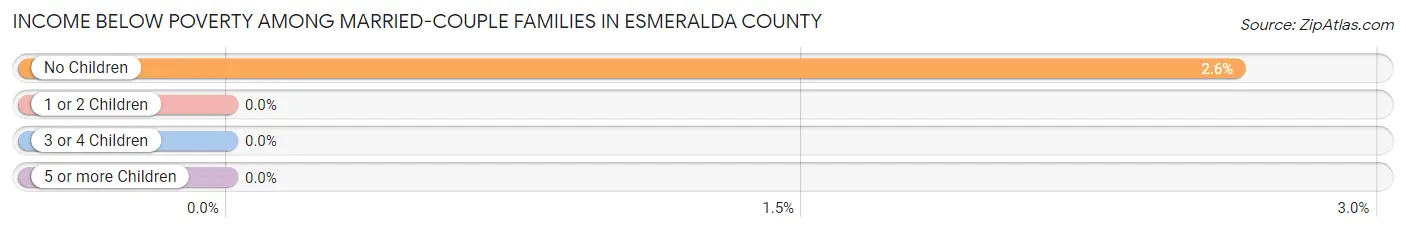
| Children | Above Poverty | Below Poverty |
| No Children | 148 (97.4%) | 4 (2.6%) |
| 1 or 2 Children | 33 (100.0%) | 0 (0.0%) |
| 3 or 4 Children | 22 (100.0%) | 0 (0.0%) |
| 5 or more Children | 0 (0.0%) | 0 (0.0%) |
| Total | 203 (98.1%) | 4 (1.9%) |
Income Below Poverty Among Single-Parent Households in Esmeralda County
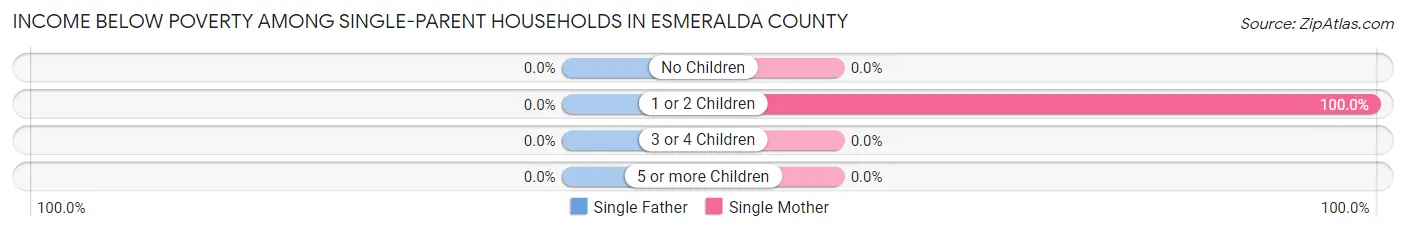
| Children | Single Father | Single Mother |
| No Children | 0 (0.0%) | 0 (0.0%) |
| 1 or 2 Children | 0 (0.0%) | 4 (100.0%) |
| 3 or 4 Children | 0 (0.0%) | 0 (0.0%) |
| 5 or more Children | 0 (0.0%) | 0 (0.0%) |
| Total | 0 (0.0%) | 4 (18.2%) |
Income Below Poverty Among Married-Couple vs Single-Parent Households in Esmeralda County
The poverty data for Esmeralda County shows that 4 of the married-couple family households (1.9%) and 4 of the single-parent households (18.2%) are living below the poverty level. Within the married-couple family households, those with no children have the highest poverty rate, with 4 households (2.6%) falling below the poverty line. Among the single-parent households, those with 1 or 2 children have the highest poverty rate, with 4 household (100.0%) living below poverty.
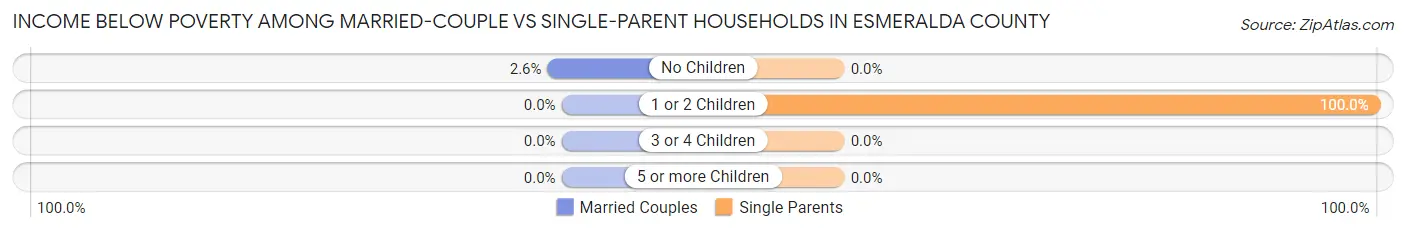
| Children | Married-Couple Families | Single-Parent Households |
| No Children | 4 (2.6%) | 0 (0.0%) |
| 1 or 2 Children | 0 (0.0%) | 4 (100.0%) |
| 3 or 4 Children | 0 (0.0%) | 0 (0.0%) |
| 5 or more Children | 0 (0.0%) | 0 (0.0%) |
| Total | 4 (1.9%) | 4 (18.2%) |
Race in Esmeralda County
The most populous races in Esmeralda County are White / Caucasian (881 | 89.9%), Hispanic or Latino (297 | 30.3%), and Two or more Races (65 | 6.6%).
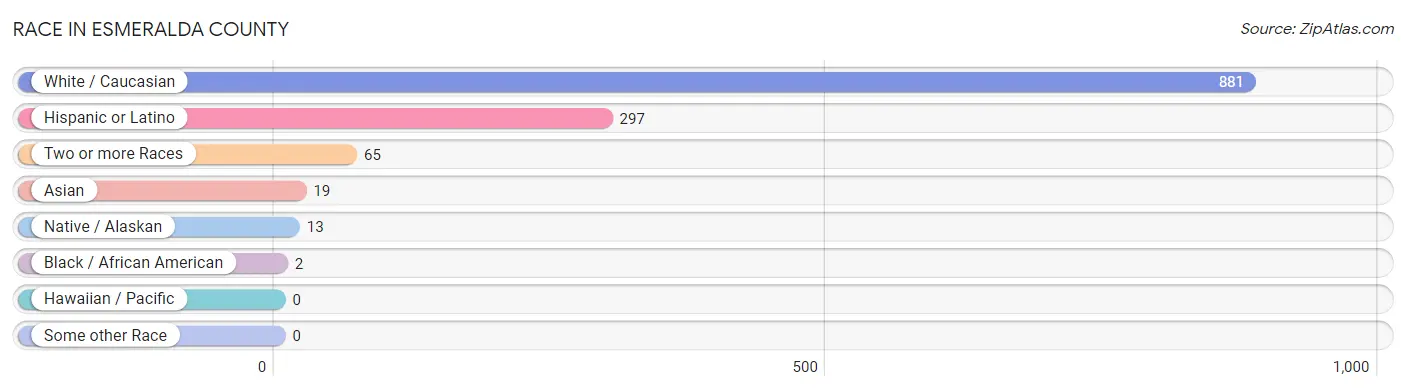
| Race | # Population | % Population |
| Asian | 19 | 1.9% |
| Black / African American | 2 | 0.2% |
| Hawaiian / Pacific | 0 | 0.0% |
| Hispanic or Latino | 297 | 30.3% |
| Native / Alaskan | 13 | 1.3% |
| White / Caucasian | 881 | 89.9% |
| Two or more Races | 65 | 6.6% |
| Some other Race | 0 | 0.0% |
| Total | 980 | 100.0% |
Ancestry in Esmeralda County
The most populous ancestries reported in Esmeralda County are German (201 | 20.5%), Mexican (165 | 16.8%), Greek (122 | 12.4%), Puerto Rican (109 | 11.1%), and Swedish (107 | 10.9%), together accounting for 71.8% of all Esmeralda County residents.
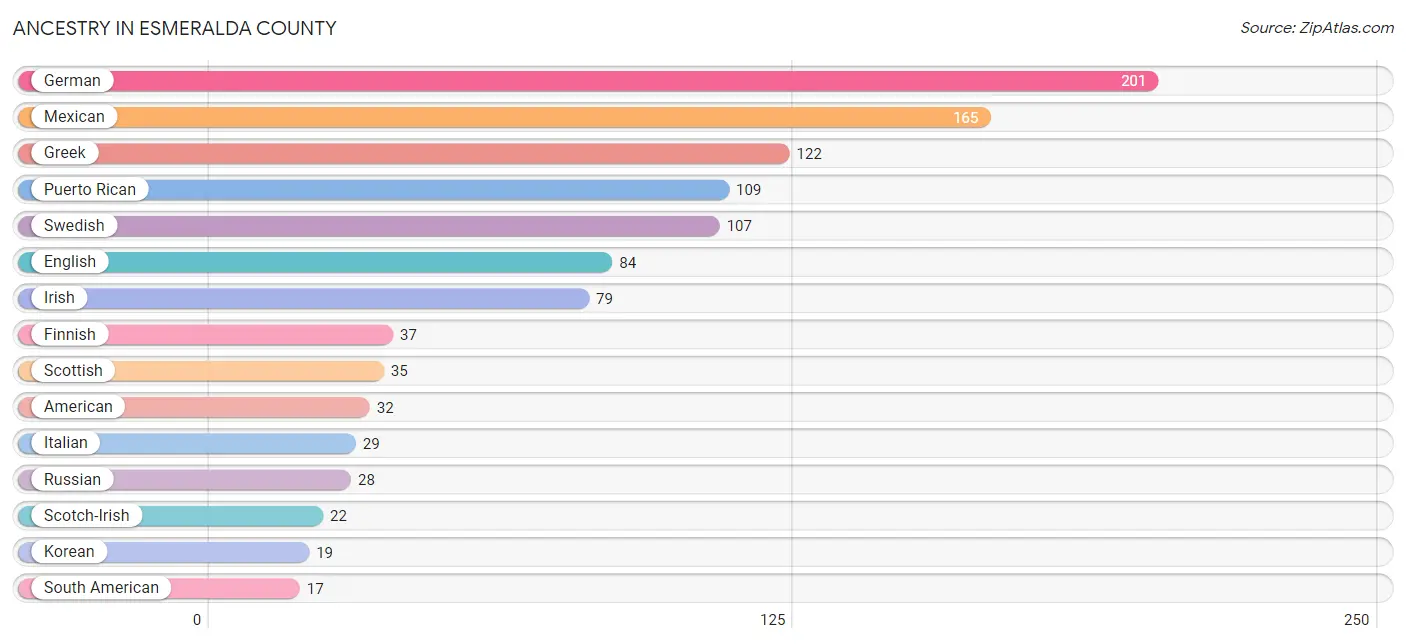
| Ancestry | # Population | % Population |
| American | 32 | 3.3% |
| British | 5 | 0.5% |
| Central American | 1 | 0.1% |
| Chippewa | 1 | 0.1% |
| Cree | 8 | 0.8% |
| Cuban | 5 | 0.5% |
| Danish | 14 | 1.4% |
| Dutch | 10 | 1.0% |
| English | 84 | 8.6% |
| Finnish | 37 | 3.8% |
| French | 15 | 1.5% |
| German | 201 | 20.5% |
| Greek | 122 | 12.4% |
| Honduran | 1 | 0.1% |
| Iranian | 6 | 0.6% |
| Irish | 79 | 8.1% |
| Italian | 29 | 3.0% |
| Korean | 19 | 1.9% |
| Mexican | 165 | 16.8% |
| Norwegian | 4 | 0.4% |
| Portuguese | 14 | 1.4% |
| Puerto Rican | 109 | 11.1% |
| Russian | 28 | 2.9% |
| Scandinavian | 6 | 0.6% |
| Scotch-Irish | 22 | 2.2% |
| Scottish | 35 | 3.6% |
| South American | 17 | 1.7% |
| Swedish | 107 | 10.9% |
| Venezuelan | 17 | 1.7% |
| Welsh | 11 | 1.1% | View All 30 Rows |
Immigrants in Esmeralda County
The most numerous immigrant groups reported in Esmeralda County came from Latin America (107 | 10.9%), Central America (85 | 8.7%), Mexico (85 | 8.7%), Asia (19 | 1.9%), and Philippines (19 | 1.9%), together accounting for 32.1% of all Esmeralda County residents.
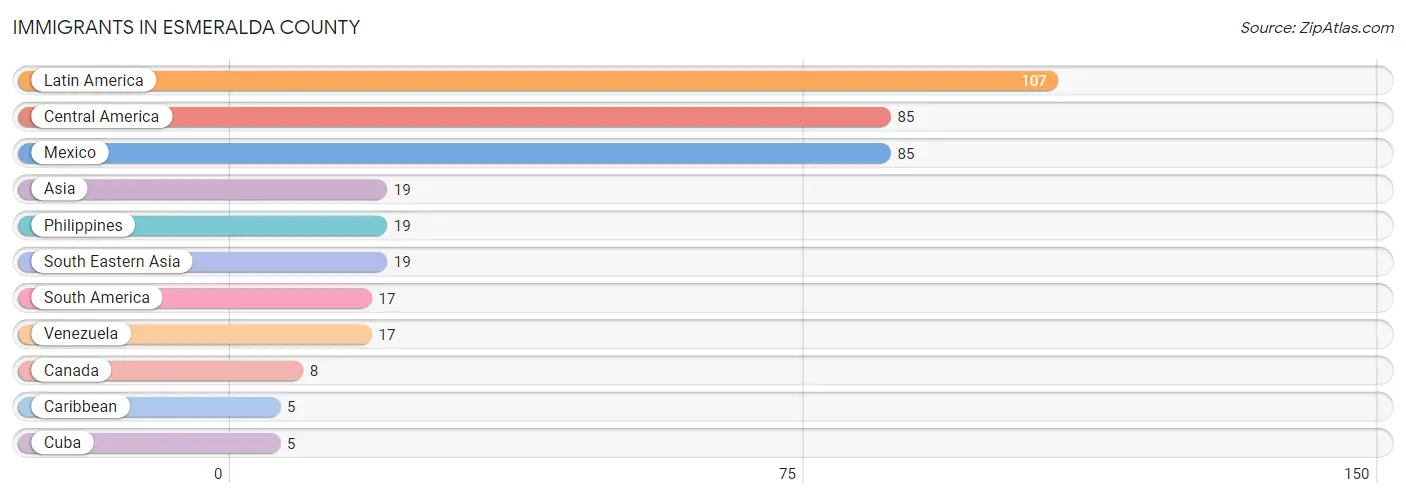
| Immigration Origin | # Population | % Population |
| Asia | 19 | 1.9% |
| Canada | 8 | 0.8% |
| Caribbean | 5 | 0.5% |
| Central America | 85 | 8.7% |
| Cuba | 5 | 0.5% |
| Latin America | 107 | 10.9% |
| Mexico | 85 | 8.7% |
| Philippines | 19 | 1.9% |
| South America | 17 | 1.7% |
| South Eastern Asia | 19 | 1.9% |
| Venezuela | 17 | 1.7% | View All 11 Rows |
Sex and Age in Esmeralda County
Sex and Age in Esmeralda County
The most populous age groups in Esmeralda County are 60 to 64 Years (132 | 24.9%) for men and 50 to 54 Years (120 | 26.6%) for women.
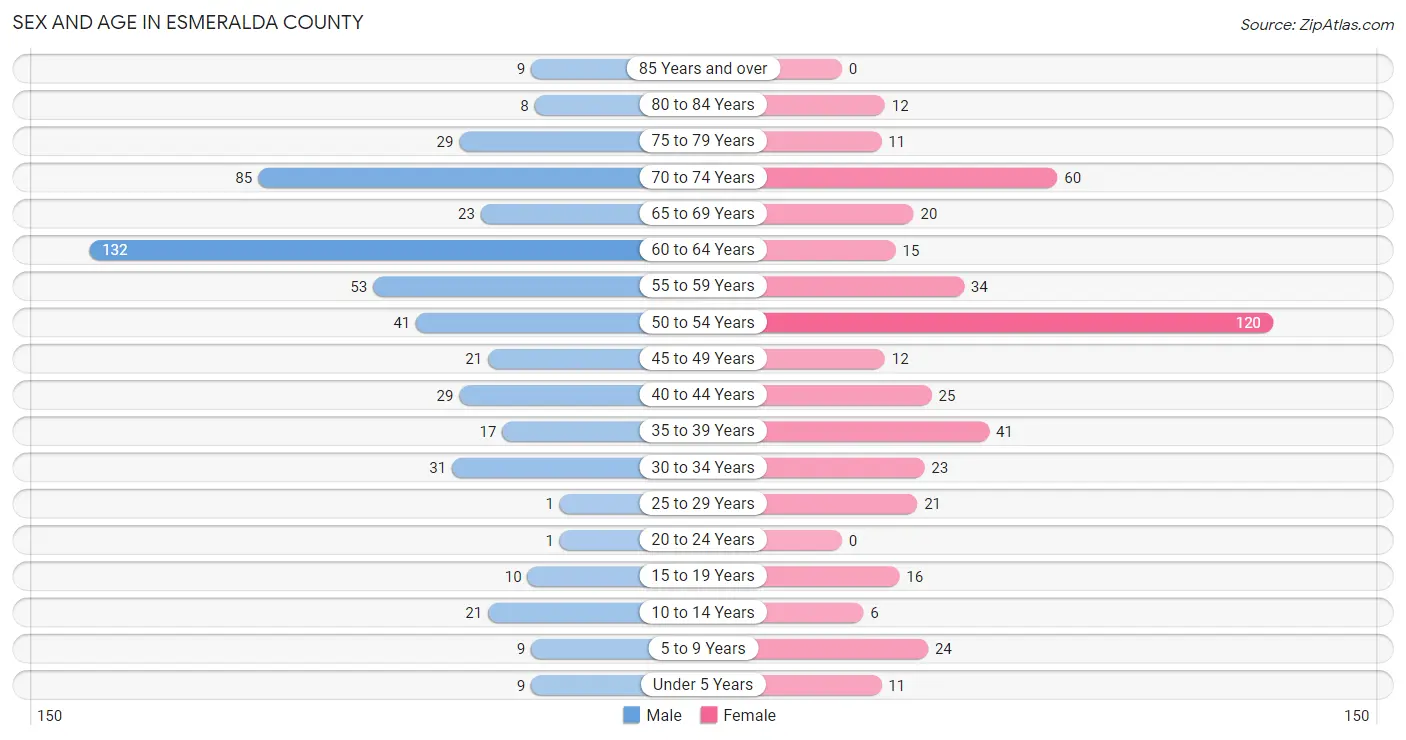
| Age Bracket | Male | Female |
| Under 5 Years | 9 (1.7%) | 11 (2.4%) |
| 5 to 9 Years | 9 (1.7%) | 24 (5.3%) |
| 10 to 14 Years | 21 (4.0%) | 6 (1.3%) |
| 15 to 19 Years | 10 (1.9%) | 16 (3.5%) |
| 20 to 24 Years | 1 (0.2%) | 0 (0.0%) |
| 25 to 29 Years | 1 (0.2%) | 21 (4.7%) |
| 30 to 34 Years | 31 (5.9%) | 23 (5.1%) |
| 35 to 39 Years | 17 (3.2%) | 41 (9.1%) |
| 40 to 44 Years | 29 (5.5%) | 25 (5.5%) |
| 45 to 49 Years | 21 (4.0%) | 12 (2.7%) |
| 50 to 54 Years | 41 (7.7%) | 120 (26.6%) |
| 55 to 59 Years | 53 (10.0%) | 34 (7.5%) |
| 60 to 64 Years | 132 (24.9%) | 15 (3.3%) |
| 65 to 69 Years | 23 (4.3%) | 20 (4.4%) |
| 70 to 74 Years | 85 (16.1%) | 60 (13.3%) |
| 75 to 79 Years | 29 (5.5%) | 11 (2.4%) |
| 80 to 84 Years | 8 (1.5%) | 12 (2.7%) |
| 85 Years and over | 9 (1.7%) | 0 (0.0%) |
| Total | 529 (100.0%) | 451 (100.0%) |
Families and Households in Esmeralda County
Median Family Size in Esmeralda County
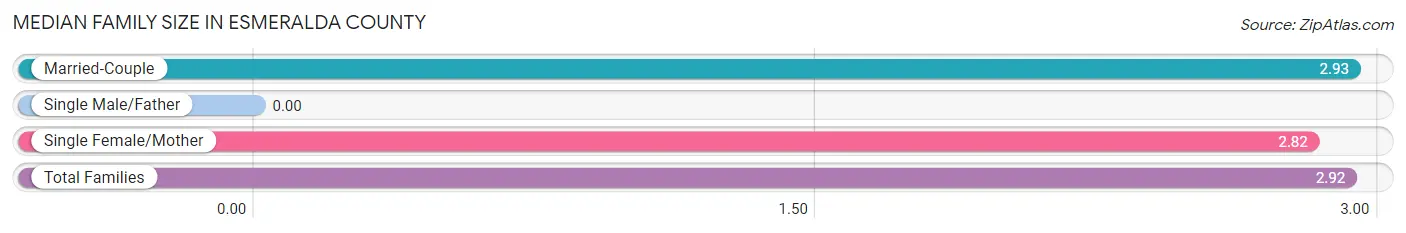
| Family Type | # Families | Family Size |
| Married-Couple | 207 (90.4%) | 2.93 |
| Single Male/Father | 0 (0.0%) | - |
| Single Female/Mother | 22 (9.6%) | 2.82 |
| Total Families | 229 (100.0%) | 2.92 |
Median Household Size in Esmeralda County
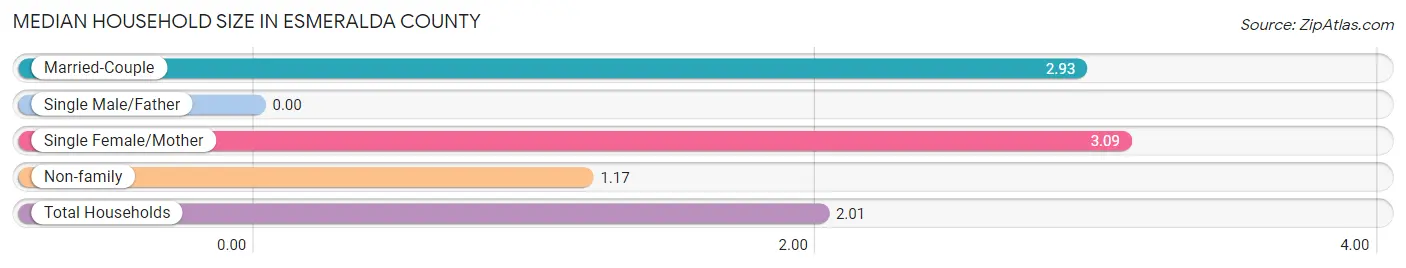
| Household Type | # Households | Household Size |
| Married-Couple | 207 (42.7%) | 2.93 |
| Single Male/Father | 0 (0.0%) | - |
| Single Female/Mother | 22 (4.5%) | 3.09 |
| Non-family | 256 (52.8%) | 1.17 |
| Total Households | 485 (100.0%) | 2.01 |
Household Size by Marriage Status in Esmeralda County
Out of a total of 485 households in Esmeralda County, 229 (47.2%) are family households, while 256 (52.8%) are nonfamily households. The most numerous type of family households are 2-person households, comprising 160, and the most common type of nonfamily households are 1-person households, comprising 215.
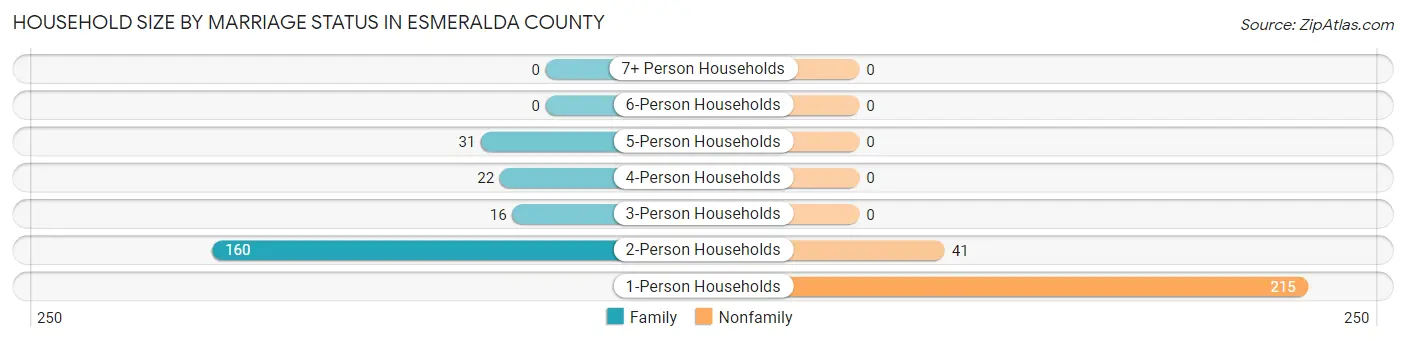
| Household Size | Family Households | Nonfamily Households |
| 1-Person Households | - | 215 (44.3%) |
| 2-Person Households | 160 (33.0%) | 41 (8.5%) |
| 3-Person Households | 16 (3.3%) | 0 (0.0%) |
| 4-Person Households | 22 (4.5%) | 0 (0.0%) |
| 5-Person Households | 31 (6.4%) | 0 (0.0%) |
| 6-Person Households | 0 (0.0%) | 0 (0.0%) |
| 7+ Person Households | 0 (0.0%) | 0 (0.0%) |
| Total | 229 (47.2%) | 256 (52.8%) |
Female Fertility in Esmeralda County
Fertility by Age in Esmeralda County
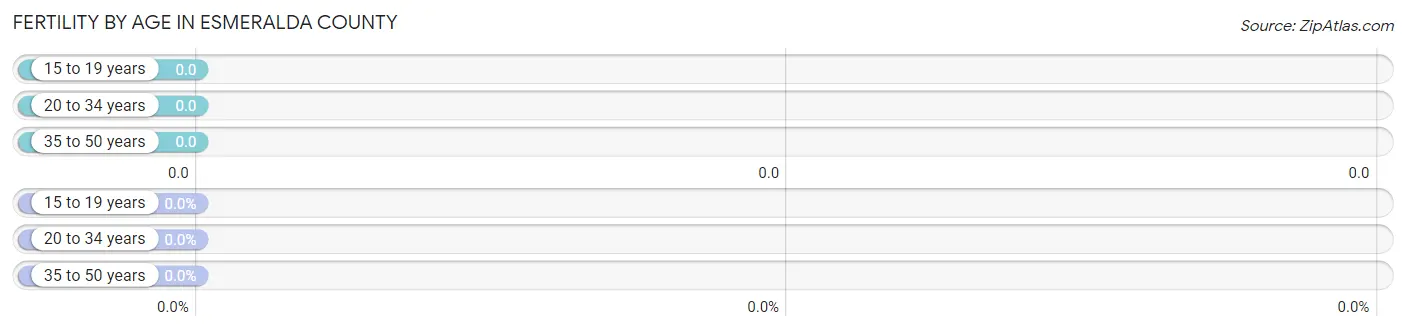
| Age Bracket | Women with Births | Births / 1,000 Women |
| 15 to 19 years | 0 (0.0%) | 0.0 |
| 20 to 34 years | 0 (0.0%) | 0.0 |
| 35 to 50 years | 0 (0.0%) | 0.0 |
| Total | 0 (0.0%) | 0.0 |
Fertility by Age by Marriage Status in Esmeralda County
| Age Bracket | Married | Unmarried |
| 15 to 19 years | 0 (0.0%) | 0 (0.0%) |
| 20 to 34 years | 0 (0.0%) | 0 (0.0%) |
| 35 to 50 years | 0 (0.0%) | 0 (0.0%) |
| Total | 0 (0.0%) | 0 (0.0%) |
Fertility by Education in Esmeralda County
| Educational Attainment | Women with Births | Births / 1,000 Women |
| Less than High School | 0 (0.0%) | 0.0 |
| High School Diploma | 0 (0.0%) | 0.0 |
| College or Associate's Degree | 0 (0.0%) | 0.0 |
| Bachelor's Degree | 0 (0.0%) | 0.0 |
| Graduate Degree | 0 (0.0%) | 0.0 |
| Total | 0 (0.0%) | 0.0 |
Fertility by Education by Marriage Status in Esmeralda County
| Educational Attainment | Married | Unmarried |
| Less than High School | 0 (0.0%) | 0 (0.0%) |
| High School Diploma | 0 (0.0%) | 0 (0.0%) |
| College or Associate's Degree | 0 (0.0%) | 0 (0.0%) |
| Bachelor's Degree | 0 (0.0%) | 0 (0.0%) |
| Graduate Degree | 0 (0.0%) | 0 (0.0%) |
| Total | 0 (0.0%) | 0 (0.0%) |
Employment Characteristics in Esmeralda County
Employment by Class of Employer in Esmeralda County
Among the 397 employed individuals in Esmeralda County, private company employees (233 | 58.7%), self-employed (not incorporated) (85 | 21.4%), and local government employees (64 | 16.1%) make up the most common classes of employment.
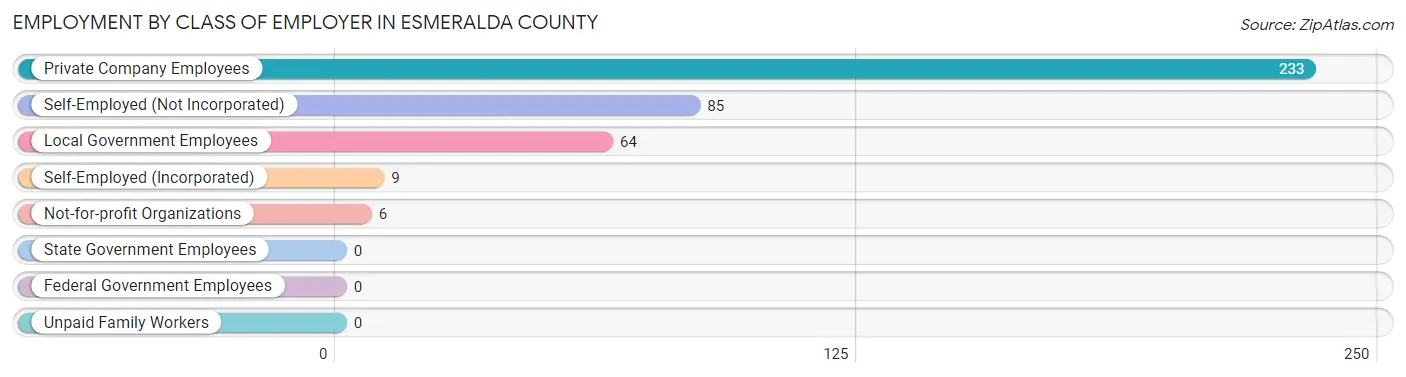
| Employer Class | # Employees | % Employees |
| Private Company Employees | 233 | 58.7% |
| Self-Employed (Incorporated) | 9 | 2.3% |
| Self-Employed (Not Incorporated) | 85 | 21.4% |
| Not-for-profit Organizations | 6 | 1.5% |
| Local Government Employees | 64 | 16.1% |
| State Government Employees | 0 | 0.0% |
| Federal Government Employees | 0 | 0.0% |
| Unpaid Family Workers | 0 | 0.0% |
| Total | 397 | 100.0% |
Employment Status by Age in Esmeralda County
According to the labor force statistics for Esmeralda County, out of the total population over 16 years of age (900), 47.7% or 429 individuals are in the labor force, with 4.7% or 20 of them unemployed. The age group with the highest labor force participation rate is 45 to 54 years, with 91.2% or 177 individuals in the labor force. Within the labor force, the 25 to 29 years age range has the highest percentage of unemployed individuals, with 50.0% or 5 of them being unemployed.
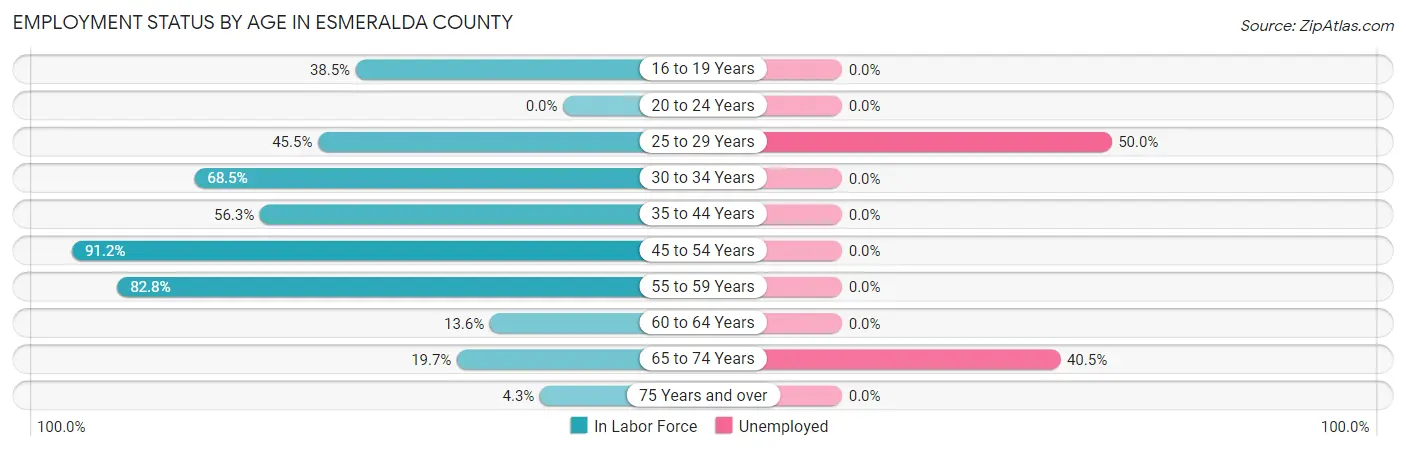
| Age Bracket | In Labor Force | Unemployed |
| 16 to 19 Years | 10 (38.5%) | 0 (0.0%) |
| 20 to 24 Years | 0 (0.0%) | 0 (0.0%) |
| 25 to 29 Years | 10 (45.5%) | 5 (50.0%) |
| 30 to 34 Years | 37 (68.5%) | 0 (0.0%) |
| 35 to 44 Years | 63 (56.3%) | 0 (0.0%) |
| 45 to 54 Years | 177 (91.2%) | 0 (0.0%) |
| 55 to 59 Years | 72 (82.8%) | 0 (0.0%) |
| 60 to 64 Years | 20 (13.6%) | 0 (0.0%) |
| 65 to 74 Years | 37 (19.7%) | 15 (40.5%) |
| 75 Years and over | 3 (4.3%) | 0 (0.0%) |
| Total | 429 (47.7%) | 20 (4.7%) |
Employment Status by Educational Attainment in Esmeralda County
According to labor force statistics for Esmeralda County, 61.5% of individuals (379) out of the total population between 25 and 64 years of age (616) are in the labor force, with 1.3% or 5 of them being unemployed. The group with the highest labor force participation rate are those with the educational attainment of bachelor's degree or higher, with 79.7% or 98 individuals in the labor force. Within the labor force, individuals with college / associate degree education have the highest percentage of unemployment, with 3.6% or 5 of them being unemployed.
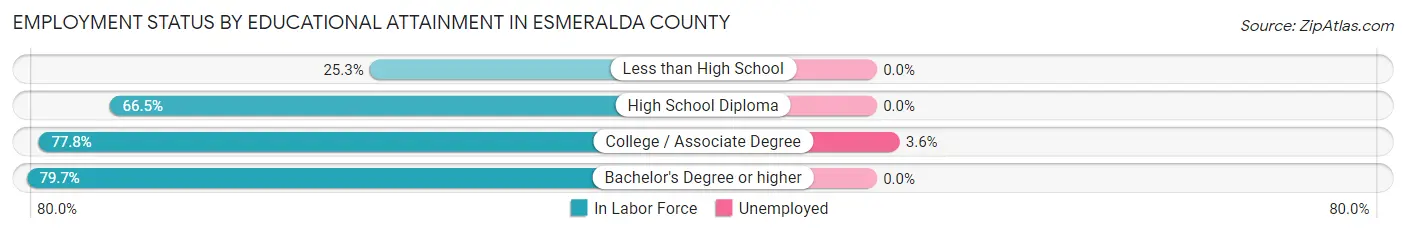
| Educational Attainment | In Labor Force | Unemployed |
| Less than High School | 41 (25.3%) | 0 (0.0%) |
| High School Diploma | 103 (66.5%) | 0 (0.0%) |
| College / Associate Degree | 137 (77.8%) | 6 (3.6%) |
| Bachelor's Degree or higher | 98 (79.7%) | 0 (0.0%) |
| Total | 379 (61.5%) | 8 (1.3%) |
Employment Occupations by Sex in Esmeralda County
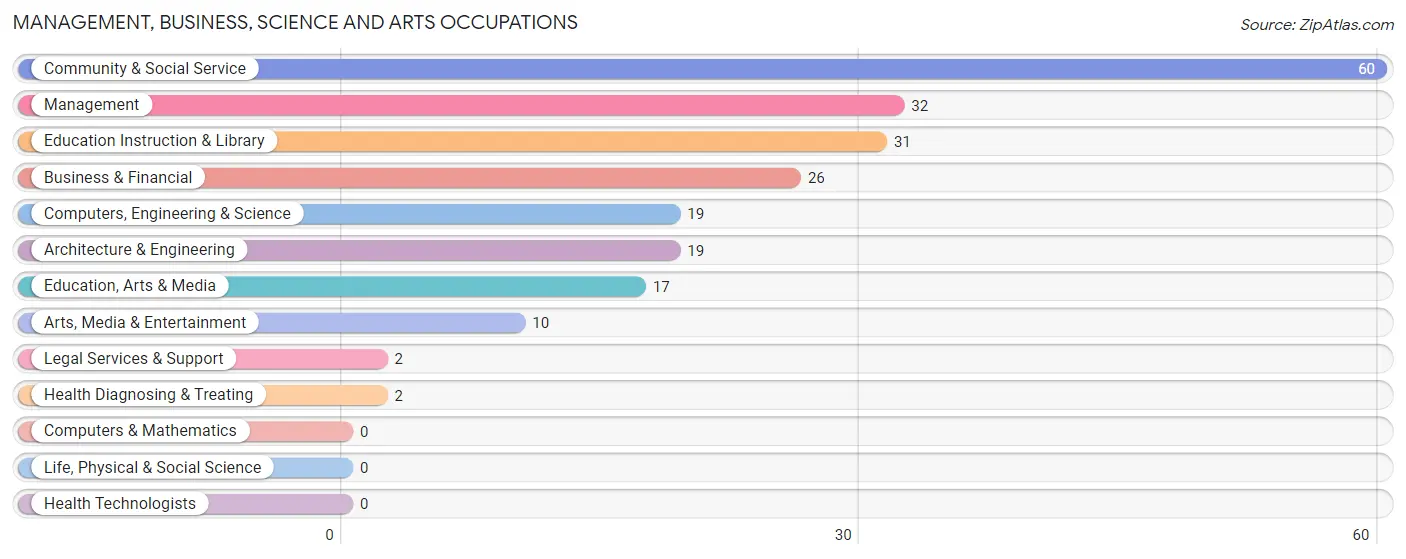
Management, Business, Science and Arts Occupations
The most common Management, Business, Science and Arts occupations in Esmeralda County are Community & Social Service (60 | 14.7%), Management (32 | 7.8%), Education Instruction & Library (31 | 7.6%), Business & Financial (26 | 6.4%), and Computers, Engineering & Science (19 | 4.6%).
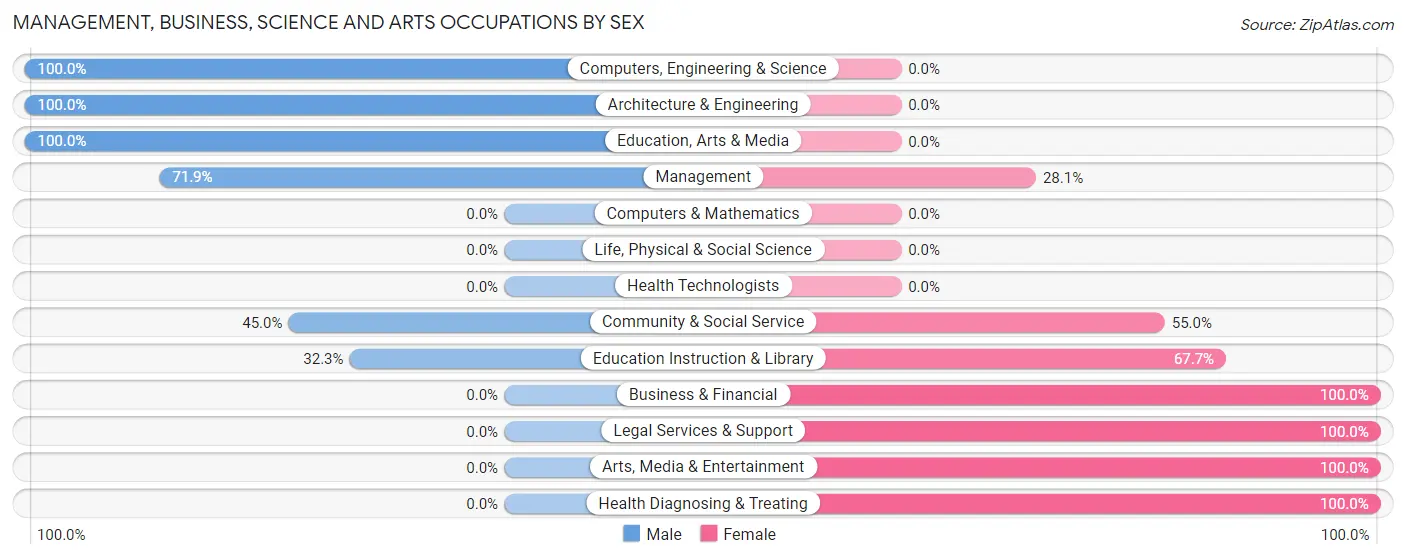
Management, Business, Science and Arts Occupations by Sex
Within the Management, Business, Science and Arts occupations in Esmeralda County, the most male-oriented occupations are Computers, Engineering & Science (100.0%), Architecture & Engineering (100.0%), and Education, Arts & Media (100.0%), while the most female-oriented occupations are Business & Financial (100.0%), Legal Services & Support (100.0%), and Arts, Media & Entertainment (100.0%).
| Occupation | Male | Female |
| Management | 23 (71.9%) | 9 (28.1%) |
| Business & Financial | 0 (0.0%) | 26 (100.0%) |
| Computers, Engineering & Science | 19 (100.0%) | 0 (0.0%) |
| Computers & Mathematics | 0 (0.0%) | 0 (0.0%) |
| Architecture & Engineering | 19 (100.0%) | 0 (0.0%) |
| Life, Physical & Social Science | 0 (0.0%) | 0 (0.0%) |
| Community & Social Service | 27 (45.0%) | 33 (55.0%) |
| Education, Arts & Media | 17 (100.0%) | 0 (0.0%) |
| Legal Services & Support | 0 (0.0%) | 2 (100.0%) |
| Education Instruction & Library | 10 (32.3%) | 21 (67.7%) |
| Arts, Media & Entertainment | 0 (0.0%) | 10 (100.0%) |
| Health Diagnosing & Treating | 0 (0.0%) | 2 (100.0%) |
| Health Technologists | 0 (0.0%) | 0 (0.0%) |
| Total (Category) | 69 (49.6%) | 70 (50.4%) |
| Total (Overall) | 208 (50.9%) | 201 (49.1%) |
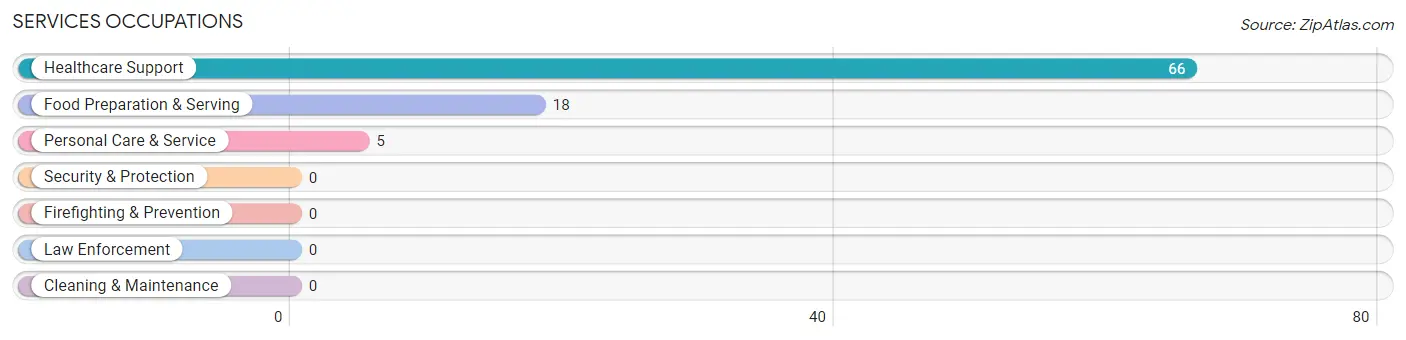
Services Occupations
The most common Services occupations in Esmeralda County are Healthcare Support (66 | 16.1%), Food Preparation & Serving (18 | 4.4%), and Personal Care & Service (5 | 1.2%).
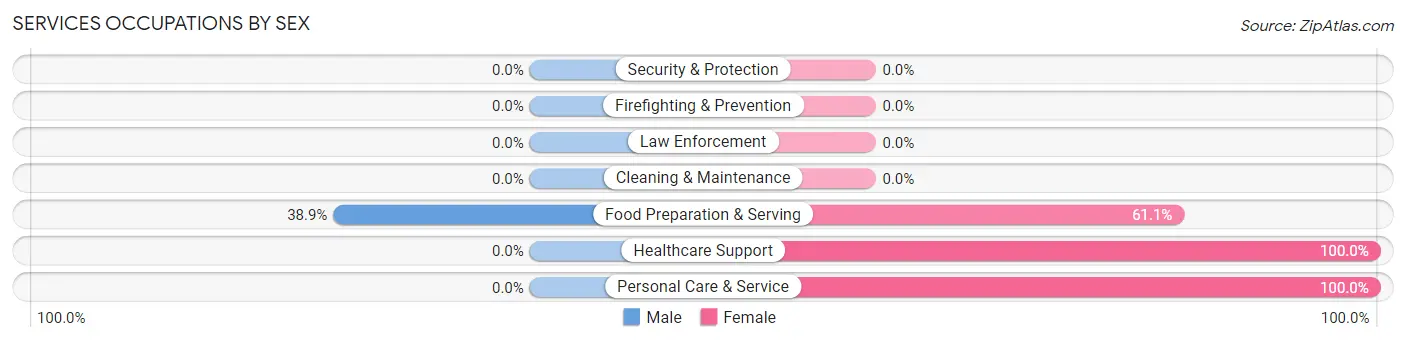
Services Occupations by Sex
| Occupation | Male | Female |
| Healthcare Support | 0 (0.0%) | 66 (100.0%) |
| Security & Protection | 0 (0.0%) | 0 (0.0%) |
| Firefighting & Prevention | 0 (0.0%) | 0 (0.0%) |
| Law Enforcement | 0 (0.0%) | 0 (0.0%) |
| Food Preparation & Serving | 7 (38.9%) | 11 (61.1%) |
| Cleaning & Maintenance | 0 (0.0%) | 0 (0.0%) |
| Personal Care & Service | 0 (0.0%) | 5 (100.0%) |
| Total (Category) | 7 (7.9%) | 82 (92.1%) |
| Total (Overall) | 208 (50.9%) | 201 (49.1%) |
Sales and Office Occupations
The most common Sales and Office occupations in Esmeralda County are Sales & Related (14 | 3.4%), and Office & Administration (13 | 3.2%).
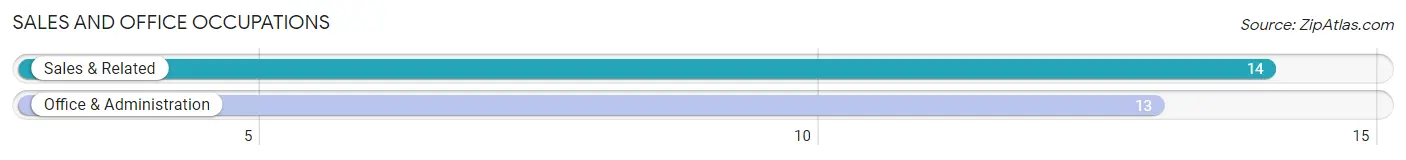
Sales and Office Occupations by Sex

| Occupation | Male | Female |
| Sales & Related | 14 (100.0%) | 0 (0.0%) |
| Office & Administration | 3 (23.1%) | 10 (76.9%) |
| Total (Category) | 17 (63.0%) | 10 (37.0%) |
| Total (Overall) | 208 (50.9%) | 201 (49.1%) |
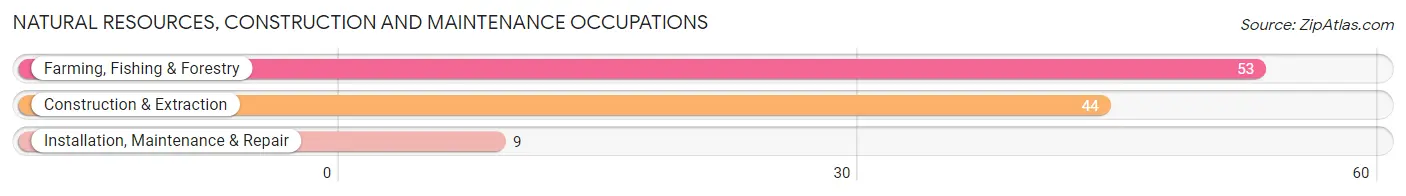
Natural Resources, Construction and Maintenance Occupations
The most common Natural Resources, Construction and Maintenance occupations in Esmeralda County are Farming, Fishing & Forestry (53 | 13.0%), Construction & Extraction (44 | 10.8%), and Installation, Maintenance & Repair (9 | 2.2%).
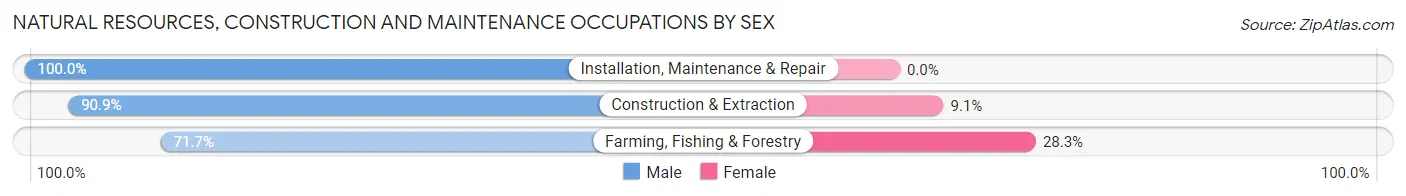
Natural Resources, Construction and Maintenance Occupations by Sex
| Occupation | Male | Female |
| Farming, Fishing & Forestry | 38 (71.7%) | 15 (28.3%) |
| Construction & Extraction | 40 (90.9%) | 4 (9.1%) |
| Installation, Maintenance & Repair | 9 (100.0%) | 0 (0.0%) |
| Total (Category) | 87 (82.1%) | 19 (17.9%) |
| Total (Overall) | 208 (50.9%) | 201 (49.1%) |
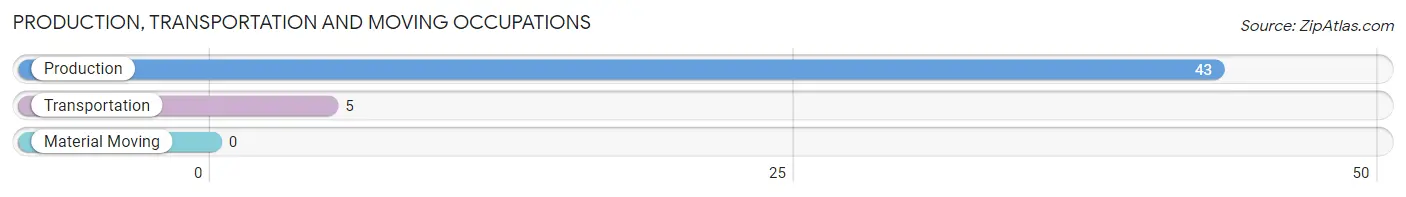
Production, Transportation and Moving Occupations
The most common Production, Transportation and Moving occupations in Esmeralda County are Production (43 | 10.5%), and Transportation (5 | 1.2%).
Production, Transportation and Moving Occupations by Sex
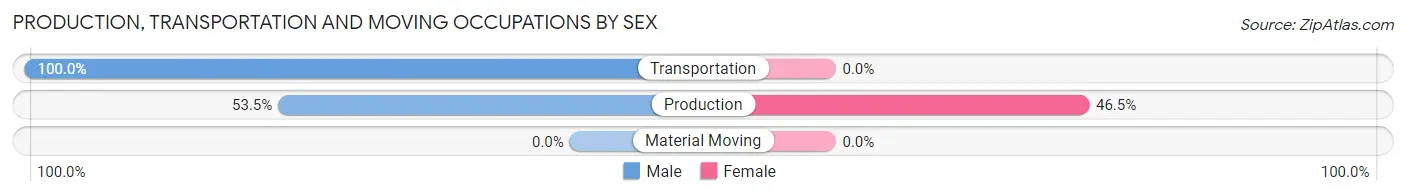
| Occupation | Male | Female |
| Production | 23 (53.5%) | 20 (46.5%) |
| Transportation | 5 (100.0%) | 0 (0.0%) |
| Material Moving | 0 (0.0%) | 0 (0.0%) |
| Total (Category) | 28 (58.3%) | 20 (41.7%) |
| Total (Overall) | 208 (50.9%) | 201 (49.1%) |
Employment Industries by Sex in Esmeralda County
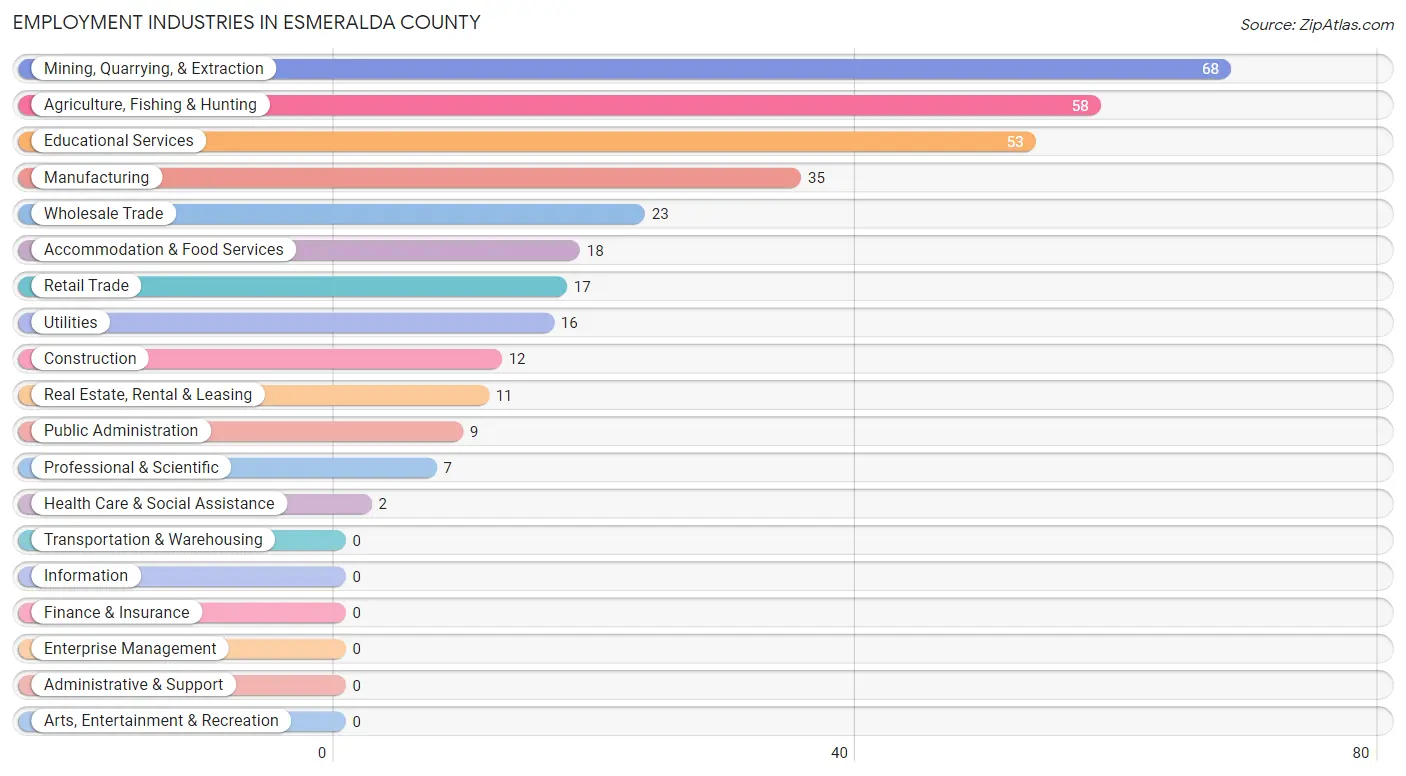
Employment Industries in Esmeralda County
The major employment industries in Esmeralda County include Mining, Quarrying, & Extraction (68 | 16.6%), Agriculture, Fishing & Hunting (58 | 14.2%), Educational Services (53 | 13.0%), Manufacturing (35 | 8.6%), and Wholesale Trade (23 | 5.6%).
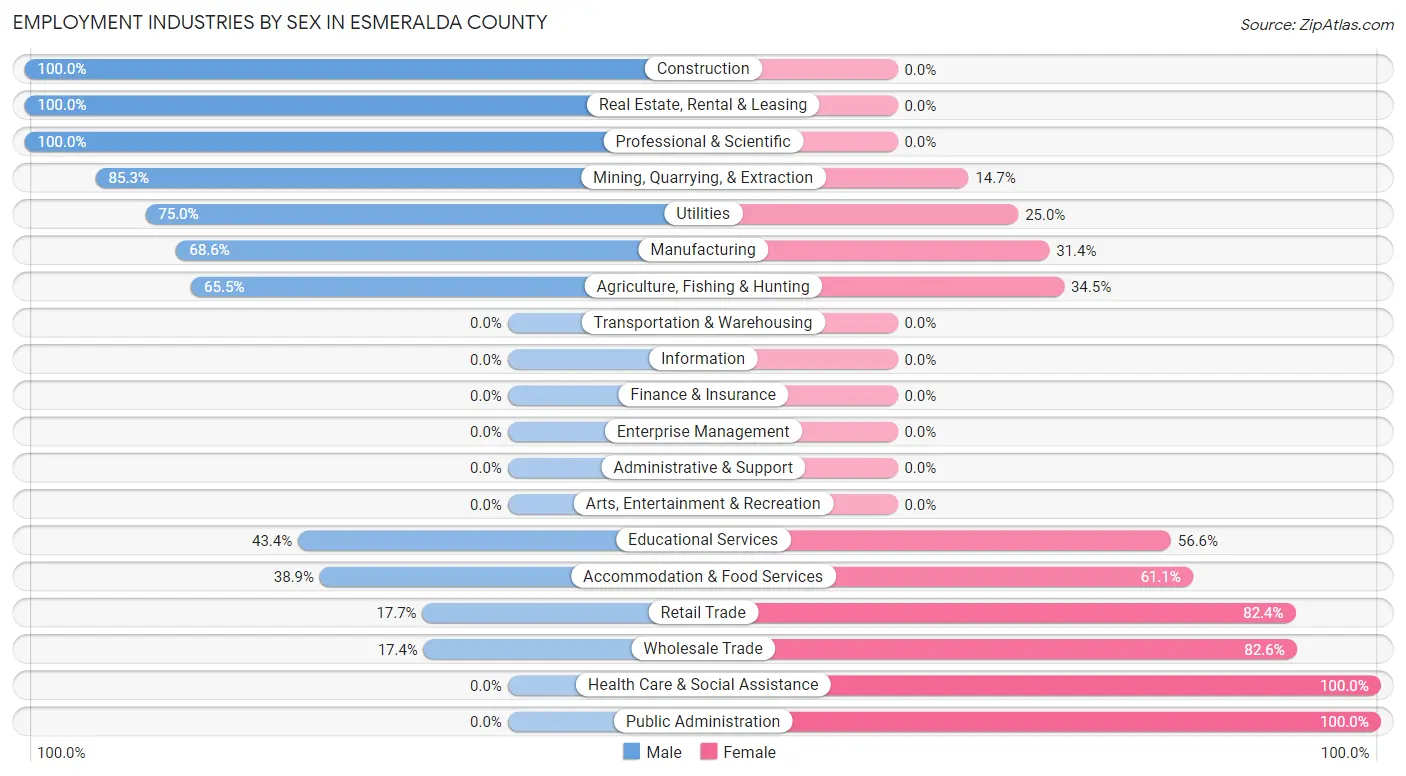
Employment Industries by Sex in Esmeralda County
The Esmeralda County industries that see more men than women are Construction (100.0%), Real Estate, Rental & Leasing (100.0%), and Professional & Scientific (100.0%), whereas the industries that tend to have a higher number of women are Health Care & Social Assistance (100.0%), Public Administration (100.0%), and Wholesale Trade (82.6%).
| Industry | Male | Female |
| Agriculture, Fishing & Hunting | 38 (65.5%) | 20 (34.5%) |
| Mining, Quarrying, & Extraction | 58 (85.3%) | 10 (14.7%) |
| Construction | 12 (100.0%) | 0 (0.0%) |
| Manufacturing | 24 (68.6%) | 11 (31.4%) |
| Wholesale Trade | 4 (17.4%) | 19 (82.6%) |
| Retail Trade | 3 (17.6%) | 14 (82.4%) |
| Transportation & Warehousing | 0 (0.0%) | 0 (0.0%) |
| Utilities | 12 (75.0%) | 4 (25.0%) |
| Information | 0 (0.0%) | 0 (0.0%) |
| Finance & Insurance | 0 (0.0%) | 0 (0.0%) |
| Real Estate, Rental & Leasing | 11 (100.0%) | 0 (0.0%) |
| Professional & Scientific | 7 (100.0%) | 0 (0.0%) |
| Enterprise Management | 0 (0.0%) | 0 (0.0%) |
| Administrative & Support | 0 (0.0%) | 0 (0.0%) |
| Educational Services | 23 (43.4%) | 30 (56.6%) |
| Health Care & Social Assistance | 0 (0.0%) | 2 (100.0%) |
| Arts, Entertainment & Recreation | 0 (0.0%) | 0 (0.0%) |
| Accommodation & Food Services | 7 (38.9%) | 11 (61.1%) |
| Public Administration | 0 (0.0%) | 9 (100.0%) |
| Total | 208 (50.9%) | 201 (49.1%) |
Education in Esmeralda County
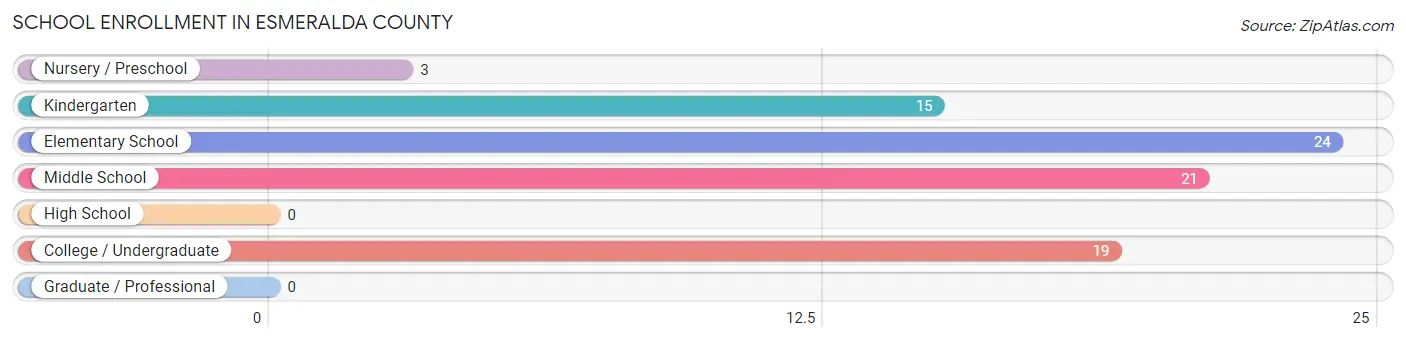
School Enrollment in Esmeralda County
The most common levels of schooling among the 82 students in Esmeralda County are elementary school (24 | 29.3%), middle school (21 | 25.6%), and college / undergraduate (19 | 23.2%).
| School Level | # Students | % Students |
| Nursery / Preschool | 3 | 3.7% |
| Kindergarten | 15 | 18.3% |
| Elementary School | 24 | 29.3% |
| Middle School | 21 | 25.6% |
| High School | 0 | 0.0% |
| College / Undergraduate | 19 | 23.2% |
| Graduate / Professional | 0 | 0.0% |
| Total | 82 | 100.0% |
School Enrollment by Age by Funding Source in Esmeralda County
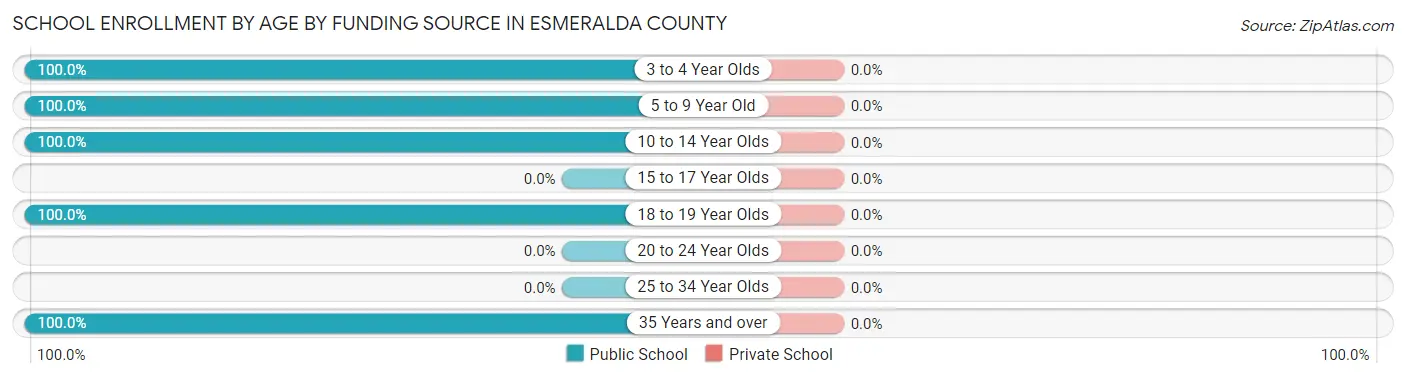
| Age Bracket | Public School | Private School |
| 3 to 4 Year Olds | 3 (100.0%) | 0 (0.0%) |
| 5 to 9 Year Old | 33 (100.0%) | 0 (0.0%) |
| 10 to 14 Year Olds | 27 (100.0%) | 0 (0.0%) |
| 15 to 17 Year Olds | 0 (0.0%) | 0 (0.0%) |
| 18 to 19 Year Olds | 10 (100.0%) | 0 (0.0%) |
| 20 to 24 Year Olds | 0 (0.0%) | 0 (0.0%) |
| 25 to 34 Year Olds | 0 (0.0%) | 0 (0.0%) |
| 35 Years and over | 9 (100.0%) | 0 (0.0%) |
| Total | 82 (100.0%) | 0 (0.0%) |
Educational Attainment by Field of Study in Esmeralda County
Education (46 | 21.7%), business (45 | 21.2%), social sciences (42 | 19.8%), visual & performing arts (41 | 19.3%), and engineering (21 | 9.9%) are the most common fields of study among 212 individuals in Esmeralda County who have obtained a bachelor's degree or higher.
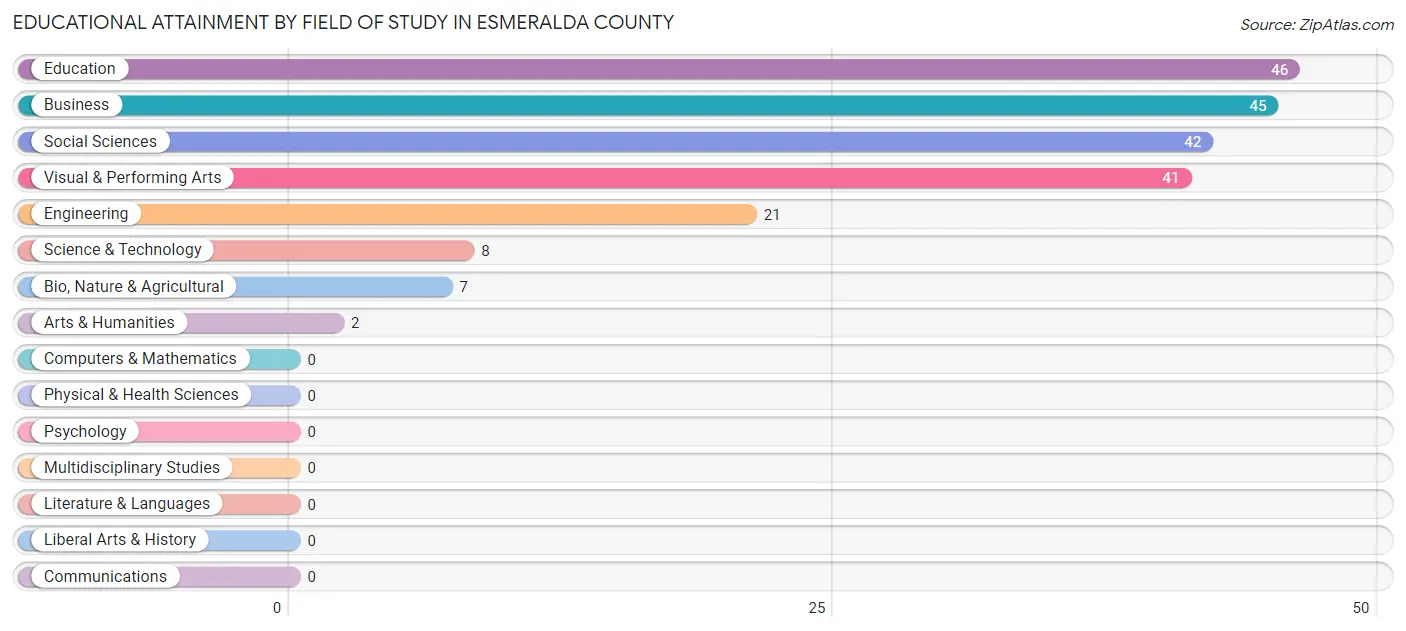
| Field of Study | # Graduates | % Graduates |
| Computers & Mathematics | 0 | 0.0% |
| Bio, Nature & Agricultural | 7 | 3.3% |
| Physical & Health Sciences | 0 | 0.0% |
| Psychology | 0 | 0.0% |
| Social Sciences | 42 | 19.8% |
| Engineering | 21 | 9.9% |
| Multidisciplinary Studies | 0 | 0.0% |
| Science & Technology | 8 | 3.8% |
| Business | 45 | 21.2% |
| Education | 46 | 21.7% |
| Literature & Languages | 0 | 0.0% |
| Liberal Arts & History | 0 | 0.0% |
| Visual & Performing Arts | 41 | 19.3% |
| Communications | 0 | 0.0% |
| Arts & Humanities | 2 | 0.9% |
| Total | 212 | 100.0% |
Transportation & Commute in Esmeralda County
Vehicle Availability by Sex in Esmeralda County
The most prevalent vehicle ownership categories in Esmeralda County are males with 2 vehicles (81, accounting for 40.3%) and females with 2 vehicles (62, making up 41.3%).
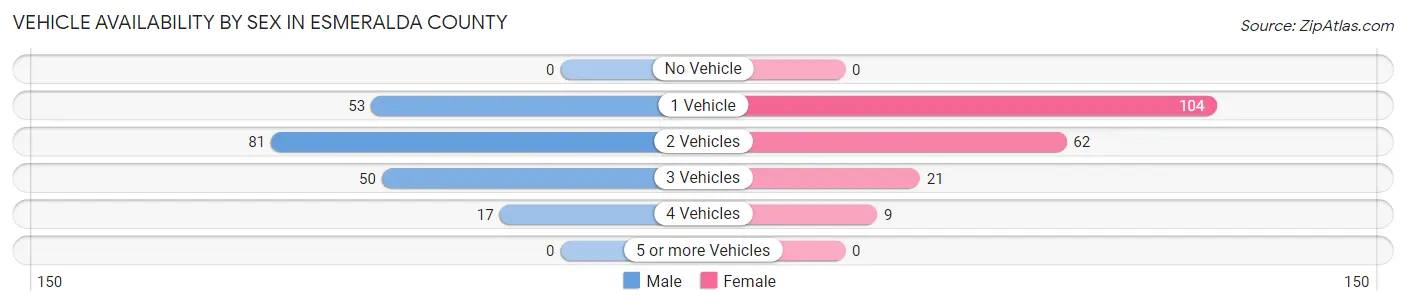
| Vehicles Available | Male | Female |
| No Vehicle | 0 (0.0%) | 0 (0.0%) |
| 1 Vehicle | 53 (26.4%) | 104 (53.1%) |
| 2 Vehicles | 81 (40.3%) | 62 (31.6%) |
| 3 Vehicles | 50 (24.9%) | 21 (10.7%) |
| 4 Vehicles | 17 (8.5%) | 9 (4.6%) |
| 5 or more Vehicles | 0 (0.0%) | 0 (0.0%) |
| Total | 201 (100.0%) | 196 (100.0%) |
Commute Time in Esmeralda County
The most frequently occuring commute durations in Esmeralda County are less than 5 minutes (107 commuters, 30.7%), 5 to 9 minutes (79 commuters, 22.7%), and 10 to 14 minutes (68 commuters, 19.5%).
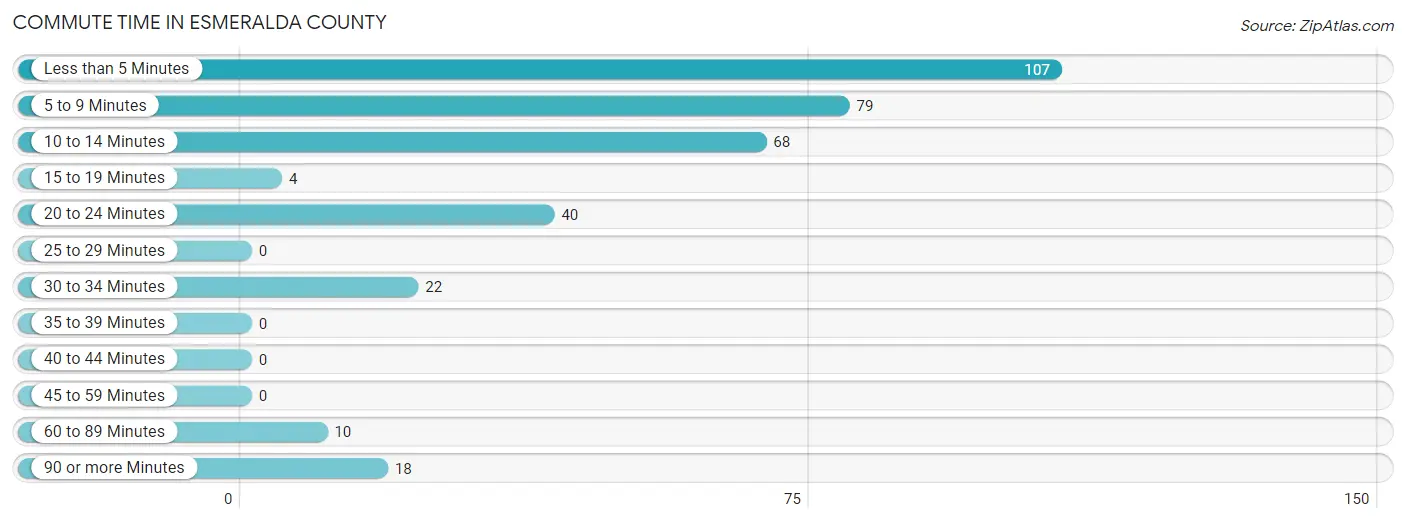
| Commute Time | # Commuters | % Commuters |
| Less than 5 Minutes | 107 | 30.7% |
| 5 to 9 Minutes | 79 | 22.7% |
| 10 to 14 Minutes | 68 | 19.5% |
| 15 to 19 Minutes | 4 | 1.1% |
| 20 to 24 Minutes | 40 | 11.5% |
| 25 to 29 Minutes | 0 | 0.0% |
| 30 to 34 Minutes | 22 | 6.3% |
| 35 to 39 Minutes | 0 | 0.0% |
| 40 to 44 Minutes | 0 | 0.0% |
| 45 to 59 Minutes | 0 | 0.0% |
| 60 to 89 Minutes | 10 | 2.9% |
| 90 or more Minutes | 18 | 5.2% |
Commute Time by Sex in Esmeralda County
The most common commute times in Esmeralda County are less than 5 minutes (42 commuters, 25.8%) for males and 10 to 14 minutes (68 commuters, 36.8%) for females.
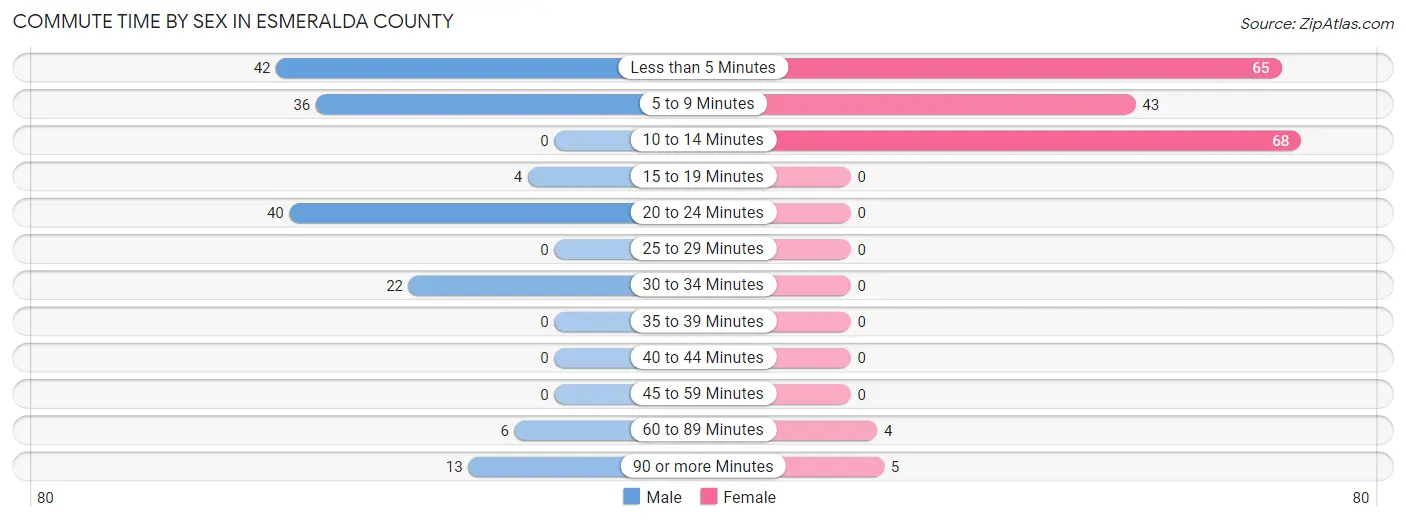
| Commute Time | Male | Female |
| Less than 5 Minutes | 42 (25.8%) | 65 (35.1%) |
| 5 to 9 Minutes | 36 (22.1%) | 43 (23.2%) |
| 10 to 14 Minutes | 0 (0.0%) | 68 (36.8%) |
| 15 to 19 Minutes | 4 (2.5%) | 0 (0.0%) |
| 20 to 24 Minutes | 40 (24.5%) | 0 (0.0%) |
| 25 to 29 Minutes | 0 (0.0%) | 0 (0.0%) |
| 30 to 34 Minutes | 22 (13.5%) | 0 (0.0%) |
| 35 to 39 Minutes | 0 (0.0%) | 0 (0.0%) |
| 40 to 44 Minutes | 0 (0.0%) | 0 (0.0%) |
| 45 to 59 Minutes | 0 (0.0%) | 0 (0.0%) |
| 60 to 89 Minutes | 6 (3.7%) | 4 (2.2%) |
| 90 or more Minutes | 13 (8.0%) | 5 (2.7%) |
Time of Departure to Work by Sex in Esmeralda County
The most frequent times of departure to work in Esmeralda County are 7:00 AM to 7:29 AM (54, 33.1%) for males and 7:30 AM to 7:59 AM (100, 54.0%) for females.
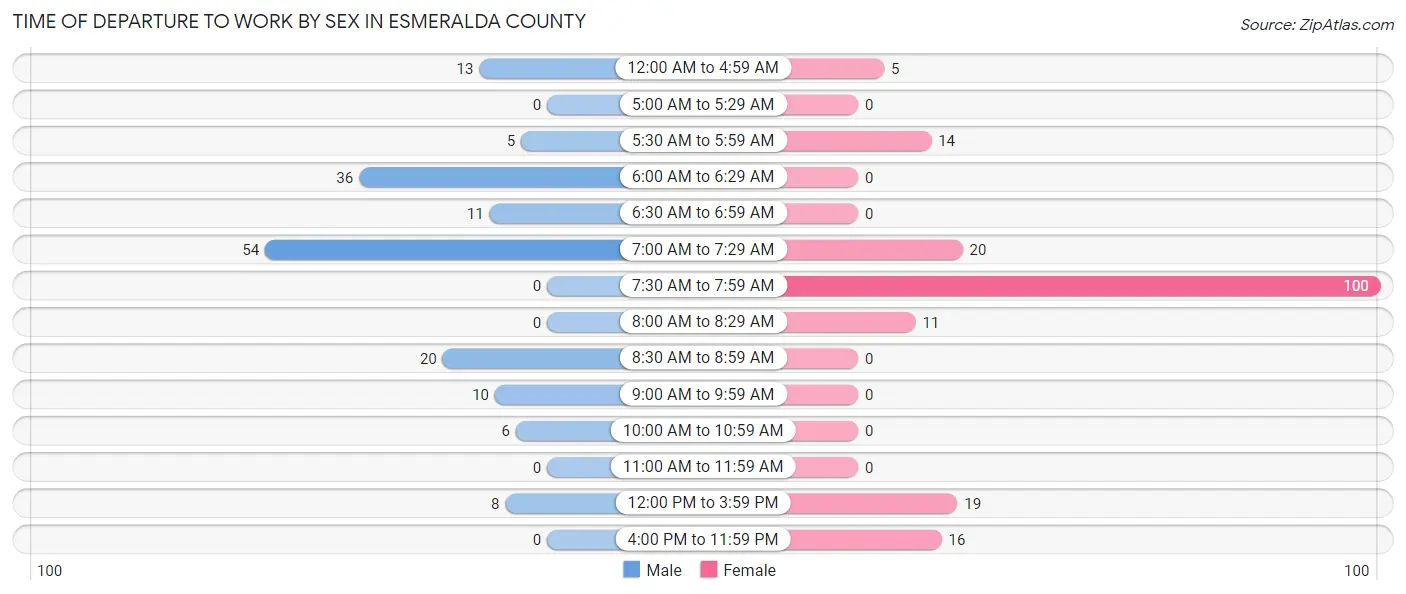
| Time of Departure | Male | Female |
| 12:00 AM to 4:59 AM | 13 (8.0%) | 5 (2.7%) |
| 5:00 AM to 5:29 AM | 0 (0.0%) | 0 (0.0%) |
| 5:30 AM to 5:59 AM | 5 (3.1%) | 14 (7.6%) |
| 6:00 AM to 6:29 AM | 36 (22.1%) | 0 (0.0%) |
| 6:30 AM to 6:59 AM | 11 (6.8%) | 0 (0.0%) |
| 7:00 AM to 7:29 AM | 54 (33.1%) | 20 (10.8%) |
| 7:30 AM to 7:59 AM | 0 (0.0%) | 100 (54.0%) |
| 8:00 AM to 8:29 AM | 0 (0.0%) | 11 (5.9%) |
| 8:30 AM to 8:59 AM | 20 (12.3%) | 0 (0.0%) |
| 9:00 AM to 9:59 AM | 10 (6.1%) | 0 (0.0%) |
| 10:00 AM to 10:59 AM | 6 (3.7%) | 0 (0.0%) |
| 11:00 AM to 11:59 AM | 0 (0.0%) | 0 (0.0%) |
| 12:00 PM to 3:59 PM | 8 (4.9%) | 19 (10.3%) |
| 4:00 PM to 11:59 PM | 0 (0.0%) | 16 (8.6%) |
| Total | 163 (100.0%) | 185 (100.0%) |
Housing Occupancy in Esmeralda County
Occupancy by Ownership in Esmeralda County
Of the total 485 dwellings in Esmeralda County, owner-occupied units account for 251 (51.7%), while renter-occupied units make up 234 (48.2%).
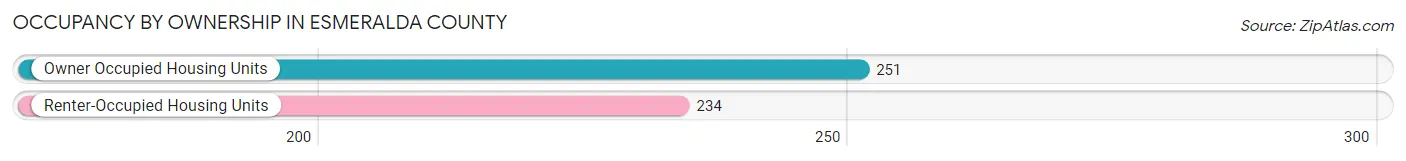
| Occupancy | # Housing Units | % Housing Units |
| Owner Occupied Housing Units | 251 | 51.7% |
| Renter-Occupied Housing Units | 234 | 48.2% |
| Total Occupied Housing Units | 485 | 100.0% |
Occupancy by Household Size in Esmeralda County
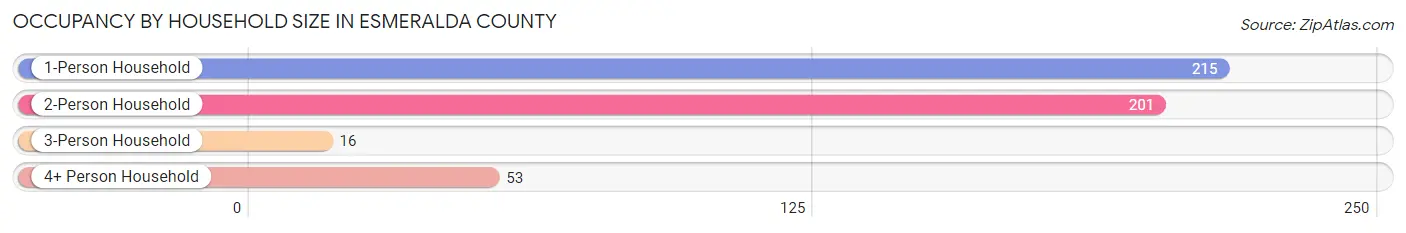
| Household Size | # Housing Units | % Housing Units |
| 1-Person Household | 215 | 44.3% |
| 2-Person Household | 201 | 41.4% |
| 3-Person Household | 16 | 3.3% |
| 4+ Person Household | 53 | 10.9% |
| Total Housing Units | 485 | 100.0% |
Occupancy by Ownership by Household Size in Esmeralda County
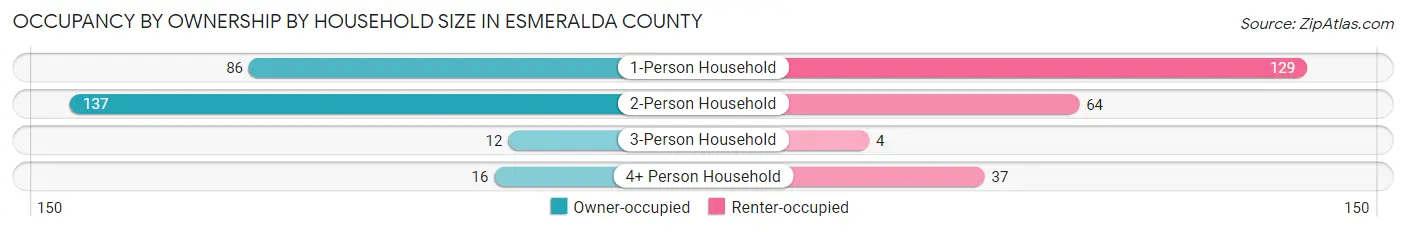
| Household Size | Owner-occupied | Renter-occupied |
| 1-Person Household | 86 (40.0%) | 129 (60.0%) |
| 2-Person Household | 137 (68.2%) | 64 (31.8%) |
| 3-Person Household | 12 (75.0%) | 4 (25.0%) |
| 4+ Person Household | 16 (30.2%) | 37 (69.8%) |
| Total Housing Units | 251 (51.7%) | 234 (48.2%) |
Occupancy by Educational Attainment in Esmeralda County
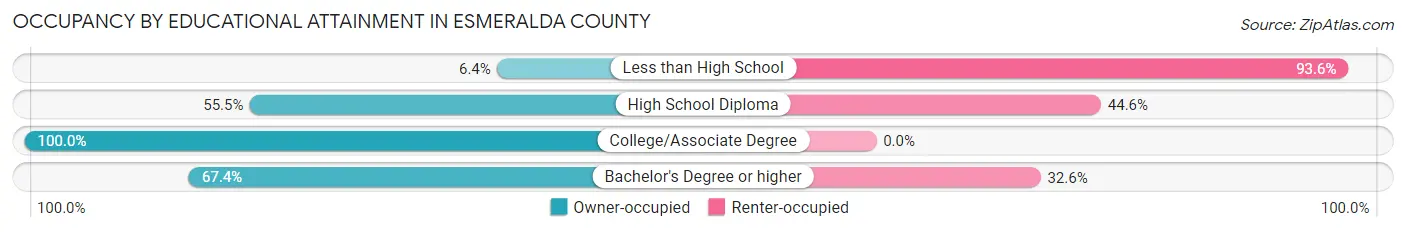
| Household Size | Owner-occupied | Renter-occupied |
| Less than High School | 10 (6.4%) | 146 (93.6%) |
| High School Diploma | 56 (55.4%) | 45 (44.6%) |
| College/Associate Degree | 96 (100.0%) | 0 (0.0%) |
| Bachelor's Degree or higher | 89 (67.4%) | 43 (32.6%) |
Occupancy by Age of Householder in Esmeralda County
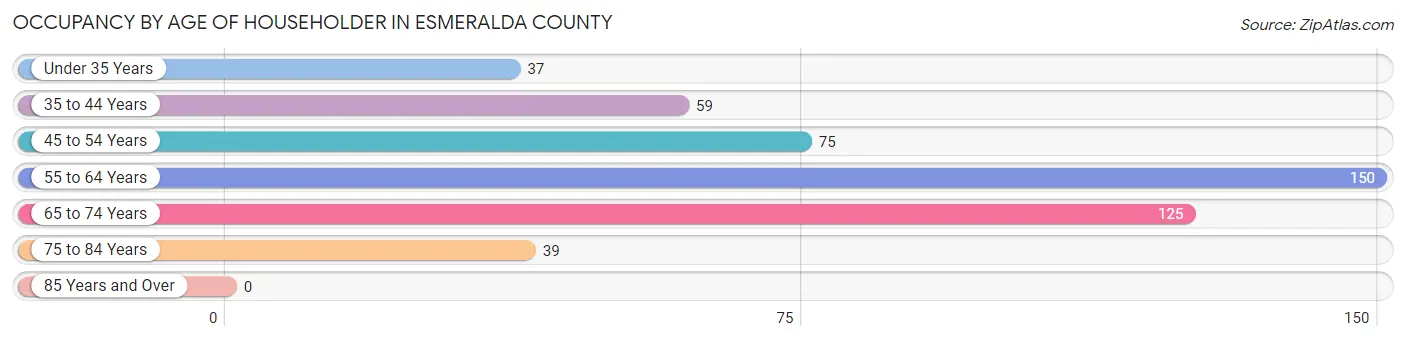
| Age Bracket | # Households | % Households |
| Under 35 Years | 37 | 7.6% |
| 35 to 44 Years | 59 | 12.2% |
| 45 to 54 Years | 75 | 15.5% |
| 55 to 64 Years | 150 | 30.9% |
| 65 to 74 Years | 125 | 25.8% |
| 75 to 84 Years | 39 | 8.0% |
| 85 Years and Over | 0 | 0.0% |
| Total | 485 | 100.0% |
Housing Finances in Esmeralda County
Median Income by Occupancy in Esmeralda County
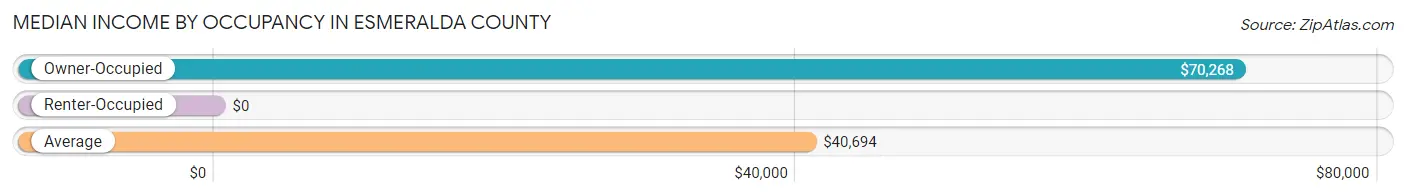
| Occupancy Type | # Households | Median Income |
| Owner-Occupied | 251 (51.7%) | $70,268 |
| Renter-Occupied | 234 (48.2%) | $0 |
| Average | 485 (100.0%) | $40,694 |
Occupancy by Householder Income Bracket in Esmeralda County
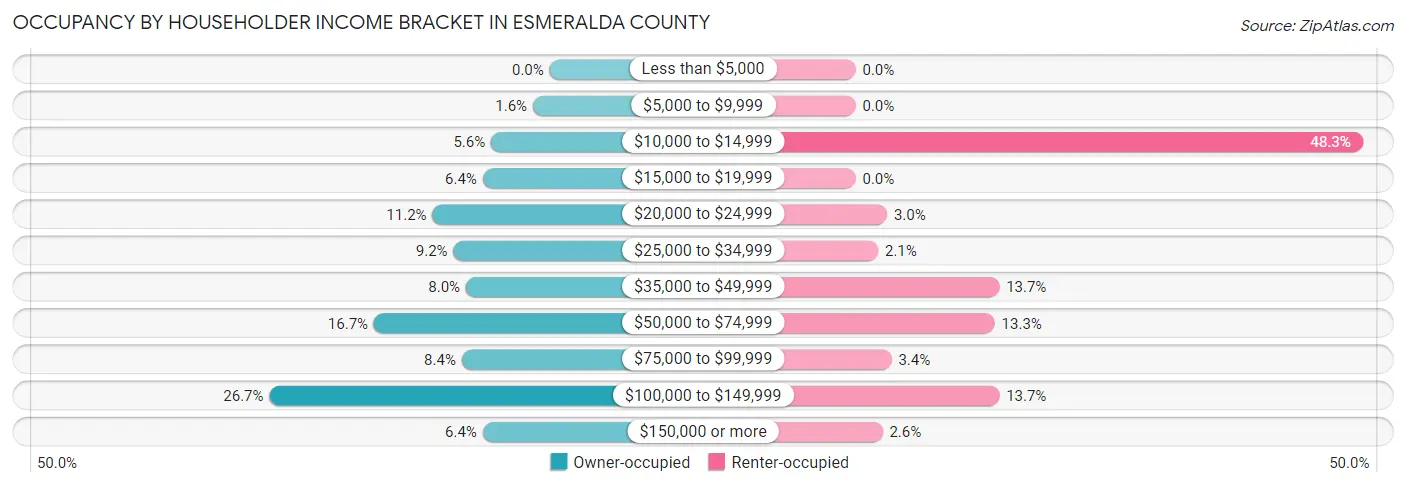
| Income Bracket | Owner-occupied | Renter-occupied |
| Less than $5,000 | 0 (0.0%) | 0 (0.0%) |
| $5,000 to $9,999 | 4 (1.6%) | 0 (0.0%) |
| $10,000 to $14,999 | 14 (5.6%) | 113 (48.3%) |
| $15,000 to $19,999 | 16 (6.4%) | 0 (0.0%) |
| $20,000 to $24,999 | 28 (11.2%) | 7 (3.0%) |
| $25,000 to $34,999 | 23 (9.2%) | 5 (2.1%) |
| $35,000 to $49,999 | 20 (8.0%) | 32 (13.7%) |
| $50,000 to $74,999 | 42 (16.7%) | 31 (13.3%) |
| $75,000 to $99,999 | 21 (8.4%) | 8 (3.4%) |
| $100,000 to $149,999 | 67 (26.7%) | 32 (13.7%) |
| $150,000 or more | 16 (6.4%) | 6 (2.6%) |
| Total | 251 (100.0%) | 234 (100.0%) |
Monthly Housing Cost Tiers in Esmeralda County
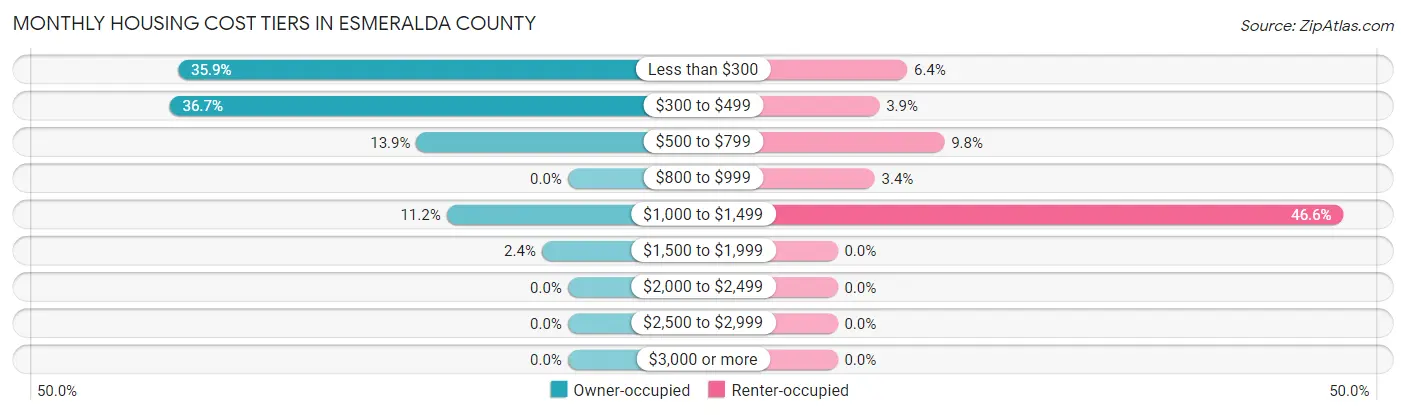
| Monthly Cost | Owner-occupied | Renter-occupied |
| Less than $300 | 90 (35.9%) | 15 (6.4%) |
| $300 to $499 | 92 (36.6%) | 9 (3.8%) |
| $500 to $799 | 35 (13.9%) | 23 (9.8%) |
| $800 to $999 | 0 (0.0%) | 8 (3.4%) |
| $1,000 to $1,499 | 28 (11.2%) | 109 (46.6%) |
| $1,500 to $1,999 | 6 (2.4%) | 0 (0.0%) |
| $2,000 to $2,499 | 0 (0.0%) | 0 (0.0%) |
| $2,500 to $2,999 | 0 (0.0%) | 0 (0.0%) |
| $3,000 or more | 0 (0.0%) | 0 (0.0%) |
| Total | 251 (100.0%) | 234 (100.0%) |
Physical Housing Characteristics in Esmeralda County
Housing Structures in Esmeralda County
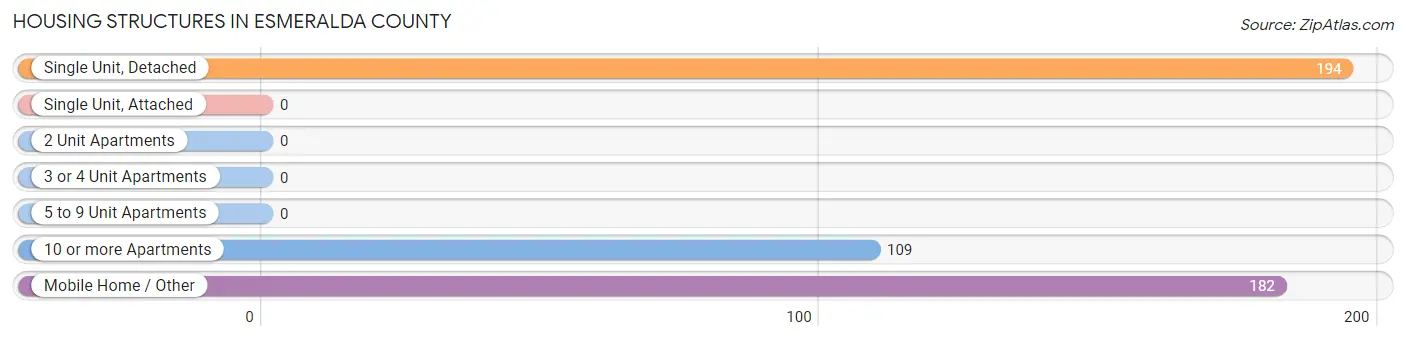
| Structure Type | # Housing Units | % Housing Units |
| Single Unit, Detached | 194 | 40.0% |
| Single Unit, Attached | 0 | 0.0% |
| 2 Unit Apartments | 0 | 0.0% |
| 3 or 4 Unit Apartments | 0 | 0.0% |
| 5 to 9 Unit Apartments | 0 | 0.0% |
| 10 or more Apartments | 109 | 22.5% |
| Mobile Home / Other | 182 | 37.5% |
| Total | 485 | 100.0% |
Housing Structures by Occupancy in Esmeralda County
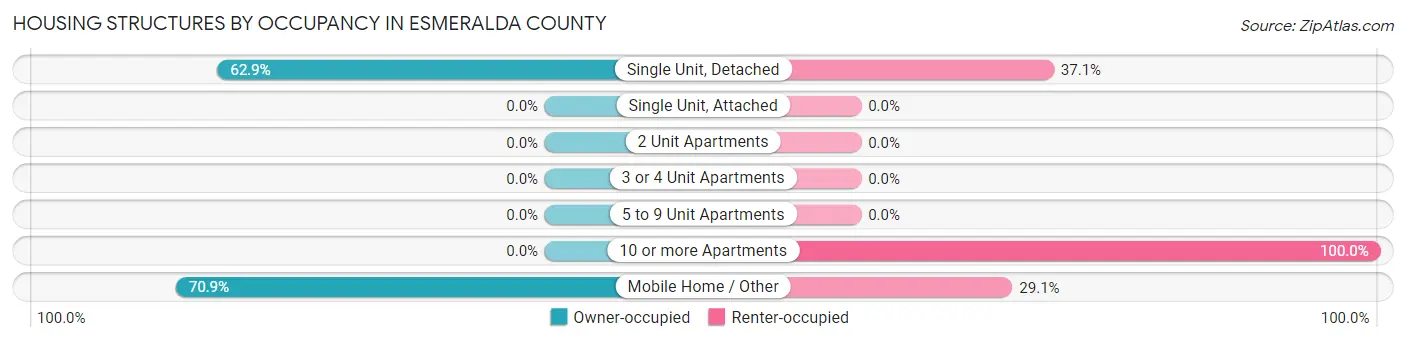
| Structure Type | Owner-occupied | Renter-occupied |
| Single Unit, Detached | 122 (62.9%) | 72 (37.1%) |
| Single Unit, Attached | 0 (0.0%) | 0 (0.0%) |
| 2 Unit Apartments | 0 (0.0%) | 0 (0.0%) |
| 3 or 4 Unit Apartments | 0 (0.0%) | 0 (0.0%) |
| 5 to 9 Unit Apartments | 0 (0.0%) | 0 (0.0%) |
| 10 or more Apartments | 0 (0.0%) | 109 (100.0%) |
| Mobile Home / Other | 129 (70.9%) | 53 (29.1%) |
| Total | 251 (51.7%) | 234 (48.2%) |
Housing Structures by Number of Rooms in Esmeralda County
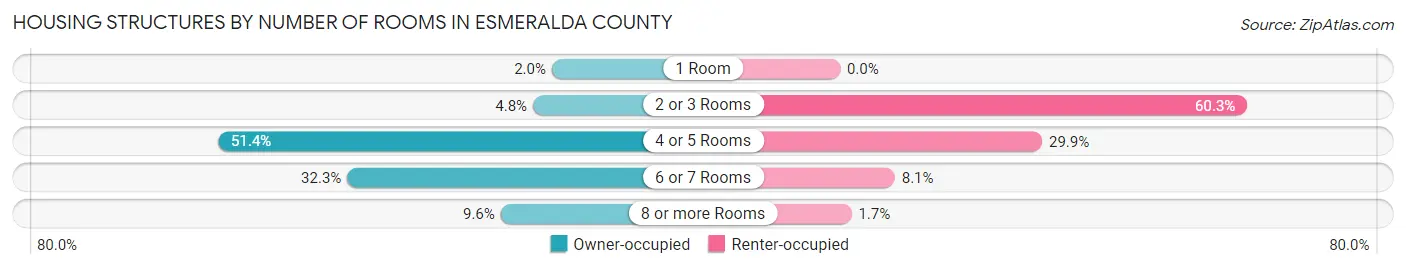
| Number of Rooms | Owner-occupied | Renter-occupied |
| 1 Room | 5 (2.0%) | 0 (0.0%) |
| 2 or 3 Rooms | 12 (4.8%) | 141 (60.3%) |
| 4 or 5 Rooms | 129 (51.4%) | 70 (29.9%) |
| 6 or 7 Rooms | 81 (32.3%) | 19 (8.1%) |
| 8 or more Rooms | 24 (9.6%) | 4 (1.7%) |
| Total | 251 (100.0%) | 234 (100.0%) |
Housing Structure by Heating Type in Esmeralda County
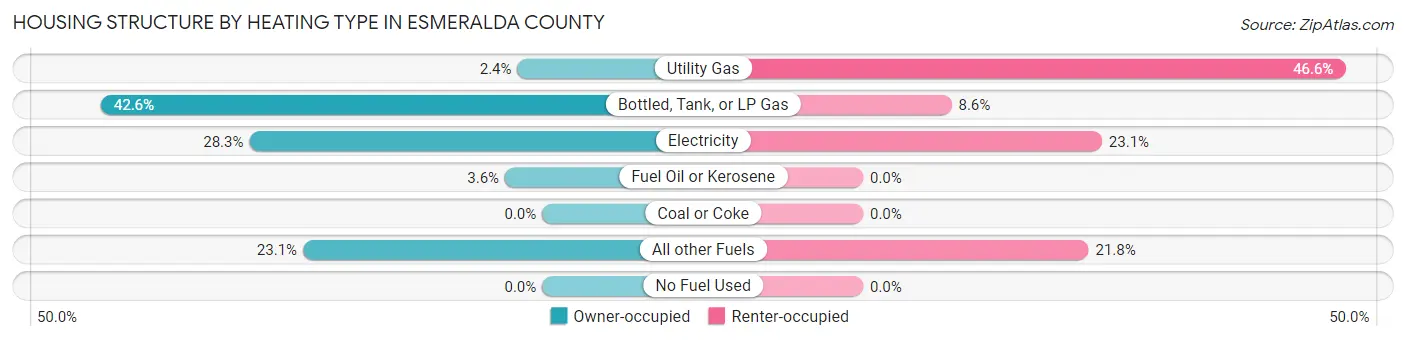
| Heating Type | Owner-occupied | Renter-occupied |
| Utility Gas | 6 (2.4%) | 109 (46.6%) |
| Bottled, Tank, or LP Gas | 107 (42.6%) | 20 (8.6%) |
| Electricity | 71 (28.3%) | 54 (23.1%) |
| Fuel Oil or Kerosene | 9 (3.6%) | 0 (0.0%) |
| Coal or Coke | 0 (0.0%) | 0 (0.0%) |
| All other Fuels | 58 (23.1%) | 51 (21.8%) |
| No Fuel Used | 0 (0.0%) | 0 (0.0%) |
| Total | 251 (100.0%) | 234 (100.0%) |
Household Vehicle Usage in Esmeralda County
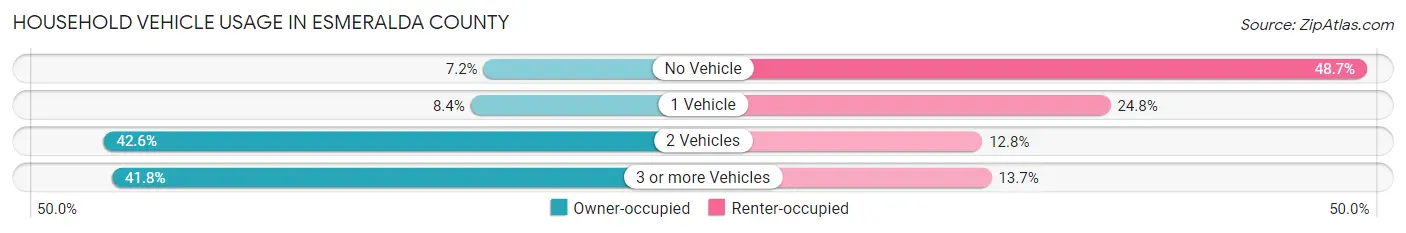
| Vehicles per Household | Owner-occupied | Renter-occupied |
| No Vehicle | 18 (7.2%) | 114 (48.7%) |
| 1 Vehicle | 21 (8.4%) | 58 (24.8%) |
| 2 Vehicles | 107 (42.6%) | 30 (12.8%) |
| 3 or more Vehicles | 105 (41.8%) | 32 (13.7%) |
| Total | 251 (100.0%) | 234 (100.0%) |
Real Estate & Mortgages in Esmeralda County
Real Estate and Mortgage Overview in Esmeralda County
| Characteristic | Without Mortgage | With Mortgage |
| Housing Units | 208 | 43 |
| Median Property Value | $68,800 | $197,500 |
| Median Household Income | $52,778 | $8 |
| Monthly Housing Costs | $347 | $0 |
| Real Estate Taxes | $560 | $0 |
Property Value by Mortgage Status in Esmeralda County
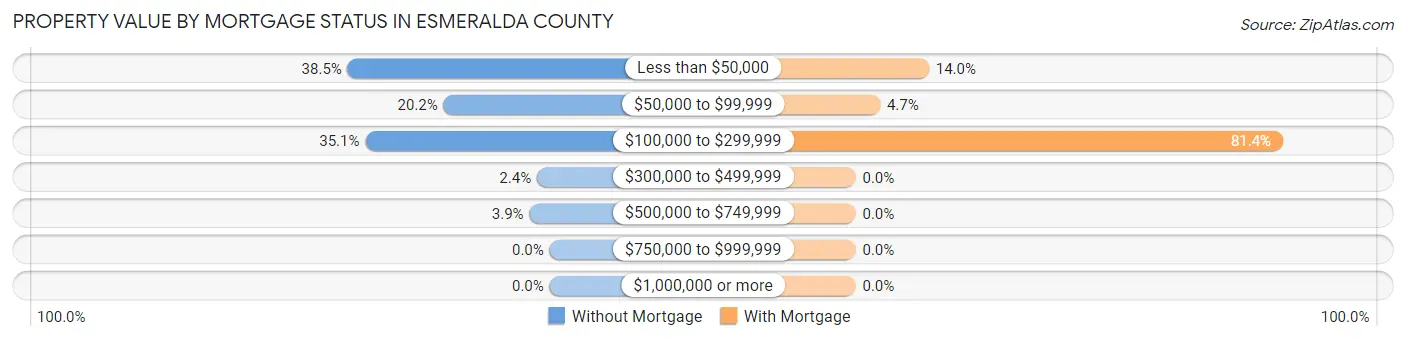
| Property Value | Without Mortgage | With Mortgage |
| Less than $50,000 | 80 (38.5%) | 6 (14.0%) |
| $50,000 to $99,999 | 42 (20.2%) | 2 (4.6%) |
| $100,000 to $299,999 | 73 (35.1%) | 35 (81.4%) |
| $300,000 to $499,999 | 5 (2.4%) | 0 (0.0%) |
| $500,000 to $749,999 | 8 (3.8%) | 0 (0.0%) |
| $750,000 to $999,999 | 0 (0.0%) | 0 (0.0%) |
| $1,000,000 or more | 0 (0.0%) | 0 (0.0%) |
| Total | 208 (100.0%) | 43 (100.0%) |
Household Income by Mortgage Status in Esmeralda County
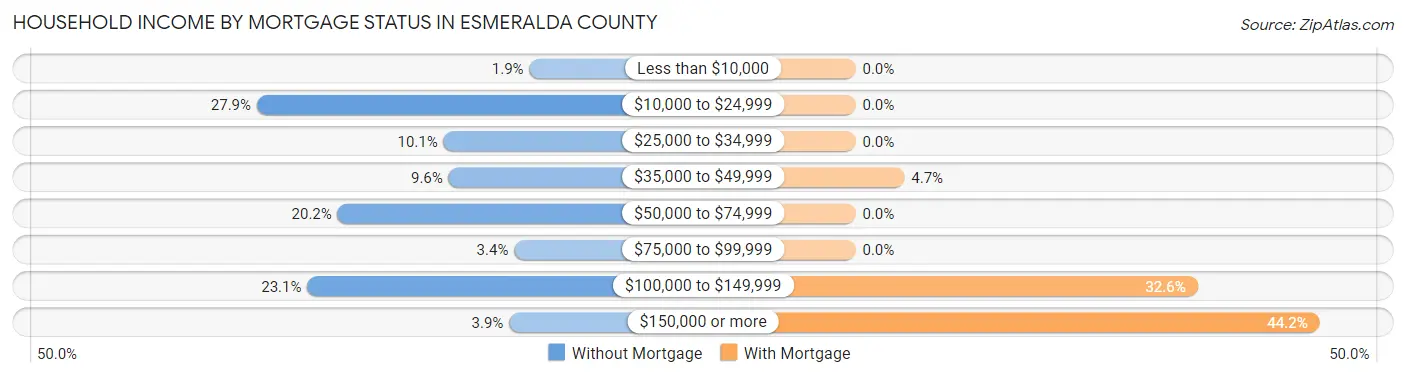
| Household Income | Without Mortgage | With Mortgage |
| Less than $10,000 | 4 (1.9%) | 0 (0.0%) |
| $10,000 to $24,999 | 58 (27.9%) | 0 (0.0%) |
| $25,000 to $34,999 | 21 (10.1%) | 0 (0.0%) |
| $35,000 to $49,999 | 20 (9.6%) | 2 (4.6%) |
| $50,000 to $74,999 | 42 (20.2%) | 0 (0.0%) |
| $75,000 to $99,999 | 7 (3.4%) | 0 (0.0%) |
| $100,000 to $149,999 | 48 (23.1%) | 14 (32.6%) |
| $150,000 or more | 8 (3.8%) | 19 (44.2%) |
| Total | 208 (100.0%) | 43 (100.0%) |
Property Value to Household Income Ratio in Esmeralda County
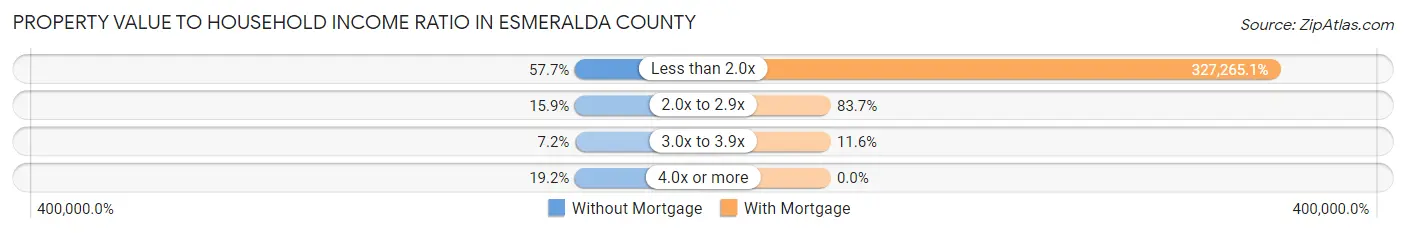
| Value-to-Income Ratio | Without Mortgage | With Mortgage |
| Less than 2.0x | 120 (57.7%) | 140,724 (327,265.1%) |
| 2.0x to 2.9x | 33 (15.9%) | 36 (83.7%) |
| 3.0x to 3.9x | 15 (7.2%) | 5 (11.6%) |
| 4.0x or more | 40 (19.2%) | 0 (0.0%) |
| Total | 208 (100.0%) | 43 (100.0%) |
Real Estate Taxes by Mortgage Status in Esmeralda County
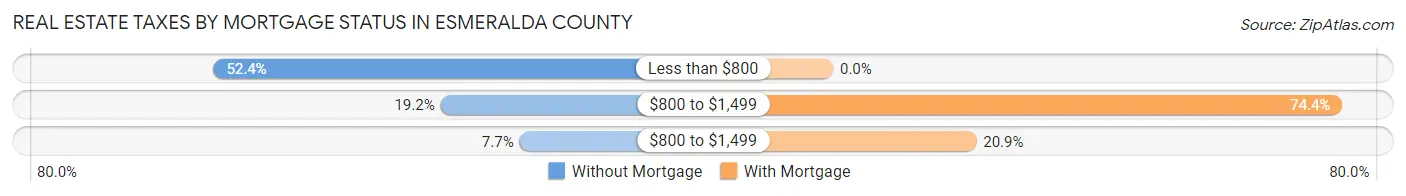
| Property Taxes | Without Mortgage | With Mortgage |
| Less than $800 | 109 (52.4%) | 0 (0.0%) |
| $800 to $1,499 | 40 (19.2%) | 32 (74.4%) |
| $800 to $1,499 | 16 (7.7%) | 9 (20.9%) |
| Total | 208 (100.0%) | 43 (100.0%) |
Health & Disability in Esmeralda County
Health Insurance Coverage by Age in Esmeralda County
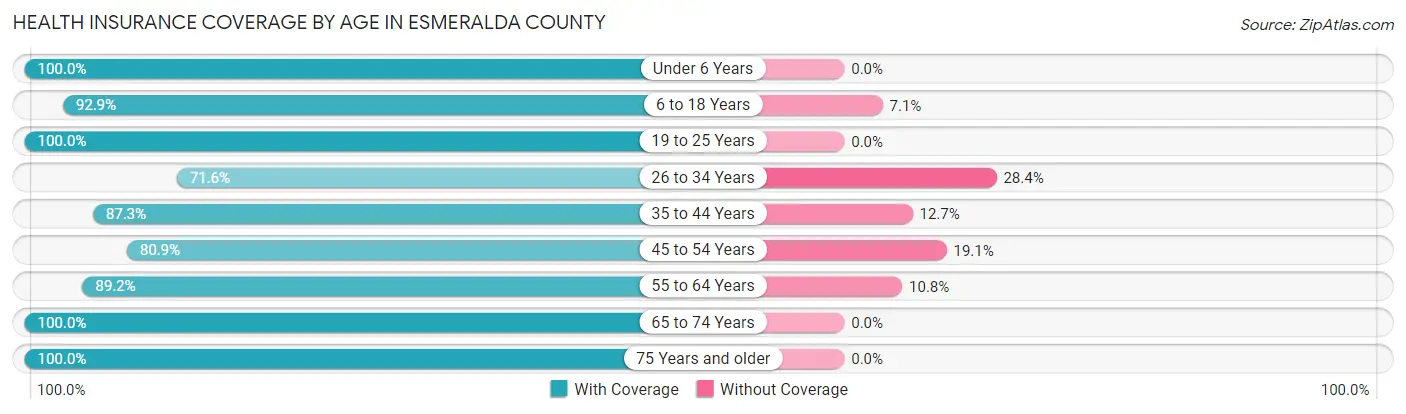
| Age Bracket | With Coverage | Without Coverage |
| Under 6 Years | 26 (100.0%) | 0 (0.0%) |
| 6 to 18 Years | 65 (92.9%) | 5 (7.1%) |
| 19 to 25 Years | 10 (100.0%) | 0 (0.0%) |
| 26 to 34 Years | 53 (71.6%) | 21 (28.4%) |
| 35 to 44 Years | 96 (87.3%) | 14 (12.7%) |
| 45 to 54 Years | 157 (80.9%) | 37 (19.1%) |
| 55 to 64 Years | 207 (89.2%) | 25 (10.8%) |
| 65 to 74 Years | 188 (100.0%) | 0 (0.0%) |
| 75 Years and older | 69 (100.0%) | 0 (0.0%) |
| Total | 871 (89.5%) | 102 (10.5%) |
Health Insurance Coverage by Citizenship Status in Esmeralda County

| Citizenship Status | With Coverage | Without Coverage |
| Native Born | 26 (100.0%) | 0 (0.0%) |
| Foreign Born, Citizen | 65 (92.9%) | 5 (7.1%) |
| Foreign Born, not a Citizen | 10 (100.0%) | 0 (0.0%) |
Health Insurance Coverage by Household Income in Esmeralda County
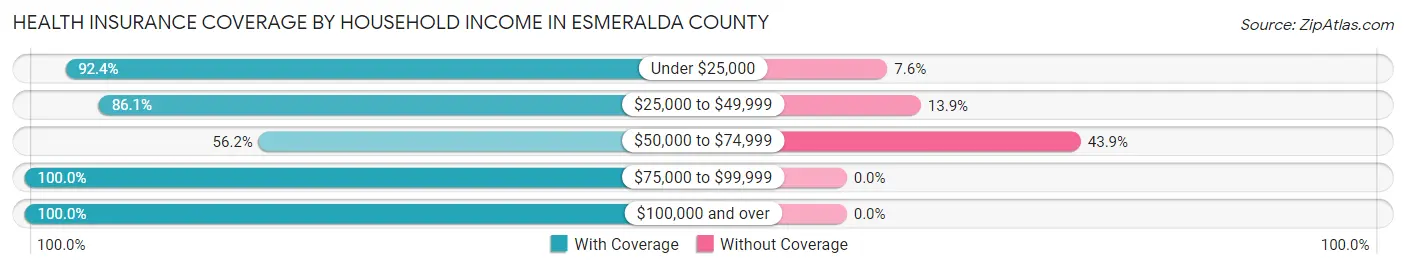
| Household Income | With Coverage | Without Coverage |
| Under $25,000 | 182 (92.4%) | 15 (7.6%) |
| $25,000 to $49,999 | 186 (86.1%) | 30 (13.9%) |
| $50,000 to $74,999 | 73 (56.1%) | 57 (43.9%) |
| $75,000 to $99,999 | 64 (100.0%) | 0 (0.0%) |
| $100,000 and over | 366 (100.0%) | 0 (0.0%) |
Public vs Private Health Insurance Coverage by Age in Esmeralda County
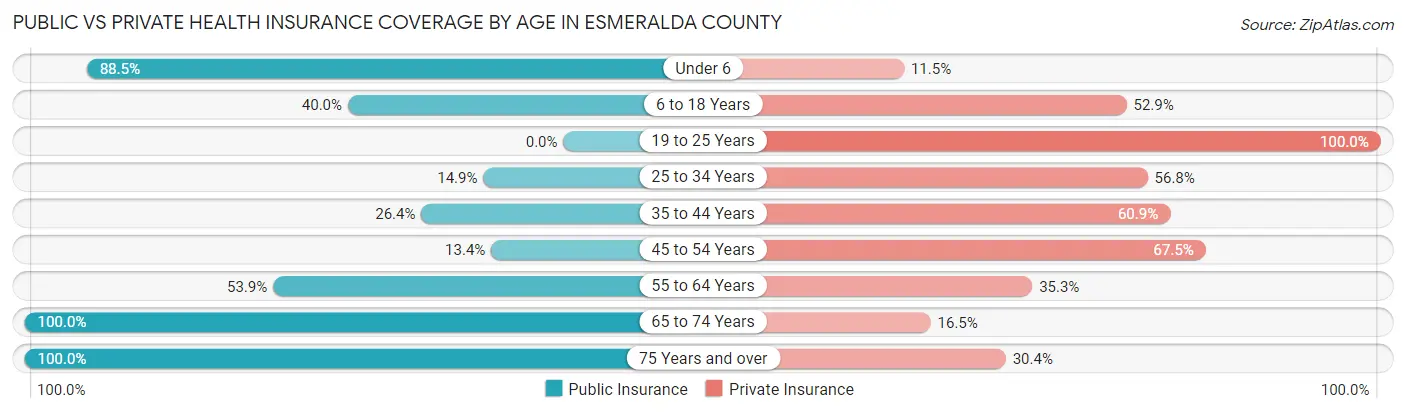
| Age Bracket | Public Insurance | Private Insurance |
| Under 6 | 23 (88.5%) | 3 (11.5%) |
| 6 to 18 Years | 28 (40.0%) | 37 (52.9%) |
| 19 to 25 Years | 0 (0.0%) | 10 (100.0%) |
| 25 to 34 Years | 11 (14.9%) | 42 (56.8%) |
| 35 to 44 Years | 29 (26.4%) | 67 (60.9%) |
| 45 to 54 Years | 26 (13.4%) | 131 (67.5%) |
| 55 to 64 Years | 125 (53.9%) | 82 (35.3%) |
| 65 to 74 Years | 188 (100.0%) | 31 (16.5%) |
| 75 Years and over | 69 (100.0%) | 21 (30.4%) |
| Total | 499 (51.3%) | 424 (43.6%) |
Disability Status by Sex by Age in Esmeralda County
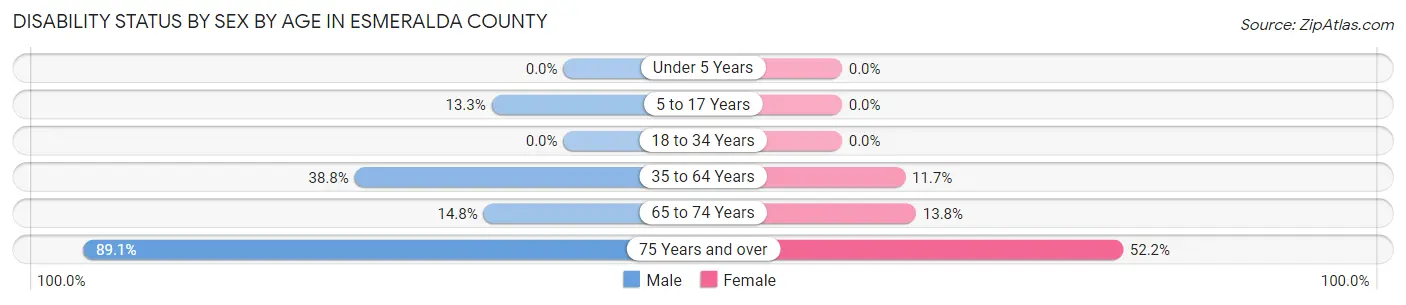
| Age Bracket | Male | Female |
| Under 5 Years | 0 (0.0%) | 0 (0.0%) |
| 5 to 17 Years | 4 (13.3%) | 0 (0.0%) |
| 18 to 34 Years | 0 (0.0%) | 0 (0.0%) |
| 35 to 64 Years | 112 (38.8%) | 29 (11.7%) |
| 65 to 74 Years | 16 (14.8%) | 11 (13.8%) |
| 75 Years and over | 41 (89.1%) | 12 (52.2%) |
Disability Class by Sex by Age in Esmeralda County
Disability Class: Hearing Difficulty
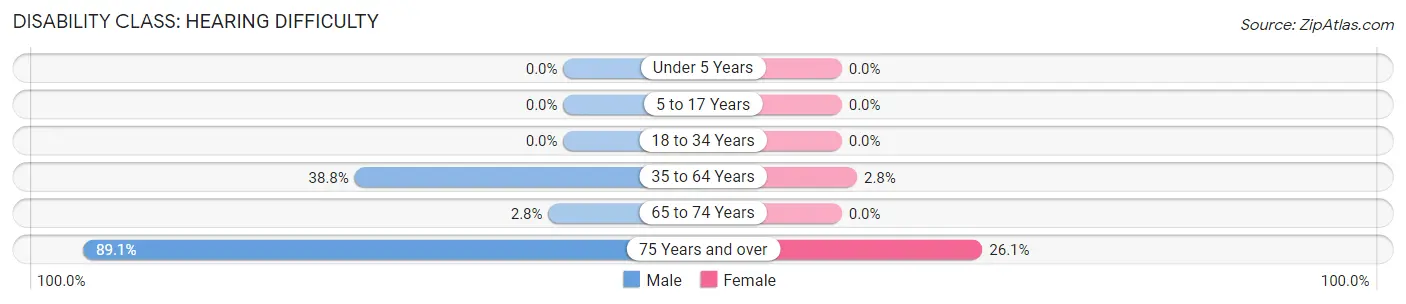
| Age Bracket | Male | Female |
| Under 5 Years | 0 (0.0%) | 0 (0.0%) |
| 5 to 17 Years | 0 (0.0%) | 0 (0.0%) |
| 18 to 34 Years | 0 (0.0%) | 0 (0.0%) |
| 35 to 64 Years | 112 (38.8%) | 7 (2.8%) |
| 65 to 74 Years | 3 (2.8%) | 0 (0.0%) |
| 75 Years and over | 41 (89.1%) | 6 (26.1%) |
Disability Class: Vision Difficulty
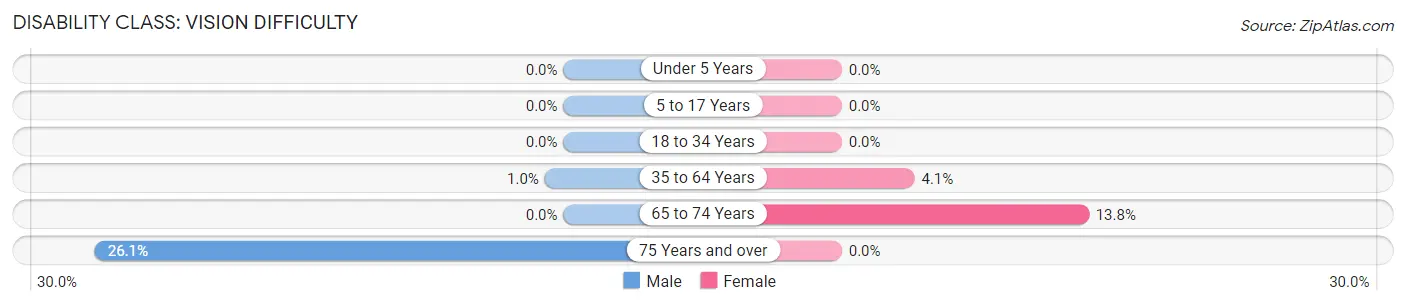
| Age Bracket | Male | Female |
| Under 5 Years | 0 (0.0%) | 0 (0.0%) |
| 5 to 17 Years | 0 (0.0%) | 0 (0.0%) |
| 18 to 34 Years | 0 (0.0%) | 0 (0.0%) |
| 35 to 64 Years | 3 (1.0%) | 10 (4.1%) |
| 65 to 74 Years | 0 (0.0%) | 11 (13.8%) |
| 75 Years and over | 12 (26.1%) | 0 (0.0%) |
Disability Class: Cognitive Difficulty
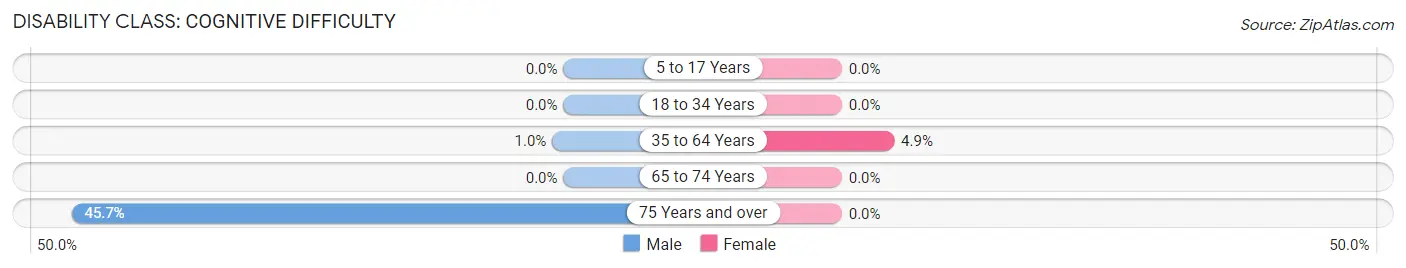
| Age Bracket | Male | Female |
| 5 to 17 Years | 0 (0.0%) | 0 (0.0%) |
| 18 to 34 Years | 0 (0.0%) | 0 (0.0%) |
| 35 to 64 Years | 3 (1.0%) | 12 (4.9%) |
| 65 to 74 Years | 0 (0.0%) | 0 (0.0%) |
| 75 Years and over | 21 (45.7%) | 0 (0.0%) |
Disability Class: Ambulatory Difficulty
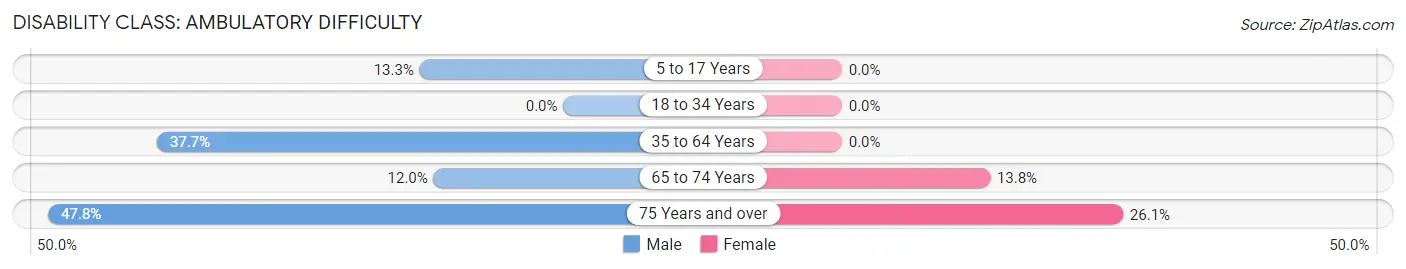
| Age Bracket | Male | Female |
| 5 to 17 Years | 4 (13.3%) | 0 (0.0%) |
| 18 to 34 Years | 0 (0.0%) | 0 (0.0%) |
| 35 to 64 Years | 109 (37.7%) | 0 (0.0%) |
| 65 to 74 Years | 13 (12.0%) | 11 (13.8%) |
| 75 Years and over | 22 (47.8%) | 6 (26.1%) |
Disability Class: Self-Care Difficulty
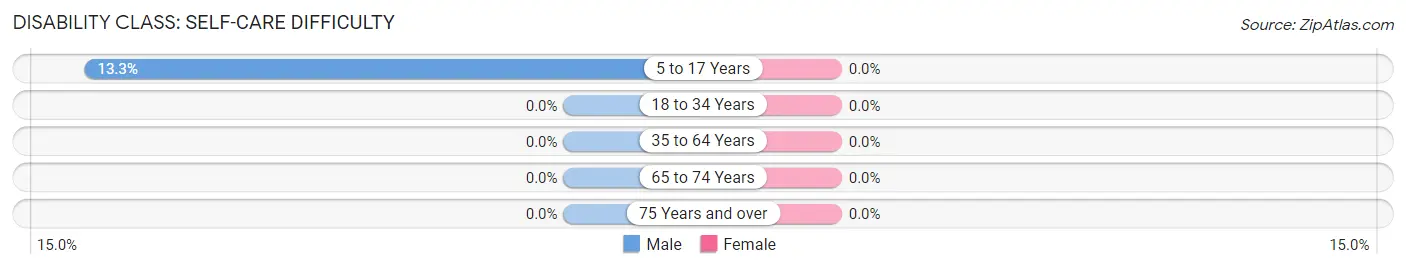
| Age Bracket | Male | Female |
| 5 to 17 Years | 4 (13.3%) | 0 (0.0%) |
| 18 to 34 Years | 0 (0.0%) | 0 (0.0%) |
| 35 to 64 Years | 0 (0.0%) | 0 (0.0%) |
| 65 to 74 Years | 0 (0.0%) | 0 (0.0%) |
| 75 Years and over | 0 (0.0%) | 0 (0.0%) |
Technology Access in Esmeralda County
Computing Device Access in Esmeralda County
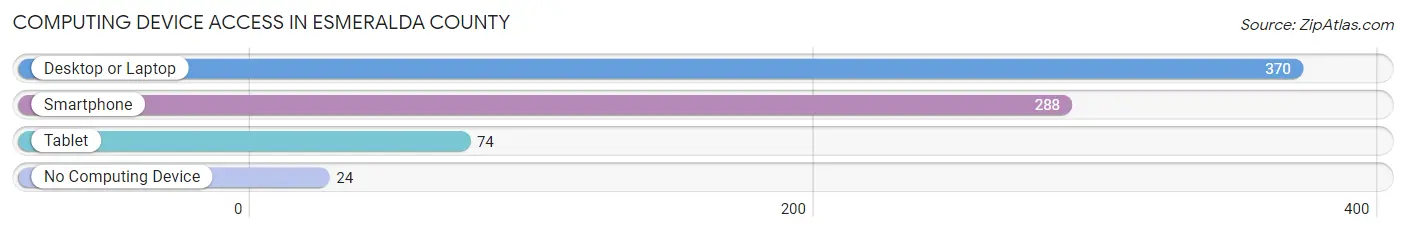
| Device Type | # Households | % Households |
| Desktop or Laptop | 370 | 76.3% |
| Smartphone | 288 | 59.4% |
| Tablet | 74 | 15.3% |
| No Computing Device | 24 | 5.0% |
| Total | 485 | 100.0% |
Internet Access in Esmeralda County
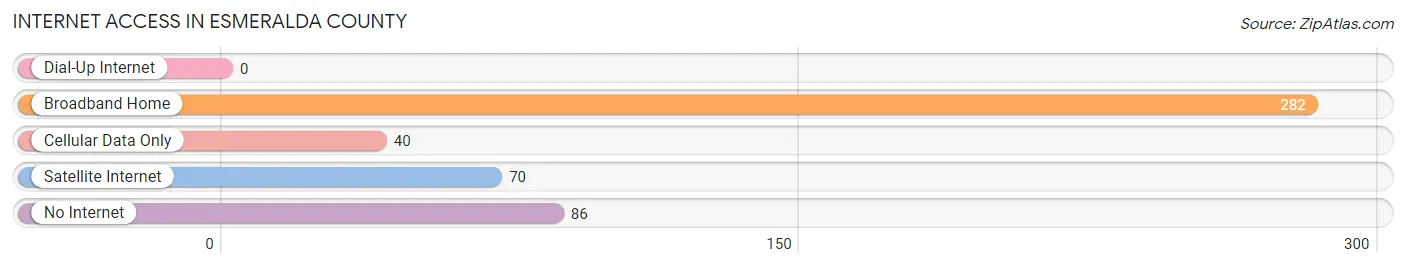
| Internet Type | # Households | % Households |
| Dial-Up Internet | 0 | 0.0% |
| Broadband Home | 282 | 58.1% |
| Cellular Data Only | 40 | 8.3% |
| Satellite Internet | 70 | 14.4% |
| No Internet | 86 | 17.7% |
| Total | 485 | 100.0% |
Esmeralda County Summary
Esmeralda County is located in the western part of the state of Nevada, in the United States. It is bordered by Nye County to the north, Mineral County to the east, and Mono County, California to the south and west. The county seat is the town of Goldfield, which is located in the center of the county. The county was established in 1861 and named after the Spanish word for emerald.
Geography
Esmeralda County covers an area of 4,541 square miles, making it the fifth-largest county in Nevada. The county is located in the Basin and Range Province, and is characterized by a series of mountain ranges and valleys. The highest point in the county is the summit of Mount Magruder, which rises to an elevation of 11,845 feet. The lowest point is the valley floor of the Fish Lake Valley, which is at an elevation of 4,000 feet.
The county is home to several natural features, including the Fish Lake Valley, the Toiyabe National Forest, and the Toiyabe Range. The county is also home to several ghost towns, including Goldfield, Silver Peak, and Tonopah.
Climate
Esmeralda County has a semi-arid climate, with hot summers and cold winters. The average annual temperature is 54°F, and the average annual precipitation is 8.5 inches.
Demographics
As of the 2010 census, the population of Esmeralda County was 783, making it the second-least populous county in Nevada. The population density was 0.2 people per square mile. The racial makeup of the county was 81.3% White, 0.3% African American, 1.2% Native American, 0.2% Asian, 0.1% Pacific Islander, 15.2% from other races, and 1.9% from two or more races. Hispanic or Latino of any race were 24.3% of the population.
Economy
Esmeralda County has a largely rural economy, with the majority of the population employed in agriculture and mining. The county is home to several gold mines, including the Goldfield Consolidated Mines Company, which was once the largest gold producer in the United States. The county is also home to several ranches, which raise cattle and sheep.
The county is home to several small businesses, including restaurants, hotels, and retail stores. The county is also home to several tourist attractions, including the Goldfield Historic District, the Tonopah Historic Mining Park, and the Silver Peak Ghost Town.
Conclusion
Esmeralda County is a rural county located in the western part of Nevada. It is characterized by a semi-arid climate, with hot summers and cold winters. The county has a population of 783, and is largely employed in agriculture and mining. The county is home to several tourist attractions, including the Goldfield Historic District, the Tonopah Historic Mining Park, and the Silver Peak Ghost Town.
Common Questions
What is Per Capita Income in Esmeralda County?
Per Capita income in Esmeralda County is $31,776.
What is the Median Family Income in Esmeralda County?
Median Family Income in Esmeralda County is $102,583.
What is the Median Household income in Esmeralda County?
Median Household Income in Esmeralda County is $40,694.
What is Inequality or Gini Index in Esmeralda County?
Inequality or Gini Index in Esmeralda County is 0.46.
What is the Total Population of Esmeralda County?
Total Population of Esmeralda County is 980.
What is the Total Male Population of Esmeralda County?
Total Male Population of Esmeralda County is 529.
What is the Total Female Population of Esmeralda County?
Total Female Population of Esmeralda County is 451.
What is the Ratio of Males per 100 Females in Esmeralda County?
There are 117.29 Males per 100 Females in Esmeralda County.
What is the Ratio of Females per 100 Males in Esmeralda County?
There are 85.26 Females per 100 Males in Esmeralda County.
What is the Median Population Age in Esmeralda County?
Median Population Age in Esmeralda County is 55.0 Years.
What is the Average Family Size in Esmeralda County
Average Family Size in Esmeralda County is 2.9 People.
What is the Average Household Size in Esmeralda County
Average Household Size in Esmeralda County is 2.0 People.
How Large is the Labor Force in Esmeralda County?
There are 429 People in the Labor Forcein in Esmeralda County.
What is the Percentage of People in the Labor Force in Esmeralda County?
47.7% of People are in the Labor Force in Esmeralda County.
What is the Unemployment Rate in Esmeralda County?
Unemployment Rate in Esmeralda County is 4.7%.