Elko County, NV Map & Demographics
Elko County Map
Elko County Overview
$39,001
PER CAPITA INCOME
$100,342
AVG FAMILY INCOME
$87,755
AVG HOUSEHOLD INCOME
45.7%
WAGE / INCOME GAP [ % ]
54.3¢/ $1
WAGE / INCOME GAP [ $ ]
$9,228
FAMILY INCOME DEFICIT
0.41
INEQUALITY / GINI INDEX
53,600
TOTAL POPULATION
28,070
MALE POPULATION
25,530
FEMALE POPULATION
109.95
MALES / 100 FEMALES
90.95
FEMALES / 100 MALES
34.9
MEDIAN AGE
3.4
AVG FAMILY SIZE
2.8
AVG HOUSEHOLD SIZE
27,611
LABOR FORCE [ PEOPLE ]
67.1%
PERCENT IN LABOR FORCE
4.7%
UNEMPLOYMENT RATE
Elko County Area Codes
Income in Elko County
Income Overview in Elko County
Per Capita Income in Elko County is $39,001, while median incomes of families and households are $100,342 and $87,755 respectively.
| Characteristic | Number | Measure |
| Per Capita Income | 53,600 | $39,001 |
| Median Family Income | 13,043 | $100,342 |
| Mean Family Income | 13,043 | $117,585 |
| Median Household Income | 19,032 | $87,755 |
| Mean Household Income | 19,032 | $103,071 |
| Income Deficit | 13,043 | $9,228 |
| Wage / Income Gap (%) | 53,600 | 45.66% |
| Wage / Income Gap ($) | 53,600 | 54.34¢ per $1 |
| Gini / Inequality Index | 53,600 | 0.41 |
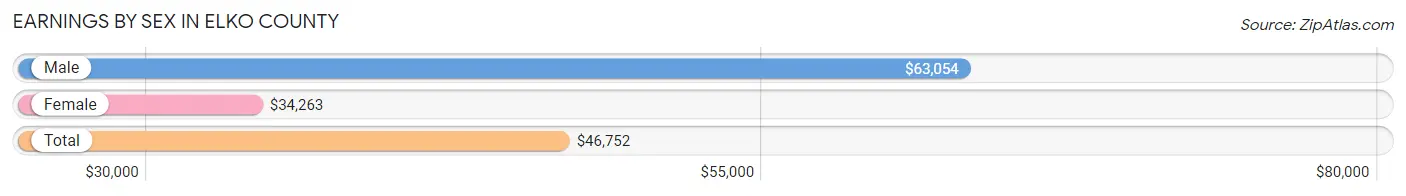
Earnings by Sex in Elko County
Average Earnings in Elko County are $46,752, $63,054 for men and $34,263 for women, a difference of 45.7%.
| Sex | Number | Average Earnings |
| Male | 16,756 (58.3%) | $63,054 |
| Female | 11,987 (41.7%) | $34,263 |
| Total | 28,743 (100.0%) | $46,752 |
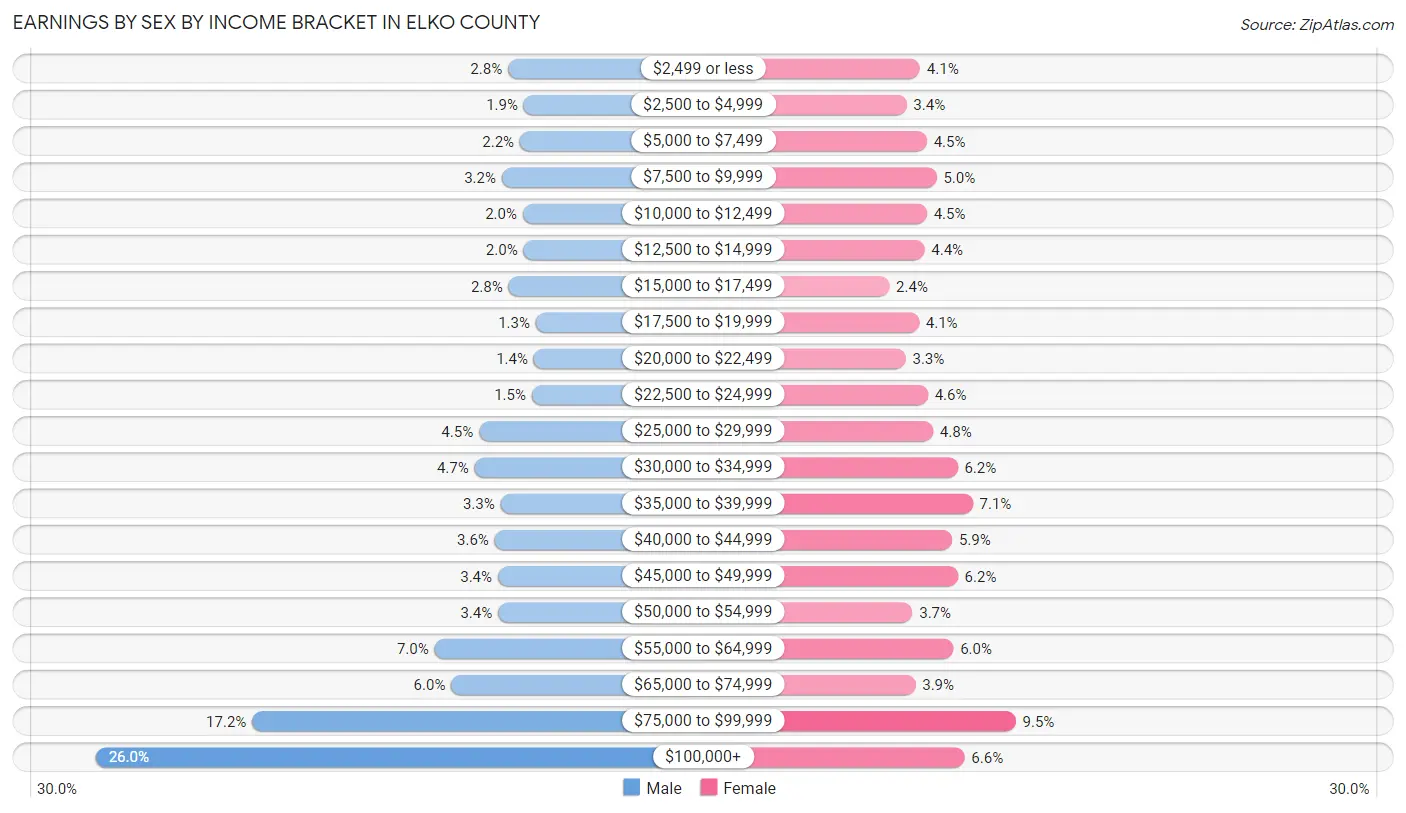
Earnings by Sex by Income Bracket in Elko County
The most common earnings brackets in Elko County are $100,000+ for men (4,356 | 26.0%) and $75,000 to $99,999 for women (1,138 | 9.5%).
| Income | Male | Female |
| $2,499 or less | 475 (2.8%) | 493 (4.1%) |
| $2,500 to $4,999 | 325 (1.9%) | 401 (3.4%) |
| $5,000 to $7,499 | 362 (2.2%) | 538 (4.5%) |
| $7,500 to $9,999 | 533 (3.2%) | 604 (5.0%) |
| $10,000 to $12,499 | 335 (2.0%) | 538 (4.5%) |
| $12,500 to $14,999 | 329 (2.0%) | 523 (4.4%) |
| $15,000 to $17,499 | 470 (2.8%) | 285 (2.4%) |
| $17,500 to $19,999 | 213 (1.3%) | 486 (4.1%) |
| $20,000 to $22,499 | 231 (1.4%) | 396 (3.3%) |
| $22,500 to $24,999 | 249 (1.5%) | 546 (4.5%) |
| $25,000 to $29,999 | 747 (4.5%) | 580 (4.8%) |
| $30,000 to $34,999 | 790 (4.7%) | 745 (6.2%) |
| $35,000 to $39,999 | 545 (3.3%) | 847 (7.1%) |
| $40,000 to $44,999 | 600 (3.6%) | 709 (5.9%) |
| $45,000 to $49,999 | 569 (3.4%) | 747 (6.2%) |
| $50,000 to $54,999 | 568 (3.4%) | 441 (3.7%) |
| $55,000 to $64,999 | 1,167 (7.0%) | 717 (6.0%) |
| $65,000 to $74,999 | 1,008 (6.0%) | 461 (3.8%) |
| $75,000 to $99,999 | 2,884 (17.2%) | 1,138 (9.5%) |
| $100,000+ | 4,356 (26.0%) | 792 (6.6%) |
| Total | 16,756 (100.0%) | 11,987 (100.0%) |
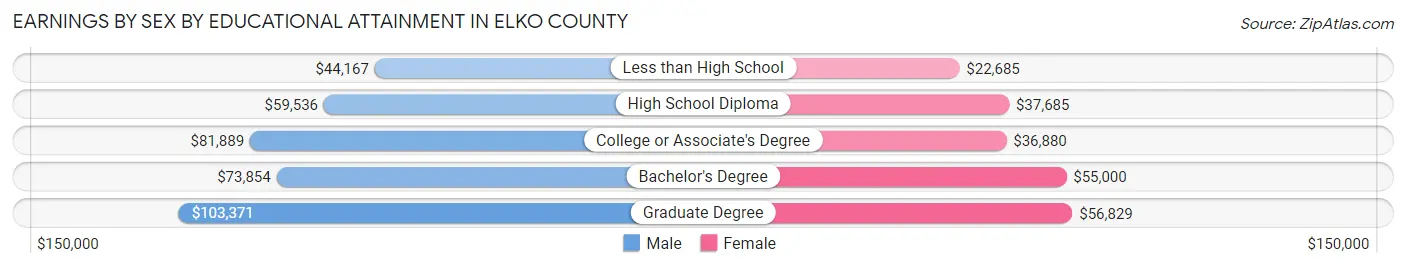
Earnings by Sex by Educational Attainment in Elko County
Average earnings in Elko County are $74,479 for men and $38,454 for women, a difference of 48.4%. Men with an educational attainment of graduate degree enjoy the highest average annual earnings of $103,371, while those with less than high school education earn the least with $44,167. Women with an educational attainment of graduate degree earn the most with the average annual earnings of $56,829, while those with less than high school education have the smallest earnings of $22,685.
| Educational Attainment | Male Income | Female Income |
| Less than High School | $44,167 | $22,685 |
| High School Diploma | $59,536 | $37,685 |
| College or Associate's Degree | $81,889 | $36,880 |
| Bachelor's Degree | $73,854 | $55,000 |
| Graduate Degree | $103,371 | $56,829 |
| Total | $74,479 | $38,454 |
Family Income in Elko County
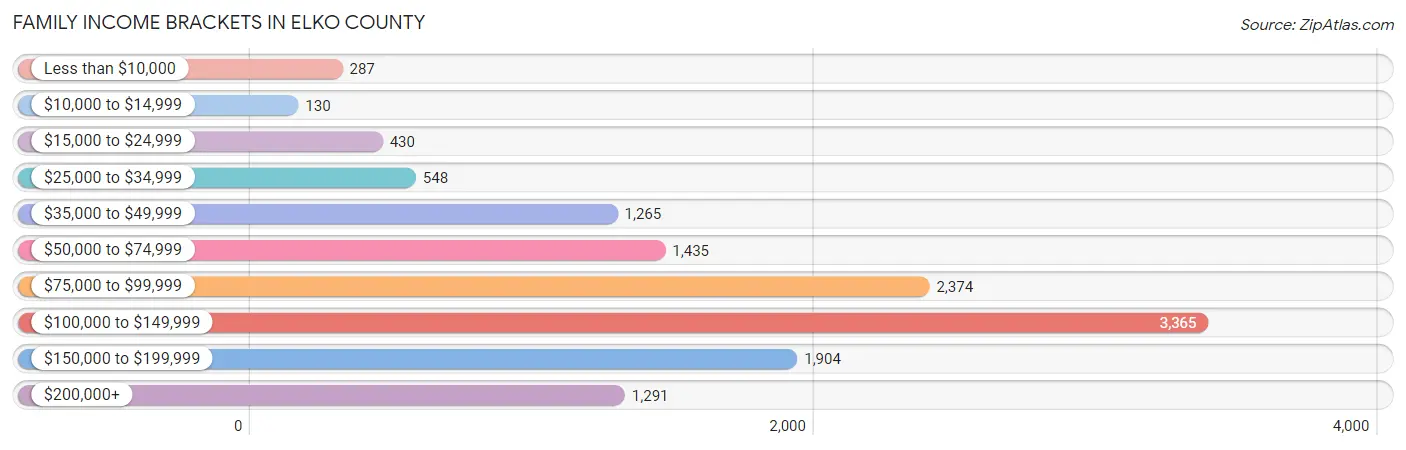
Family Income Brackets in Elko County
According to the Elko County family income data, there are 3,365 families falling into the $100,000 to $149,999 income range, which is the most common income bracket and makes up 25.8% of all families. Conversely, the $10,000 to $14,999 income bracket is the least frequent group with only 130 families (1.0%) belonging to this category.
| Income Bracket | # Families | % Families |
| Less than $10,000 | 287 | 2.2% |
| $10,000 to $14,999 | 130 | 1.0% |
| $15,000 to $24,999 | 430 | 3.3% |
| $25,000 to $34,999 | 548 | 4.2% |
| $35,000 to $49,999 | 1,265 | 9.7% |
| $50,000 to $74,999 | 1,435 | 11.0% |
| $75,000 to $99,999 | 2,374 | 18.2% |
| $100,000 to $149,999 | 3,365 | 25.8% |
| $150,000 to $199,999 | 1,904 | 14.6% |
| $200,000+ | 1,291 | 9.9% |
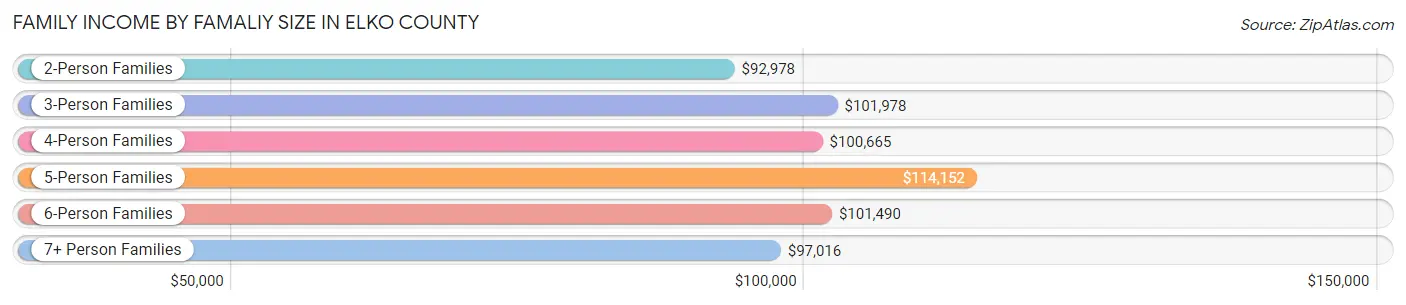
Family Income by Famaliy Size in Elko County
5-person families (1,051 | 8.1%) account for the highest median family income in Elko County with $114,152 per family, while 2-person families (5,826 | 44.7%) have the highest median income of $46,489 per family member.
| Income Bracket | # Families | Median Income |
| 2-Person Families | 5,826 (44.7%) | $92,978 |
| 3-Person Families | 2,683 (20.6%) | $101,978 |
| 4-Person Families | 2,741 (21.0%) | $100,665 |
| 5-Person Families | 1,051 (8.1%) | $114,152 |
| 6-Person Families | 450 (3.5%) | $101,490 |
| 7+ Person Families | 292 (2.2%) | $97,016 |
| Total | 13,043 (100.0%) | $100,342 |
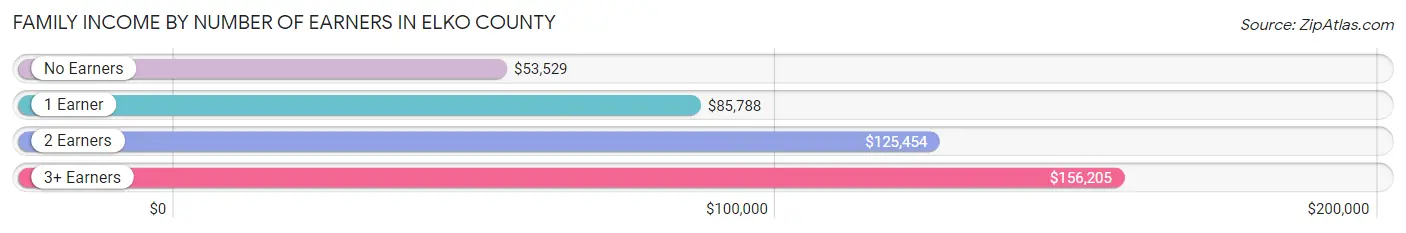
Family Income by Number of Earners in Elko County
The median family income in Elko County is $100,342, with families comprising 3+ earners (1,171) having the highest median family income of $156,205, while families with no earners (1,250) have the lowest median family income of $53,529, accounting for 9.0% and 9.6% of families, respectively.
| Number of Earners | # Families | Median Income |
| No Earners | 1,250 (9.6%) | $53,529 |
| 1 Earner | 5,117 (39.2%) | $85,788 |
| 2 Earners | 5,505 (42.2%) | $125,454 |
| 3+ Earners | 1,171 (9.0%) | $156,205 |
| Total | 13,043 (100.0%) | $100,342 |
Household Income in Elko County
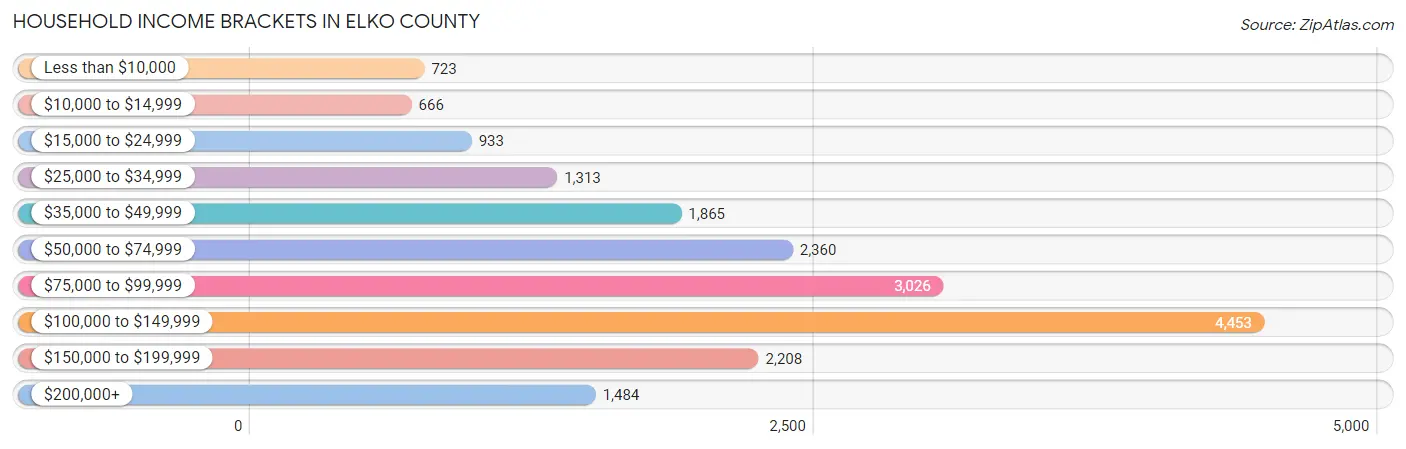
Household Income Brackets in Elko County
With 4,453 households falling in the category, the $100,000 to $149,999 income range is the most frequent in Elko County, accounting for 23.4% of all households. In contrast, only 666 households (3.5%) fall into the $10,000 to $14,999 income bracket, making it the least populous group.
| Income Bracket | # Households | % Households |
| Less than $10,000 | 723 | 3.8% |
| $10,000 to $14,999 | 666 | 3.5% |
| $15,000 to $24,999 | 933 | 4.9% |
| $25,000 to $34,999 | 1,313 | 6.9% |
| $35,000 to $49,999 | 1,865 | 9.8% |
| $50,000 to $74,999 | 2,360 | 12.4% |
| $75,000 to $99,999 | 3,026 | 15.9% |
| $100,000 to $149,999 | 4,453 | 23.4% |
| $150,000 to $199,999 | 2,208 | 11.6% |
| $200,000+ | 1,484 | 7.8% |
Household Income by Householder Age in Elko County
The median household income in Elko County is $87,755, with the highest median household income of $102,394 found in the 45 to 64 years age bracket for the primary householder. A total of 6,922 households (36.4%) fall into this category. Meanwhile, the 65+ years age bracket for the primary householder has the lowest median household income of $50,783, with 3,619 households (19.0%) in this group.
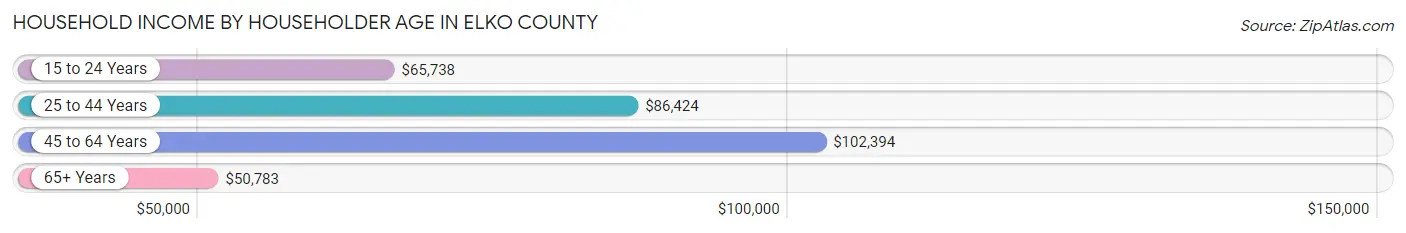
| Income Bracket | # Households | Median Income |
| 15 to 24 Years | 961 (5.1%) | $65,738 |
| 25 to 44 Years | 7,530 (39.6%) | $86,424 |
| 45 to 64 Years | 6,922 (36.4%) | $102,394 |
| 65+ Years | 3,619 (19.0%) | $50,783 |
| Total | 19,032 (100.0%) | $87,755 |
Poverty in Elko County
Income Below Poverty by Sex and Age in Elko County
With 9.1% poverty level for males and 11.8% for females among the residents of Elko County, 5 year old males and 18 to 24 year old females are the most vulnerable to poverty, with 92 males (21.6%) and 472 females (21.7%) in their respective age groups living below the poverty level.
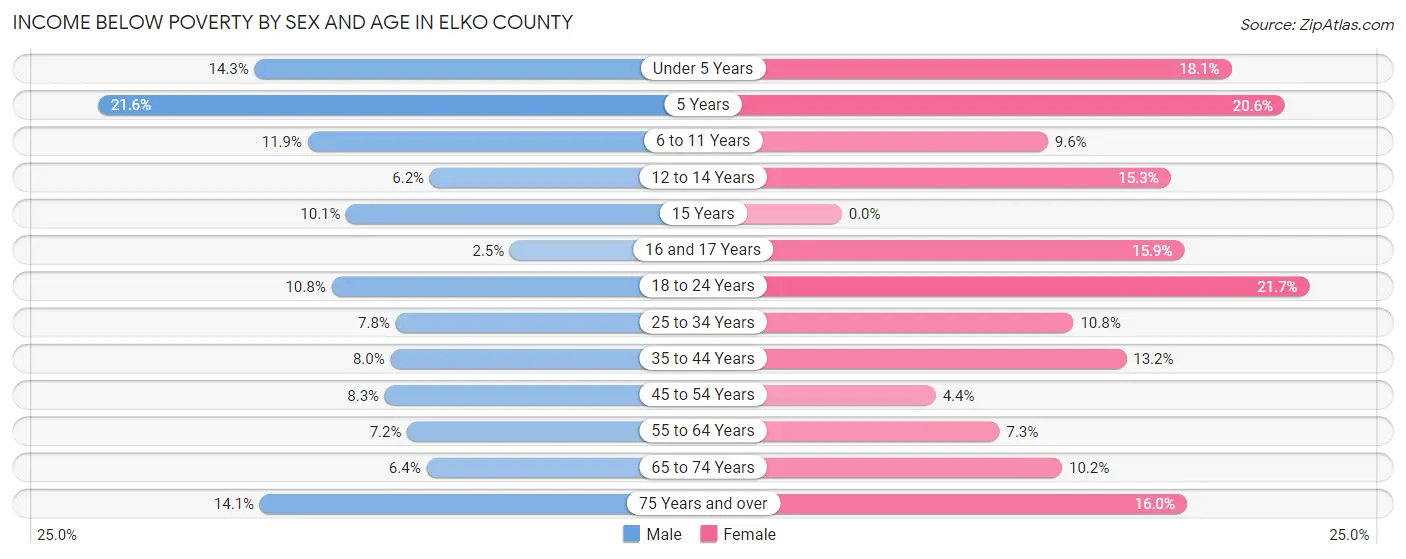
| Age Bracket | Male | Female |
| Under 5 Years | 260 (14.3%) | 322 (18.1%) |
| 5 Years | 92 (21.6%) | 74 (20.6%) |
| 6 to 11 Years | 329 (11.9%) | 222 (9.6%) |
| 12 to 14 Years | 57 (6.2%) | 183 (15.2%) |
| 15 Years | 41 (10.1%) | 0 (0.0%) |
| 16 and 17 Years | 20 (2.5%) | 136 (15.9%) |
| 18 to 24 Years | 255 (10.8%) | 472 (21.7%) |
| 25 to 34 Years | 315 (7.8%) | 399 (10.7%) |
| 35 to 44 Years | 311 (8.0%) | 433 (13.2%) |
| 45 to 54 Years | 265 (8.3%) | 135 (4.4%) |
| 55 to 64 Years | 253 (7.2%) | 224 (7.3%) |
| 65 to 74 Years | 141 (6.4%) | 208 (10.2%) |
| 75 Years and over | 148 (14.1%) | 178 (16.0%) |
| Total | 2,487 (9.1%) | 2,986 (11.8%) |
Income Above Poverty by Sex and Age in Elko County
According to the poverty statistics in Elko County, males aged 16 and 17 years and females aged 15 years are the age groups that are most secure financially, with 97.5% of males and 100.0% of females in these age groups living above the poverty line.
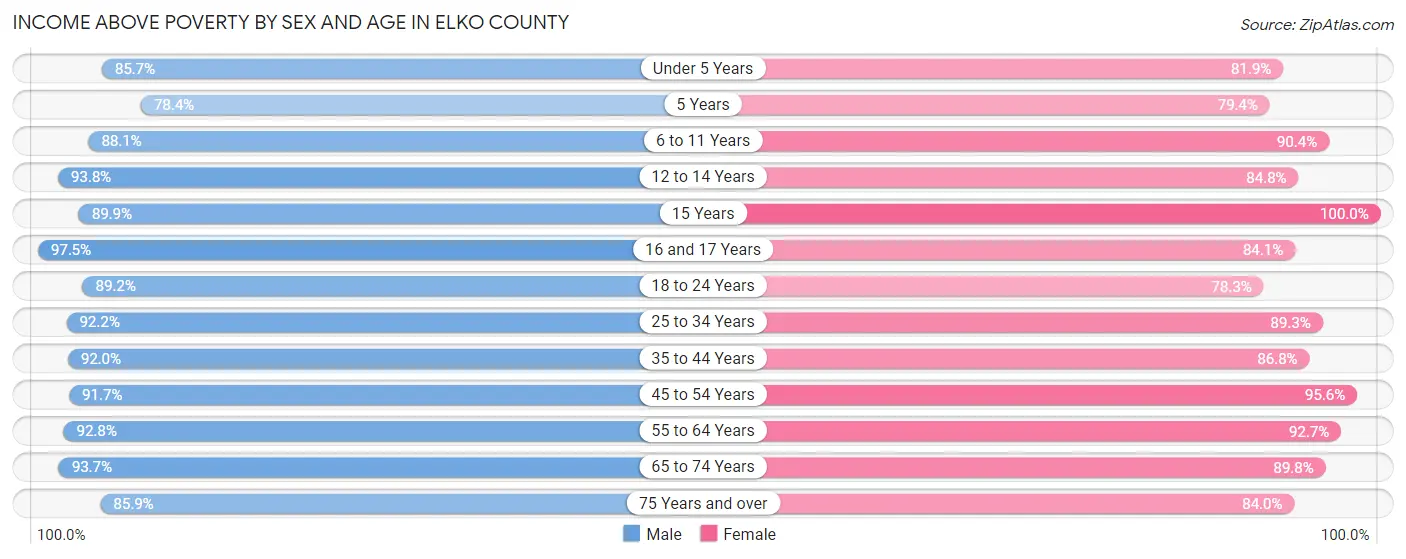
| Age Bracket | Male | Female |
| Under 5 Years | 1,554 (85.7%) | 1,459 (81.9%) |
| 5 Years | 334 (78.4%) | 286 (79.4%) |
| 6 to 11 Years | 2,446 (88.1%) | 2,099 (90.4%) |
| 12 to 14 Years | 864 (93.8%) | 1,017 (84.8%) |
| 15 Years | 366 (89.9%) | 238 (100.0%) |
| 16 and 17 Years | 789 (97.5%) | 720 (84.1%) |
| 18 to 24 Years | 2,114 (89.2%) | 1,703 (78.3%) |
| 25 to 34 Years | 3,734 (92.2%) | 3,311 (89.2%) |
| 35 to 44 Years | 3,567 (92.0%) | 2,847 (86.8%) |
| 45 to 54 Years | 2,935 (91.7%) | 2,963 (95.6%) |
| 55 to 64 Years | 3,240 (92.8%) | 2,838 (92.7%) |
| 65 to 74 Years | 2,078 (93.6%) | 1,828 (89.8%) |
| 75 Years and over | 903 (85.9%) | 934 (84.0%) |
| Total | 24,924 (90.9%) | 22,243 (88.2%) |
Income Below Poverty Among Married-Couple Families in Elko County
The poverty statistics for married-couple families in Elko County show that 2.5% or 266 of the total 10,447 families live below the poverty line. Families with 3 or 4 children have the highest poverty rate of 8.7%, comprising of 99 families. On the other hand, families with no children have the lowest poverty rate of 0.9%, which includes 44 families.
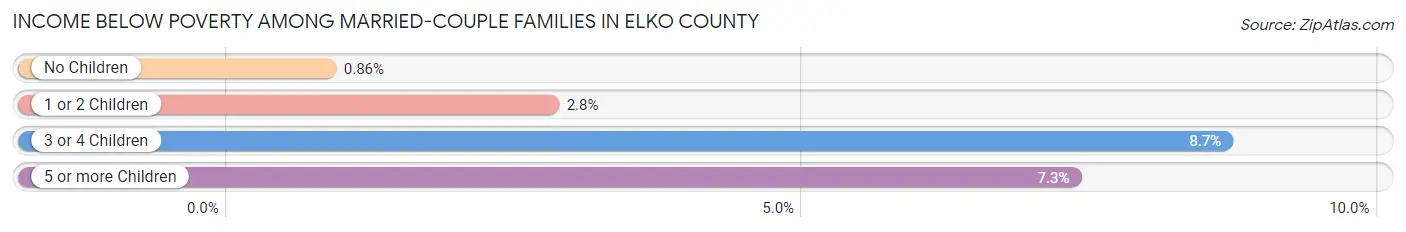
| Children | Above Poverty | Below Poverty |
| No Children | 5,043 (99.1%) | 44 (0.9%) |
| 1 or 2 Children | 3,993 (97.2%) | 115 (2.8%) |
| 3 or 4 Children | 1,044 (91.3%) | 99 (8.7%) |
| 5 or more Children | 101 (92.7%) | 8 (7.3%) |
| Total | 10,181 (97.5%) | 266 (2.5%) |
Income Below Poverty Among Single-Parent Households in Elko County
According to the poverty data in Elko County, 12.2% or 113 single-father households and 27.1% or 451 single-mother households are living below the poverty line. Among single-father households, those with 1 or 2 children have the highest poverty rate, with 95 households (16.7%) experiencing poverty. Likewise, among single-mother households, those with 5 or more children have the highest poverty rate, with 34 households (100.0%) falling below the poverty line.
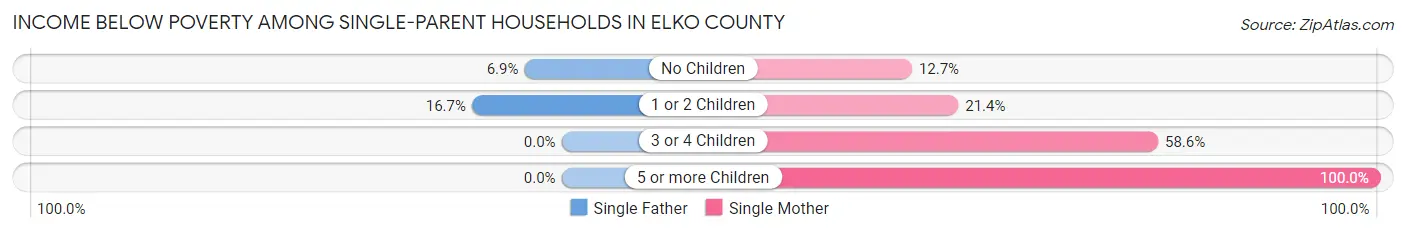
| Children | Single Father | Single Mother |
| No Children | 18 (6.9%) | 50 (12.7%) |
| 1 or 2 Children | 95 (16.7%) | 206 (21.3%) |
| 3 or 4 Children | 0 (0.0%) | 161 (58.6%) |
| 5 or more Children | 0 (0.0%) | 34 (100.0%) |
| Total | 113 (12.2%) | 451 (27.1%) |
Income Below Poverty Among Married-Couple vs Single-Parent Households in Elko County
The poverty data for Elko County shows that 266 of the married-couple family households (2.5%) and 564 of the single-parent households (21.7%) are living below the poverty level. Within the married-couple family households, those with 3 or 4 children have the highest poverty rate, with 99 households (8.7%) falling below the poverty line. Among the single-parent households, those with 5 or more children have the highest poverty rate, with 34 household (64.1%) living below poverty.
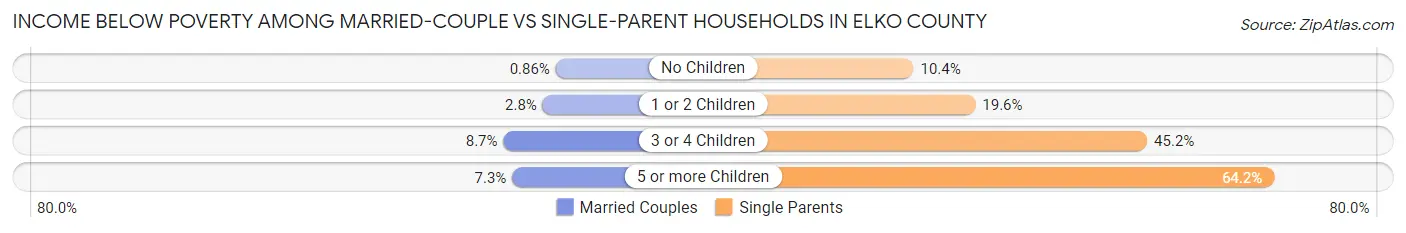
| Children | Married-Couple Families | Single-Parent Households |
| No Children | 44 (0.9%) | 68 (10.4%) |
| 1 or 2 Children | 115 (2.8%) | 301 (19.6%) |
| 3 or 4 Children | 99 (8.7%) | 161 (45.2%) |
| 5 or more Children | 8 (7.3%) | 34 (64.1%) |
| Total | 266 (2.5%) | 564 (21.7%) |
Race in Elko County
The most populous races in Elko County are White / Caucasian (38,092 | 71.1%), Hispanic or Latino (13,424 | 25.0%), and Two or more Races (7,091 | 13.2%).
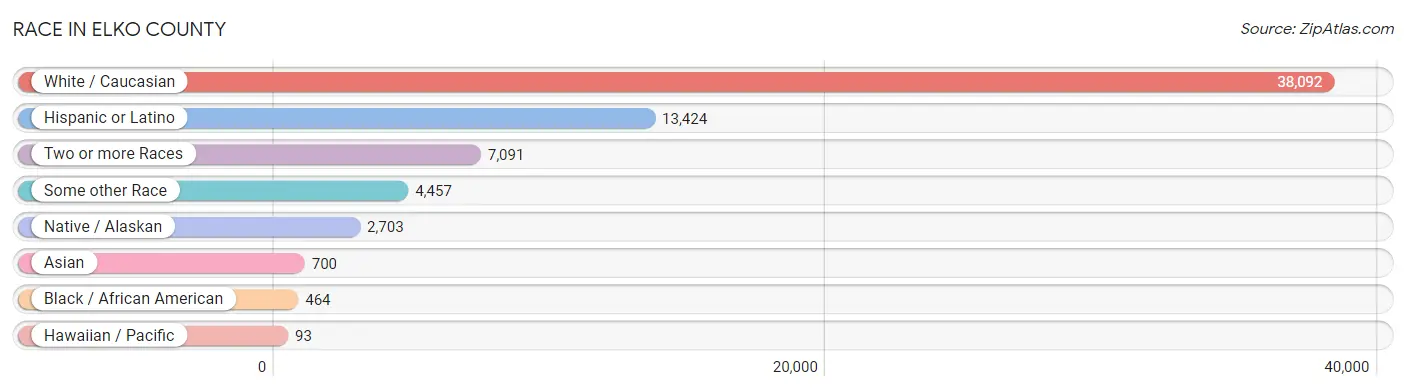
| Race | # Population | % Population |
| Asian | 700 | 1.3% |
| Black / African American | 464 | 0.9% |
| Hawaiian / Pacific | 93 | 0.2% |
| Hispanic or Latino | 13,424 | 25.0% |
| Native / Alaskan | 2,703 | 5.0% |
| White / Caucasian | 38,092 | 71.1% |
| Two or more Races | 7,091 | 13.2% |
| Some other Race | 4,457 | 8.3% |
| Total | 53,600 | 100.0% |
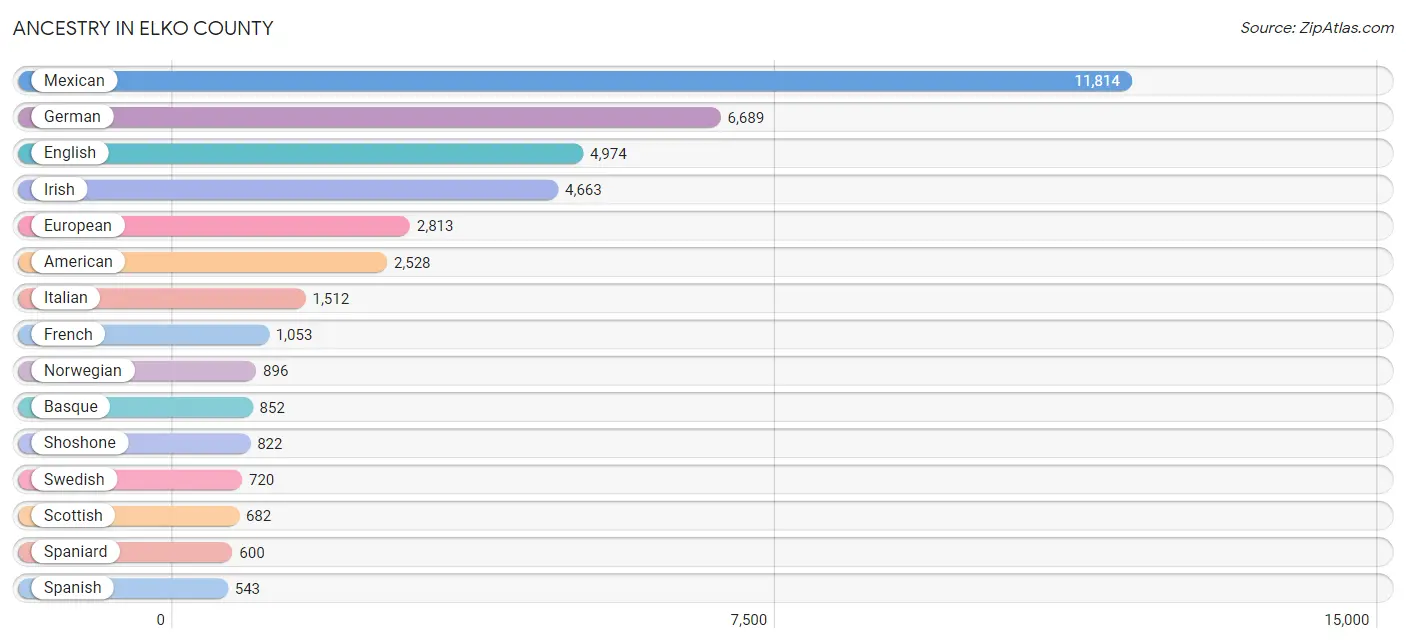
Ancestry in Elko County
The most populous ancestries reported in Elko County are Mexican (11,814 | 22.0%), German (6,689 | 12.5%), English (4,974 | 9.3%), Irish (4,663 | 8.7%), and European (2,813 | 5.2%), together accounting for 57.8% of all Elko County residents.
| Ancestry | # Population | % Population |
| African | 38 | 0.1% |
| American | 2,528 | 4.7% |
| Arab | 57 | 0.1% |
| Armenian | 32 | 0.1% |
| Austrian | 269 | 0.5% |
| Basque | 852 | 1.6% |
| Belizean | 14 | 0.0% |
| Bhutanese | 89 | 0.2% |
| Blackfeet | 49 | 0.1% |
| British | 157 | 0.3% |
| Burmese | 35 | 0.1% |
| Canadian | 92 | 0.2% |
| Central American | 53 | 0.1% |
| Central American Indian | 53 | 0.1% |
| Cherokee | 91 | 0.2% |
| Chickasaw | 14 | 0.0% |
| Chippewa | 9 | 0.0% |
| Choctaw | 47 | 0.1% |
| Colombian | 16 | 0.0% |
| Comanche | 6 | 0.0% |
| Cree | 13 | 0.0% |
| Croatian | 96 | 0.2% |
| Crow | 5 | 0.0% |
| Cuban | 2 | 0.0% |
| Czech | 149 | 0.3% |
| Danish | 460 | 0.9% |
| Dutch | 313 | 0.6% |
| Eastern European | 83 | 0.2% |
| Ecuadorian | 18 | 0.0% |
| English | 4,974 | 9.3% |
| European | 2,813 | 5.2% |
| Fijian | 22 | 0.0% |
| Finnish | 158 | 0.3% |
| French | 1,053 | 2.0% |
| French American Indian | 13 | 0.0% |
| French Canadian | 207 | 0.4% |
| German | 6,689 | 12.5% |
| Ghanaian | 20 | 0.0% |
| Greek | 198 | 0.4% |
| Guamanian / Chamorro | 49 | 0.1% |
| Guatemalan | 53 | 0.1% |
| Hopi | 30 | 0.1% |
| Hungarian | 101 | 0.2% |
| Indian (Asian) | 197 | 0.4% |
| Inupiat | 7 | 0.0% |
| Iranian | 51 | 0.1% |
| Irish | 4,663 | 8.7% |
| Iroquois | 19 | 0.0% |
| Israeli | 36 | 0.1% |
| Italian | 1,512 | 2.8% |
| Jamaican | 3 | 0.0% |
| Korean | 302 | 0.6% |
| Lithuanian | 108 | 0.2% |
| Mexican | 11,814 | 22.0% |
| Mexican American Indian | 28 | 0.1% |
| Moroccan | 36 | 0.1% |
| Native Hawaiian | 32 | 0.1% |
| Navajo | 120 | 0.2% |
| New Zealander | 28 | 0.1% |
| Nigerian | 1 | 0.0% |
| Northern European | 7 | 0.0% |
| Norwegian | 896 | 1.7% |
| Paiute | 94 | 0.2% |
| Pakistani | 77 | 0.1% |
| Peruvian | 121 | 0.2% |
| Pima | 4 | 0.0% |
| Polish | 492 | 0.9% |
| Portuguese | 167 | 0.3% |
| Potawatomi | 11 | 0.0% |
| Pueblo | 3 | 0.0% |
| Puerto Rican | 81 | 0.2% |
| Russian | 189 | 0.4% |
| Samoan | 34 | 0.1% |
| Scandinavian | 228 | 0.4% |
| Scotch-Irish | 207 | 0.4% |
| Scottish | 682 | 1.3% |
| Seminole | 22 | 0.0% |
| Shoshone | 822 | 1.5% |
| Sioux | 7 | 0.0% |
| Slavic | 52 | 0.1% |
| Slovak | 173 | 0.3% |
| Slovene | 138 | 0.3% |
| South African | 8 | 0.0% |
| South American | 155 | 0.3% |
| South American Indian | 58 | 0.1% |
| Spaniard | 600 | 1.1% |
| Spanish | 543 | 1.0% |
| Sri Lankan | 230 | 0.4% |
| Subsaharan African | 76 | 0.1% |
| Swedish | 720 | 1.3% |
| Swiss | 48 | 0.1% |
| Thai | 42 | 0.1% |
| Tlingit-Haida | 77 | 0.1% |
| Turkish | 13 | 0.0% |
| Ukrainian | 17 | 0.0% |
| Ute | 59 | 0.1% |
| Welsh | 252 | 0.5% |
| Yakama | 3 | 0.0% |
| Yaqui | 47 | 0.1% |
| Yugoslavian | 81 | 0.2% | View All 100 Rows |
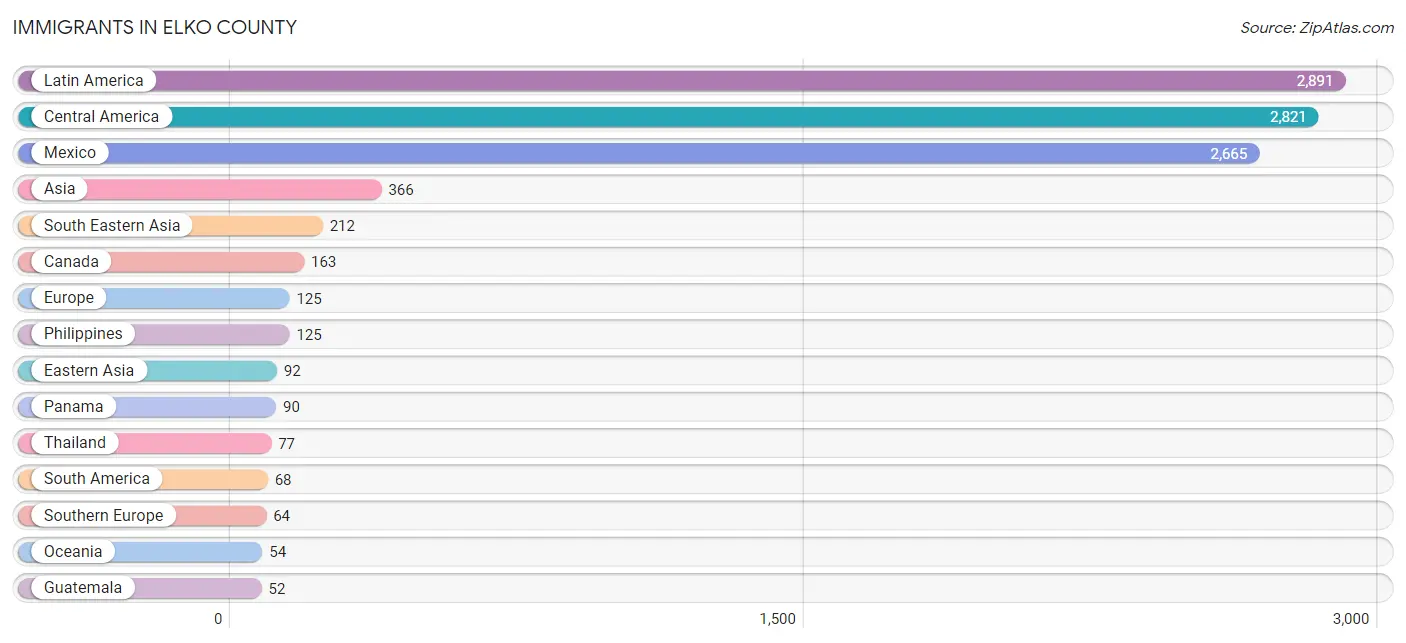
Immigrants in Elko County
The most numerous immigrant groups reported in Elko County came from Latin America (2,891 | 5.4%), Central America (2,821 | 5.3%), Mexico (2,665 | 5.0%), Asia (366 | 0.7%), and South Eastern Asia (212 | 0.4%), together accounting for 16.7% of all Elko County residents.
| Immigration Origin | # Population | % Population |
| Africa | 37 | 0.1% |
| Asia | 366 | 0.7% |
| Australia | 23 | 0.0% |
| Canada | 163 | 0.3% |
| Caribbean | 2 | 0.0% |
| Central America | 2,821 | 5.3% |
| China | 46 | 0.1% |
| Croatia | 10 | 0.0% |
| Cuba | 2 | 0.0% |
| Eastern Asia | 92 | 0.2% |
| Eastern Europe | 17 | 0.0% |
| Ecuador | 18 | 0.0% |
| Europe | 125 | 0.2% |
| Germany | 24 | 0.0% |
| Ghana | 20 | 0.0% |
| Guatemala | 52 | 0.1% |
| Honduras | 14 | 0.0% |
| India | 13 | 0.0% |
| Ireland | 8 | 0.0% |
| Israel | 36 | 0.1% |
| Japan | 39 | 0.1% |
| Korea | 7 | 0.0% |
| Latin America | 2,891 | 5.4% |
| Mexico | 2,665 | 5.0% |
| Micronesia | 3 | 0.0% |
| Northern Europe | 20 | 0.0% |
| Norway | 12 | 0.0% |
| Oceania | 54 | 0.1% |
| Panama | 90 | 0.2% |
| Peru | 50 | 0.1% |
| Philippines | 125 | 0.2% |
| Portugal | 12 | 0.0% |
| Russia | 7 | 0.0% |
| South Africa | 8 | 0.0% |
| South America | 68 | 0.1% |
| South Central Asia | 13 | 0.0% |
| South Eastern Asia | 212 | 0.4% |
| Southern Europe | 64 | 0.1% |
| Spain | 52 | 0.1% |
| Thailand | 77 | 0.1% |
| Turkey | 13 | 0.0% |
| Vietnam | 10 | 0.0% |
| Western Africa | 29 | 0.1% |
| Western Asia | 49 | 0.1% |
| Western Europe | 24 | 0.0% | View All 45 Rows |
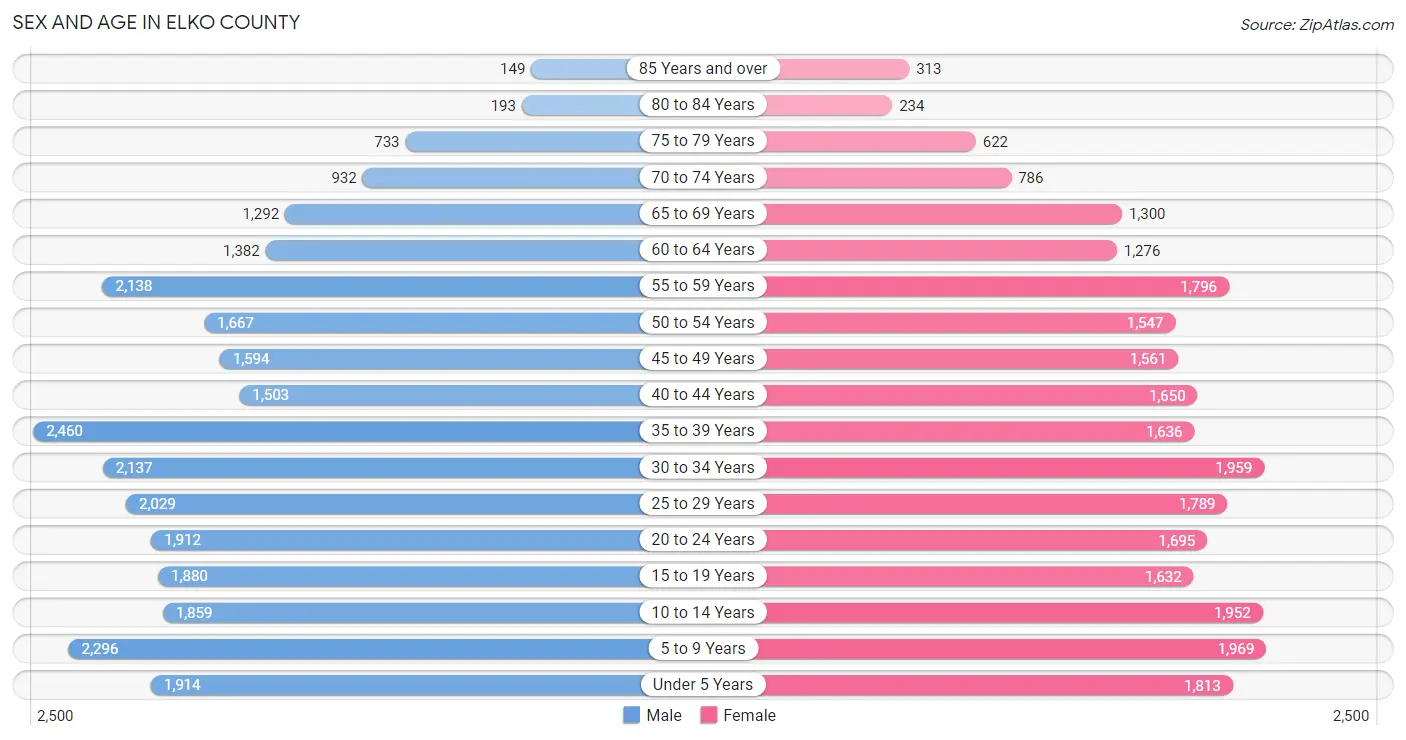
Sex and Age in Elko County
Sex and Age in Elko County
The most populous age groups in Elko County are 35 to 39 Years (2,460 | 8.8%) for men and 5 to 9 Years (1,969 | 7.7%) for women.
| Age Bracket | Male | Female |
| Under 5 Years | 1,914 (6.8%) | 1,813 (7.1%) |
| 5 to 9 Years | 2,296 (8.2%) | 1,969 (7.7%) |
| 10 to 14 Years | 1,859 (6.6%) | 1,952 (7.6%) |
| 15 to 19 Years | 1,880 (6.7%) | 1,632 (6.4%) |
| 20 to 24 Years | 1,912 (6.8%) | 1,695 (6.6%) |
| 25 to 29 Years | 2,029 (7.2%) | 1,789 (7.0%) |
| 30 to 34 Years | 2,137 (7.6%) | 1,959 (7.7%) |
| 35 to 39 Years | 2,460 (8.8%) | 1,636 (6.4%) |
| 40 to 44 Years | 1,503 (5.3%) | 1,650 (6.5%) |
| 45 to 49 Years | 1,594 (5.7%) | 1,561 (6.1%) |
| 50 to 54 Years | 1,667 (5.9%) | 1,547 (6.1%) |
| 55 to 59 Years | 2,138 (7.6%) | 1,796 (7.0%) |
| 60 to 64 Years | 1,382 (4.9%) | 1,276 (5.0%) |
| 65 to 69 Years | 1,292 (4.6%) | 1,300 (5.1%) |
| 70 to 74 Years | 932 (3.3%) | 786 (3.1%) |
| 75 to 79 Years | 733 (2.6%) | 622 (2.4%) |
| 80 to 84 Years | 193 (0.7%) | 234 (0.9%) |
| 85 Years and over | 149 (0.5%) | 313 (1.2%) |
| Total | 28,070 (100.0%) | 25,530 (100.0%) |
Families and Households in Elko County
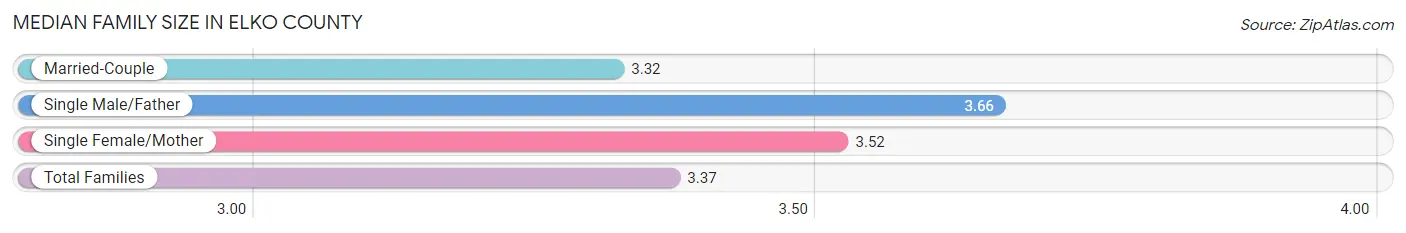
Median Family Size in Elko County
The median family size in Elko County is 3.37 persons per family, with single male/father families (929 | 7.1%) accounting for the largest median family size of 3.66 persons per family. On the other hand, married-couple families (10,447 | 80.1%) represent the smallest median family size with 3.32 persons per family.
| Family Type | # Families | Family Size |
| Married-Couple | 10,447 (80.1%) | 3.32 |
| Single Male/Father | 929 (7.1%) | 3.66 |
| Single Female/Mother | 1,667 (12.8%) | 3.52 |
| Total Families | 13,043 (100.0%) | 3.37 |
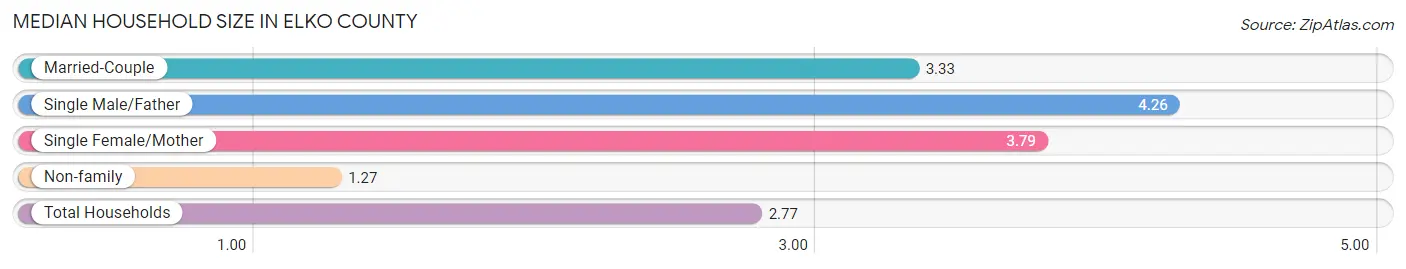
Median Household Size in Elko County
The median household size in Elko County is 2.77 persons per household, with single male/father households (929 | 4.9%) accounting for the largest median household size of 4.26 persons per household. non-family households (5,989 | 31.5%) represent the smallest median household size with 1.27 persons per household.
| Household Type | # Households | Household Size |
| Married-Couple | 10,447 (54.9%) | 3.33 |
| Single Male/Father | 929 (4.9%) | 4.26 |
| Single Female/Mother | 1,667 (8.8%) | 3.79 |
| Non-family | 5,989 (31.5%) | 1.27 |
| Total Households | 19,032 (100.0%) | 2.77 |
Household Size by Marriage Status in Elko County
Out of a total of 19,032 households in Elko County, 13,043 (68.5%) are family households, while 5,989 (31.5%) are nonfamily households. The most numerous type of family households are 2-person households, comprising 5,432, and the most common type of nonfamily households are 1-person households, comprising 5,029.
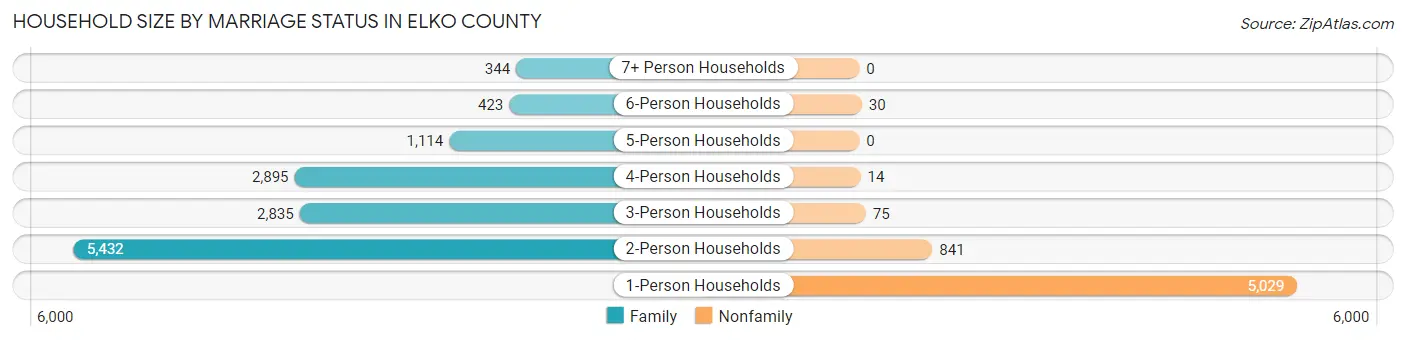
| Household Size | Family Households | Nonfamily Households |
| 1-Person Households | - | 5,029 (26.4%) |
| 2-Person Households | 5,432 (28.5%) | 841 (4.4%) |
| 3-Person Households | 2,835 (14.9%) | 75 (0.4%) |
| 4-Person Households | 2,895 (15.2%) | 14 (0.1%) |
| 5-Person Households | 1,114 (5.9%) | 0 (0.0%) |
| 6-Person Households | 423 (2.2%) | 30 (0.2%) |
| 7+ Person Households | 344 (1.8%) | 0 (0.0%) |
| Total | 13,043 (68.5%) | 5,989 (31.5%) |
Female Fertility in Elko County
Fertility by Age in Elko County
Average fertility rate in Elko County is 47.0 births per 1,000 women. Women in the age bracket of 20 to 34 years have the highest fertility rate with 93.0 births per 1,000 women. Women in the age bracket of 20 to 34 years acount for 89.4% of all women with births.
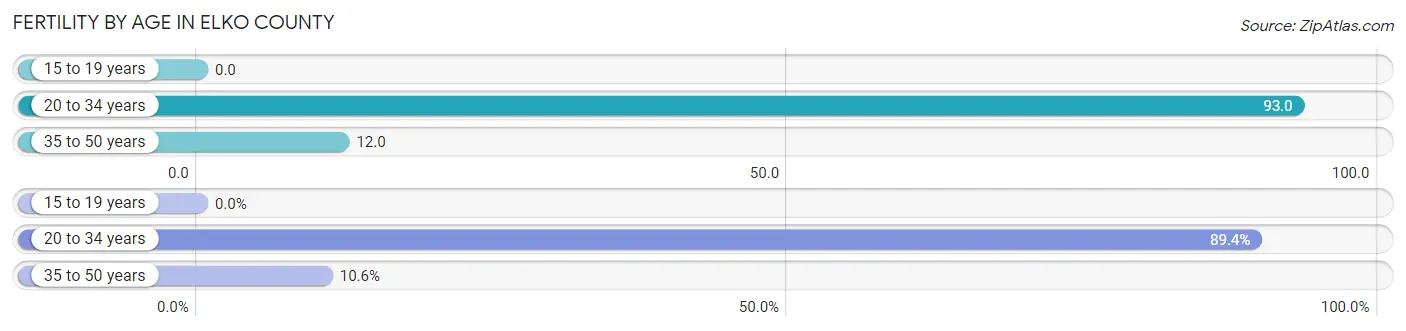
| Age Bracket | Women with Births | Births / 1,000 Women |
| 15 to 19 years | 0 (0.0%) | 0.0 |
| 20 to 34 years | 507 (89.4%) | 93.0 |
| 35 to 50 years | 60 (10.6%) | 12.0 |
| Total | 567 (100.0%) | 47.0 |
Fertility by Age by Marriage Status in Elko County
75.5% of women with births (567) in Elko County are married. The highest percentage of unmarried women with births falls into 35 to 50 years age bracket with 26.7% of them unmarried at the time of birth, while the lowest percentage of unmarried women with births belong to 20 to 34 years age bracket with 24.3% of them unmarried.
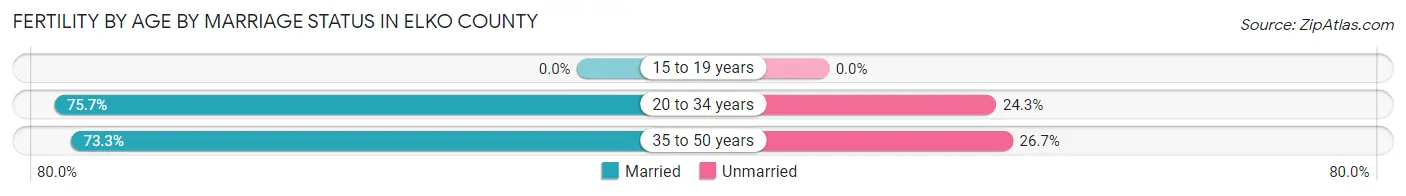
| Age Bracket | Married | Unmarried |
| 15 to 19 years | 0 (0.0%) | 0 (0.0%) |
| 20 to 34 years | 384 (75.7%) | 123 (24.3%) |
| 35 to 50 years | 44 (73.3%) | 16 (26.7%) |
| Total | 428 (75.5%) | 139 (24.5%) |
Fertility by Education in Elko County
Average fertility rate in Elko County is 47.0 births per 1,000 women. Women with the education attainment of bachelor's degree have the highest fertility rate of 92.0 births per 1,000 women, while women with the education attainment of graduate degree have the lowest fertility at 18.0 births per 1,000 women. Women with the education attainment of high school diploma represent 37.0% of all women with births.
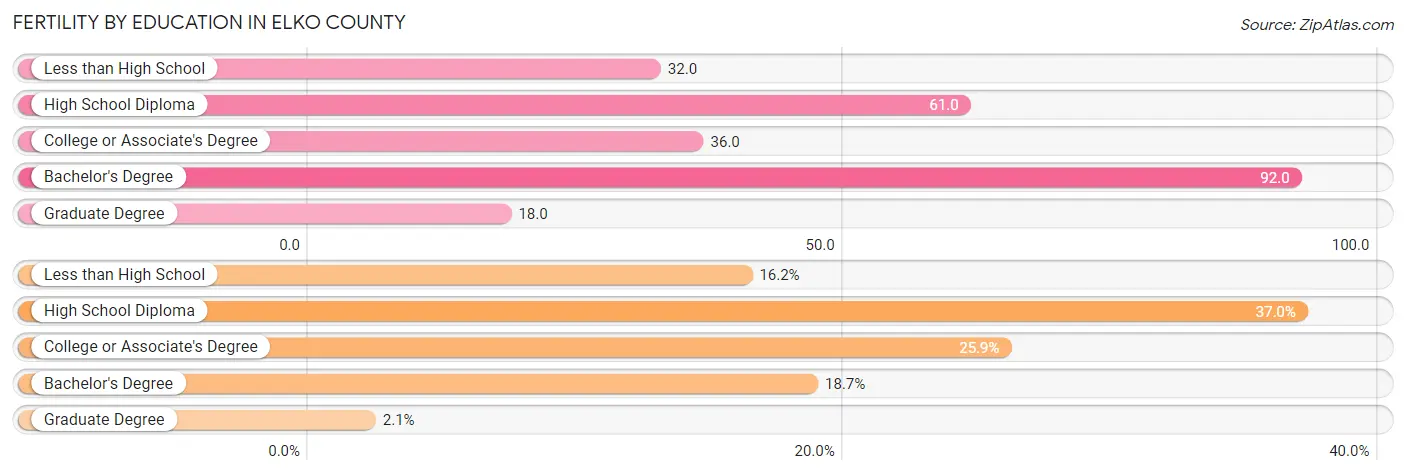
| Educational Attainment | Women with Births | Births / 1,000 Women |
| Less than High School | 92 (16.2%) | 32.0 |
| High School Diploma | 210 (37.0%) | 61.0 |
| College or Associate's Degree | 147 (25.9%) | 36.0 |
| Bachelor's Degree | 106 (18.7%) | 92.0 |
| Graduate Degree | 12 (2.1%) | 18.0 |
| Total | 567 (100.0%) | 47.0 |
Fertility by Education by Marriage Status in Elko County
24.5% of women with births in Elko County are unmarried. Women with the educational attainment of graduate degree are most likely to be married with 100.0% of them married at childbirth, while women with the educational attainment of less than high school are least likely to be married with 56.5% of them unmarried at childbirth.
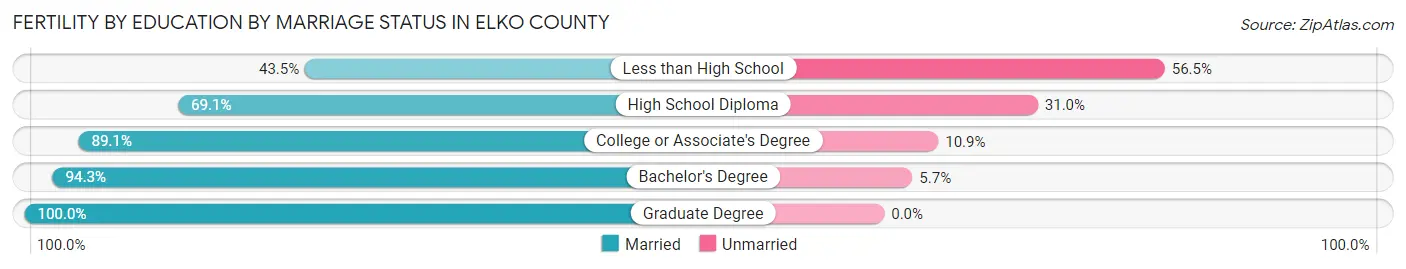
| Educational Attainment | Married | Unmarried |
| Less than High School | 40 (43.5%) | 52 (56.5%) |
| High School Diploma | 145 (69.1%) | 65 (30.9%) |
| College or Associate's Degree | 131 (89.1%) | 16 (10.9%) |
| Bachelor's Degree | 100 (94.3%) | 6 (5.7%) |
| Graduate Degree | 12 (100.0%) | 0 (0.0%) |
| Total | 428 (75.5%) | 139 (24.5%) |
Employment Characteristics in Elko County
Employment by Class of Employer in Elko County
Among the 25,906 employed individuals in Elko County, private company employees (19,095 | 73.7%), local government employees (2,112 | 8.2%), and self-employed (not incorporated) (1,177 | 4.5%) make up the most common classes of employment.
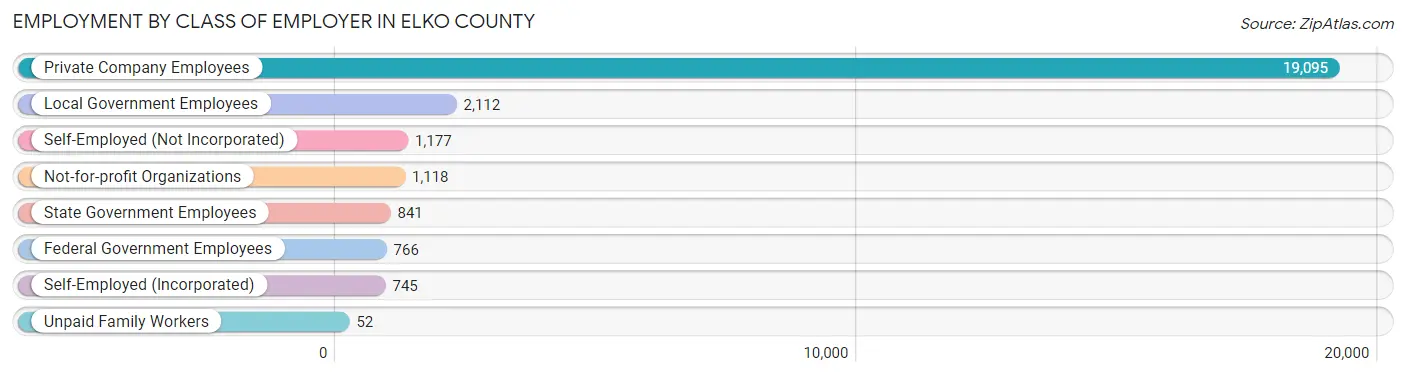
| Employer Class | # Employees | % Employees |
| Private Company Employees | 19,095 | 73.7% |
| Self-Employed (Incorporated) | 745 | 2.9% |
| Self-Employed (Not Incorporated) | 1,177 | 4.5% |
| Not-for-profit Organizations | 1,118 | 4.3% |
| Local Government Employees | 2,112 | 8.2% |
| State Government Employees | 841 | 3.3% |
| Federal Government Employees | 766 | 3.0% |
| Unpaid Family Workers | 52 | 0.2% |
| Total | 25,906 | 100.0% |
Employment Status by Age in Elko County
According to the labor force statistics for Elko County, out of the total population over 16 years of age (41,149), 67.1% or 27,611 individuals are in the labor force, with 4.7% or 1,298 of them unemployed. The age group with the highest labor force participation rate is 45 to 54 years, with 86.5% or 5,509 individuals in the labor force. Within the labor force, the 30 to 34 years age range has the highest percentage of unemployed individuals, with 7.2% or 226 of them being unemployed.
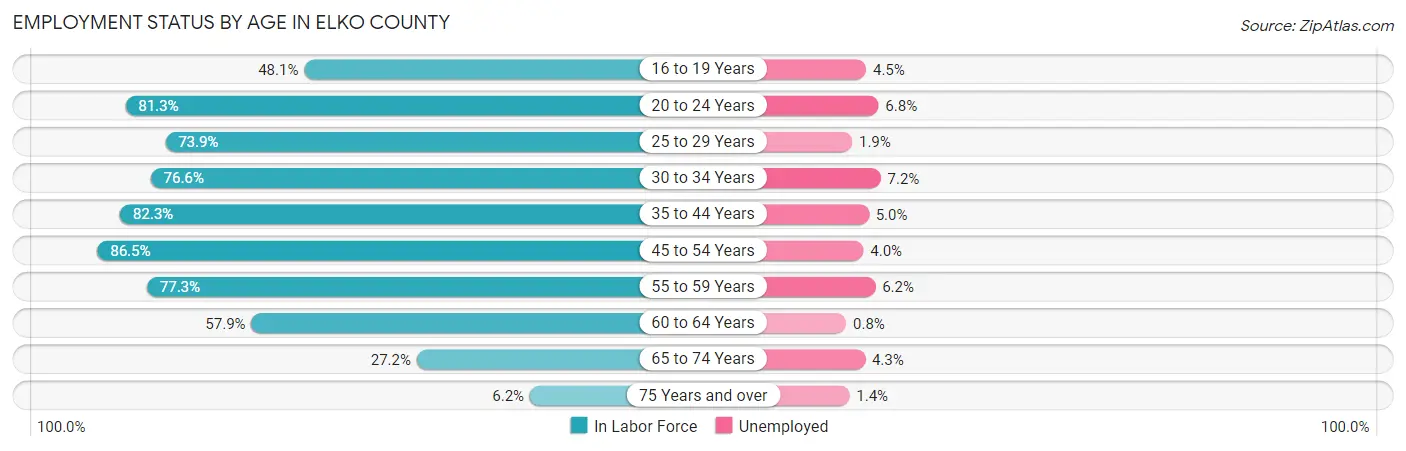
| Age Bracket | In Labor Force | Unemployed |
| 16 to 19 Years | 1,378 (48.1%) | 62 (4.5%) |
| 20 to 24 Years | 2,932 (81.3%) | 199 (6.8%) |
| 25 to 29 Years | 2,822 (73.9%) | 54 (1.9%) |
| 30 to 34 Years | 3,138 (76.6%) | 226 (7.2%) |
| 35 to 44 Years | 5,966 (82.3%) | 298 (5.0%) |
| 45 to 54 Years | 5,509 (86.5%) | 220 (4.0%) |
| 55 to 59 Years | 3,041 (77.3%) | 189 (6.2%) |
| 60 to 64 Years | 1,539 (57.9%) | 12 (0.8%) |
| 65 to 74 Years | 1,172 (27.2%) | 50 (4.3%) |
| 75 Years and over | 139 (6.2%) | 2 (1.4%) |
| Total | 27,611 (67.1%) | 1,298 (4.7%) |
Employment Status by Educational Attainment in Elko County
According to labor force statistics for Elko County, 78.3% of individuals (22,021) out of the total population between 25 and 64 years of age (28,124) are in the labor force, with 4.5% or 991 of them being unemployed. The group with the highest labor force participation rate are those with the educational attainment of bachelor's degree or higher, with 90.9% or 4,341 individuals in the labor force. Within the labor force, individuals with less than high school education have the highest percentage of unemployment, with 10.4% or 233 of them being unemployed.
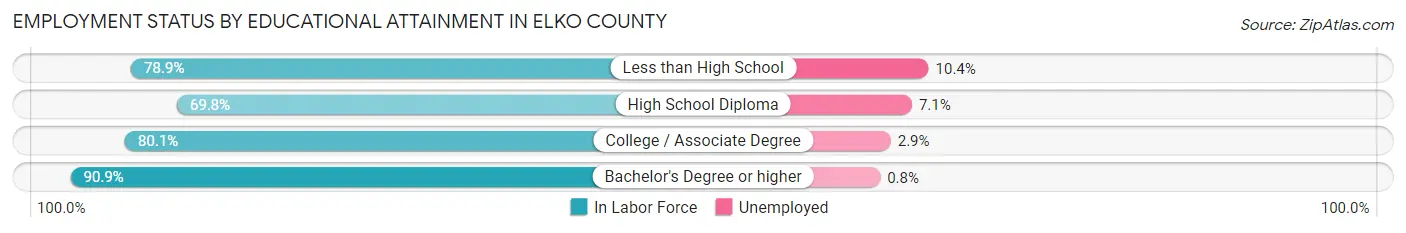
| Educational Attainment | In Labor Force | Unemployed |
| Less than High School | 2,244 (78.9%) | 296 (10.4%) |
| High School Diploma | 6,794 (69.8%) | 691 (7.1%) |
| College / Associate Degree | 8,628 (80.1%) | 312 (2.9%) |
| Bachelor's Degree or higher | 4,341 (90.9%) | 38 (0.8%) |
| Total | 22,021 (78.3%) | 1,266 (4.5%) |
Employment Occupations by Sex in Elko County
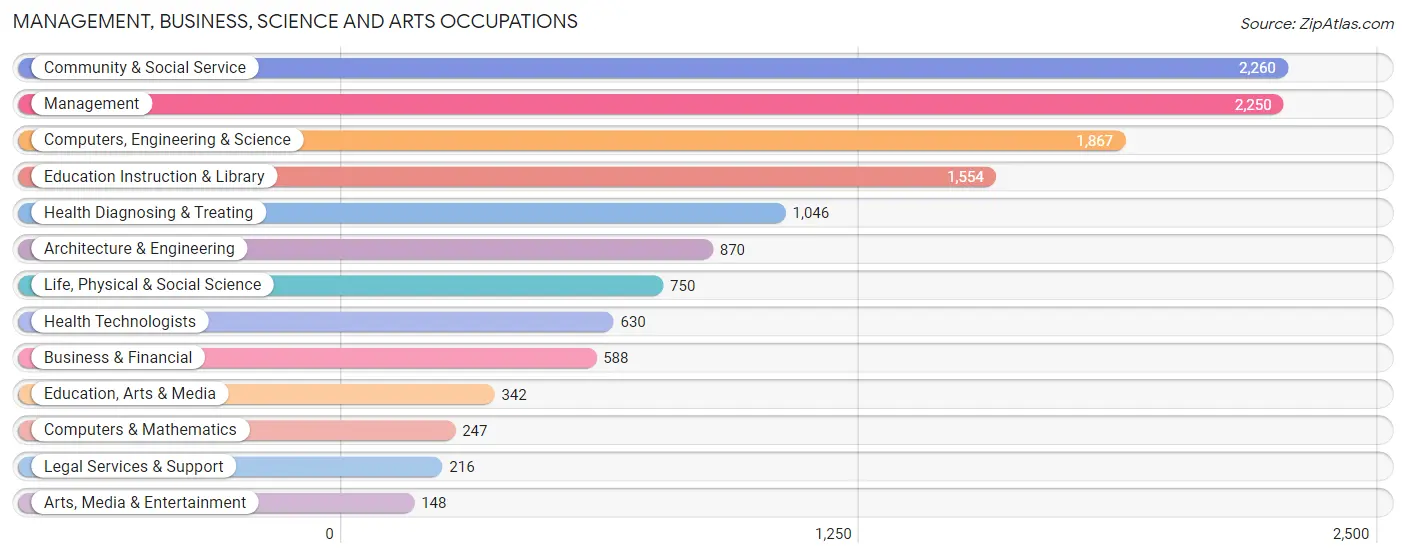
Management, Business, Science and Arts Occupations
The most common Management, Business, Science and Arts occupations in Elko County are Community & Social Service (2,260 | 8.6%), Management (2,250 | 8.6%), Computers, Engineering & Science (1,867 | 7.1%), Education Instruction & Library (1,554 | 5.9%), and Health Diagnosing & Treating (1,046 | 4.0%).
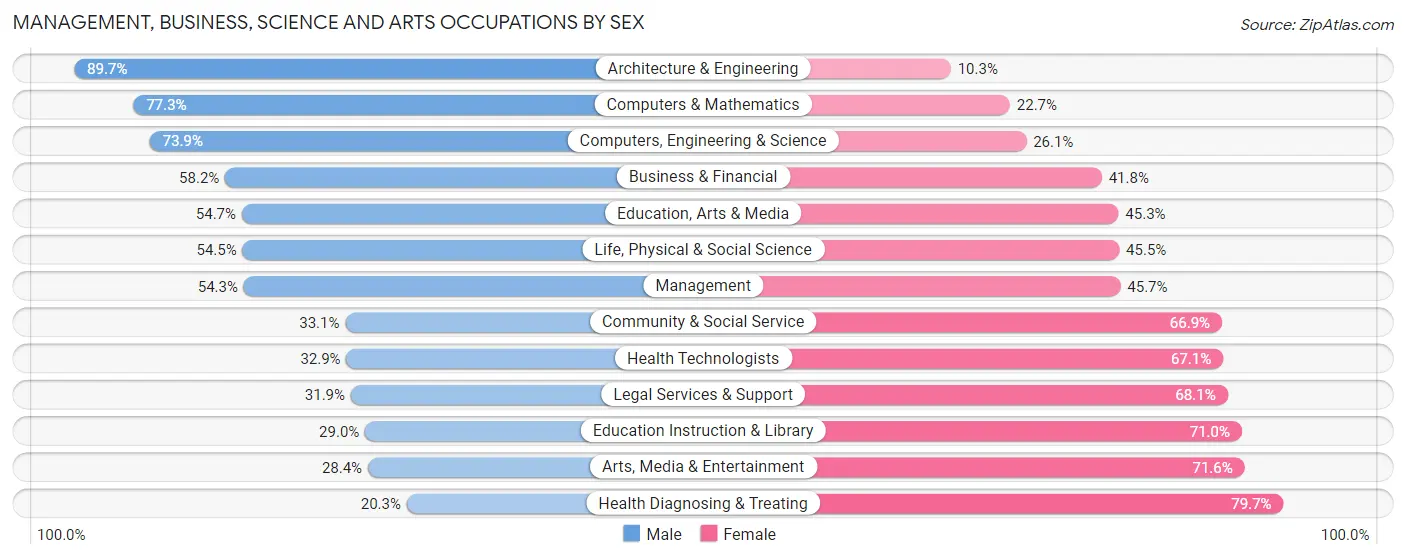
Management, Business, Science and Arts Occupations by Sex
Within the Management, Business, Science and Arts occupations in Elko County, the most male-oriented occupations are Architecture & Engineering (89.7%), Computers & Mathematics (77.3%), and Computers, Engineering & Science (73.9%), while the most female-oriented occupations are Health Diagnosing & Treating (79.7%), Arts, Media & Entertainment (71.6%), and Education Instruction & Library (71.0%).
| Occupation | Male | Female |
| Management | 1,221 (54.3%) | 1,029 (45.7%) |
| Business & Financial | 342 (58.2%) | 246 (41.8%) |
| Computers, Engineering & Science | 1,380 (73.9%) | 487 (26.1%) |
| Computers & Mathematics | 191 (77.3%) | 56 (22.7%) |
| Architecture & Engineering | 780 (89.7%) | 90 (10.3%) |
| Life, Physical & Social Science | 409 (54.5%) | 341 (45.5%) |
| Community & Social Service | 748 (33.1%) | 1,512 (66.9%) |
| Education, Arts & Media | 187 (54.7%) | 155 (45.3%) |
| Legal Services & Support | 69 (31.9%) | 147 (68.1%) |
| Education Instruction & Library | 450 (29.0%) | 1,104 (71.0%) |
| Arts, Media & Entertainment | 42 (28.4%) | 106 (71.6%) |
| Health Diagnosing & Treating | 212 (20.3%) | 834 (79.7%) |
| Health Technologists | 207 (32.9%) | 423 (67.1%) |
| Total (Category) | 3,903 (48.7%) | 4,108 (51.3%) |
| Total (Overall) | 15,630 (59.5%) | 10,645 (40.5%) |
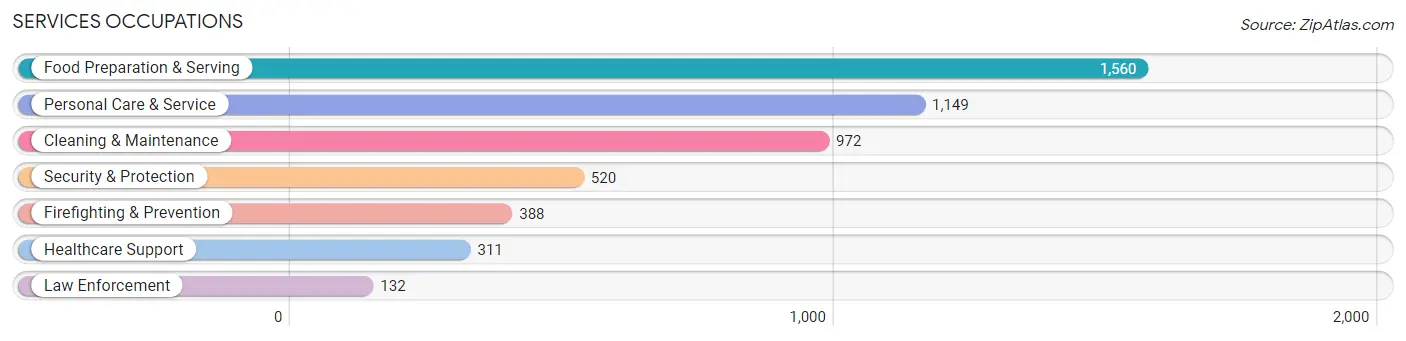
Services Occupations
The most common Services occupations in Elko County are Food Preparation & Serving (1,560 | 5.9%), Personal Care & Service (1,149 | 4.4%), Cleaning & Maintenance (972 | 3.7%), Security & Protection (520 | 2.0%), and Firefighting & Prevention (388 | 1.5%).
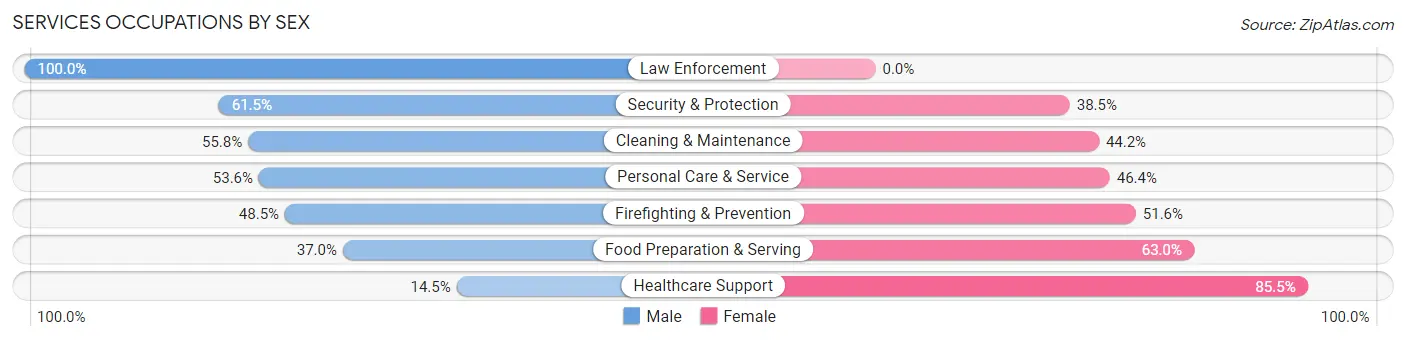
Services Occupations by Sex
Within the Services occupations in Elko County, the most male-oriented occupations are Law Enforcement (100.0%), Security & Protection (61.5%), and Cleaning & Maintenance (55.8%), while the most female-oriented occupations are Healthcare Support (85.5%), Food Preparation & Serving (63.0%), and Firefighting & Prevention (51.5%).
| Occupation | Male | Female |
| Healthcare Support | 45 (14.5%) | 266 (85.5%) |
| Security & Protection | 320 (61.5%) | 200 (38.5%) |
| Firefighting & Prevention | 188 (48.4%) | 200 (51.5%) |
| Law Enforcement | 132 (100.0%) | 0 (0.0%) |
| Food Preparation & Serving | 577 (37.0%) | 983 (63.0%) |
| Cleaning & Maintenance | 542 (55.8%) | 430 (44.2%) |
| Personal Care & Service | 616 (53.6%) | 533 (46.4%) |
| Total (Category) | 2,100 (46.5%) | 2,412 (53.5%) |
| Total (Overall) | 15,630 (59.5%) | 10,645 (40.5%) |
Sales and Office Occupations
The most common Sales and Office occupations in Elko County are Office & Administration (2,852 | 10.8%), and Sales & Related (1,855 | 7.1%).

Sales and Office Occupations by Sex
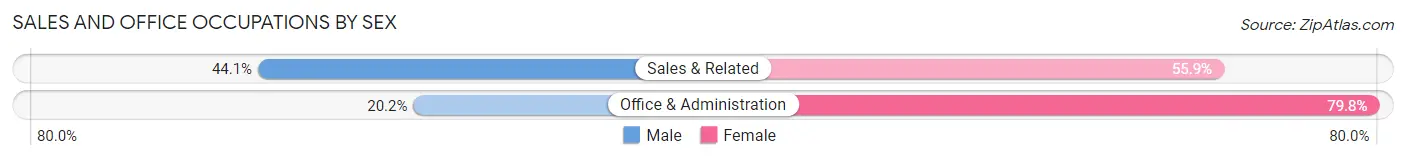
| Occupation | Male | Female |
| Sales & Related | 818 (44.1%) | 1,037 (55.9%) |
| Office & Administration | 576 (20.2%) | 2,276 (79.8%) |
| Total (Category) | 1,394 (29.6%) | 3,313 (70.4%) |
| Total (Overall) | 15,630 (59.5%) | 10,645 (40.5%) |
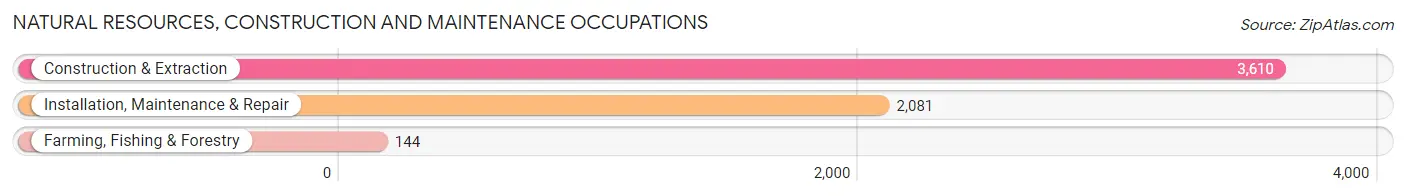
Natural Resources, Construction and Maintenance Occupations
The most common Natural Resources, Construction and Maintenance occupations in Elko County are Construction & Extraction (3,610 | 13.7%), Installation, Maintenance & Repair (2,081 | 7.9%), and Farming, Fishing & Forestry (144 | 0.5%).
Natural Resources, Construction and Maintenance Occupations by Sex
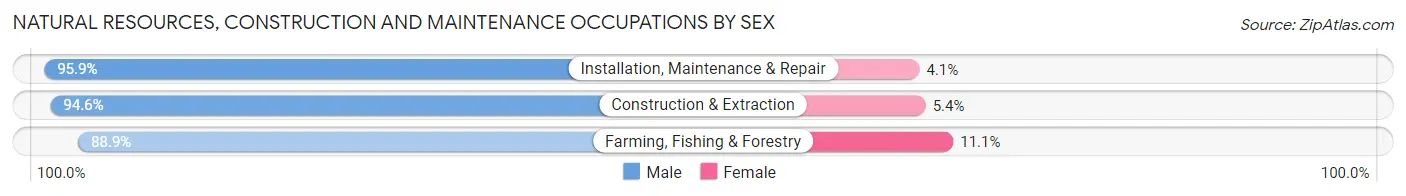
| Occupation | Male | Female |
| Farming, Fishing & Forestry | 128 (88.9%) | 16 (11.1%) |
| Construction & Extraction | 3,416 (94.6%) | 194 (5.4%) |
| Installation, Maintenance & Repair | 1,996 (95.9%) | 85 (4.1%) |
| Total (Category) | 5,540 (94.9%) | 295 (5.1%) |
| Total (Overall) | 15,630 (59.5%) | 10,645 (40.5%) |
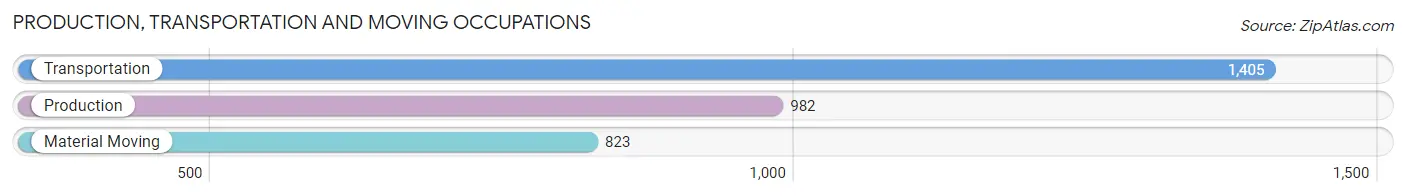
Production, Transportation and Moving Occupations
The most common Production, Transportation and Moving occupations in Elko County are Transportation (1,405 | 5.3%), Production (982 | 3.7%), and Material Moving (823 | 3.1%).
Production, Transportation and Moving Occupations by Sex
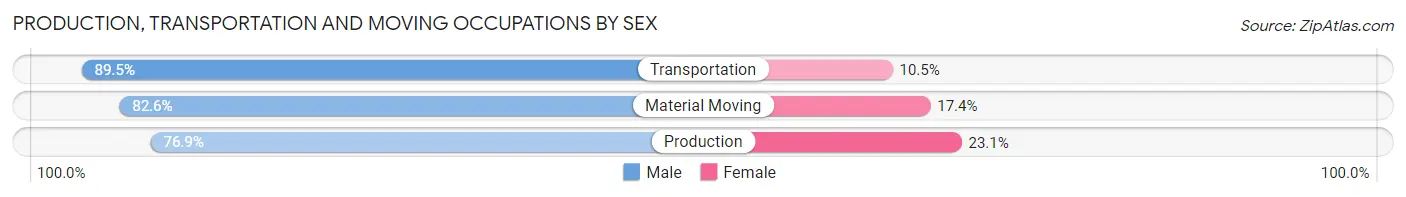
| Occupation | Male | Female |
| Production | 755 (76.9%) | 227 (23.1%) |
| Transportation | 1,258 (89.5%) | 147 (10.5%) |
| Material Moving | 680 (82.6%) | 143 (17.4%) |
| Total (Category) | 2,693 (83.9%) | 517 (16.1%) |
| Total (Overall) | 15,630 (59.5%) | 10,645 (40.5%) |
Employment Industries by Sex in Elko County
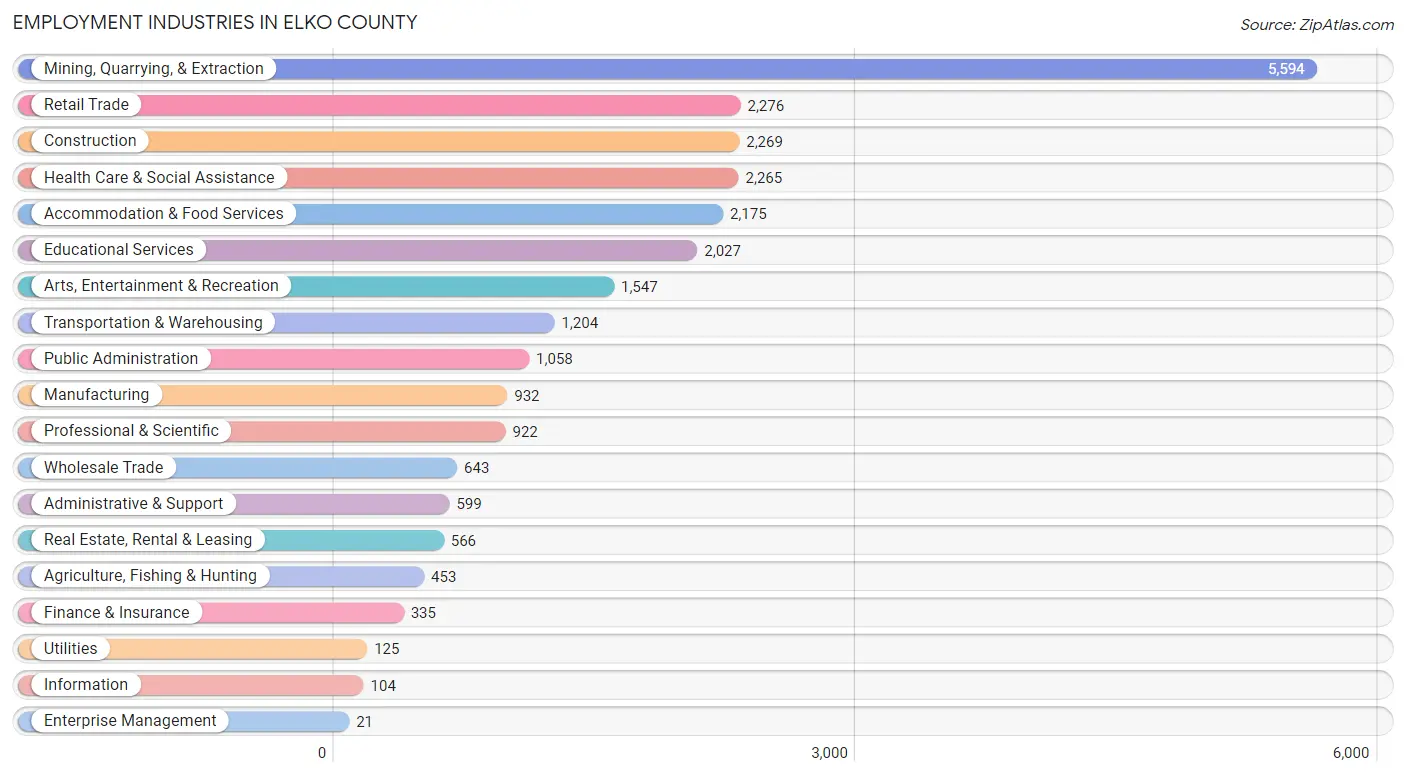
Employment Industries in Elko County
The major employment industries in Elko County include Mining, Quarrying, & Extraction (5,594 | 21.3%), Retail Trade (2,276 | 8.7%), Construction (2,269 | 8.6%), Health Care & Social Assistance (2,265 | 8.6%), and Accommodation & Food Services (2,175 | 8.3%).
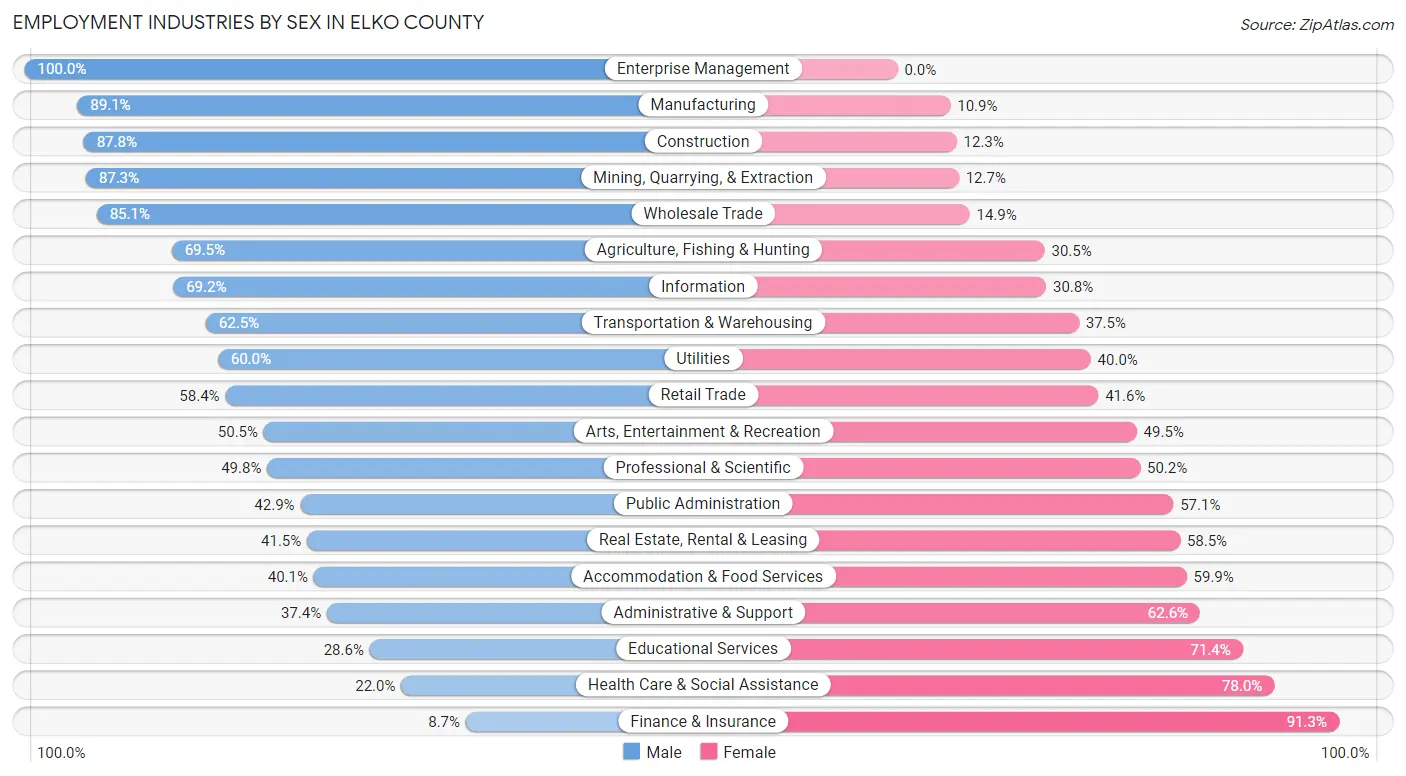
Employment Industries by Sex in Elko County
The Elko County industries that see more men than women are Enterprise Management (100.0%), Manufacturing (89.1%), and Construction (87.7%), whereas the industries that tend to have a higher number of women are Finance & Insurance (91.3%), Health Care & Social Assistance (78.0%), and Educational Services (71.4%).
| Industry | Male | Female |
| Agriculture, Fishing & Hunting | 315 (69.5%) | 138 (30.5%) |
| Mining, Quarrying, & Extraction | 4,884 (87.3%) | 710 (12.7%) |
| Construction | 1,991 (87.7%) | 278 (12.2%) |
| Manufacturing | 830 (89.1%) | 102 (10.9%) |
| Wholesale Trade | 547 (85.1%) | 96 (14.9%) |
| Retail Trade | 1,330 (58.4%) | 946 (41.6%) |
| Transportation & Warehousing | 752 (62.5%) | 452 (37.5%) |
| Utilities | 75 (60.0%) | 50 (40.0%) |
| Information | 72 (69.2%) | 32 (30.8%) |
| Finance & Insurance | 29 (8.7%) | 306 (91.3%) |
| Real Estate, Rental & Leasing | 235 (41.5%) | 331 (58.5%) |
| Professional & Scientific | 459 (49.8%) | 463 (50.2%) |
| Enterprise Management | 21 (100.0%) | 0 (0.0%) |
| Administrative & Support | 224 (37.4%) | 375 (62.6%) |
| Educational Services | 579 (28.6%) | 1,448 (71.4%) |
| Health Care & Social Assistance | 499 (22.0%) | 1,766 (78.0%) |
| Arts, Entertainment & Recreation | 781 (50.5%) | 766 (49.5%) |
| Accommodation & Food Services | 873 (40.1%) | 1,302 (59.9%) |
| Public Administration | 454 (42.9%) | 604 (57.1%) |
| Total | 15,630 (59.5%) | 10,645 (40.5%) |
Education in Elko County
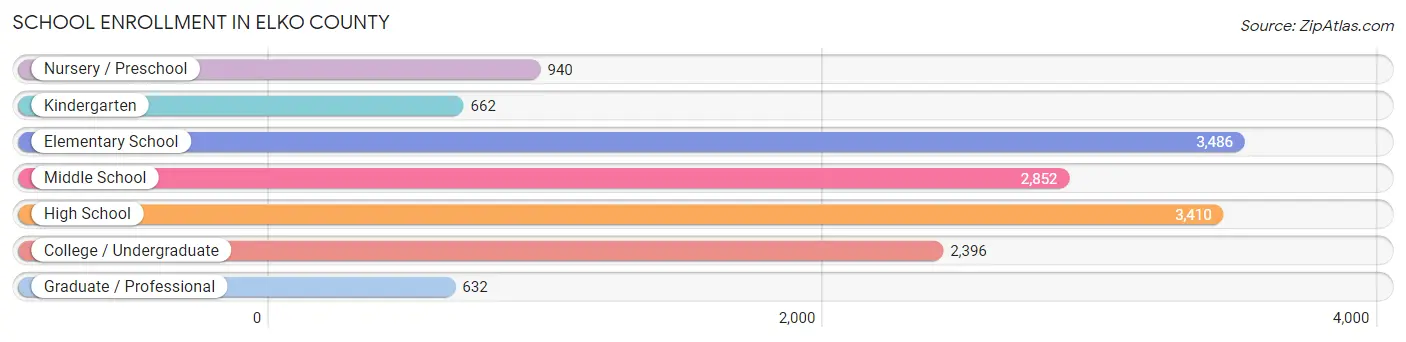
School Enrollment in Elko County
The most common levels of schooling among the 14,378 students in Elko County are elementary school (3,486 | 24.2%), high school (3,410 | 23.7%), and middle school (2,852 | 19.8%).
| School Level | # Students | % Students |
| Nursery / Preschool | 940 | 6.5% |
| Kindergarten | 662 | 4.6% |
| Elementary School | 3,486 | 24.2% |
| Middle School | 2,852 | 19.8% |
| High School | 3,410 | 23.7% |
| College / Undergraduate | 2,396 | 16.7% |
| Graduate / Professional | 632 | 4.4% |
| Total | 14,378 | 100.0% |
School Enrollment by Age by Funding Source in Elko County
Out of a total of 14,378 students who are enrolled in schools in Elko County, 1,668 (11.6%) attend a private institution, while the remaining 12,710 (88.4%) are enrolled in public schools. The age group of 3 to 4 year olds has the highest likelihood of being enrolled in private schools, with 174 (31.2% in the age bracket) enrolled. Conversely, the age group of 15 to 17 year olds has the lowest likelihood of being enrolled in a private school, with 2,104 (92.5% in the age bracket) attending a public institution.
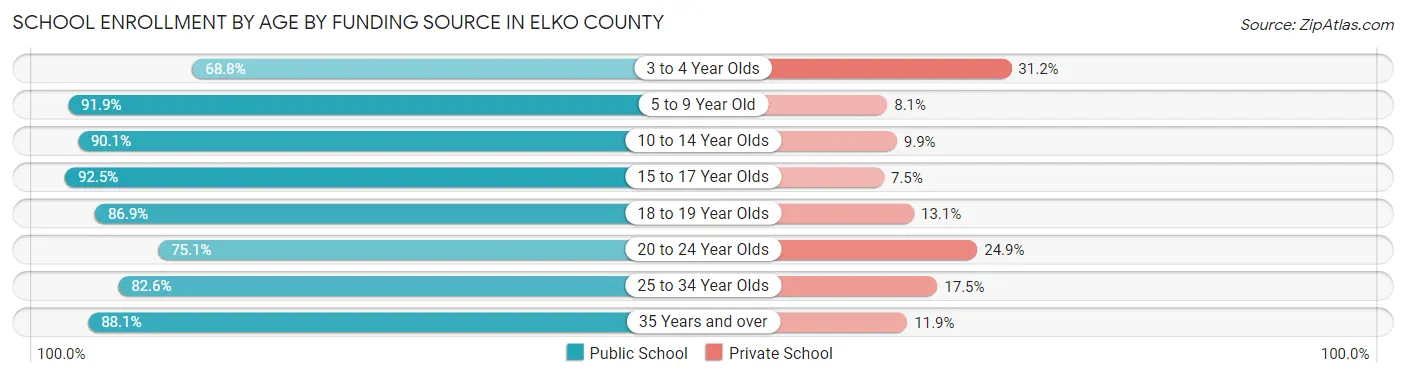
| Age Bracket | Public School | Private School |
| 3 to 4 Year Olds | 383 (68.8%) | 174 (31.2%) |
| 5 to 9 Year Old | 3,756 (91.9%) | 332 (8.1%) |
| 10 to 14 Year Olds | 3,286 (90.1%) | 361 (9.9%) |
| 15 to 17 Year Olds | 2,104 (92.5%) | 171 (7.5%) |
| 18 to 19 Year Olds | 709 (86.9%) | 107 (13.1%) |
| 20 to 24 Year Olds | 700 (75.1%) | 232 (24.9%) |
| 25 to 34 Year Olds | 582 (82.6%) | 123 (17.4%) |
| 35 Years and over | 1,197 (88.1%) | 161 (11.9%) |
| Total | 12,710 (88.4%) | 1,668 (11.6%) |
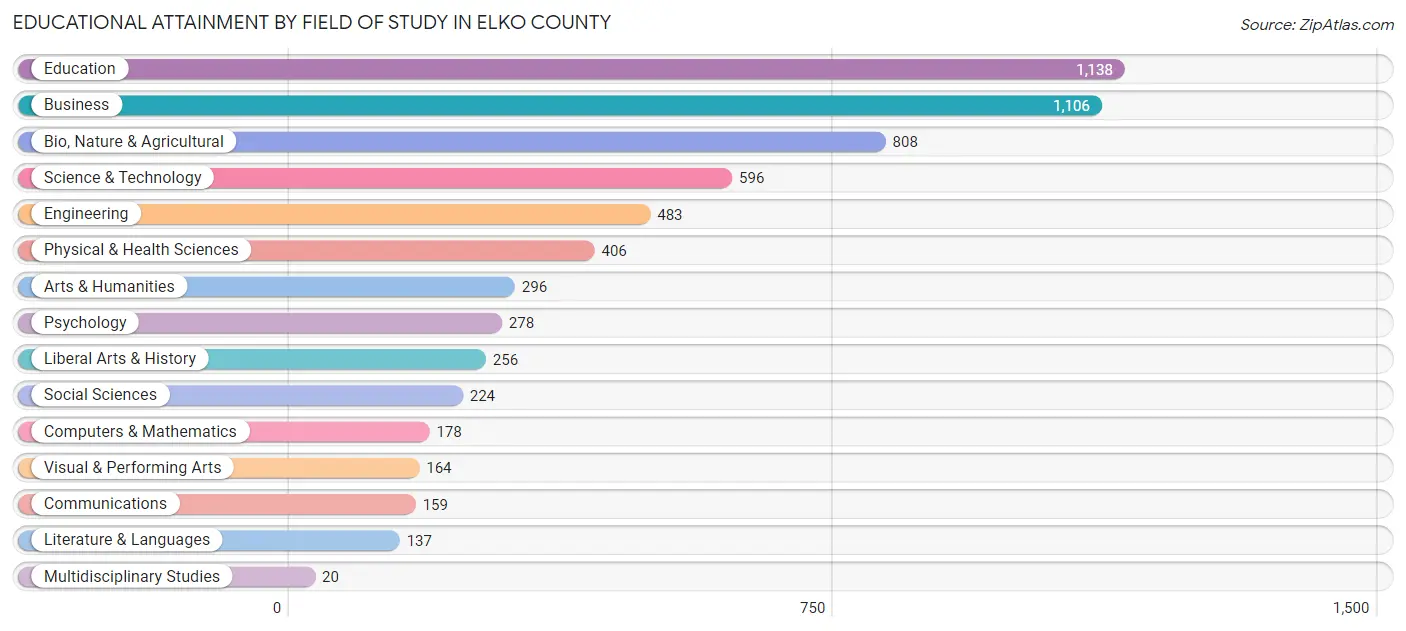
Educational Attainment by Field of Study in Elko County
Education (1,138 | 18.2%), business (1,106 | 17.7%), bio, nature & agricultural (808 | 12.9%), science & technology (596 | 9.5%), and engineering (483 | 7.7%) are the most common fields of study among 6,249 individuals in Elko County who have obtained a bachelor's degree or higher.
| Field of Study | # Graduates | % Graduates |
| Computers & Mathematics | 178 | 2.9% |
| Bio, Nature & Agricultural | 808 | 12.9% |
| Physical & Health Sciences | 406 | 6.5% |
| Psychology | 278 | 4.4% |
| Social Sciences | 224 | 3.6% |
| Engineering | 483 | 7.7% |
| Multidisciplinary Studies | 20 | 0.3% |
| Science & Technology | 596 | 9.5% |
| Business | 1,106 | 17.7% |
| Education | 1,138 | 18.2% |
| Literature & Languages | 137 | 2.2% |
| Liberal Arts & History | 256 | 4.1% |
| Visual & Performing Arts | 164 | 2.6% |
| Communications | 159 | 2.5% |
| Arts & Humanities | 296 | 4.7% |
| Total | 6,249 | 100.0% |
Transportation & Commute in Elko County
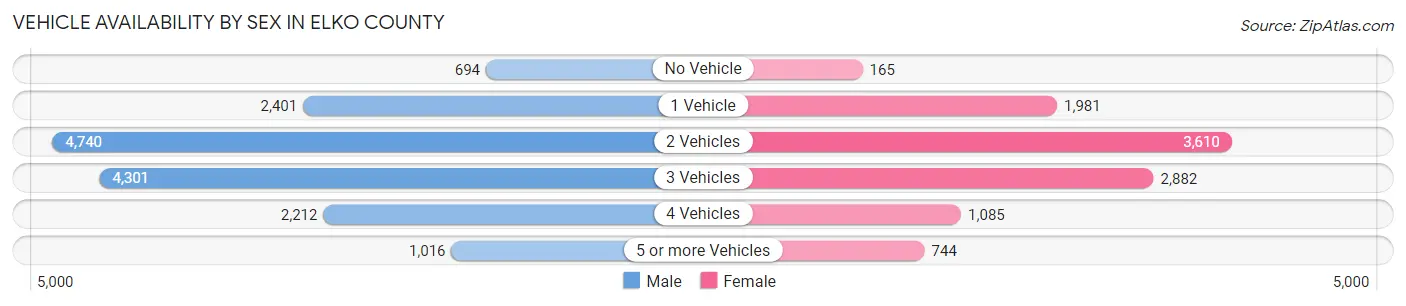
Vehicle Availability by Sex in Elko County
The most prevalent vehicle ownership categories in Elko County are males with 2 vehicles (4,740, accounting for 30.8%) and females with 2 vehicles (3,610, making up 45.3%).
| Vehicles Available | Male | Female |
| No Vehicle | 694 (4.5%) | 165 (1.6%) |
| 1 Vehicle | 2,401 (15.6%) | 1,981 (18.9%) |
| 2 Vehicles | 4,740 (30.8%) | 3,610 (34.5%) |
| 3 Vehicles | 4,301 (28.0%) | 2,882 (27.5%) |
| 4 Vehicles | 2,212 (14.4%) | 1,085 (10.4%) |
| 5 or more Vehicles | 1,016 (6.6%) | 744 (7.1%) |
| Total | 15,364 (100.0%) | 10,467 (100.0%) |
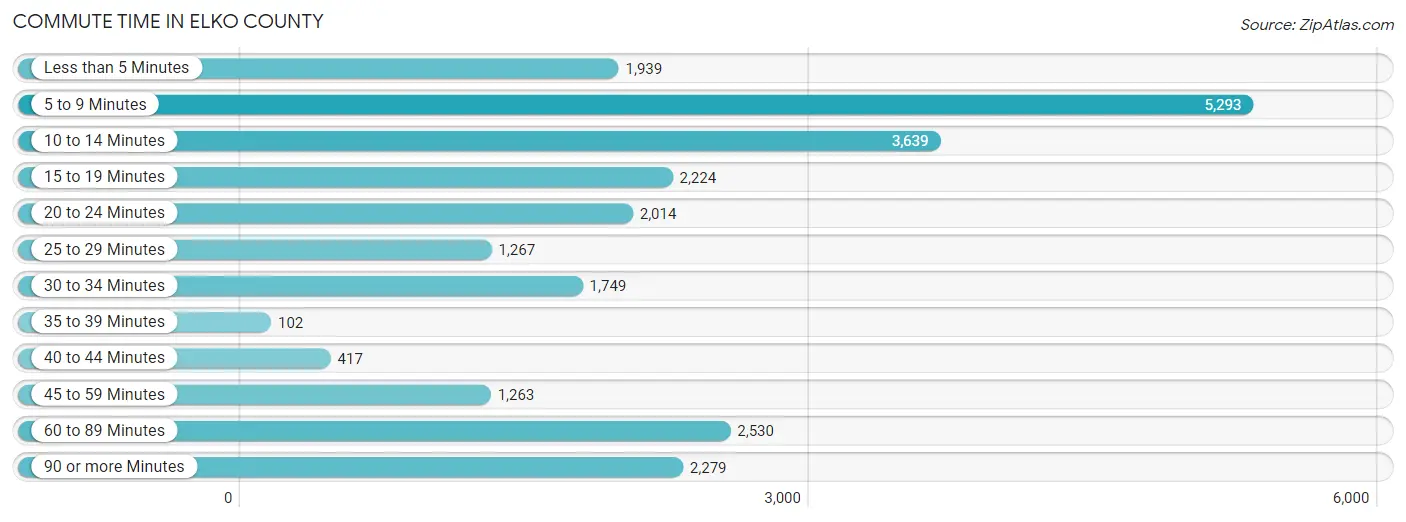
Commute Time in Elko County
The most frequently occuring commute durations in Elko County are 5 to 9 minutes (5,293 commuters, 21.4%), 10 to 14 minutes (3,639 commuters, 14.7%), and 60 to 89 minutes (2,530 commuters, 10.2%).
| Commute Time | # Commuters | % Commuters |
| Less than 5 Minutes | 1,939 | 7.9% |
| 5 to 9 Minutes | 5,293 | 21.4% |
| 10 to 14 Minutes | 3,639 | 14.7% |
| 15 to 19 Minutes | 2,224 | 9.0% |
| 20 to 24 Minutes | 2,014 | 8.2% |
| 25 to 29 Minutes | 1,267 | 5.1% |
| 30 to 34 Minutes | 1,749 | 7.1% |
| 35 to 39 Minutes | 102 | 0.4% |
| 40 to 44 Minutes | 417 | 1.7% |
| 45 to 59 Minutes | 1,263 | 5.1% |
| 60 to 89 Minutes | 2,530 | 10.2% |
| 90 or more Minutes | 2,279 | 9.2% |
Commute Time by Sex in Elko County
The most common commute times in Elko County are 5 to 9 minutes (2,458 commuters, 16.5%) for males and 5 to 9 minutes (2,835 commuters, 29.0%) for females.
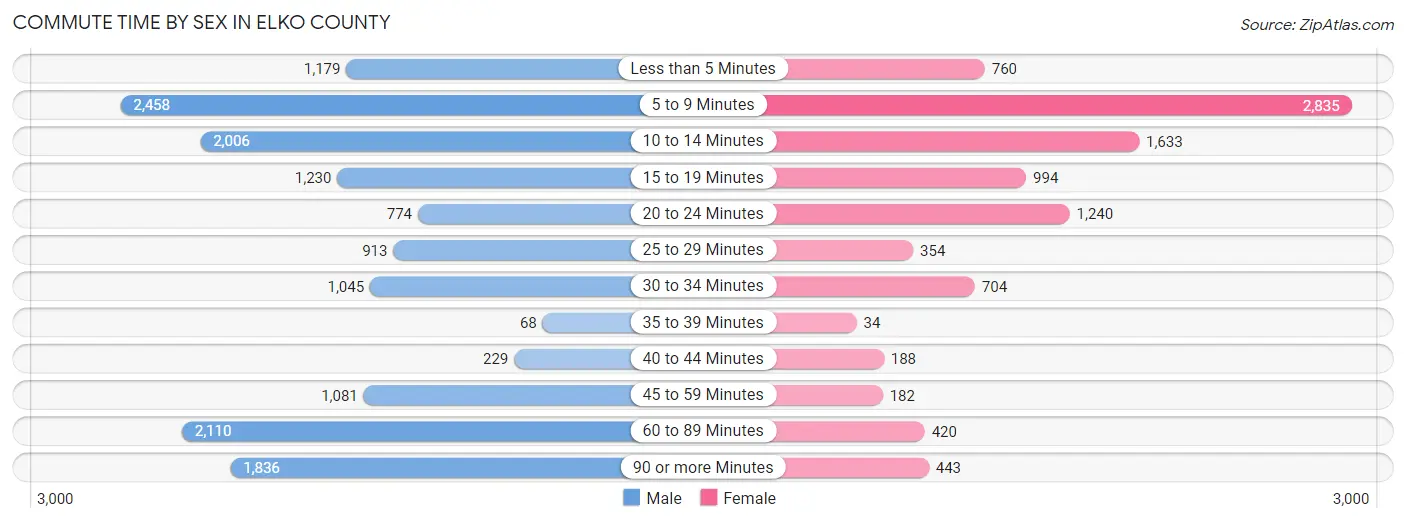
| Commute Time | Male | Female |
| Less than 5 Minutes | 1,179 (7.9%) | 760 (7.8%) |
| 5 to 9 Minutes | 2,458 (16.5%) | 2,835 (29.0%) |
| 10 to 14 Minutes | 2,006 (13.4%) | 1,633 (16.7%) |
| 15 to 19 Minutes | 1,230 (8.2%) | 994 (10.2%) |
| 20 to 24 Minutes | 774 (5.2%) | 1,240 (12.7%) |
| 25 to 29 Minutes | 913 (6.1%) | 354 (3.6%) |
| 30 to 34 Minutes | 1,045 (7.0%) | 704 (7.2%) |
| 35 to 39 Minutes | 68 (0.5%) | 34 (0.4%) |
| 40 to 44 Minutes | 229 (1.5%) | 188 (1.9%) |
| 45 to 59 Minutes | 1,081 (7.2%) | 182 (1.9%) |
| 60 to 89 Minutes | 2,110 (14.1%) | 420 (4.3%) |
| 90 or more Minutes | 1,836 (12.3%) | 443 (4.5%) |
Time of Departure to Work by Sex in Elko County
The most frequent times of departure to work in Elko County are 12:00 AM to 4:59 AM (4,246, 28.4%) for males and 7:30 AM to 7:59 AM (1,511, 15.4%) for females.
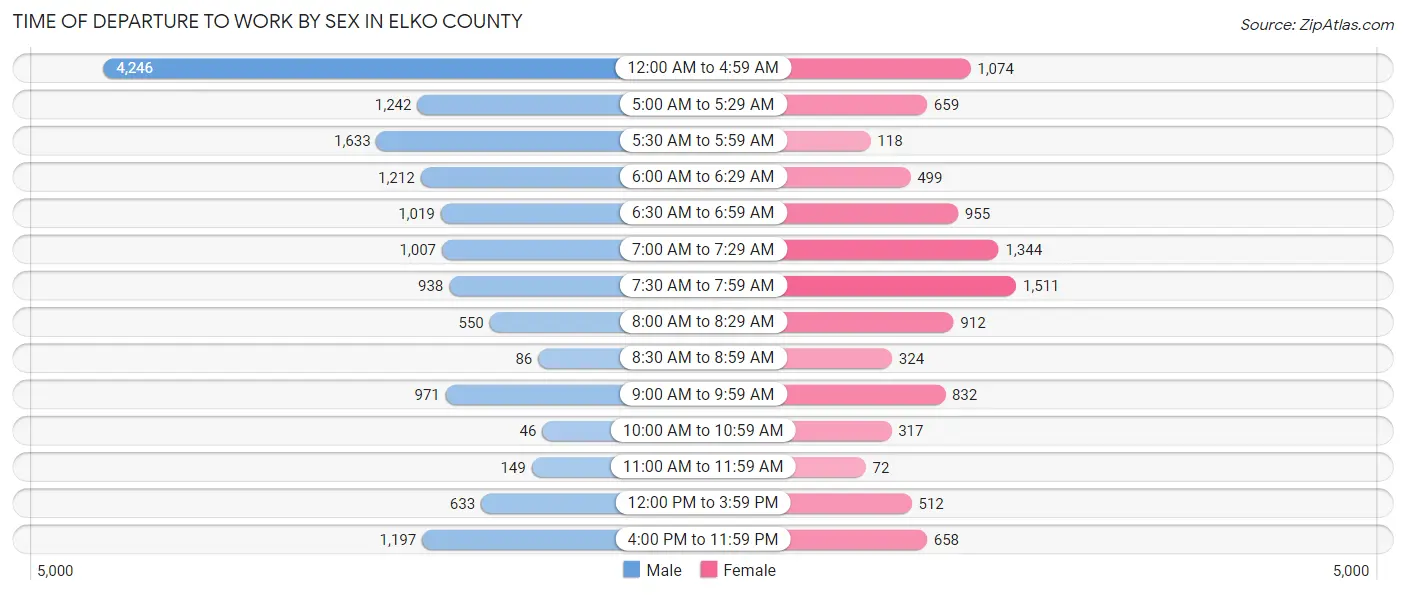
| Time of Departure | Male | Female |
| 12:00 AM to 4:59 AM | 4,246 (28.4%) | 1,074 (11.0%) |
| 5:00 AM to 5:29 AM | 1,242 (8.3%) | 659 (6.7%) |
| 5:30 AM to 5:59 AM | 1,633 (10.9%) | 118 (1.2%) |
| 6:00 AM to 6:29 AM | 1,212 (8.1%) | 499 (5.1%) |
| 6:30 AM to 6:59 AM | 1,019 (6.8%) | 955 (9.8%) |
| 7:00 AM to 7:29 AM | 1,007 (6.8%) | 1,344 (13.7%) |
| 7:30 AM to 7:59 AM | 938 (6.3%) | 1,511 (15.4%) |
| 8:00 AM to 8:29 AM | 550 (3.7%) | 912 (9.3%) |
| 8:30 AM to 8:59 AM | 86 (0.6%) | 324 (3.3%) |
| 9:00 AM to 9:59 AM | 971 (6.5%) | 832 (8.5%) |
| 10:00 AM to 10:59 AM | 46 (0.3%) | 317 (3.2%) |
| 11:00 AM to 11:59 AM | 149 (1.0%) | 72 (0.7%) |
| 12:00 PM to 3:59 PM | 633 (4.2%) | 512 (5.2%) |
| 4:00 PM to 11:59 PM | 1,197 (8.0%) | 658 (6.7%) |
| Total | 14,929 (100.0%) | 9,787 (100.0%) |
Housing Occupancy in Elko County
Occupancy by Ownership in Elko County
Of the total 19,032 dwellings in Elko County, owner-occupied units account for 13,012 (68.4%), while renter-occupied units make up 6,020 (31.6%).
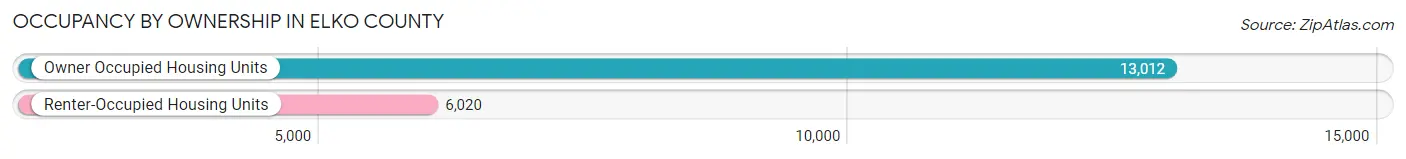
| Occupancy | # Housing Units | % Housing Units |
| Owner Occupied Housing Units | 13,012 | 68.4% |
| Renter-Occupied Housing Units | 6,020 | 31.6% |
| Total Occupied Housing Units | 19,032 | 100.0% |
Occupancy by Household Size in Elko County
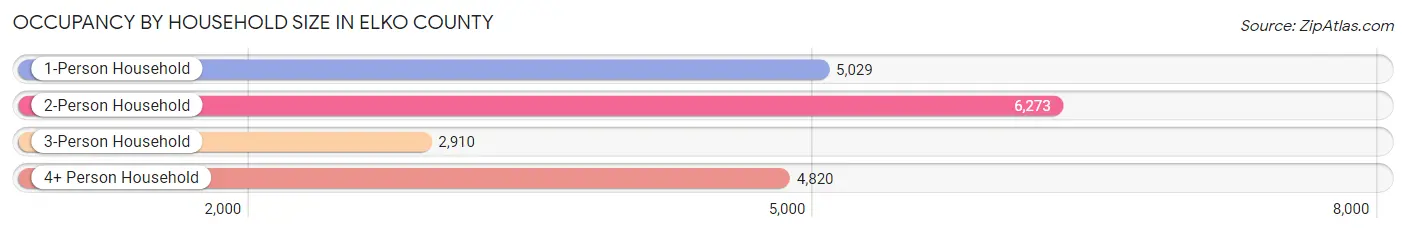
| Household Size | # Housing Units | % Housing Units |
| 1-Person Household | 5,029 | 26.4% |
| 2-Person Household | 6,273 | 33.0% |
| 3-Person Household | 2,910 | 15.3% |
| 4+ Person Household | 4,820 | 25.3% |
| Total Housing Units | 19,032 | 100.0% |
Occupancy by Ownership by Household Size in Elko County
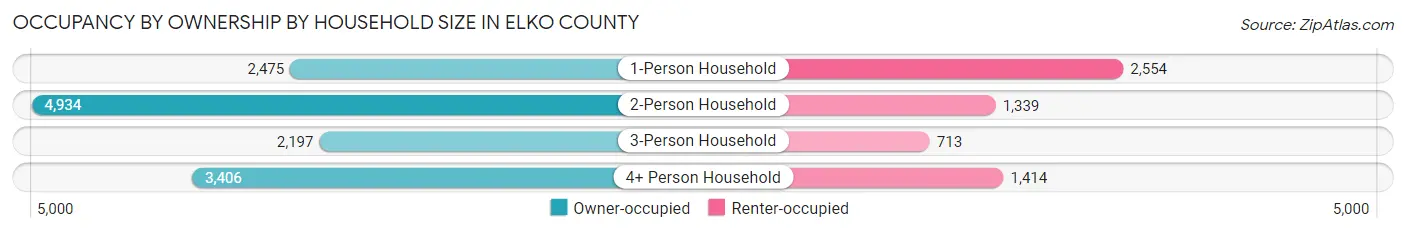
| Household Size | Owner-occupied | Renter-occupied |
| 1-Person Household | 2,475 (49.2%) | 2,554 (50.8%) |
| 2-Person Household | 4,934 (78.6%) | 1,339 (21.3%) |
| 3-Person Household | 2,197 (75.5%) | 713 (24.5%) |
| 4+ Person Household | 3,406 (70.7%) | 1,414 (29.3%) |
| Total Housing Units | 13,012 (68.4%) | 6,020 (31.6%) |
Occupancy by Educational Attainment in Elko County
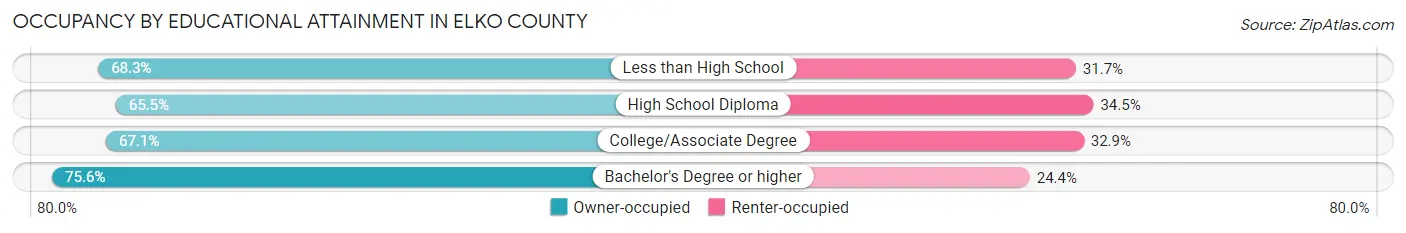
| Household Size | Owner-occupied | Renter-occupied |
| Less than High School | 1,169 (68.3%) | 542 (31.7%) |
| High School Diploma | 3,696 (65.5%) | 1,944 (34.5%) |
| College/Associate Degree | 5,382 (67.1%) | 2,643 (32.9%) |
| Bachelor's Degree or higher | 2,765 (75.6%) | 891 (24.4%) |
Occupancy by Age of Householder in Elko County
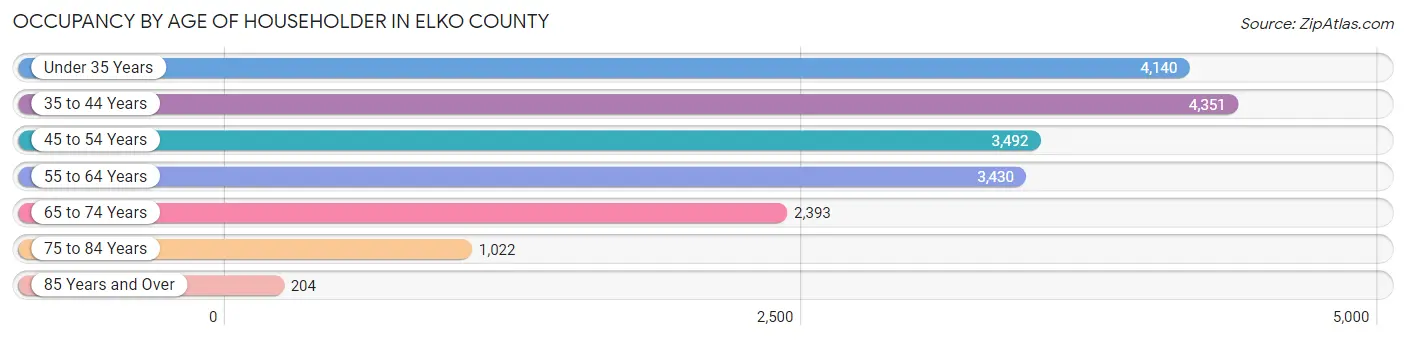
| Age Bracket | # Households | % Households |
| Under 35 Years | 4,140 | 21.7% |
| 35 to 44 Years | 4,351 | 22.9% |
| 45 to 54 Years | 3,492 | 18.3% |
| 55 to 64 Years | 3,430 | 18.0% |
| 65 to 74 Years | 2,393 | 12.6% |
| 75 to 84 Years | 1,022 | 5.4% |
| 85 Years and Over | 204 | 1.1% |
| Total | 19,032 | 100.0% |
Housing Finances in Elko County
Median Income by Occupancy in Elko County
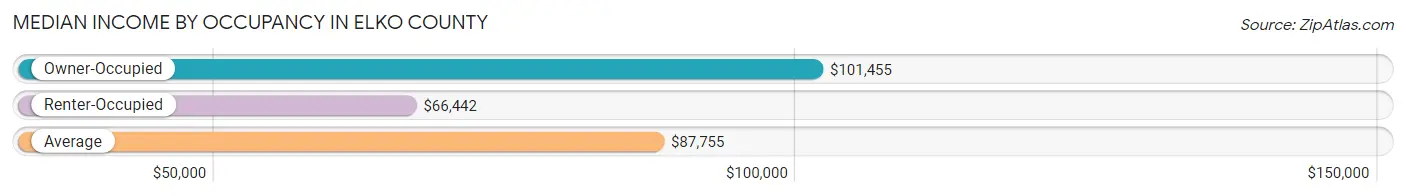
| Occupancy Type | # Households | Median Income |
| Owner-Occupied | 13,012 (68.4%) | $101,455 |
| Renter-Occupied | 6,020 (31.6%) | $66,442 |
| Average | 19,032 (100.0%) | $87,755 |
Occupancy by Householder Income Bracket in Elko County
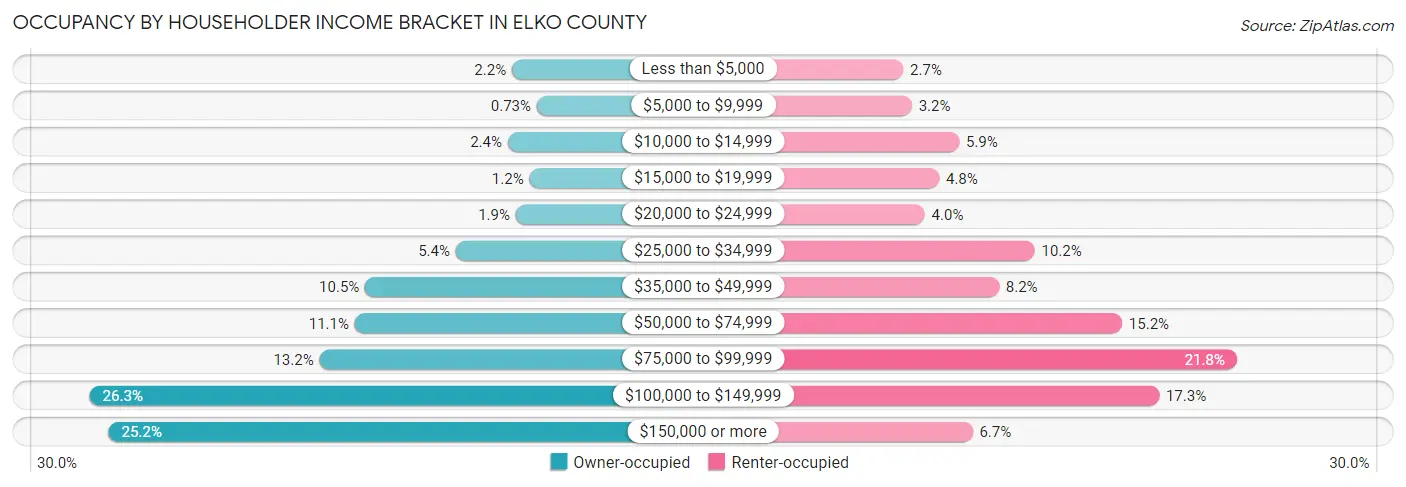
| Income Bracket | Owner-occupied | Renter-occupied |
| Less than $5,000 | 280 (2.1%) | 164 (2.7%) |
| $5,000 to $9,999 | 95 (0.7%) | 193 (3.2%) |
| $10,000 to $14,999 | 311 (2.4%) | 356 (5.9%) |
| $15,000 to $19,999 | 149 (1.1%) | 287 (4.8%) |
| $20,000 to $24,999 | 251 (1.9%) | 238 (4.0%) |
| $25,000 to $34,999 | 698 (5.4%) | 616 (10.2%) |
| $35,000 to $49,999 | 1,371 (10.5%) | 493 (8.2%) |
| $50,000 to $74,999 | 1,448 (11.1%) | 916 (15.2%) |
| $75,000 to $99,999 | 1,711 (13.2%) | 1,311 (21.8%) |
| $100,000 to $149,999 | 3,419 (26.3%) | 1,044 (17.3%) |
| $150,000 or more | 3,279 (25.2%) | 402 (6.7%) |
| Total | 13,012 (100.0%) | 6,020 (100.0%) |
Monthly Housing Cost Tiers in Elko County
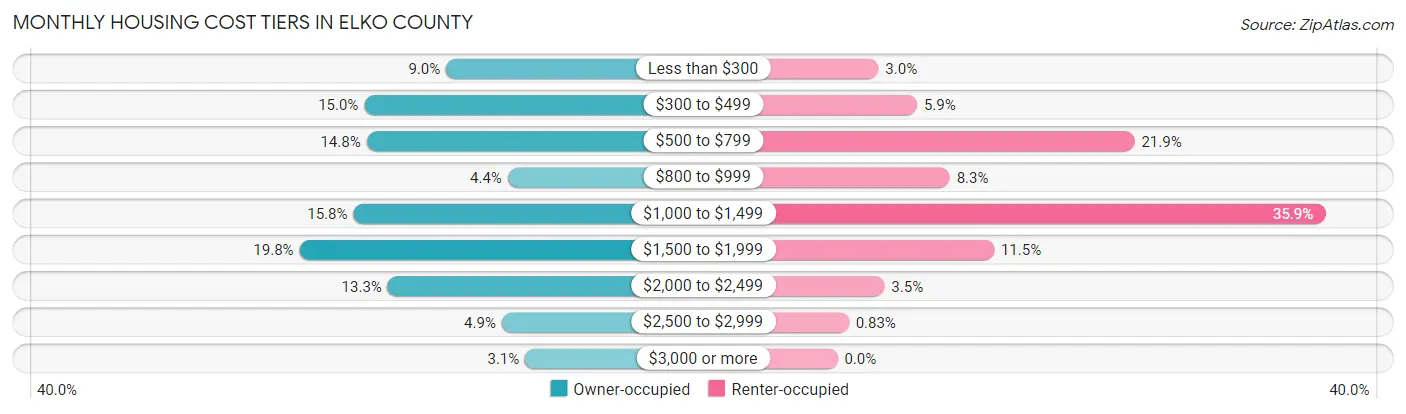
| Monthly Cost | Owner-occupied | Renter-occupied |
| Less than $300 | 1,166 (9.0%) | 182 (3.0%) |
| $300 to $499 | 1,950 (15.0%) | 353 (5.9%) |
| $500 to $799 | 1,928 (14.8%) | 1,317 (21.9%) |
| $800 to $999 | 575 (4.4%) | 498 (8.3%) |
| $1,000 to $1,499 | 2,055 (15.8%) | 2,162 (35.9%) |
| $1,500 to $1,999 | 2,571 (19.8%) | 694 (11.5%) |
| $2,000 to $2,499 | 1,726 (13.3%) | 208 (3.5%) |
| $2,500 to $2,999 | 633 (4.9%) | 50 (0.8%) |
| $3,000 or more | 408 (3.1%) | 0 (0.0%) |
| Total | 13,012 (100.0%) | 6,020 (100.0%) |
Physical Housing Characteristics in Elko County
Housing Structures in Elko County
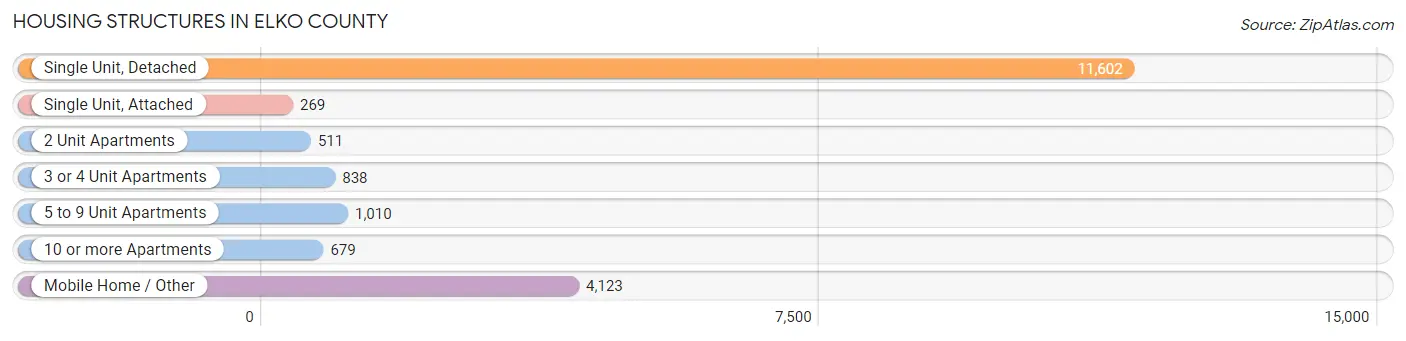
| Structure Type | # Housing Units | % Housing Units |
| Single Unit, Detached | 11,602 | 61.0% |
| Single Unit, Attached | 269 | 1.4% |
| 2 Unit Apartments | 511 | 2.7% |
| 3 or 4 Unit Apartments | 838 | 4.4% |
| 5 to 9 Unit Apartments | 1,010 | 5.3% |
| 10 or more Apartments | 679 | 3.6% |
| Mobile Home / Other | 4,123 | 21.7% |
| Total | 19,032 | 100.0% |
Housing Structures by Occupancy in Elko County
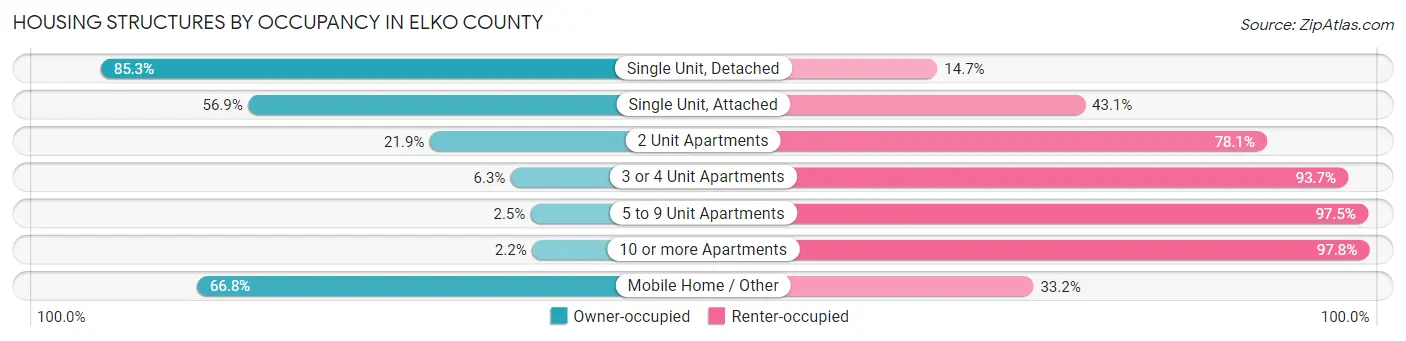
| Structure Type | Owner-occupied | Renter-occupied |
| Single Unit, Detached | 9,899 (85.3%) | 1,703 (14.7%) |
| Single Unit, Attached | 153 (56.9%) | 116 (43.1%) |
| 2 Unit Apartments | 112 (21.9%) | 399 (78.1%) |
| 3 or 4 Unit Apartments | 53 (6.3%) | 785 (93.7%) |
| 5 to 9 Unit Apartments | 25 (2.5%) | 985 (97.5%) |
| 10 or more Apartments | 15 (2.2%) | 664 (97.8%) |
| Mobile Home / Other | 2,755 (66.8%) | 1,368 (33.2%) |
| Total | 13,012 (68.4%) | 6,020 (31.6%) |
Housing Structures by Number of Rooms in Elko County
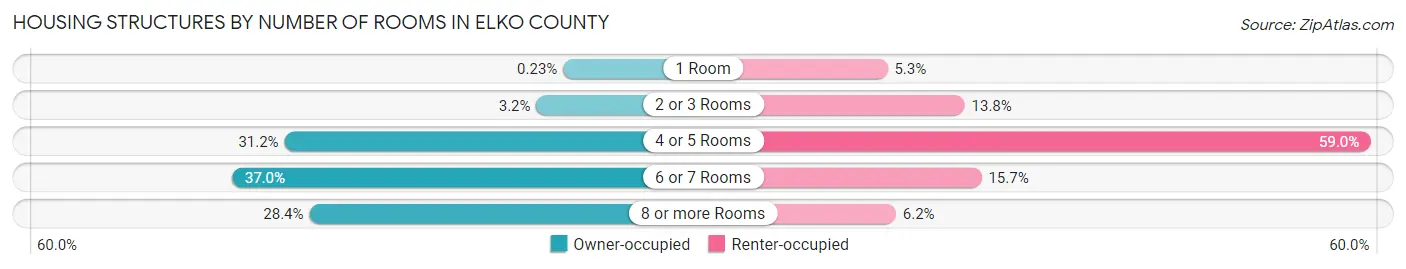
| Number of Rooms | Owner-occupied | Renter-occupied |
| 1 Room | 30 (0.2%) | 318 (5.3%) |
| 2 or 3 Rooms | 417 (3.2%) | 833 (13.8%) |
| 4 or 5 Rooms | 4,055 (31.2%) | 3,549 (59.0%) |
| 6 or 7 Rooms | 4,814 (37.0%) | 946 (15.7%) |
| 8 or more Rooms | 3,696 (28.4%) | 374 (6.2%) |
| Total | 13,012 (100.0%) | 6,020 (100.0%) |
Housing Structure by Heating Type in Elko County
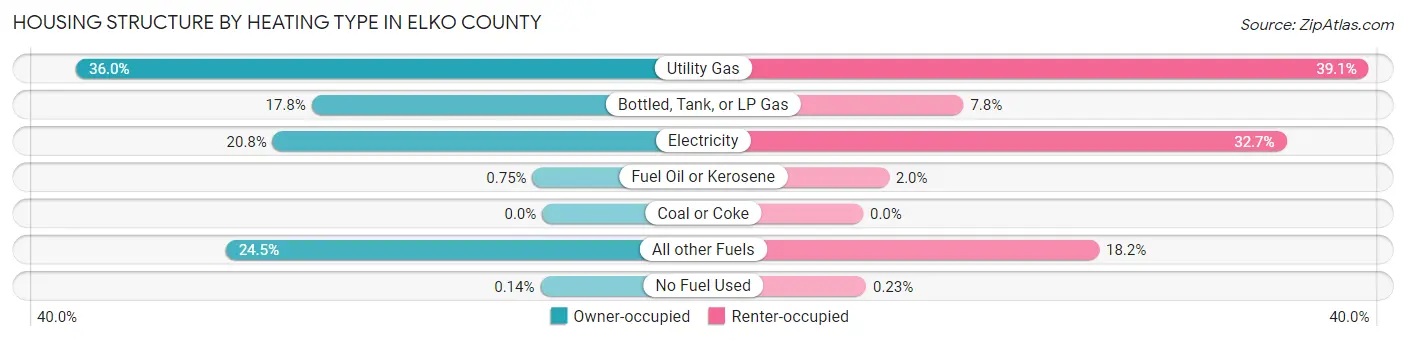
| Heating Type | Owner-occupied | Renter-occupied |
| Utility Gas | 4,685 (36.0%) | 2,352 (39.1%) |
| Bottled, Tank, or LP Gas | 2,319 (17.8%) | 467 (7.8%) |
| Electricity | 2,711 (20.8%) | 1,969 (32.7%) |
| Fuel Oil or Kerosene | 98 (0.7%) | 120 (2.0%) |
| Coal or Coke | 0 (0.0%) | 0 (0.0%) |
| All other Fuels | 3,181 (24.4%) | 1,098 (18.2%) |
| No Fuel Used | 18 (0.1%) | 14 (0.2%) |
| Total | 13,012 (100.0%) | 6,020 (100.0%) |
Household Vehicle Usage in Elko County
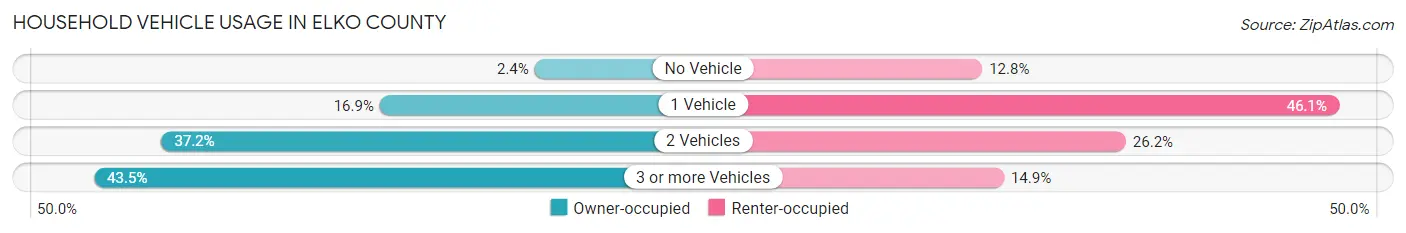
| Vehicles per Household | Owner-occupied | Renter-occupied |
| No Vehicle | 311 (2.4%) | 772 (12.8%) |
| 1 Vehicle | 2,193 (16.9%) | 2,775 (46.1%) |
| 2 Vehicles | 4,845 (37.2%) | 1,579 (26.2%) |
| 3 or more Vehicles | 5,663 (43.5%) | 894 (14.8%) |
| Total | 13,012 (100.0%) | 6,020 (100.0%) |
Real Estate & Mortgages in Elko County
Real Estate and Mortgage Overview in Elko County
| Characteristic | Without Mortgage | With Mortgage |
| Housing Units | 5,257 | 7,755 |
| Median Property Value | $203,400 | $295,800 |
| Median Household Income | $75,602 | $2,401 |
| Monthly Housing Costs | $464 | $408 |
| Real Estate Taxes | $1,101 | $308 |
Property Value by Mortgage Status in Elko County
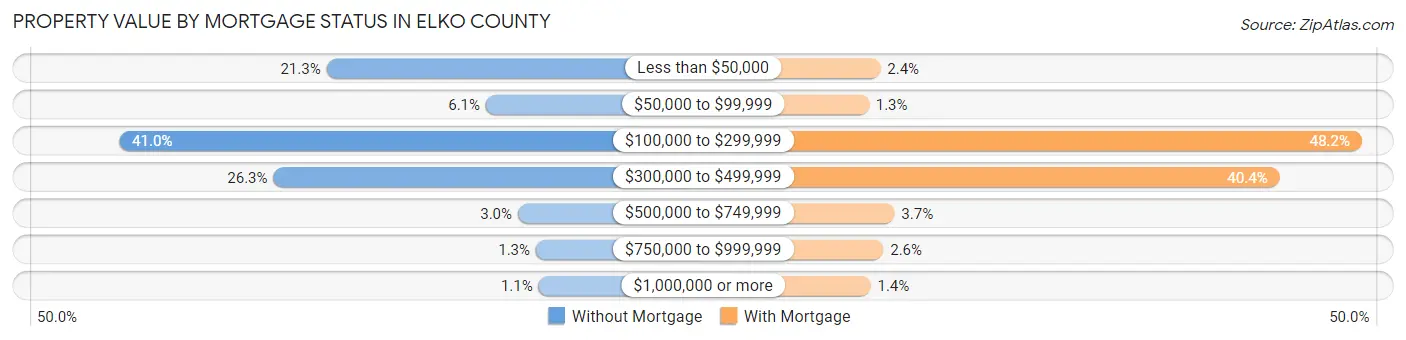
| Property Value | Without Mortgage | With Mortgage |
| Less than $50,000 | 1,117 (21.2%) | 183 (2.4%) |
| $50,000 to $99,999 | 319 (6.1%) | 98 (1.3%) |
| $100,000 to $299,999 | 2,155 (41.0%) | 3,739 (48.2%) |
| $300,000 to $499,999 | 1,383 (26.3%) | 3,132 (40.4%) |
| $500,000 to $749,999 | 159 (3.0%) | 287 (3.7%) |
| $750,000 to $999,999 | 69 (1.3%) | 205 (2.6%) |
| $1,000,000 or more | 55 (1.1%) | 111 (1.4%) |
| Total | 5,257 (100.0%) | 7,755 (100.0%) |
Household Income by Mortgage Status in Elko County
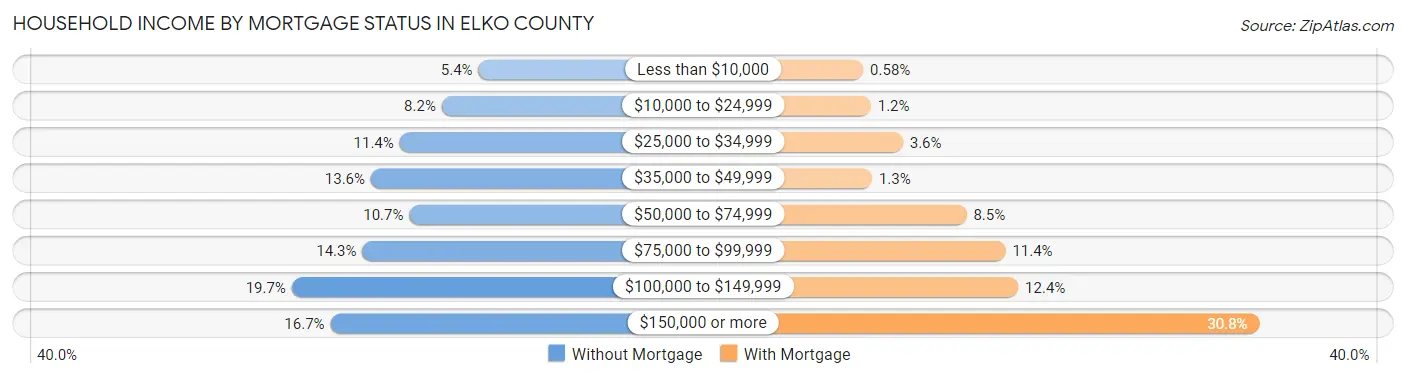
| Household Income | Without Mortgage | With Mortgage |
| Less than $10,000 | 285 (5.4%) | 45 (0.6%) |
| $10,000 to $24,999 | 432 (8.2%) | 90 (1.2%) |
| $25,000 to $34,999 | 601 (11.4%) | 279 (3.6%) |
| $35,000 to $49,999 | 716 (13.6%) | 97 (1.3%) |
| $50,000 to $74,999 | 562 (10.7%) | 655 (8.5%) |
| $75,000 to $99,999 | 750 (14.3%) | 886 (11.4%) |
| $100,000 to $149,999 | 1,033 (19.7%) | 961 (12.4%) |
| $150,000 or more | 878 (16.7%) | 2,386 (30.8%) |
| Total | 5,257 (100.0%) | 7,755 (100.0%) |
Property Value to Household Income Ratio in Elko County
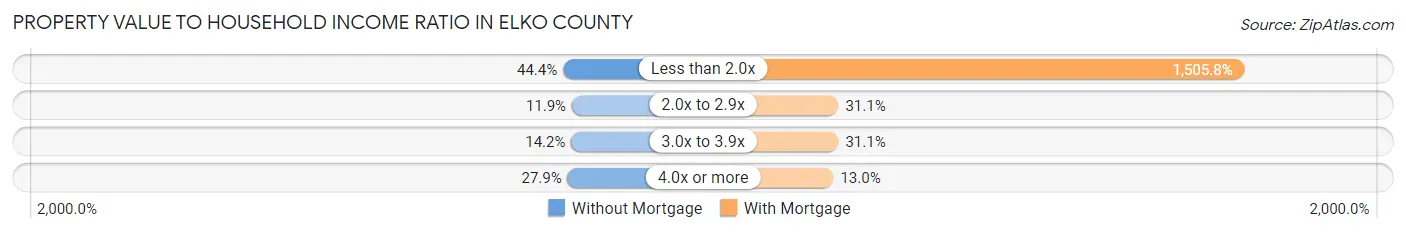
| Value-to-Income Ratio | Without Mortgage | With Mortgage |
| Less than 2.0x | 2,334 (44.4%) | 116,771 (1,505.7%) |
| 2.0x to 2.9x | 627 (11.9%) | 2,413 (31.1%) |
| 3.0x to 3.9x | 748 (14.2%) | 2,415 (31.1%) |
| 4.0x or more | 1,469 (27.9%) | 1,010 (13.0%) |
| Total | 5,257 (100.0%) | 7,755 (100.0%) |
Real Estate Taxes by Mortgage Status in Elko County
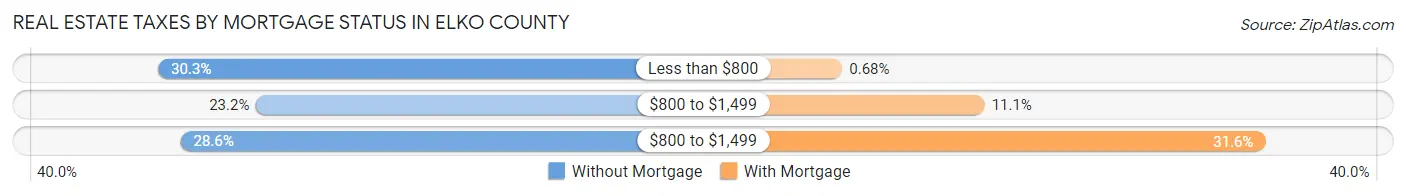
| Property Taxes | Without Mortgage | With Mortgage |
| Less than $800 | 1,590 (30.2%) | 53 (0.7%) |
| $800 to $1,499 | 1,217 (23.2%) | 859 (11.1%) |
| $800 to $1,499 | 1,504 (28.6%) | 2,449 (31.6%) |
| Total | 5,257 (100.0%) | 7,755 (100.0%) |
Health & Disability in Elko County
Health Insurance Coverage by Age in Elko County
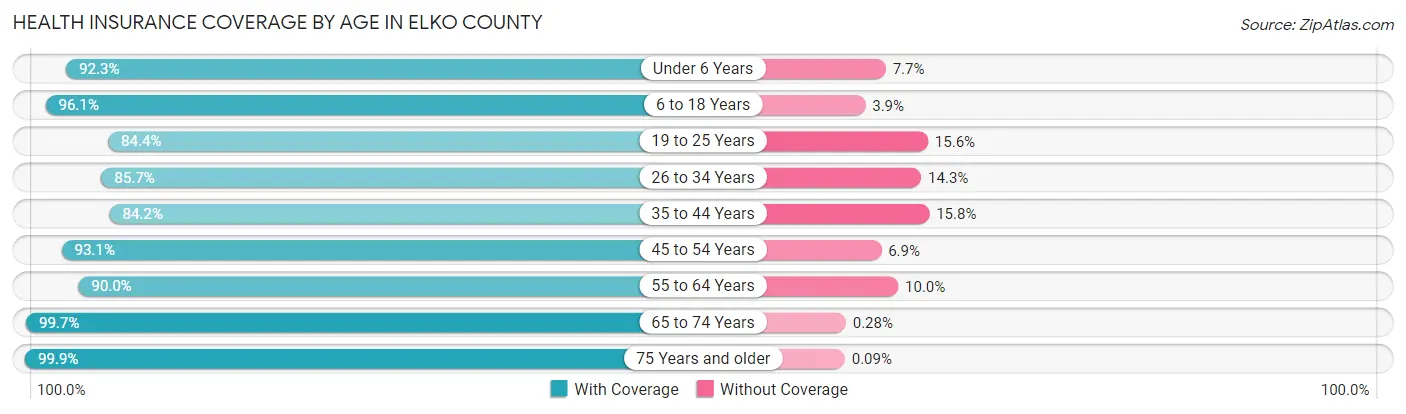
| Age Bracket | With Coverage | Without Coverage |
| Under 6 Years | 4,164 (92.3%) | 349 (7.7%) |
| 6 to 18 Years | 9,904 (96.1%) | 403 (3.9%) |
| 19 to 25 Years | 4,261 (84.4%) | 787 (15.6%) |
| 26 to 34 Years | 5,686 (85.7%) | 951 (14.3%) |
| 35 to 44 Years | 6,016 (84.2%) | 1,132 (15.8%) |
| 45 to 54 Years | 5,864 (93.1%) | 434 (6.9%) |
| 55 to 64 Years | 5,897 (90.0%) | 658 (10.0%) |
| 65 to 74 Years | 4,243 (99.7%) | 12 (0.3%) |
| 75 Years and older | 2,161 (99.9%) | 2 (0.1%) |
| Total | 48,196 (91.1%) | 4,728 (8.9%) |
Health Insurance Coverage by Citizenship Status in Elko County
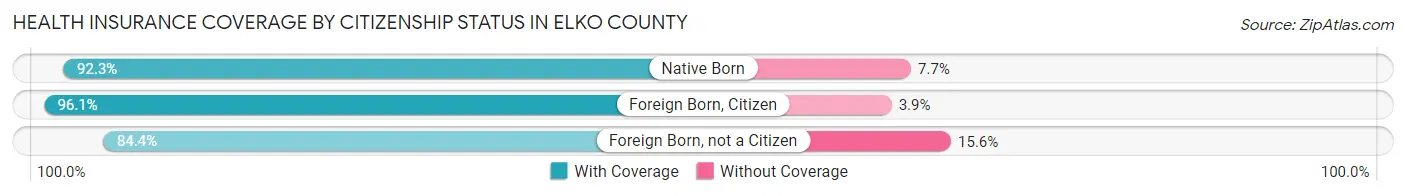
| Citizenship Status | With Coverage | Without Coverage |
| Native Born | 4,164 (92.3%) | 349 (7.7%) |
| Foreign Born, Citizen | 9,904 (96.1%) | 403 (3.9%) |
| Foreign Born, not a Citizen | 4,261 (84.4%) | 787 (15.6%) |
Health Insurance Coverage by Household Income in Elko County
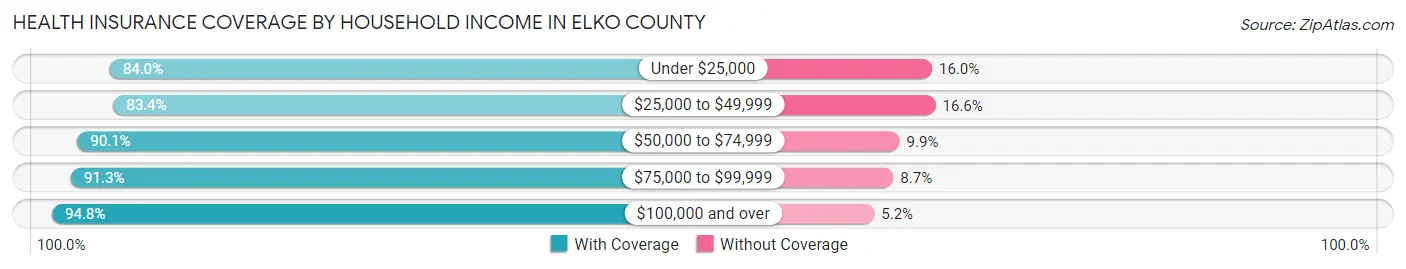
| Household Income | With Coverage | Without Coverage |
| Under $25,000 | 3,333 (84.0%) | 634 (16.0%) |
| $25,000 to $49,999 | 6,850 (83.4%) | 1,366 (16.6%) |
| $50,000 to $74,999 | 5,205 (90.1%) | 572 (9.9%) |
| $75,000 to $99,999 | 7,976 (91.3%) | 763 (8.7%) |
| $100,000 and over | 24,624 (94.8%) | 1,341 (5.2%) |
Public vs Private Health Insurance Coverage by Age in Elko County
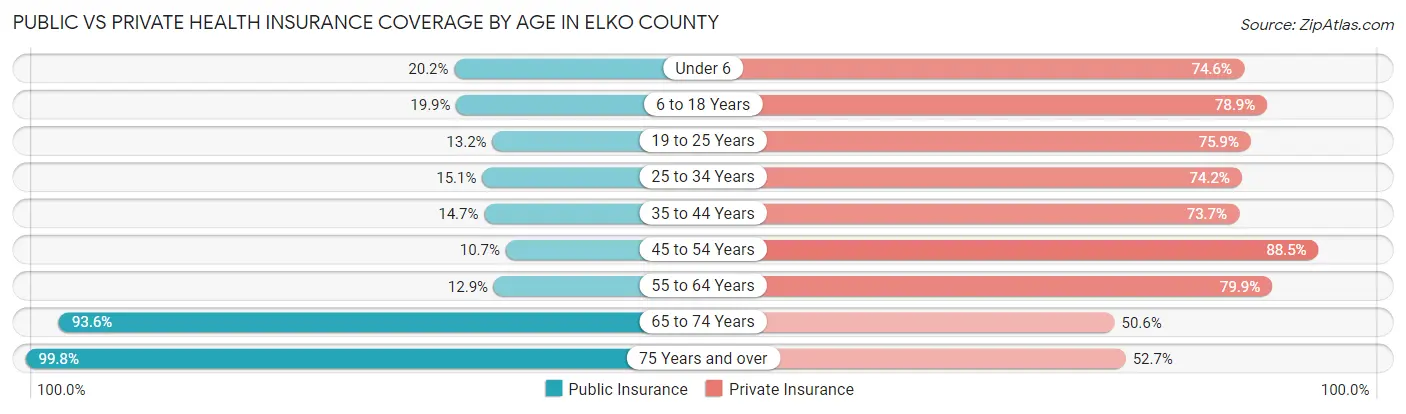
| Age Bracket | Public Insurance | Private Insurance |
| Under 6 | 913 (20.2%) | 3,367 (74.6%) |
| 6 to 18 Years | 2,047 (19.9%) | 8,136 (78.9%) |
| 19 to 25 Years | 665 (13.2%) | 3,832 (75.9%) |
| 25 to 34 Years | 999 (15.0%) | 4,925 (74.2%) |
| 35 to 44 Years | 1,049 (14.7%) | 5,267 (73.7%) |
| 45 to 54 Years | 673 (10.7%) | 5,572 (88.5%) |
| 55 to 64 Years | 845 (12.9%) | 5,235 (79.9%) |
| 65 to 74 Years | 3,984 (93.6%) | 2,154 (50.6%) |
| 75 Years and over | 2,159 (99.8%) | 1,140 (52.7%) |
| Total | 13,334 (25.2%) | 39,628 (74.9%) |
Disability Status by Sex by Age in Elko County
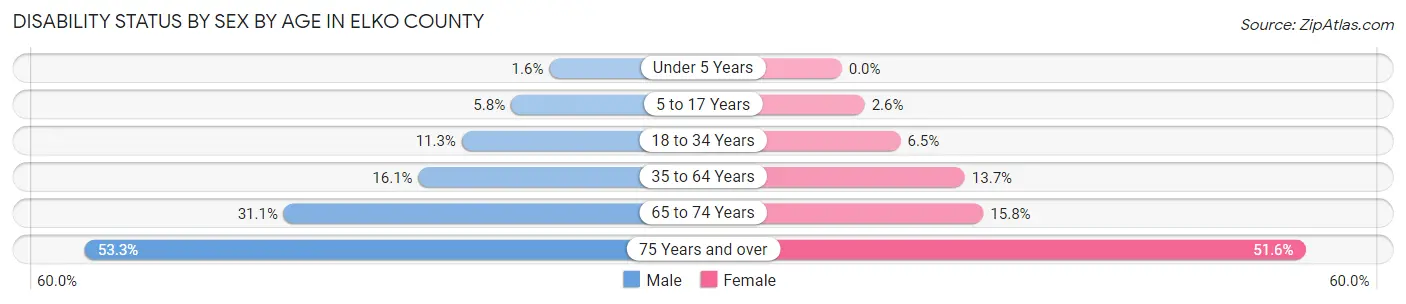
| Age Bracket | Male | Female |
| Under 5 Years | 30 (1.6%) | 0 (0.0%) |
| 5 to 17 Years | 313 (5.8%) | 128 (2.5%) |
| 18 to 34 Years | 733 (11.3%) | 387 (6.5%) |
| 35 to 64 Years | 1,706 (16.1%) | 1,293 (13.7%) |
| 65 to 74 Years | 691 (31.1%) | 321 (15.8%) |
| 75 Years and over | 560 (53.3%) | 574 (51.6%) |
Disability Class by Sex by Age in Elko County
Disability Class: Hearing Difficulty
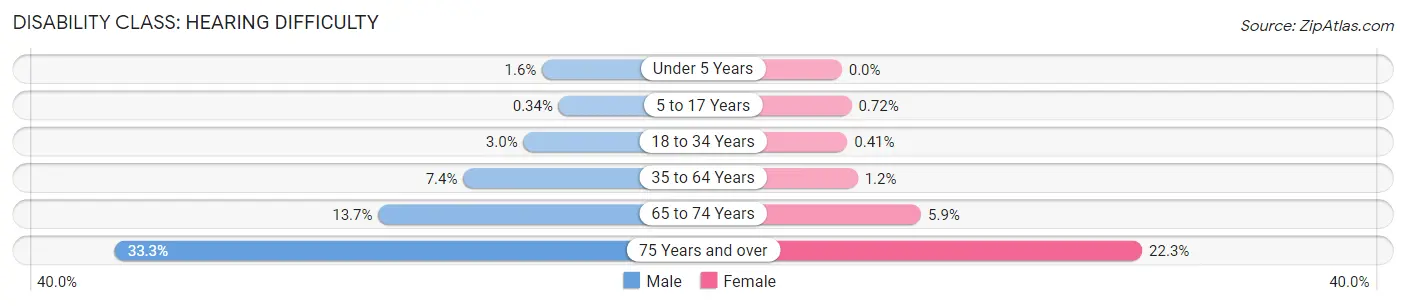
| Age Bracket | Male | Female |
| Under 5 Years | 30 (1.6%) | 0 (0.0%) |
| 5 to 17 Years | 18 (0.3%) | 36 (0.7%) |
| 18 to 34 Years | 192 (3.0%) | 24 (0.4%) |
| 35 to 64 Years | 785 (7.4%) | 111 (1.2%) |
| 65 to 74 Years | 305 (13.7%) | 120 (5.9%) |
| 75 Years and over | 350 (33.3%) | 248 (22.3%) |
Disability Class: Vision Difficulty
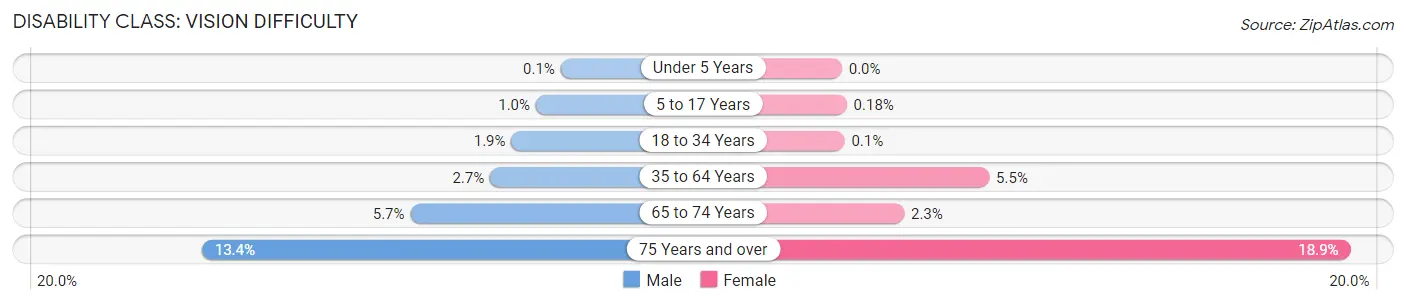
| Age Bracket | Male | Female |
| Under 5 Years | 2 (0.1%) | 0 (0.0%) |
| 5 to 17 Years | 55 (1.0%) | 9 (0.2%) |
| 18 to 34 Years | 125 (1.9%) | 6 (0.1%) |
| 35 to 64 Years | 288 (2.7%) | 516 (5.5%) |
| 65 to 74 Years | 126 (5.7%) | 47 (2.3%) |
| 75 Years and over | 141 (13.4%) | 210 (18.9%) |
Disability Class: Cognitive Difficulty
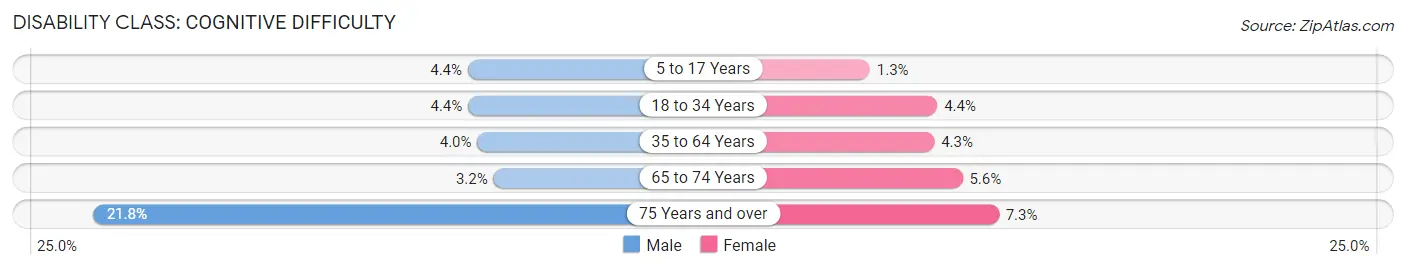
| Age Bracket | Male | Female |
| 5 to 17 Years | 238 (4.4%) | 65 (1.3%) |
| 18 to 34 Years | 286 (4.4%) | 262 (4.4%) |
| 35 to 64 Years | 422 (4.0%) | 405 (4.3%) |
| 65 to 74 Years | 72 (3.2%) | 114 (5.6%) |
| 75 Years and over | 229 (21.8%) | 81 (7.3%) |
Disability Class: Ambulatory Difficulty
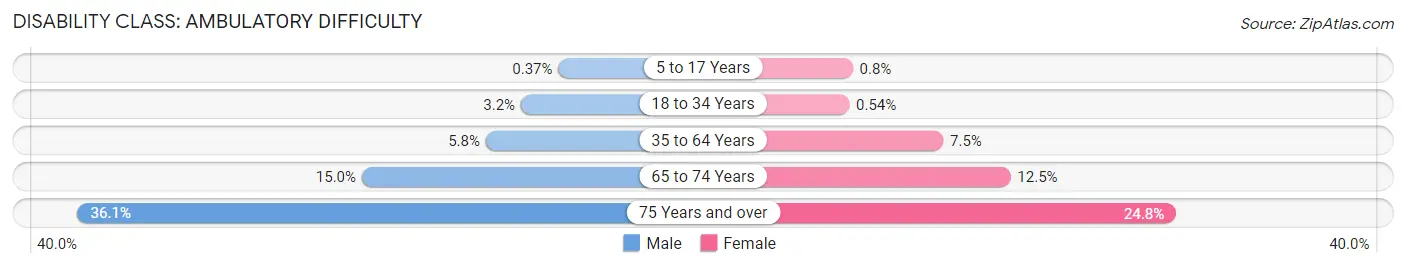
| Age Bracket | Male | Female |
| 5 to 17 Years | 20 (0.4%) | 40 (0.8%) |
| 18 to 34 Years | 204 (3.2%) | 32 (0.5%) |
| 35 to 64 Years | 609 (5.8%) | 709 (7.5%) |
| 65 to 74 Years | 332 (15.0%) | 255 (12.5%) |
| 75 Years and over | 379 (36.1%) | 276 (24.8%) |
Disability Class: Self-Care Difficulty
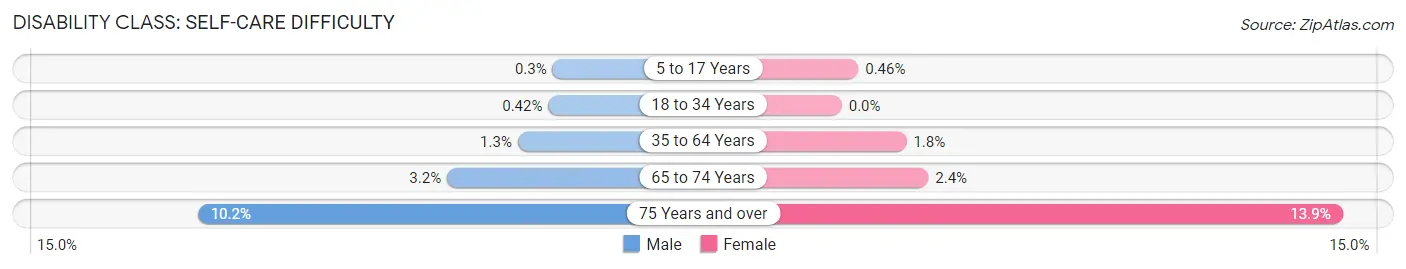
| Age Bracket | Male | Female |
| 5 to 17 Years | 16 (0.3%) | 23 (0.5%) |
| 18 to 34 Years | 27 (0.4%) | 0 (0.0%) |
| 35 to 64 Years | 134 (1.3%) | 170 (1.8%) |
| 65 to 74 Years | 72 (3.2%) | 49 (2.4%) |
| 75 Years and over | 107 (10.2%) | 155 (13.9%) |
Technology Access in Elko County
Computing Device Access in Elko County
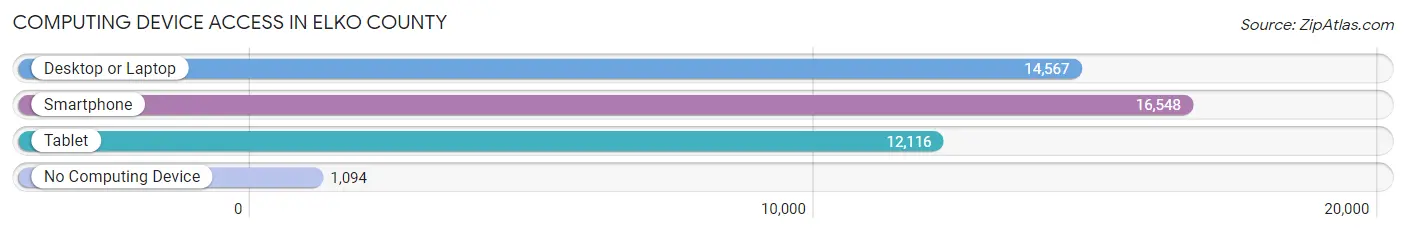
| Device Type | # Households | % Households |
| Desktop or Laptop | 14,567 | 76.5% |
| Smartphone | 16,548 | 87.0% |
| Tablet | 12,116 | 63.7% |
| No Computing Device | 1,094 | 5.8% |
| Total | 19,032 | 100.0% |
Internet Access in Elko County
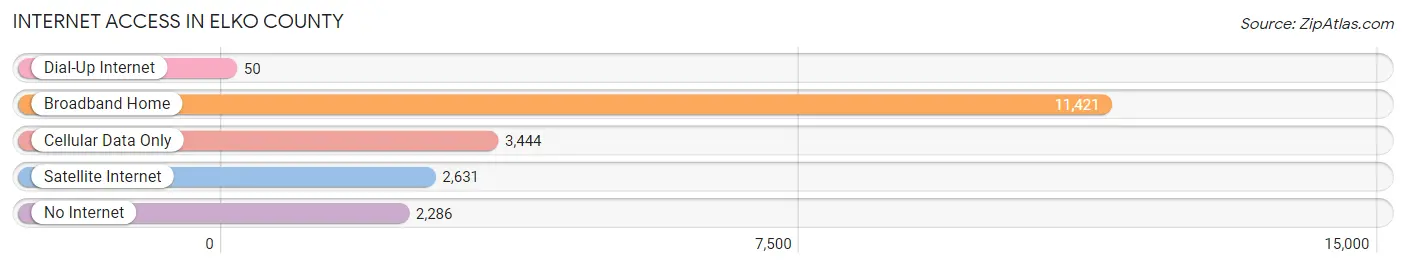
| Internet Type | # Households | % Households |
| Dial-Up Internet | 50 | 0.3% |
| Broadband Home | 11,421 | 60.0% |
| Cellular Data Only | 3,444 | 18.1% |
| Satellite Internet | 2,631 | 13.8% |
| No Internet | 2,286 | 12.0% |
| Total | 19,032 | 100.0% |
Elko County Summary
Elko County is located in the northeastern corner of Nevada and is the fourth largest county in the state. It is bordered by Humboldt County to the north, White Pine County to the east, Lander County to the south, and Eureka County to the west. Elko County covers an area of 10,541 square miles and has a population of approximately 51,000 people.
Geography
Elko County is located in the Great Basin region of the United States and is characterized by its high desert landscape. The county is home to the Ruby Mountains, the East Humboldt Range, and the Jarbidge Mountains. The county is also home to the Humboldt River, which flows through the county from north to south. The county is also home to numerous lakes, including Wildhorse Reservoir, Angel Lake, and Ruby Lake.
The county is divided into two distinct regions: the northern region, which is characterized by its mountainous terrain, and the southern region, which is characterized by its flat, desert landscape. The county is also home to numerous wildlife species, including mule deer, pronghorn antelope, bighorn sheep, and mountain lions.
History
Elko County was established in 1869 and was named after the Elko Indian tribe, which had inhabited the area for centuries. The county was originally part of the Utah Territory, but was later annexed by Nevada in 1864.
The county was initially populated by miners and ranchers, who were attracted to the area by the discovery of gold and silver in the late 19th century. The county was also home to numerous Native American tribes, including the Shoshone, Paiute, and Bannock.
Economy
Elko County is a major center for mining and ranching in Nevada. The county is home to numerous gold and silver mines, as well as copper, lead, and zinc mines. The county is also home to numerous cattle ranches, which produce beef, lamb, and wool.
The county is also home to numerous manufacturing and service industries, including food processing, wood products, and tourism. The county is also home to numerous casinos, which attract visitors from all over the world.
Demographics
As of the 2010 census, Elko County had a population of 51,000 people. The population is predominantly white (86.3%), with smaller percentages of Hispanic (7.2%), Native American (3.2%), and Asian (1.3%) populations. The median household income in the county is $50,000, and the median age is 38.
Elko County is home to numerous educational institutions, including Great Basin College, Elko Community College, and the University of Nevada, Reno. The county is also home to numerous religious institutions, including the Church of Jesus Christ of Latter-day Saints, the Catholic Church, and the Episcopal Church.
Common Questions
What is Per Capita Income in Elko County?
Per Capita income in Elko County is $39,001.
What is the Median Family Income in Elko County?
Median Family Income in Elko County is $100,342.
What is the Median Household income in Elko County?
Median Household Income in Elko County is $87,755.
What is Income or Wage Gap in Elko County?
Income or Wage Gap in Elko County is 45.7%.
Women in Elko County earn 54.3 cents for every dollar earned by a man.
What is Family Income Deficit in Elko County?
Family Income Deficit in Elko County is $9,228.
Families that are below poverty line in Elko County earn $9,228 less on average than the poverty threshold level.
What is Inequality or Gini Index in Elko County?
Inequality or Gini Index in Elko County is 0.41.
What is the Total Population of Elko County?
Total Population of Elko County is 53,600.
What is the Total Male Population of Elko County?
Total Male Population of Elko County is 28,070.
What is the Total Female Population of Elko County?
Total Female Population of Elko County is 25,530.
What is the Ratio of Males per 100 Females in Elko County?
There are 109.95 Males per 100 Females in Elko County.
What is the Ratio of Females per 100 Males in Elko County?
There are 90.95 Females per 100 Males in Elko County.
What is the Median Population Age in Elko County?
Median Population Age in Elko County is 34.9 Years.
What is the Average Family Size in Elko County
Average Family Size in Elko County is 3.4 People.
What is the Average Household Size in Elko County
Average Household Size in Elko County is 2.8 People.
How Large is the Labor Force in Elko County?
There are 27,611 People in the Labor Forcein in Elko County.
What is the Percentage of People in the Labor Force in Elko County?
67.1% of People are in the Labor Force in Elko County.
What is the Unemployment Rate in Elko County?
Unemployment Rate in Elko County is 4.7%.