Churchill County, NV Map & Demographics
Churchill County Map
Churchill County Overview
$35,869
PER CAPITA INCOME
$94,505
AVG FAMILY INCOME
$69,922
AVG HOUSEHOLD INCOME
30.1%
WAGE / INCOME GAP [ % ]
69.9¢/ $1
WAGE / INCOME GAP [ $ ]
$9,512
FAMILY INCOME DEFICIT
0.42
INEQUALITY / GINI INDEX
25,409
TOTAL POPULATION
13,112
MALE POPULATION
12,297
FEMALE POPULATION
106.63
MALES / 100 FEMALES
93.78
FEMALES / 100 MALES
39.7
MEDIAN AGE
3.3
AVG FAMILY SIZE
2.6
AVG HOUSEHOLD SIZE
12,695
LABOR FORCE [ PEOPLE ]
62.5%
PERCENT IN LABOR FORCE
6.3%
UNEMPLOYMENT RATE
Churchill County Area Codes
Income in Churchill County
Income Overview in Churchill County
Per Capita Income in Churchill County is $35,869, while median incomes of families and households are $94,505 and $69,922 respectively.
| Characteristic | Number | Measure |
| Per Capita Income | 25,409 | $35,869 |
| Median Family Income | 5,770 | $94,505 |
| Mean Family Income | 5,770 | $109,273 |
| Median Household Income | 9,595 | $69,922 |
| Mean Household Income | 9,595 | $88,441 |
| Income Deficit | 5,770 | $9,512 |
| Wage / Income Gap (%) | 25,409 | 30.11% |
| Wage / Income Gap ($) | 25,409 | 69.89¢ per $1 |
| Gini / Inequality Index | 25,409 | 0.42 |
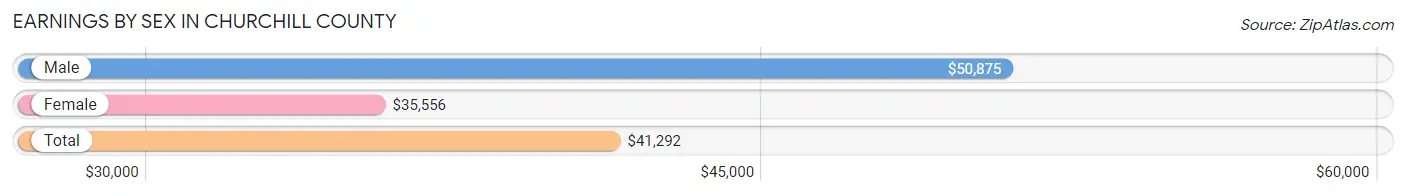
Earnings by Sex in Churchill County
Average Earnings in Churchill County are $41,292, $50,875 for men and $35,556 for women, a difference of 30.1%.
| Sex | Number | Average Earnings |
| Male | 7,547 (58.1%) | $50,875 |
| Female | 5,438 (41.9%) | $35,556 |
| Total | 12,985 (100.0%) | $41,292 |
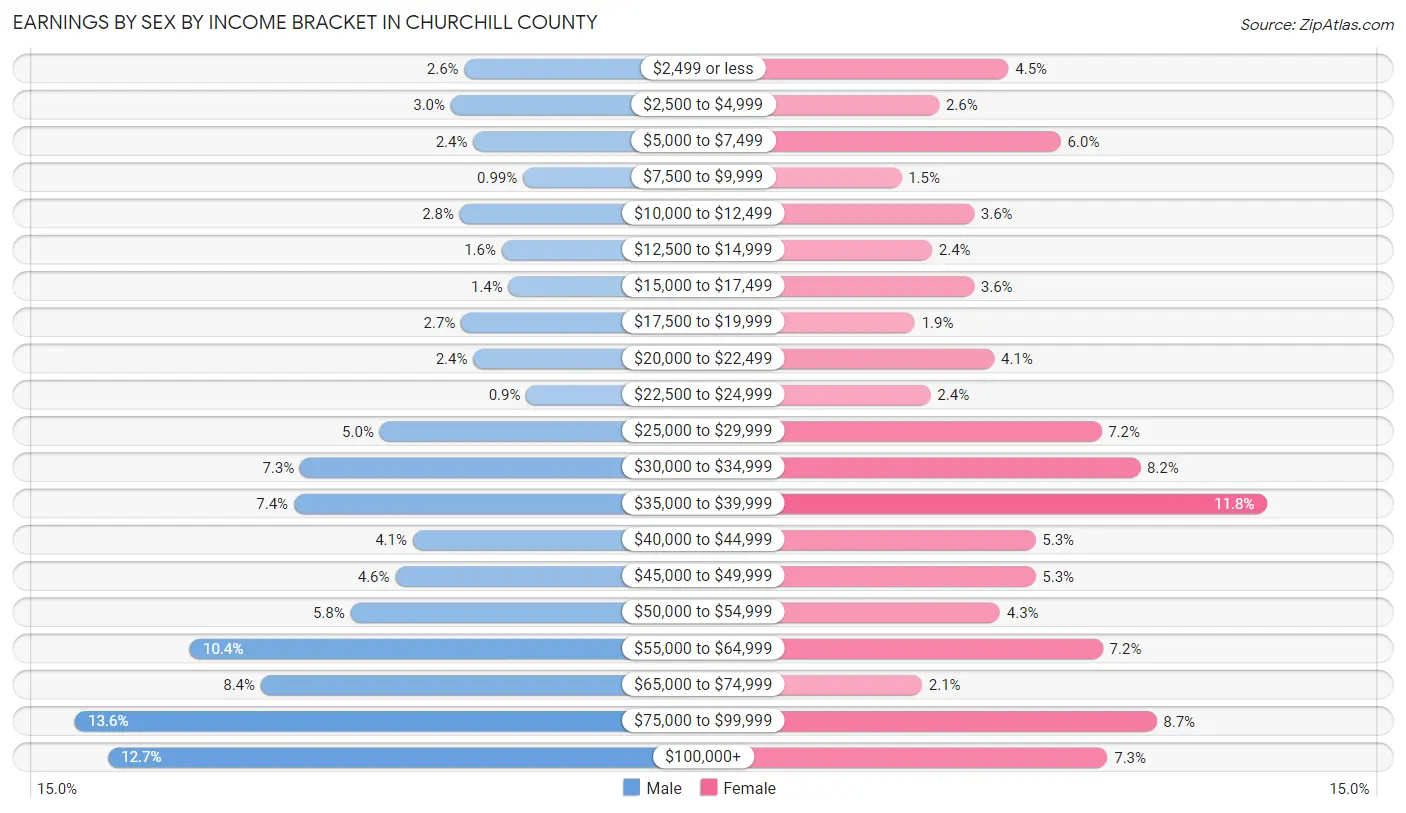
Earnings by Sex by Income Bracket in Churchill County
The most common earnings brackets in Churchill County are $75,000 to $99,999 for men (1,025 | 13.6%) and $35,000 to $39,999 for women (641 | 11.8%).
| Income | Male | Female |
| $2,499 or less | 199 (2.6%) | 247 (4.5%) |
| $2,500 to $4,999 | 228 (3.0%) | 141 (2.6%) |
| $5,000 to $7,499 | 180 (2.4%) | 327 (6.0%) |
| $7,500 to $9,999 | 75 (1.0%) | 83 (1.5%) |
| $10,000 to $12,499 | 209 (2.8%) | 194 (3.6%) |
| $12,500 to $14,999 | 120 (1.6%) | 130 (2.4%) |
| $15,000 to $17,499 | 106 (1.4%) | 194 (3.6%) |
| $17,500 to $19,999 | 206 (2.7%) | 104 (1.9%) |
| $20,000 to $22,499 | 180 (2.4%) | 225 (4.1%) |
| $22,500 to $24,999 | 68 (0.9%) | 128 (2.4%) |
| $25,000 to $29,999 | 379 (5.0%) | 389 (7.1%) |
| $30,000 to $34,999 | 548 (7.3%) | 448 (8.2%) |
| $35,000 to $39,999 | 561 (7.4%) | 641 (11.8%) |
| $40,000 to $44,999 | 309 (4.1%) | 288 (5.3%) |
| $45,000 to $49,999 | 346 (4.6%) | 288 (5.3%) |
| $50,000 to $54,999 | 441 (5.8%) | 234 (4.3%) |
| $55,000 to $64,999 | 781 (10.3%) | 391 (7.2%) |
| $65,000 to $74,999 | 631 (8.4%) | 115 (2.1%) |
| $75,000 to $99,999 | 1,025 (13.6%) | 473 (8.7%) |
| $100,000+ | 955 (12.7%) | 398 (7.3%) |
| Total | 7,547 (100.0%) | 5,438 (100.0%) |
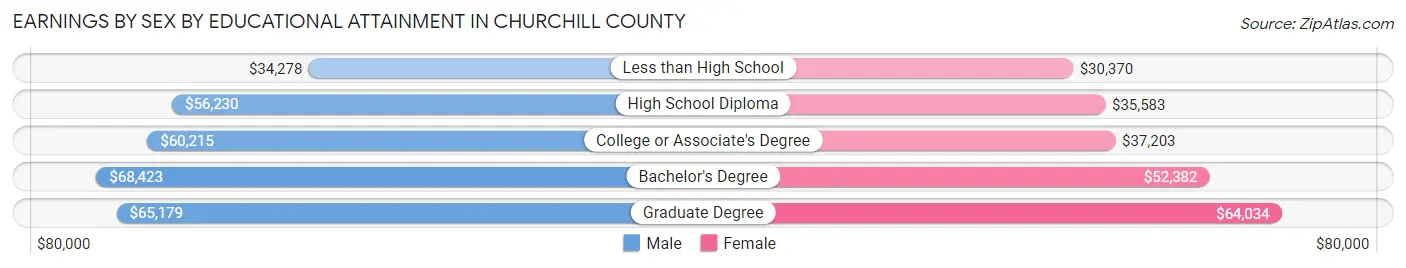
Earnings by Sex by Educational Attainment in Churchill County
Average earnings in Churchill County are $57,246 for men and $37,410 for women, a difference of 34.6%. Men with an educational attainment of bachelor's degree enjoy the highest average annual earnings of $68,423, while those with less than high school education earn the least with $34,278. Women with an educational attainment of graduate degree earn the most with the average annual earnings of $64,034, while those with less than high school education have the smallest earnings of $30,370.
| Educational Attainment | Male Income | Female Income |
| Less than High School | $34,278 | $30,370 |
| High School Diploma | $56,230 | $35,583 |
| College or Associate's Degree | $60,215 | $37,203 |
| Bachelor's Degree | $68,423 | $52,382 |
| Graduate Degree | $65,179 | $64,034 |
| Total | $57,246 | $37,410 |
Family Income in Churchill County
Family Income Brackets in Churchill County
According to the Churchill County family income data, there are 1,546 families falling into the $100,000 to $149,999 income range, which is the most common income bracket and makes up 26.8% of all families. Conversely, the $10,000 to $14,999 income bracket is the least frequent group with only 23 families (0.4%) belonging to this category.
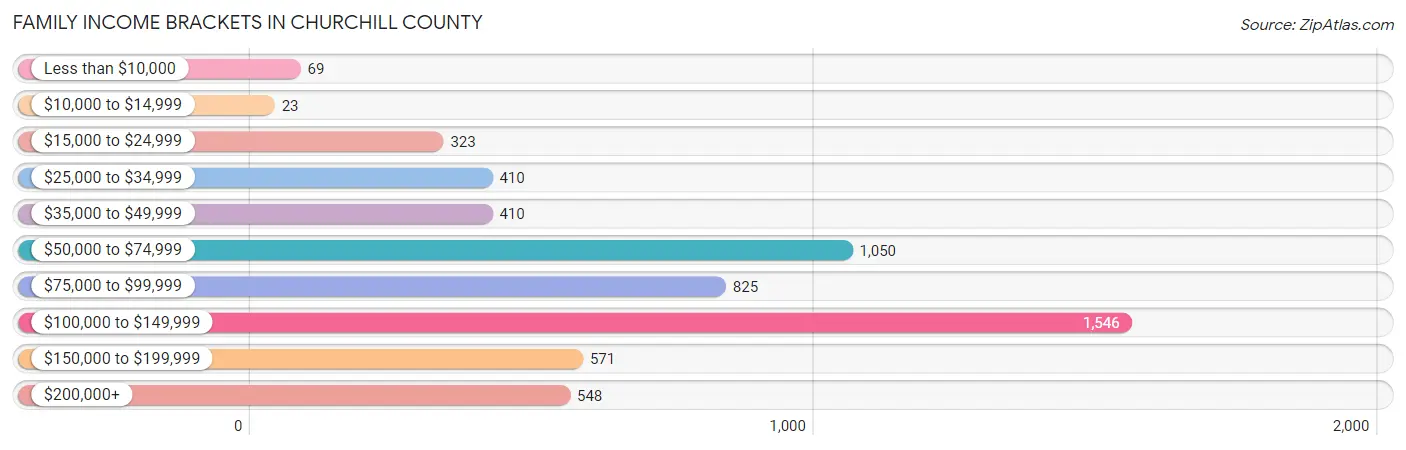
| Income Bracket | # Families | % Families |
| Less than $10,000 | 69 | 1.2% |
| $10,000 to $14,999 | 23 | 0.4% |
| $15,000 to $24,999 | 323 | 5.6% |
| $25,000 to $34,999 | 410 | 7.1% |
| $35,000 to $49,999 | 410 | 7.1% |
| $50,000 to $74,999 | 1,050 | 18.2% |
| $75,000 to $99,999 | 825 | 14.3% |
| $100,000 to $149,999 | 1,546 | 26.8% |
| $150,000 to $199,999 | 571 | 9.9% |
| $200,000+ | 548 | 9.5% |
Family Income by Famaliy Size in Churchill County
5-person families (382 | 6.6%) account for the highest median family income in Churchill County with $118,443 per family, while 2-person families (2,726 | 47.2%) have the highest median income of $38,811 per family member.
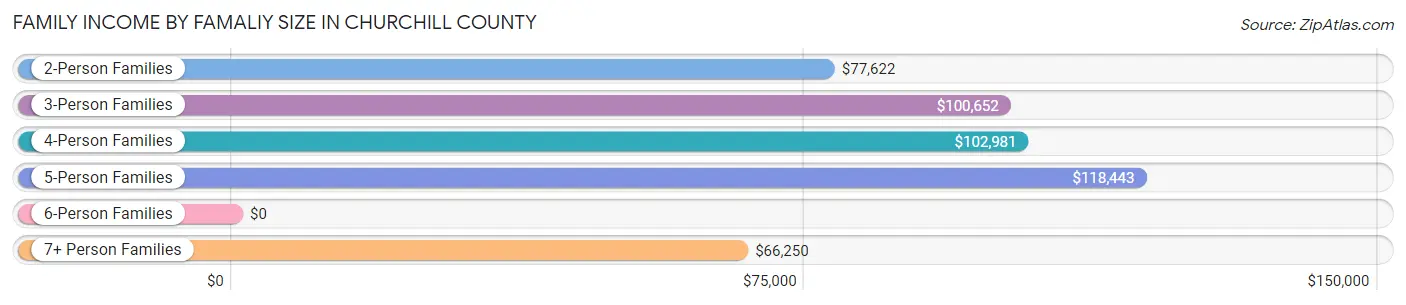
| Income Bracket | # Families | Median Income |
| 2-Person Families | 2,726 (47.2%) | $77,622 |
| 3-Person Families | 1,346 (23.3%) | $100,652 |
| 4-Person Families | 1,100 (19.1%) | $102,981 |
| 5-Person Families | 382 (6.6%) | $118,443 |
| 6-Person Families | 135 (2.3%) | $0 |
| 7+ Person Families | 81 (1.4%) | $66,250 |
| Total | 5,770 (100.0%) | $94,505 |
Family Income by Number of Earners in Churchill County
The median family income in Churchill County is $94,505, with families comprising 3+ earners (551) having the highest median family income of $144,063, while families with no earners (743) have the lowest median family income of $54,750, accounting for 9.6% and 12.9% of families, respectively.
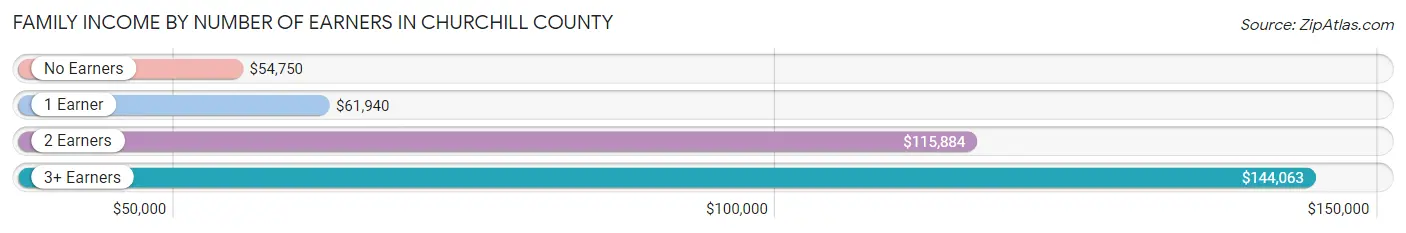
| Number of Earners | # Families | Median Income |
| No Earners | 743 (12.9%) | $54,750 |
| 1 Earner | 2,176 (37.7%) | $61,940 |
| 2 Earners | 2,300 (39.9%) | $115,884 |
| 3+ Earners | 551 (9.6%) | $144,063 |
| Total | 5,770 (100.0%) | $94,505 |
Household Income in Churchill County
Household Income Brackets in Churchill County
With 1,833 households falling in the category, the $100,000 to $149,999 income range is the most frequent in Churchill County, accounting for 19.1% of all households. In contrast, only 249 households (2.6%) fall into the $10,000 to $14,999 income bracket, making it the least populous group.
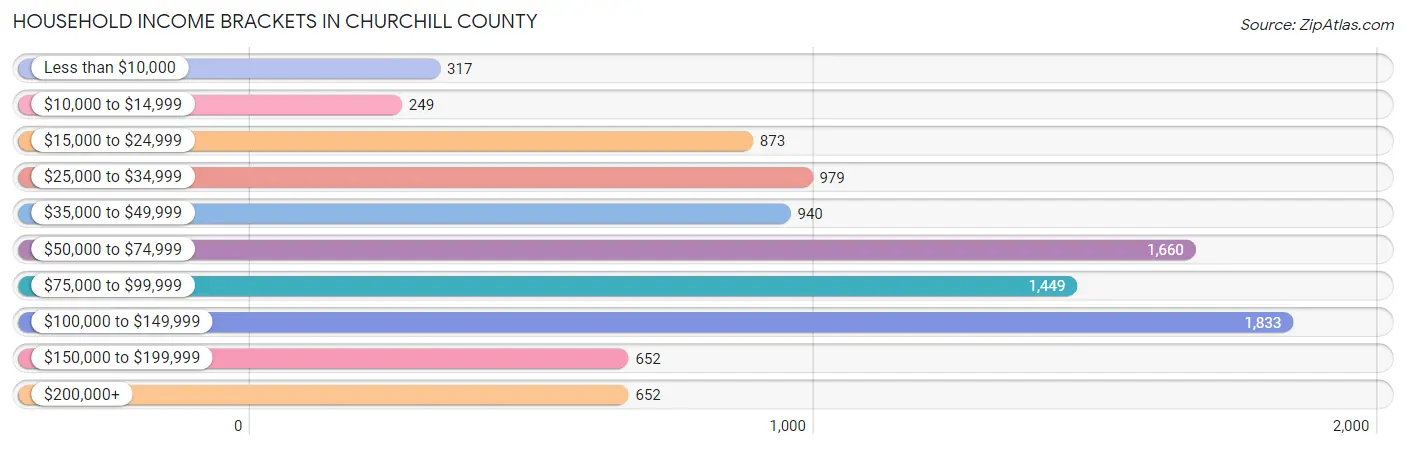
| Income Bracket | # Households | % Households |
| Less than $10,000 | 317 | 3.3% |
| $10,000 to $14,999 | 249 | 2.6% |
| $15,000 to $24,999 | 873 | 9.1% |
| $25,000 to $34,999 | 979 | 10.2% |
| $35,000 to $49,999 | 940 | 9.8% |
| $50,000 to $74,999 | 1,660 | 17.3% |
| $75,000 to $99,999 | 1,449 | 15.1% |
| $100,000 to $149,999 | 1,833 | 19.1% |
| $150,000 to $199,999 | 652 | 6.8% |
| $200,000+ | 652 | 6.8% |
Household Income by Householder Age in Churchill County
The median household income in Churchill County is $69,922, with the highest median household income of $90,833 found in the 45 to 64 years age bracket for the primary householder. A total of 3,274 households (34.1%) fall into this category. Meanwhile, the 65+ years age bracket for the primary householder has the lowest median household income of $47,962, with 3,175 households (33.1%) in this group.
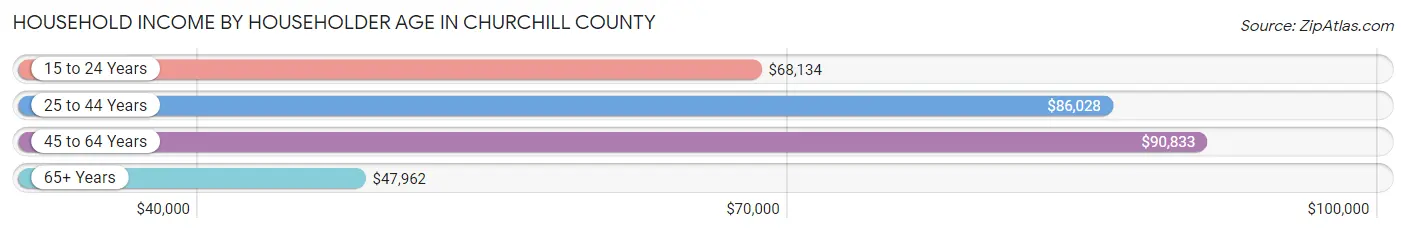
| Income Bracket | # Households | Median Income |
| 15 to 24 Years | 333 (3.5%) | $68,134 |
| 25 to 44 Years | 2,813 (29.3%) | $86,028 |
| 45 to 64 Years | 3,274 (34.1%) | $90,833 |
| 65+ Years | 3,175 (33.1%) | $47,962 |
| Total | 9,595 (100.0%) | $69,922 |
Poverty in Churchill County
Income Below Poverty by Sex and Age in Churchill County
With 9.2% poverty level for males and 10.7% for females among the residents of Churchill County, 55 to 64 year old males and 16 and 17 year old females are the most vulnerable to poverty, with 292 males (16.7%) and 58 females (25.7%) in their respective age groups living below the poverty level.
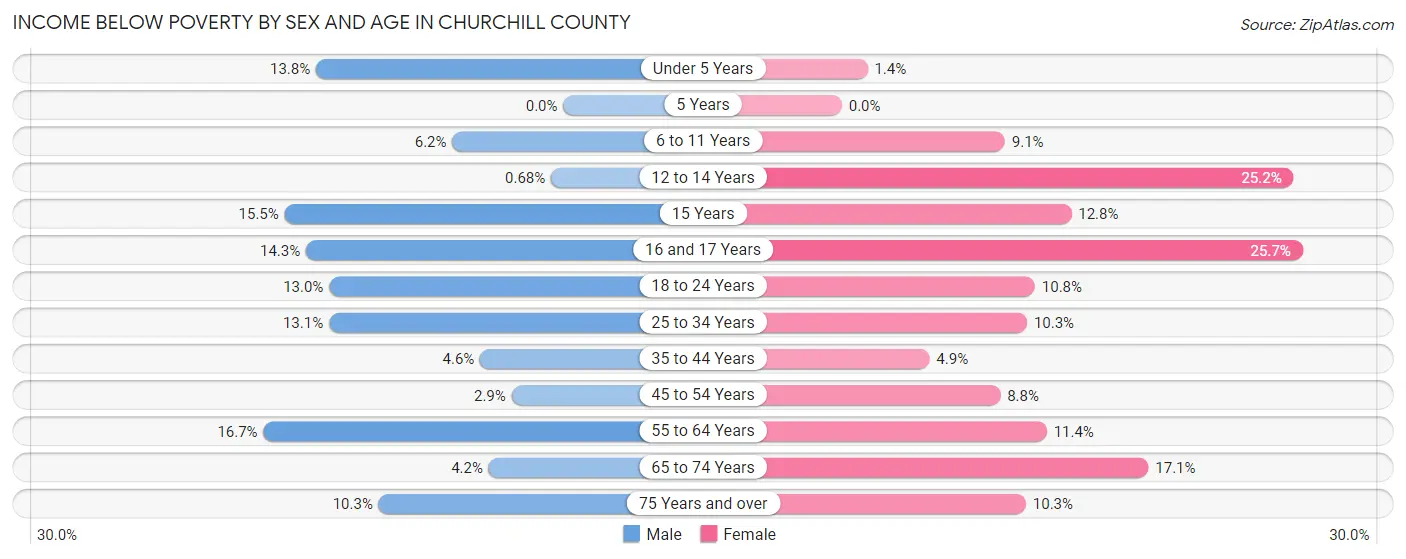
| Age Bracket | Male | Female |
| Under 5 Years | 129 (13.8%) | 9 (1.4%) |
| 5 Years | 0 (0.0%) | 0 (0.0%) |
| 6 to 11 Years | 64 (6.2%) | 101 (9.1%) |
| 12 to 14 Years | 3 (0.7%) | 83 (25.2%) |
| 15 Years | 9 (15.5%) | 34 (12.8%) |
| 16 and 17 Years | 46 (14.3%) | 58 (25.7%) |
| 18 to 24 Years | 139 (13.0%) | 106 (10.7%) |
| 25 to 34 Years | 227 (13.1%) | 153 (10.3%) |
| 35 to 44 Years | 67 (4.6%) | 67 (4.9%) |
| 45 to 54 Years | 44 (2.9%) | 123 (8.8%) |
| 55 to 64 Years | 292 (16.7%) | 193 (11.4%) |
| 65 to 74 Years | 59 (4.2%) | 263 (17.1%) |
| 75 Years and over | 92 (10.3%) | 103 (10.2%) |
| Total | 1,171 (9.2%) | 1,293 (10.7%) |
Income Above Poverty by Sex and Age in Churchill County
According to the poverty statistics in Churchill County, males aged 5 years and females aged 5 years are the age groups that are most secure financially, with 100.0% of males and 100.0% of females in these age groups living above the poverty line.
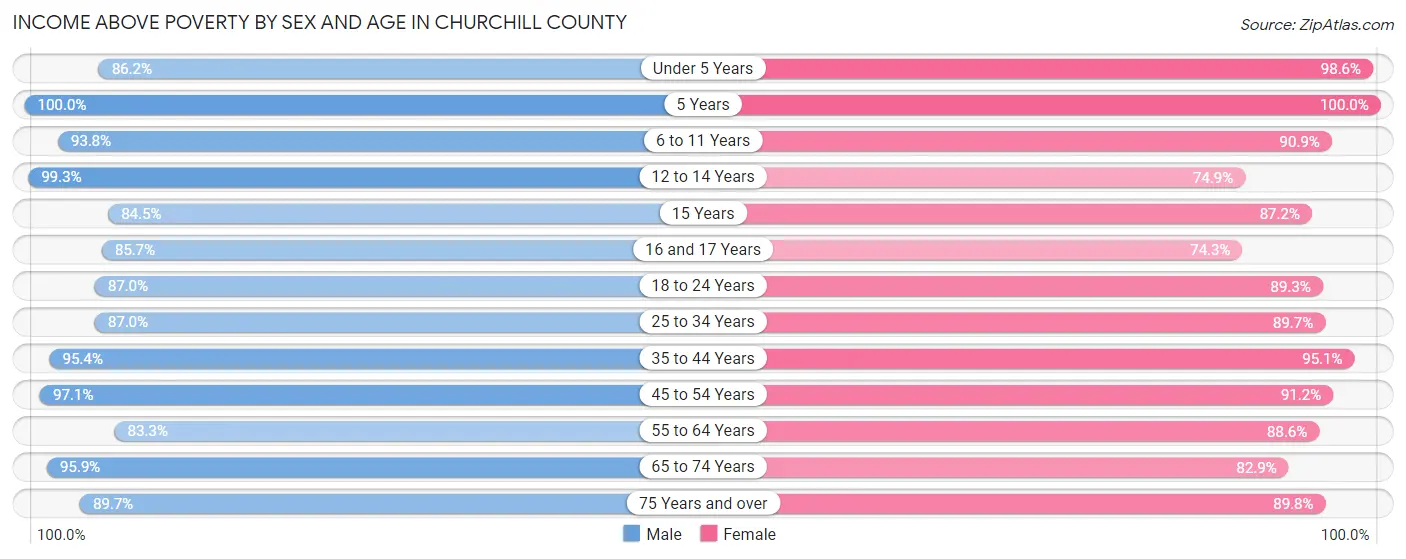
| Age Bracket | Male | Female |
| Under 5 Years | 808 (86.2%) | 622 (98.6%) |
| 5 Years | 69 (100.0%) | 49 (100.0%) |
| 6 to 11 Years | 972 (93.8%) | 1,011 (90.9%) |
| 12 to 14 Years | 441 (99.3%) | 247 (74.9%) |
| 15 Years | 49 (84.5%) | 232 (87.2%) |
| 16 and 17 Years | 275 (85.7%) | 168 (74.3%) |
| 18 to 24 Years | 927 (87.0%) | 880 (89.2%) |
| 25 to 34 Years | 1,512 (87.0%) | 1,331 (89.7%) |
| 35 to 44 Years | 1,380 (95.4%) | 1,307 (95.1%) |
| 45 to 54 Years | 1,483 (97.1%) | 1,271 (91.2%) |
| 55 to 64 Years | 1,456 (83.3%) | 1,499 (88.6%) |
| 65 to 74 Years | 1,364 (95.9%) | 1,278 (82.9%) |
| 75 Years and over | 803 (89.7%) | 902 (89.7%) |
| Total | 11,539 (90.8%) | 10,797 (89.3%) |
Income Below Poverty Among Married-Couple Families in Churchill County
The poverty statistics for married-couple families in Churchill County show that 3.2% or 137 of the total 4,307 families live below the poverty line. Families with 3 or 4 children have the highest poverty rate of 21.8%, comprising of 76 families. On the other hand, families with 5 or more children have the lowest poverty rate of 0.0%, which includes 0 families.
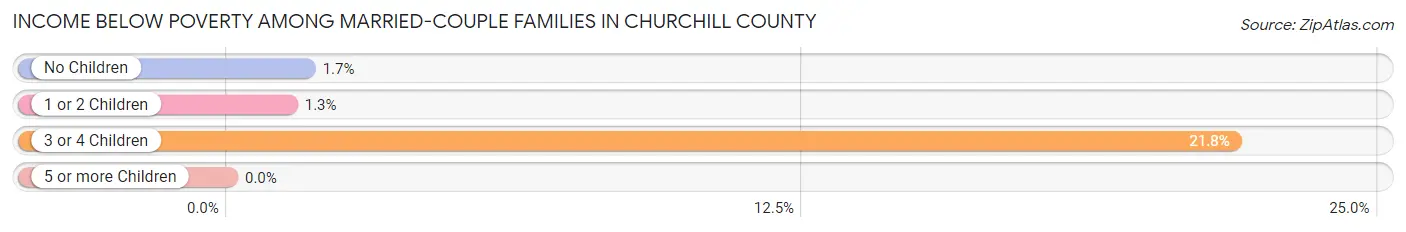
| Children | Above Poverty | Below Poverty |
| No Children | 2,562 (98.3%) | 44 (1.7%) |
| 1 or 2 Children | 1,293 (98.7%) | 17 (1.3%) |
| 3 or 4 Children | 272 (78.2%) | 76 (21.8%) |
| 5 or more Children | 43 (100.0%) | 0 (0.0%) |
| Total | 4,170 (96.8%) | 137 (3.2%) |
Income Below Poverty Among Single-Parent Households in Churchill County
According to the poverty data in Churchill County, 4.3% or 27 single-father households and 13.3% or 111 single-mother households are living below the poverty line. Among single-father households, those with no children have the highest poverty rate, with 15 households (4.9%) experiencing poverty. Likewise, among single-mother households, those with 1 or 2 children have the highest poverty rate, with 88 households (22.7%) falling below the poverty line.
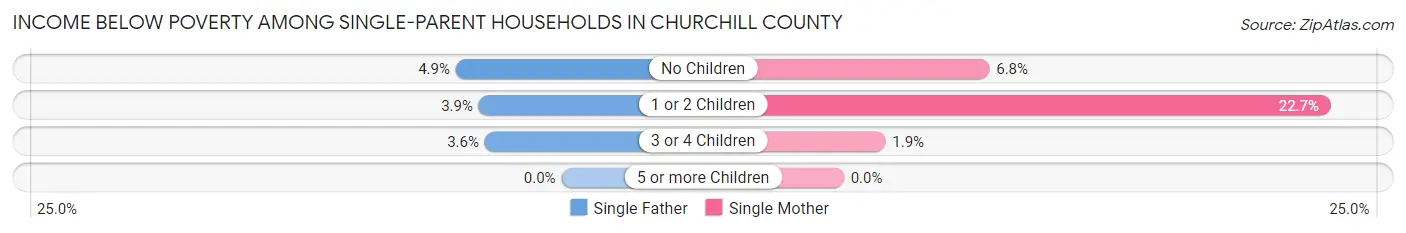
| Children | Single Father | Single Mother |
| No Children | 15 (4.9%) | 20 (6.8%) |
| 1 or 2 Children | 8 (3.8%) | 88 (22.7%) |
| 3 or 4 Children | 4 (3.6%) | 3 (1.9%) |
| 5 or more Children | 0 (0.0%) | 0 (0.0%) |
| Total | 27 (4.3%) | 111 (13.3%) |
Income Below Poverty Among Married-Couple vs Single-Parent Households in Churchill County
The poverty data for Churchill County shows that 137 of the married-couple family households (3.2%) and 138 of the single-parent households (9.4%) are living below the poverty level. Within the married-couple family households, those with 3 or 4 children have the highest poverty rate, with 76 households (21.8%) falling below the poverty line. Among the single-parent households, those with 1 or 2 children have the highest poverty rate, with 96 household (16.1%) living below poverty.
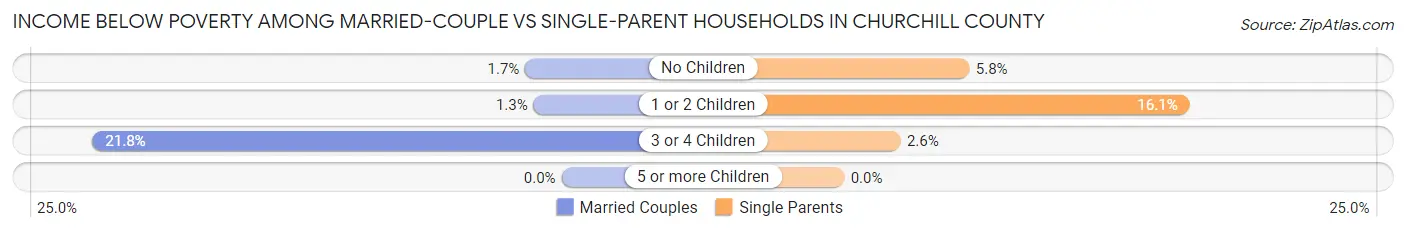
| Children | Married-Couple Families | Single-Parent Households |
| No Children | 44 (1.7%) | 35 (5.8%) |
| 1 or 2 Children | 17 (1.3%) | 96 (16.1%) |
| 3 or 4 Children | 76 (21.8%) | 7 (2.6%) |
| 5 or more Children | 0 (0.0%) | 0 (0.0%) |
| Total | 137 (3.2%) | 138 (9.4%) |
Race in Churchill County
The most populous races in Churchill County are White / Caucasian (19,628 | 77.2%), Hispanic or Latino (3,866 | 15.2%), and Two or more Races (2,231 | 8.8%).
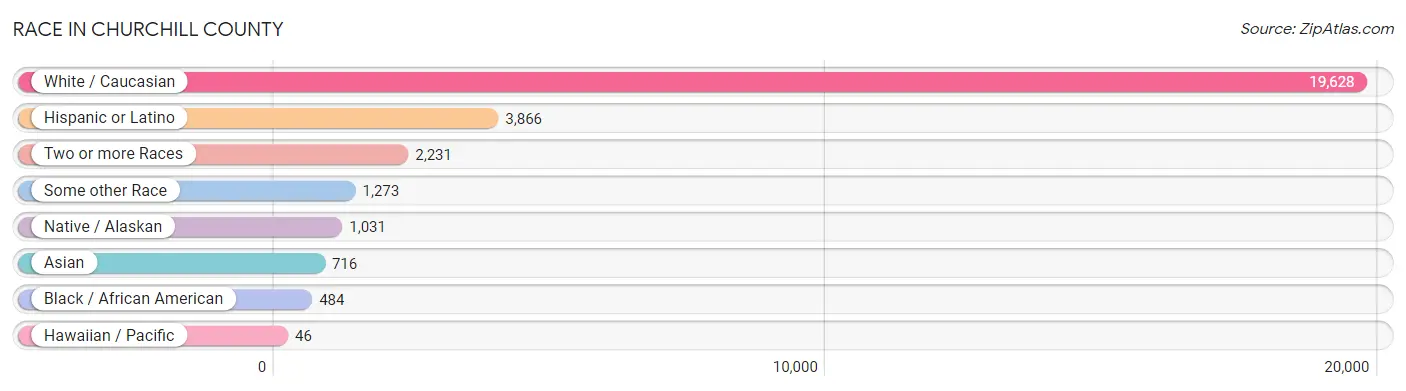
| Race | # Population | % Population |
| Asian | 716 | 2.8% |
| Black / African American | 484 | 1.9% |
| Hawaiian / Pacific | 46 | 0.2% |
| Hispanic or Latino | 3,866 | 15.2% |
| Native / Alaskan | 1,031 | 4.1% |
| White / Caucasian | 19,628 | 77.2% |
| Two or more Races | 2,231 | 8.8% |
| Some other Race | 1,273 | 5.0% |
| Total | 25,409 | 100.0% |
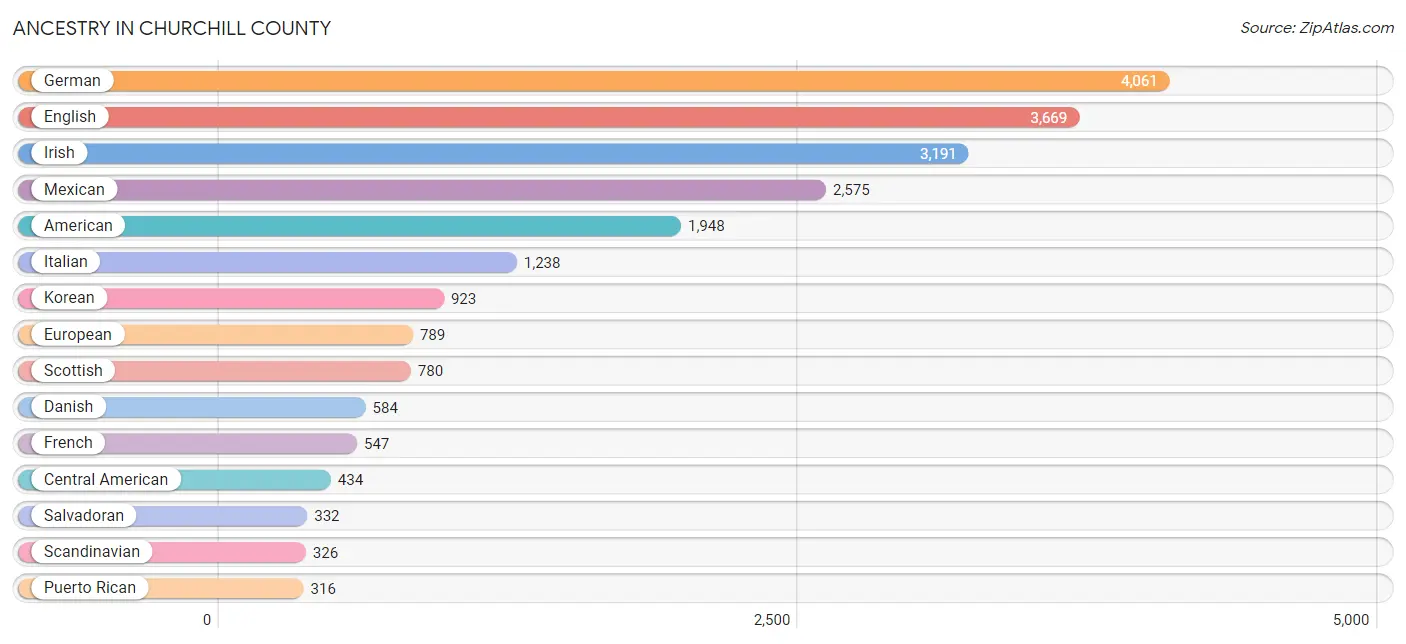
Ancestry in Churchill County
The most populous ancestries reported in Churchill County are German (4,061 | 16.0%), English (3,669 | 14.4%), Irish (3,191 | 12.6%), Mexican (2,575 | 10.1%), and American (1,948 | 7.7%), together accounting for 60.8% of all Churchill County residents.
| Ancestry | # Population | % Population |
| African | 64 | 0.3% |
| Albanian | 7 | 0.0% |
| American | 1,948 | 7.7% |
| Apache | 46 | 0.2% |
| Austrian | 10 | 0.0% |
| Basque | 121 | 0.5% |
| Bhutanese | 100 | 0.4% |
| Blackfeet | 4 | 0.0% |
| British | 95 | 0.4% |
| Bulgarian | 22 | 0.1% |
| Burmese | 3 | 0.0% |
| Canadian | 64 | 0.3% |
| Central American | 434 | 1.7% |
| Cherokee | 68 | 0.3% |
| Chippewa | 3 | 0.0% |
| Choctaw | 27 | 0.1% |
| Colombian | 160 | 0.6% |
| Croatian | 20 | 0.1% |
| Cuban | 11 | 0.0% |
| Czech | 79 | 0.3% |
| Danish | 584 | 2.3% |
| Dutch | 194 | 0.8% |
| Eastern European | 23 | 0.1% |
| English | 3,669 | 14.4% |
| European | 789 | 3.1% |
| Finnish | 194 | 0.8% |
| French | 547 | 2.1% |
| French American Indian | 10 | 0.0% |
| French Canadian | 90 | 0.4% |
| German | 4,061 | 16.0% |
| Greek | 112 | 0.4% |
| Guatemalan | 18 | 0.1% |
| Haitian | 6 | 0.0% |
| Honduran | 84 | 0.3% |
| Hopi | 2 | 0.0% |
| Hungarian | 68 | 0.3% |
| Indian (Asian) | 8 | 0.0% |
| Irish | 3,191 | 12.6% |
| Italian | 1,238 | 4.9% |
| Korean | 923 | 3.6% |
| Lithuanian | 10 | 0.0% |
| Mexican | 2,575 | 10.1% |
| Mexican American Indian | 25 | 0.1% |
| Native Hawaiian | 83 | 0.3% |
| Navajo | 11 | 0.0% |
| Nigerian | 6 | 0.0% |
| Northern European | 22 | 0.1% |
| Norwegian | 279 | 1.1% |
| Paiute | 186 | 0.7% |
| Pakistani | 15 | 0.1% |
| Pennsylvania German | 16 | 0.1% |
| Peruvian | 26 | 0.1% |
| Pima | 118 | 0.5% |
| Polish | 301 | 1.2% |
| Portuguese | 221 | 0.9% |
| Potawatomi | 1 | 0.0% |
| Pueblo | 2 | 0.0% |
| Puerto Rican | 316 | 1.2% |
| Romanian | 5 | 0.0% |
| Russian | 53 | 0.2% |
| Salvadoran | 332 | 1.3% |
| Scandinavian | 326 | 1.3% |
| Scotch-Irish | 176 | 0.7% |
| Scottish | 780 | 3.1% |
| Shoshone | 158 | 0.6% |
| Sioux | 23 | 0.1% |
| Slovak | 32 | 0.1% |
| South American | 191 | 0.7% |
| Spaniard | 23 | 0.1% |
| Spanish | 36 | 0.1% |
| Spanish American | 6 | 0.0% |
| Sri Lankan | 62 | 0.2% |
| Subsaharan African | 70 | 0.3% |
| Swedish | 306 | 1.2% |
| Swiss | 32 | 0.1% |
| Tongan | 9 | 0.0% |
| Ukrainian | 6 | 0.0% |
| Venezuelan | 5 | 0.0% |
| Welsh | 282 | 1.1% |
| West Indian | 43 | 0.2% |
| Yugoslavian | 15 | 0.1% | View All 81 Rows |
Immigrants in Churchill County
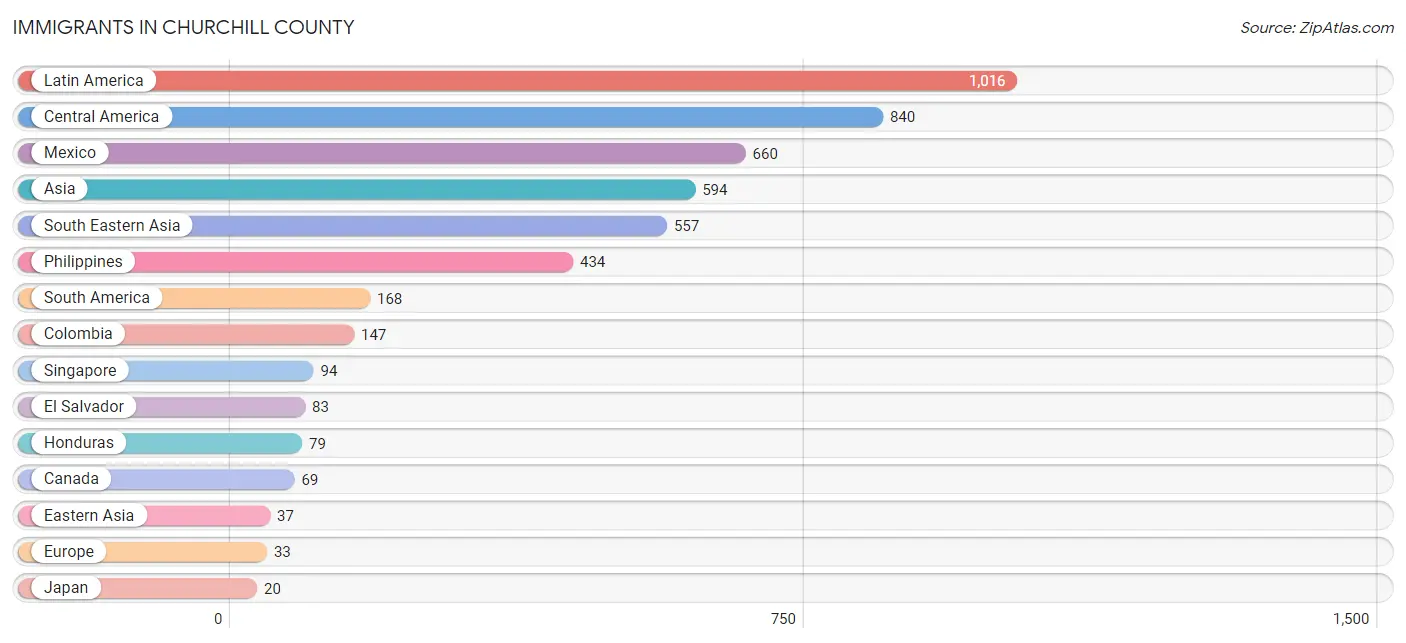
The most numerous immigrant groups reported in Churchill County came from Latin America (1,016 | 4.0%), Central America (840 | 3.3%), Mexico (660 | 2.6%), Asia (594 | 2.3%), and South Eastern Asia (557 | 2.2%), together accounting for 14.4% of all Churchill County residents.
| Immigration Origin | # Population | % Population |
| Asia | 594 | 2.3% |
| Brazil | 8 | 0.0% |
| Canada | 69 | 0.3% |
| Caribbean | 8 | 0.0% |
| Central America | 840 | 3.3% |
| Colombia | 147 | 0.6% |
| Cuba | 8 | 0.0% |
| Eastern Asia | 37 | 0.2% |
| El Salvador | 83 | 0.3% |
| England | 6 | 0.0% |
| Europe | 33 | 0.1% |
| Germany | 6 | 0.0% |
| Greece | 16 | 0.1% |
| Guatemala | 18 | 0.1% |
| Honduras | 79 | 0.3% |
| Indonesia | 3 | 0.0% |
| Japan | 20 | 0.1% |
| Korea | 17 | 0.1% |
| Latin America | 1,016 | 4.0% |
| Mexico | 660 | 2.6% |
| Northern Europe | 11 | 0.0% |
| Peru | 8 | 0.0% |
| Philippines | 434 | 1.7% |
| Singapore | 94 | 0.4% |
| South America | 168 | 0.7% |
| South Eastern Asia | 557 | 2.2% |
| Southern Europe | 16 | 0.1% |
| Thailand | 15 | 0.1% |
| Venezuela | 5 | 0.0% |
| Vietnam | 11 | 0.0% |
| Western Europe | 6 | 0.0% | View All 31 Rows |
Sex and Age in Churchill County
Sex and Age in Churchill County
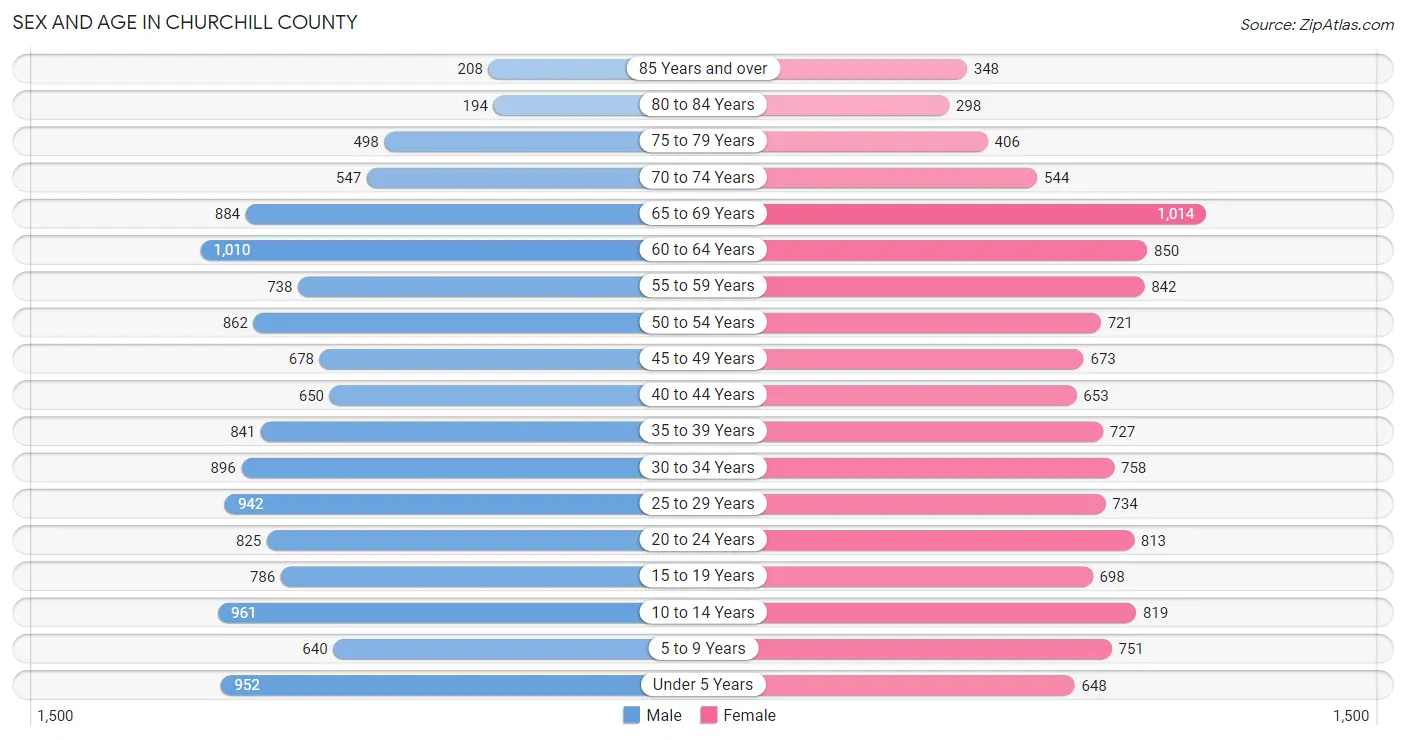
The most populous age groups in Churchill County are 60 to 64 Years (1,010 | 7.7%) for men and 65 to 69 Years (1,014 | 8.3%) for women.
| Age Bracket | Male | Female |
| Under 5 Years | 952 (7.3%) | 648 (5.3%) |
| 5 to 9 Years | 640 (4.9%) | 751 (6.1%) |
| 10 to 14 Years | 961 (7.3%) | 819 (6.7%) |
| 15 to 19 Years | 786 (6.0%) | 698 (5.7%) |
| 20 to 24 Years | 825 (6.3%) | 813 (6.6%) |
| 25 to 29 Years | 942 (7.2%) | 734 (6.0%) |
| 30 to 34 Years | 896 (6.8%) | 758 (6.2%) |
| 35 to 39 Years | 841 (6.4%) | 727 (5.9%) |
| 40 to 44 Years | 650 (5.0%) | 653 (5.3%) |
| 45 to 49 Years | 678 (5.2%) | 673 (5.5%) |
| 50 to 54 Years | 862 (6.6%) | 721 (5.9%) |
| 55 to 59 Years | 738 (5.6%) | 842 (6.9%) |
| 60 to 64 Years | 1,010 (7.7%) | 850 (6.9%) |
| 65 to 69 Years | 884 (6.7%) | 1,014 (8.3%) |
| 70 to 74 Years | 547 (4.2%) | 544 (4.4%) |
| 75 to 79 Years | 498 (3.8%) | 406 (3.3%) |
| 80 to 84 Years | 194 (1.5%) | 298 (2.4%) |
| 85 Years and over | 208 (1.6%) | 348 (2.8%) |
| Total | 13,112 (100.0%) | 12,297 (100.0%) |
Families and Households in Churchill County
Median Family Size in Churchill County
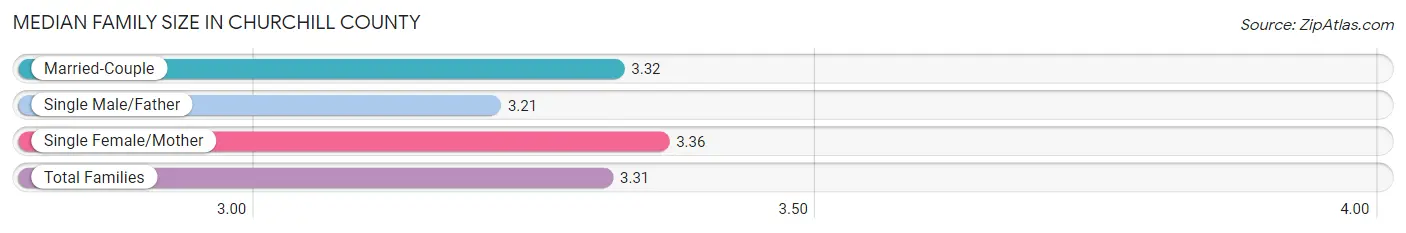
The median family size in Churchill County is 3.31 persons per family, with single female/mother families (838 | 14.5%) accounting for the largest median family size of 3.36 persons per family. On the other hand, single male/father families (625 | 10.8%) represent the smallest median family size with 3.21 persons per family.
| Family Type | # Families | Family Size |
| Married-Couple | 4,307 (74.6%) | 3.32 |
| Single Male/Father | 625 (10.8%) | 3.21 |
| Single Female/Mother | 838 (14.5%) | 3.36 |
| Total Families | 5,770 (100.0%) | 3.31 |
Median Household Size in Churchill County
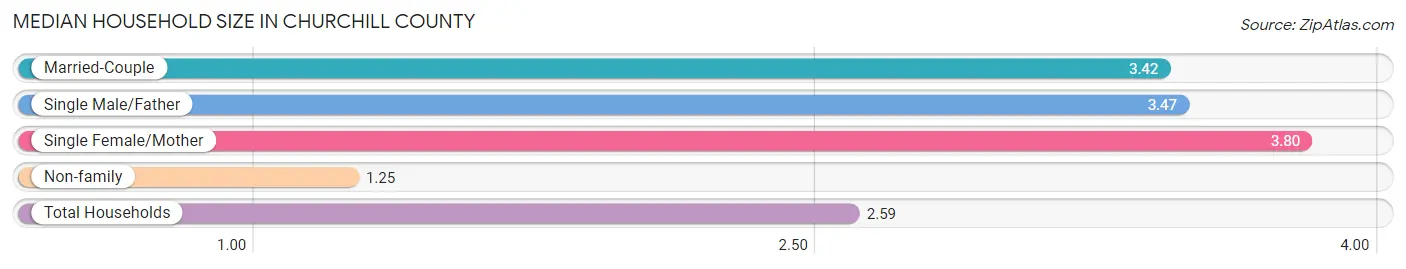
The median household size in Churchill County is 2.59 persons per household, with single female/mother households (838 | 8.7%) accounting for the largest median household size of 3.8 persons per household. non-family households (3,825 | 39.9%) represent the smallest median household size with 1.25 persons per household.
| Household Type | # Households | Household Size |
| Married-Couple | 4,307 (44.9%) | 3.42 |
| Single Male/Father | 625 (6.5%) | 3.47 |
| Single Female/Mother | 838 (8.7%) | 3.80 |
| Non-family | 3,825 (39.9%) | 1.25 |
| Total Households | 9,595 (100.0%) | 2.59 |
Household Size by Marriage Status in Churchill County
Out of a total of 9,595 households in Churchill County, 5,770 (60.1%) are family households, while 3,825 (39.9%) are nonfamily households. The most numerous type of family households are 2-person households, comprising 2,475, and the most common type of nonfamily households are 1-person households, comprising 3,031.
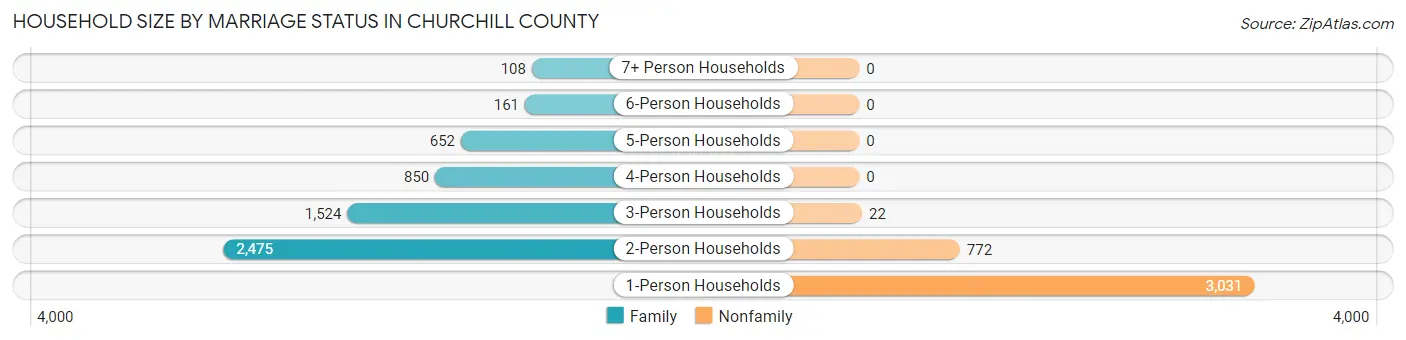
| Household Size | Family Households | Nonfamily Households |
| 1-Person Households | - | 3,031 (31.6%) |
| 2-Person Households | 2,475 (25.8%) | 772 (8.1%) |
| 3-Person Households | 1,524 (15.9%) | 22 (0.2%) |
| 4-Person Households | 850 (8.9%) | 0 (0.0%) |
| 5-Person Households | 652 (6.8%) | 0 (0.0%) |
| 6-Person Households | 161 (1.7%) | 0 (0.0%) |
| 7+ Person Households | 108 (1.1%) | 0 (0.0%) |
| Total | 5,770 (60.1%) | 3,825 (39.9%) |
Female Fertility in Churchill County
Fertility by Age in Churchill County
Average fertility rate in Churchill County is 38.0 births per 1,000 women. Women in the age bracket of 20 to 34 years have the highest fertility rate with 57.0 births per 1,000 women. Women in the age bracket of 20 to 34 years acount for 65.0% of all women with births.
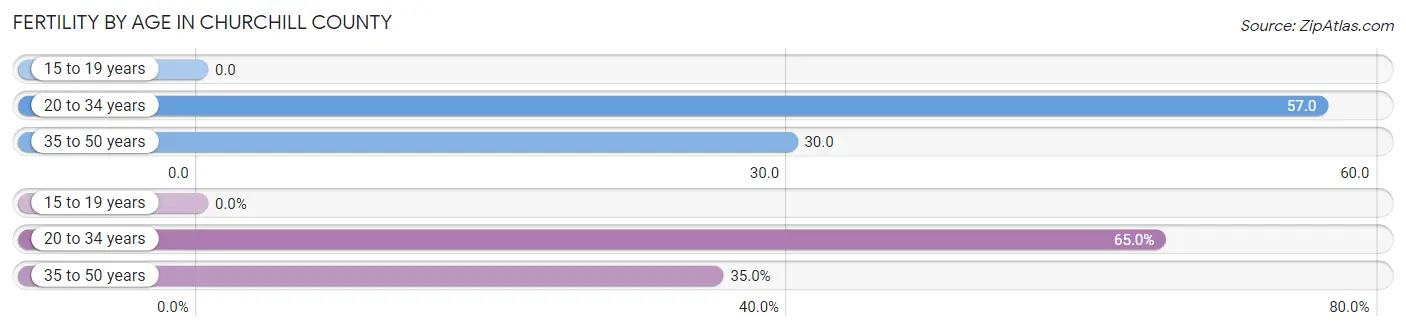
| Age Bracket | Women with Births | Births / 1,000 Women |
| 15 to 19 years | 0 (0.0%) | 0.0 |
| 20 to 34 years | 132 (65.0%) | 57.0 |
| 35 to 50 years | 71 (35.0%) | 30.0 |
| Total | 203 (100.0%) | 38.0 |
Fertility by Age by Marriage Status in Churchill County
23.2% of women with births (203) in Churchill County are married. The highest percentage of unmarried women with births falls into 35 to 50 years age bracket with 83.1% of them unmarried at the time of birth, while the lowest percentage of unmarried women with births belong to 20 to 34 years age bracket with 73.5% of them unmarried.
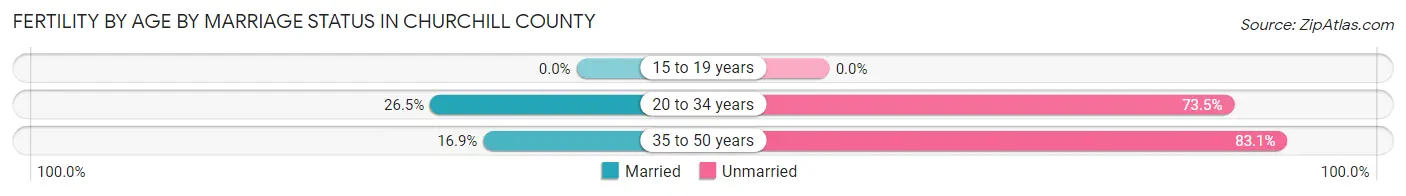
| Age Bracket | Married | Unmarried |
| 15 to 19 years | 0 (0.0%) | 0 (0.0%) |
| 20 to 34 years | 35 (26.5%) | 97 (73.5%) |
| 35 to 50 years | 12 (16.9%) | 59 (83.1%) |
| Total | 47 (23.2%) | 156 (76.8%) |
Fertility by Education in Churchill County
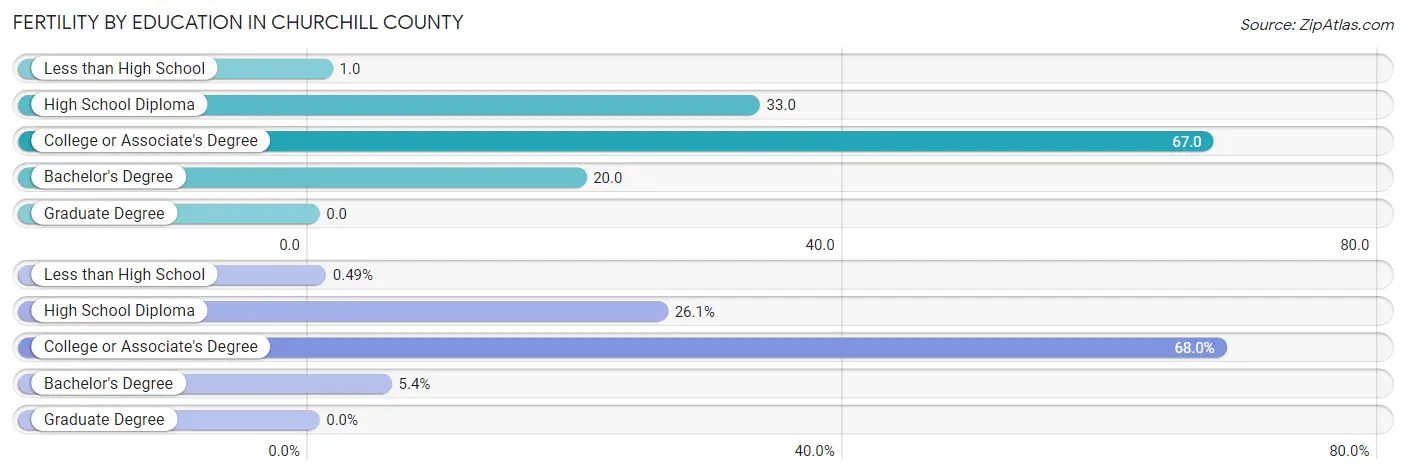
| Educational Attainment | Women with Births | Births / 1,000 Women |
| Less than High School | 1 (0.5%) | 1.0 |
| High School Diploma | 53 (26.1%) | 33.0 |
| College or Associate's Degree | 138 (68.0%) | 67.0 |
| Bachelor's Degree | 11 (5.4%) | 20.0 |
| Graduate Degree | 0 (0.0%) | 0.0 |
| Total | 203 (100.0%) | 38.0 |
Fertility by Education by Marriage Status in Churchill County
76.8% of women with births in Churchill County are unmarried. Women with the educational attainment of less than high school are most likely to be married with 100.0% of them married at childbirth, while women with the educational attainment of high school diploma are least likely to be married with 88.7% of them unmarried at childbirth.
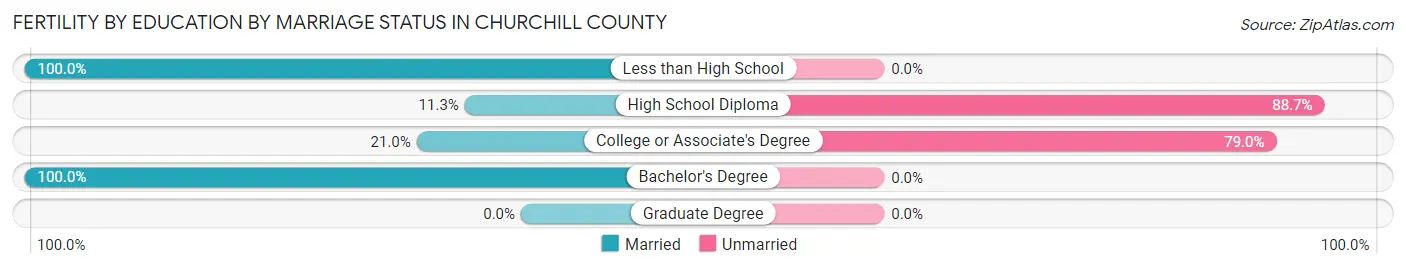
| Educational Attainment | Married | Unmarried |
| Less than High School | 1 (100.0%) | 0 (0.0%) |
| High School Diploma | 6 (11.3%) | 47 (88.7%) |
| College or Associate's Degree | 29 (21.0%) | 109 (79.0%) |
| Bachelor's Degree | 11 (100.0%) | 0 (0.0%) |
| Graduate Degree | 0 (0.0%) | 0 (0.0%) |
| Total | 47 (23.2%) | 156 (76.8%) |
Employment Characteristics in Churchill County
Employment by Class of Employer in Churchill County
Among the 11,611 employed individuals in Churchill County, private company employees (6,394 | 55.1%), federal government employees (2,477 | 21.3%), and local government employees (767 | 6.6%) make up the most common classes of employment.
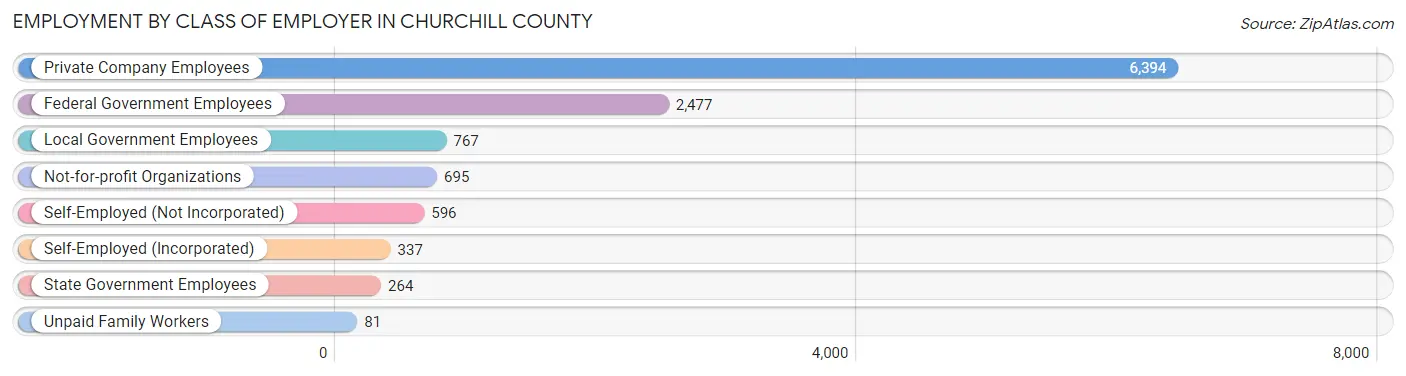
| Employer Class | # Employees | % Employees |
| Private Company Employees | 6,394 | 55.1% |
| Self-Employed (Incorporated) | 337 | 2.9% |
| Self-Employed (Not Incorporated) | 596 | 5.1% |
| Not-for-profit Organizations | 695 | 6.0% |
| Local Government Employees | 767 | 6.6% |
| State Government Employees | 264 | 2.3% |
| Federal Government Employees | 2,477 | 21.3% |
| Unpaid Family Workers | 81 | 0.7% |
| Total | 11,611 | 100.0% |
Employment Status by Age in Churchill County
According to the labor force statistics for Churchill County, out of the total population over 16 years of age (20,312), 62.5% or 12,695 individuals are in the labor force, with 6.3% or 800 of them unemployed. The age group with the highest labor force participation rate is 25 to 29 years, with 87.5% or 1,466 individuals in the labor force. Within the labor force, the 20 to 24 years age range has the highest percentage of unemployed individuals, with 16.5% or 209 of them being unemployed.
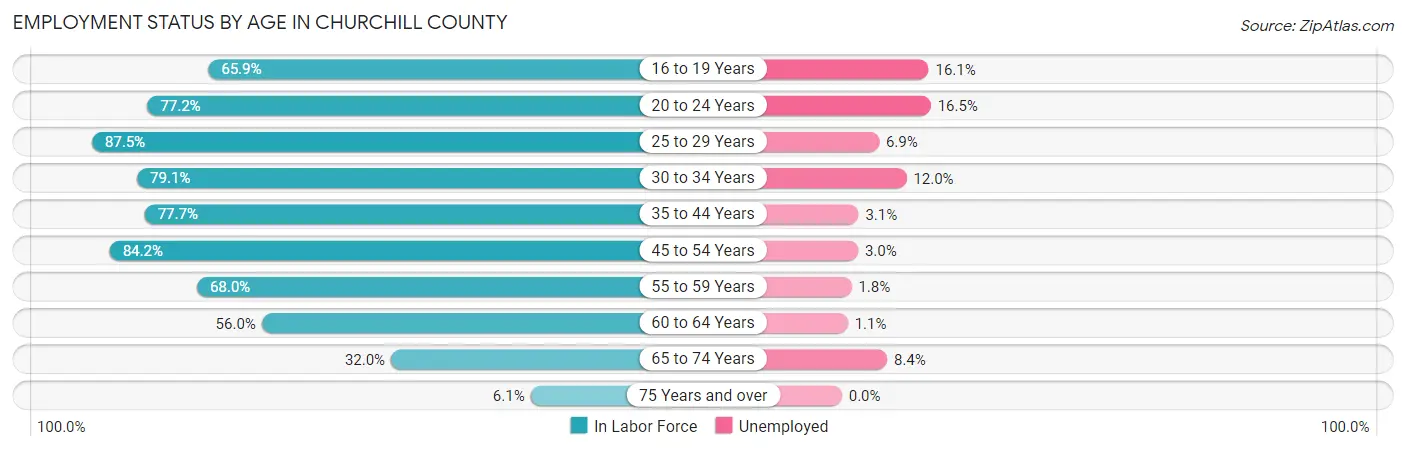
| Age Bracket | In Labor Force | Unemployed |
| 16 to 19 Years | 763 (65.9%) | 123 (16.1%) |
| 20 to 24 Years | 1,265 (77.2%) | 209 (16.5%) |
| 25 to 29 Years | 1,466 (87.5%) | 101 (6.9%) |
| 30 to 34 Years | 1,308 (79.1%) | 157 (12.0%) |
| 35 to 44 Years | 2,231 (77.7%) | 69 (3.1%) |
| 45 to 54 Years | 2,470 (84.2%) | 74 (3.0%) |
| 55 to 59 Years | 1,074 (68.0%) | 19 (1.8%) |
| 60 to 64 Years | 1,042 (56.0%) | 11 (1.1%) |
| 65 to 74 Years | 956 (32.0%) | 80 (8.4%) |
| 75 Years and over | 119 (6.1%) | 0 (0.0%) |
| Total | 12,695 (62.5%) | 800 (6.3%) |
Employment Status by Educational Attainment in Churchill County
According to labor force statistics for Churchill County, 76.3% of individuals (9,595) out of the total population between 25 and 64 years of age (12,575) are in the labor force, with 4.3% or 413 of them being unemployed. The group with the highest labor force participation rate are those with the educational attainment of bachelor's degree or higher, with 86.4% or 1,752 individuals in the labor force. Within the labor force, individuals with college / associate degree education have the highest percentage of unemployment, with 5.7% or 230 of them being unemployed.
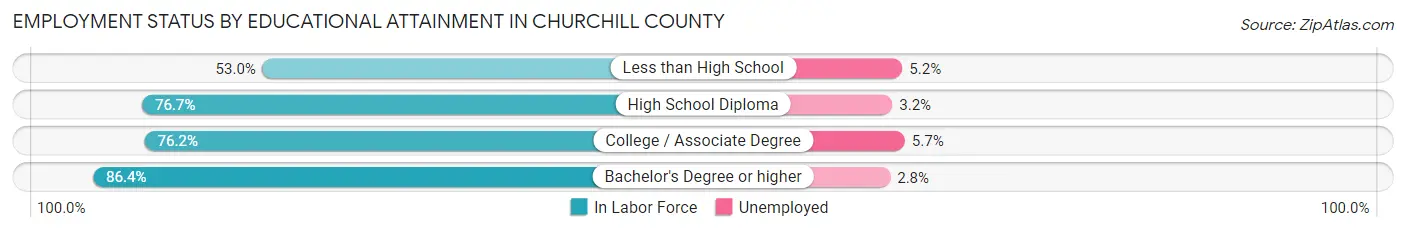
| Educational Attainment | In Labor Force | Unemployed |
| Less than High School | 499 (53.0%) | 49 (5.2%) |
| High School Diploma | 3,299 (76.7%) | 138 (3.2%) |
| College / Associate Degree | 4,042 (76.2%) | 302 (5.7%) |
| Bachelor's Degree or higher | 1,752 (86.4%) | 57 (2.8%) |
| Total | 9,595 (76.3%) | 541 (4.3%) |
Employment Occupations by Sex in Churchill County
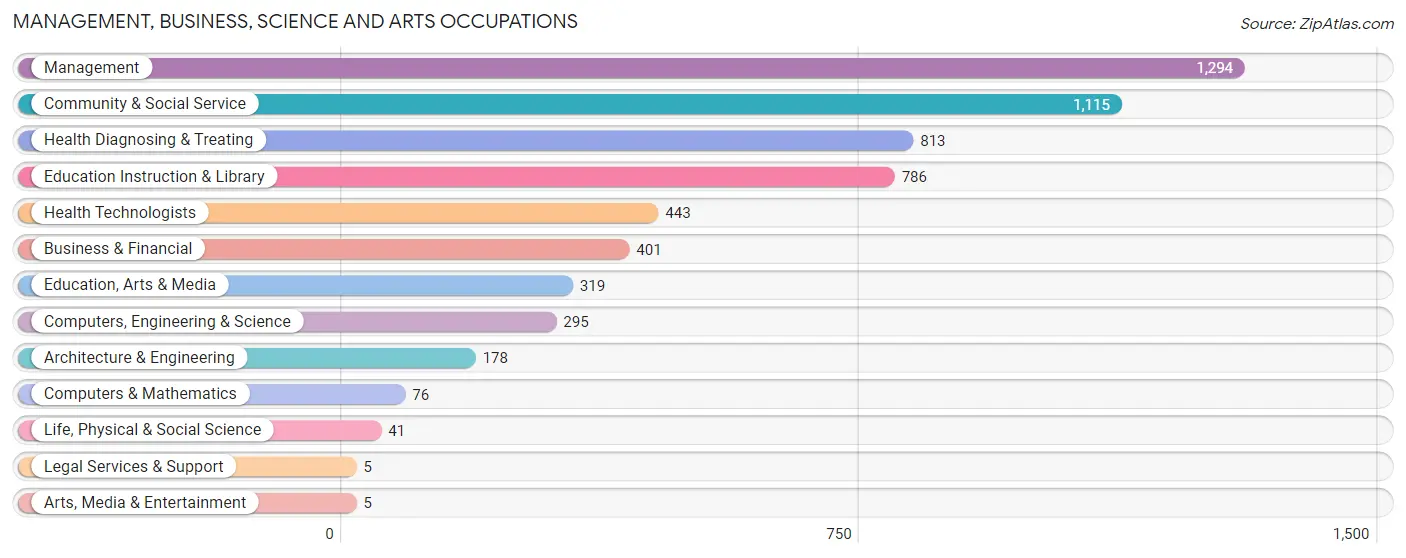
Management, Business, Science and Arts Occupations
The most common Management, Business, Science and Arts occupations in Churchill County are Management (1,294 | 12.0%), Community & Social Service (1,115 | 10.3%), Health Diagnosing & Treating (813 | 7.5%), Education Instruction & Library (786 | 7.3%), and Health Technologists (443 | 4.1%).
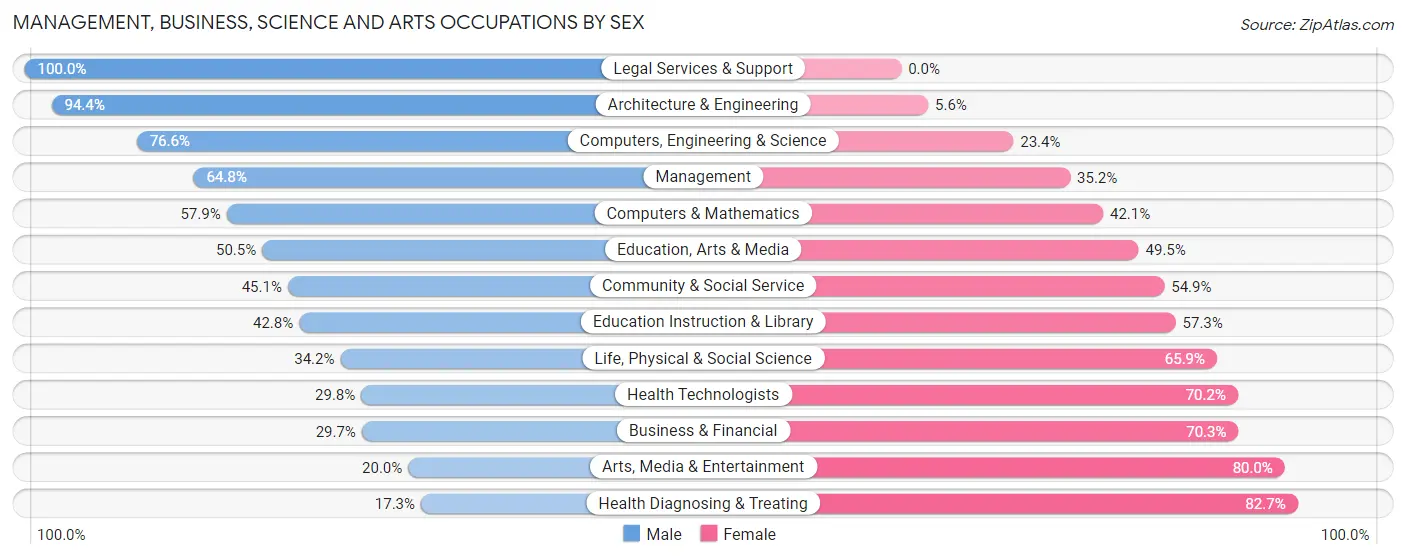
Management, Business, Science and Arts Occupations by Sex
Within the Management, Business, Science and Arts occupations in Churchill County, the most male-oriented occupations are Legal Services & Support (100.0%), Architecture & Engineering (94.4%), and Computers, Engineering & Science (76.6%), while the most female-oriented occupations are Health Diagnosing & Treating (82.7%), Arts, Media & Entertainment (80.0%), and Business & Financial (70.3%).
| Occupation | Male | Female |
| Management | 838 (64.8%) | 456 (35.2%) |
| Business & Financial | 119 (29.7%) | 282 (70.3%) |
| Computers, Engineering & Science | 226 (76.6%) | 69 (23.4%) |
| Computers & Mathematics | 44 (57.9%) | 32 (42.1%) |
| Architecture & Engineering | 168 (94.4%) | 10 (5.6%) |
| Life, Physical & Social Science | 14 (34.2%) | 27 (65.8%) |
| Community & Social Service | 503 (45.1%) | 612 (54.9%) |
| Education, Arts & Media | 161 (50.5%) | 158 (49.5%) |
| Legal Services & Support | 5 (100.0%) | 0 (0.0%) |
| Education Instruction & Library | 336 (42.7%) | 450 (57.3%) |
| Arts, Media & Entertainment | 1 (20.0%) | 4 (80.0%) |
| Health Diagnosing & Treating | 141 (17.3%) | 672 (82.7%) |
| Health Technologists | 132 (29.8%) | 311 (70.2%) |
| Total (Category) | 1,827 (46.6%) | 2,091 (53.4%) |
| Total (Overall) | 5,946 (55.1%) | 4,848 (44.9%) |
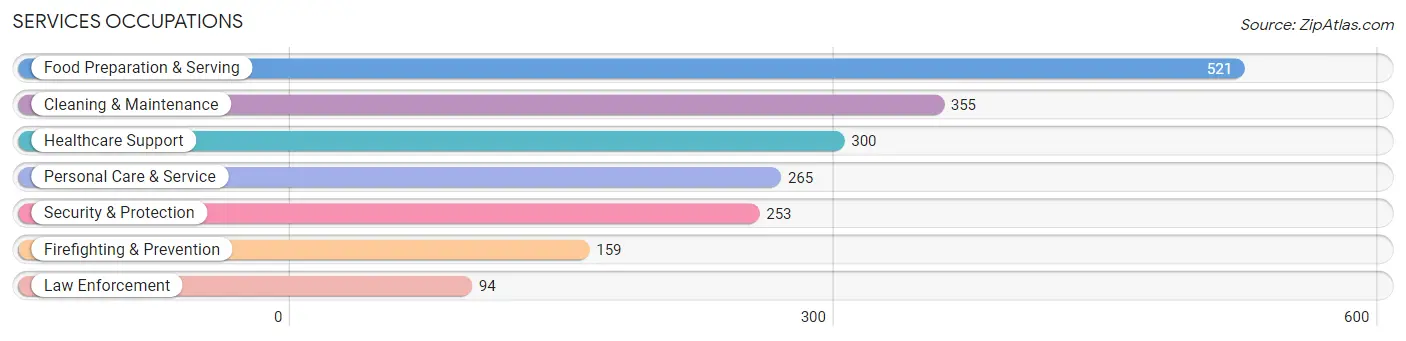
Services Occupations
The most common Services occupations in Churchill County are Food Preparation & Serving (521 | 4.8%), Cleaning & Maintenance (355 | 3.3%), Healthcare Support (300 | 2.8%), Personal Care & Service (265 | 2.5%), and Security & Protection (253 | 2.3%).
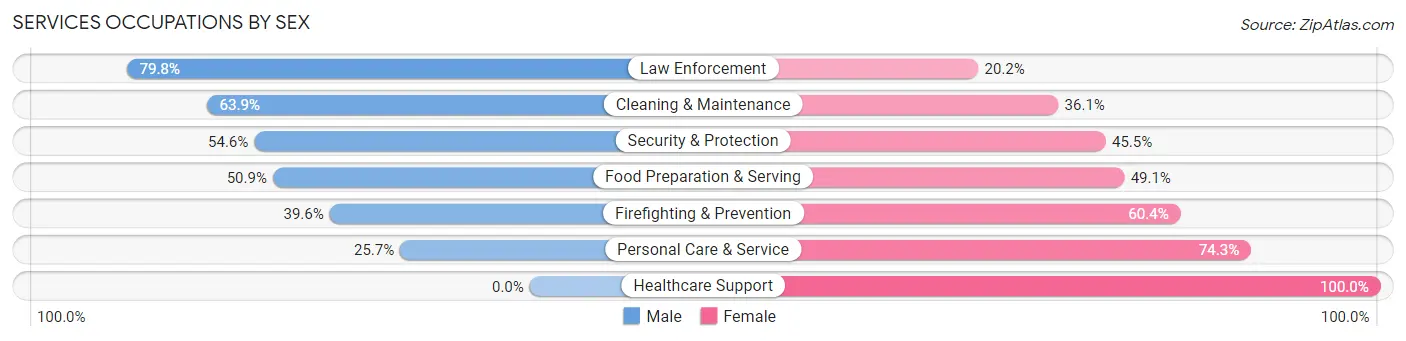
Services Occupations by Sex
Within the Services occupations in Churchill County, the most male-oriented occupations are Law Enforcement (79.8%), Cleaning & Maintenance (63.9%), and Security & Protection (54.5%), while the most female-oriented occupations are Healthcare Support (100.0%), Personal Care & Service (74.3%), and Firefighting & Prevention (60.4%).
| Occupation | Male | Female |
| Healthcare Support | 0 (0.0%) | 300 (100.0%) |
| Security & Protection | 138 (54.5%) | 115 (45.5%) |
| Firefighting & Prevention | 63 (39.6%) | 96 (60.4%) |
| Law Enforcement | 75 (79.8%) | 19 (20.2%) |
| Food Preparation & Serving | 265 (50.9%) | 256 (49.1%) |
| Cleaning & Maintenance | 227 (63.9%) | 128 (36.1%) |
| Personal Care & Service | 68 (25.7%) | 197 (74.3%) |
| Total (Category) | 698 (41.2%) | 996 (58.8%) |
| Total (Overall) | 5,946 (55.1%) | 4,848 (44.9%) |
Sales and Office Occupations
The most common Sales and Office occupations in Churchill County are Office & Administration (1,184 | 11.0%), and Sales & Related (566 | 5.2%).

Sales and Office Occupations by Sex
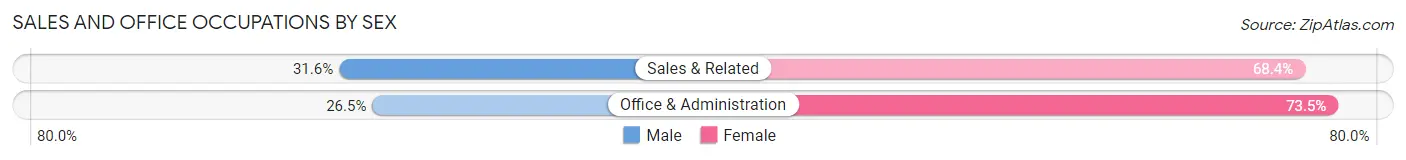
| Occupation | Male | Female |
| Sales & Related | 179 (31.6%) | 387 (68.4%) |
| Office & Administration | 314 (26.5%) | 870 (73.5%) |
| Total (Category) | 493 (28.2%) | 1,257 (71.8%) |
| Total (Overall) | 5,946 (55.1%) | 4,848 (44.9%) |
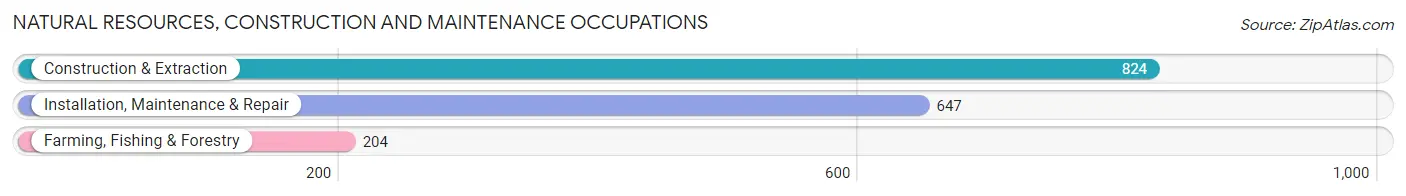
Natural Resources, Construction and Maintenance Occupations
The most common Natural Resources, Construction and Maintenance occupations in Churchill County are Construction & Extraction (824 | 7.6%), Installation, Maintenance & Repair (647 | 6.0%), and Farming, Fishing & Forestry (204 | 1.9%).
Natural Resources, Construction and Maintenance Occupations by Sex
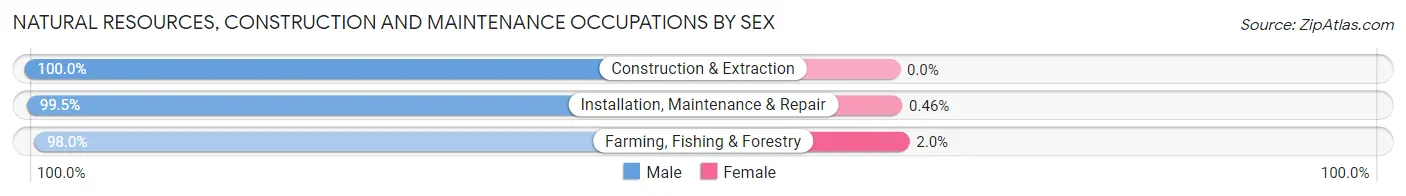
| Occupation | Male | Female |
| Farming, Fishing & Forestry | 200 (98.0%) | 4 (2.0%) |
| Construction & Extraction | 824 (100.0%) | 0 (0.0%) |
| Installation, Maintenance & Repair | 644 (99.5%) | 3 (0.5%) |
| Total (Category) | 1,668 (99.6%) | 7 (0.4%) |
| Total (Overall) | 5,946 (55.1%) | 4,848 (44.9%) |
Production, Transportation and Moving Occupations
The most common Production, Transportation and Moving occupations in Churchill County are Production (842 | 7.8%), Transportation (583 | 5.4%), and Material Moving (332 | 3.1%).
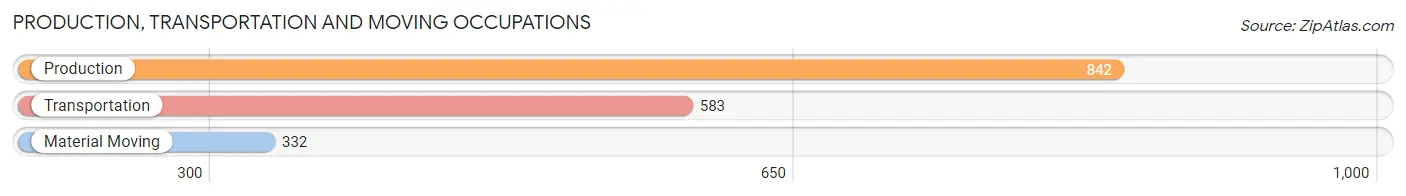
Production, Transportation and Moving Occupations by Sex
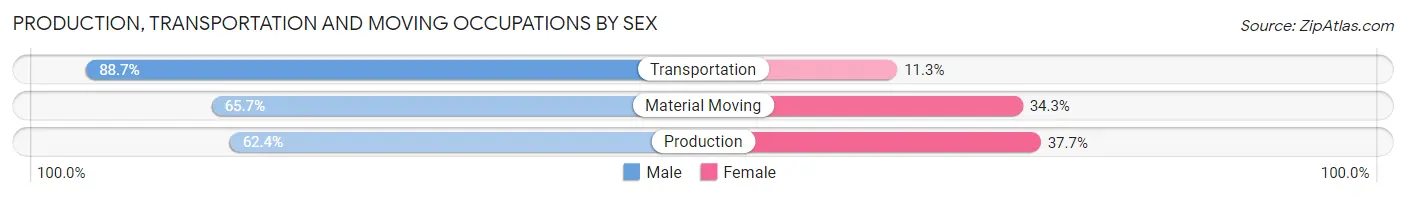
| Occupation | Male | Female |
| Production | 525 (62.4%) | 317 (37.7%) |
| Transportation | 517 (88.7%) | 66 (11.3%) |
| Material Moving | 218 (65.7%) | 114 (34.3%) |
| Total (Category) | 1,260 (71.7%) | 497 (28.3%) |
| Total (Overall) | 5,946 (55.1%) | 4,848 (44.9%) |
Employment Industries by Sex in Churchill County
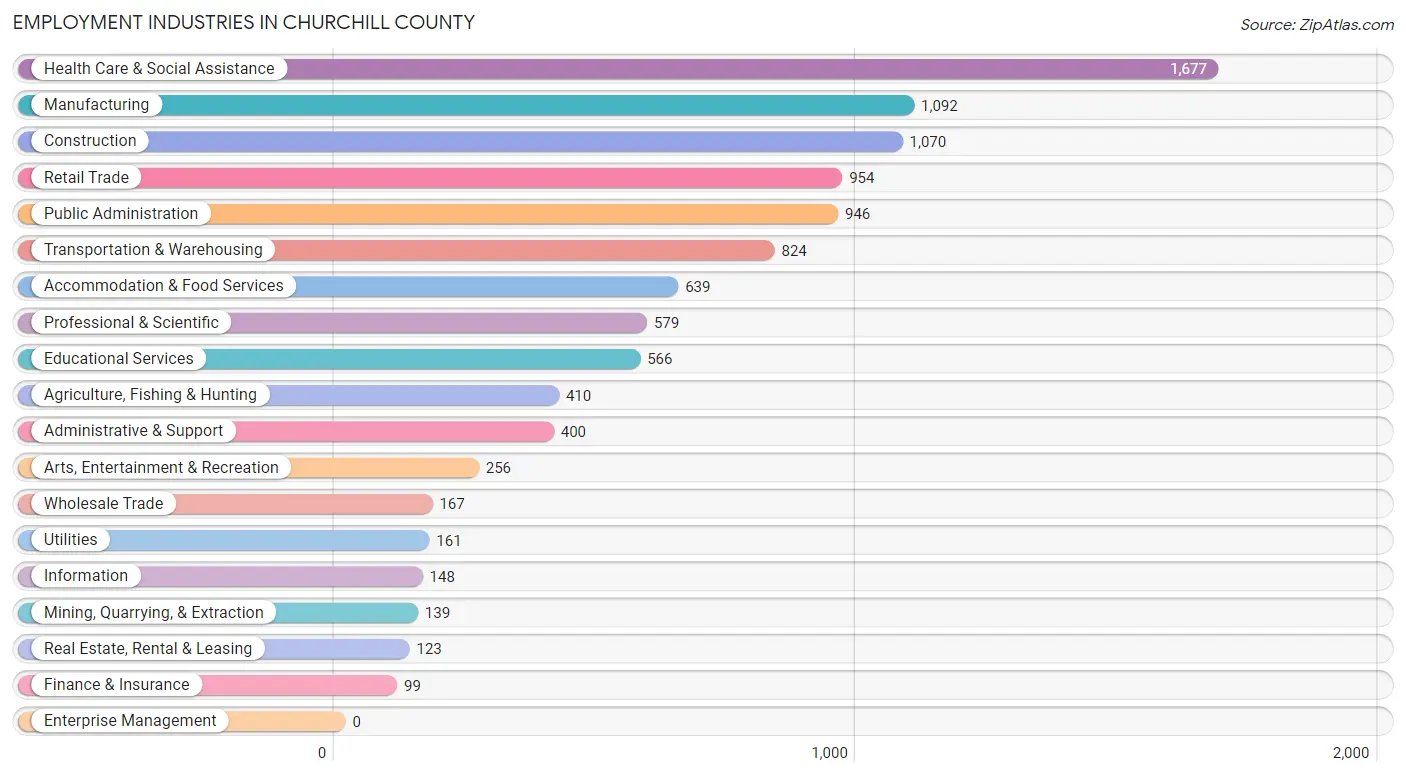
Employment Industries in Churchill County
The major employment industries in Churchill County include Health Care & Social Assistance (1,677 | 15.5%), Manufacturing (1,092 | 10.1%), Construction (1,070 | 9.9%), Retail Trade (954 | 8.8%), and Public Administration (946 | 8.8%).
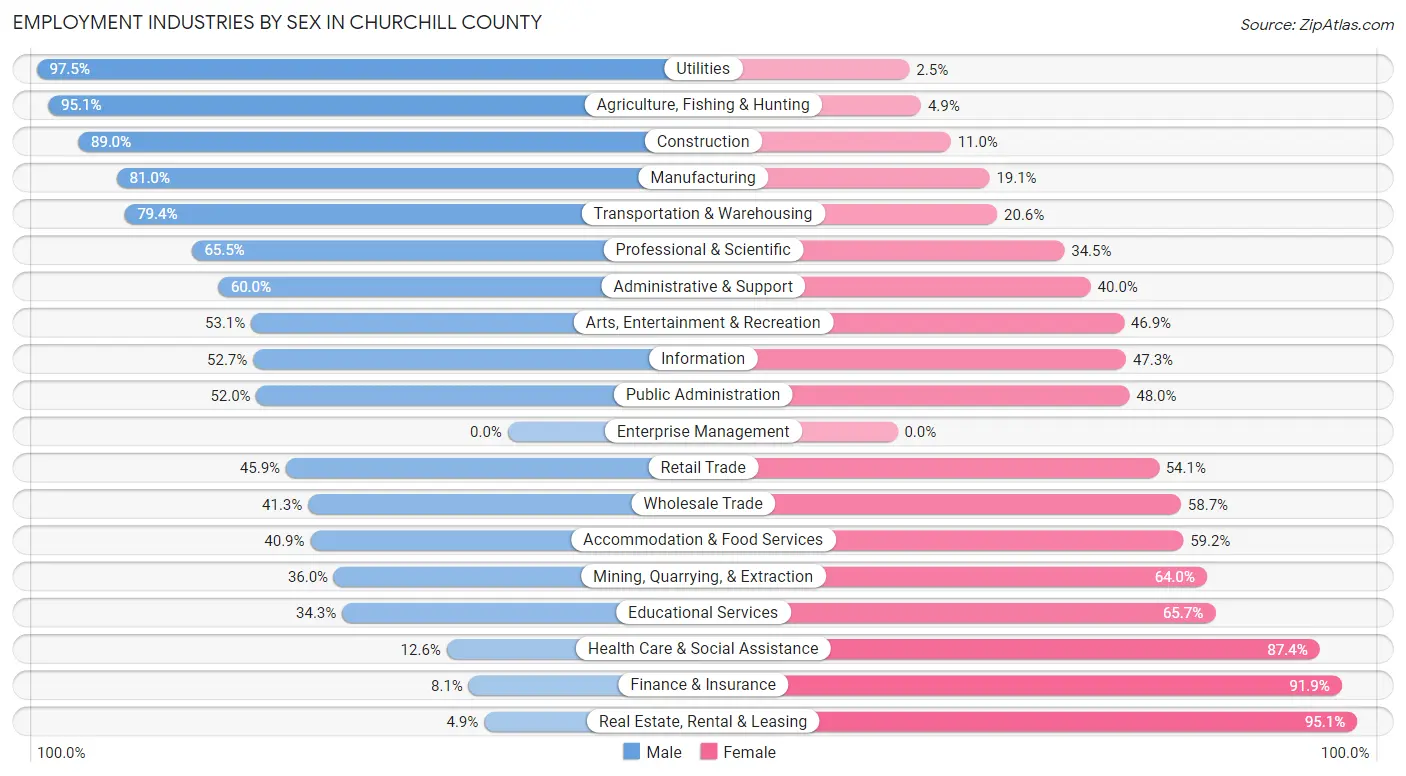
Employment Industries by Sex in Churchill County
The Churchill County industries that see more men than women are Utilities (97.5%), Agriculture, Fishing & Hunting (95.1%), and Construction (89.0%), whereas the industries that tend to have a higher number of women are Real Estate, Rental & Leasing (95.1%), Finance & Insurance (91.9%), and Health Care & Social Assistance (87.4%).
| Industry | Male | Female |
| Agriculture, Fishing & Hunting | 390 (95.1%) | 20 (4.9%) |
| Mining, Quarrying, & Extraction | 50 (36.0%) | 89 (64.0%) |
| Construction | 952 (89.0%) | 118 (11.0%) |
| Manufacturing | 884 (80.9%) | 208 (19.1%) |
| Wholesale Trade | 69 (41.3%) | 98 (58.7%) |
| Retail Trade | 438 (45.9%) | 516 (54.1%) |
| Transportation & Warehousing | 654 (79.4%) | 170 (20.6%) |
| Utilities | 157 (97.5%) | 4 (2.5%) |
| Information | 78 (52.7%) | 70 (47.3%) |
| Finance & Insurance | 8 (8.1%) | 91 (91.9%) |
| Real Estate, Rental & Leasing | 6 (4.9%) | 117 (95.1%) |
| Professional & Scientific | 379 (65.5%) | 200 (34.5%) |
| Enterprise Management | 0 (0.0%) | 0 (0.0%) |
| Administrative & Support | 240 (60.0%) | 160 (40.0%) |
| Educational Services | 194 (34.3%) | 372 (65.7%) |
| Health Care & Social Assistance | 212 (12.6%) | 1,465 (87.4%) |
| Arts, Entertainment & Recreation | 136 (53.1%) | 120 (46.9%) |
| Accommodation & Food Services | 261 (40.8%) | 378 (59.2%) |
| Public Administration | 492 (52.0%) | 454 (48.0%) |
| Total | 5,946 (55.1%) | 4,848 (44.9%) |
Education in Churchill County
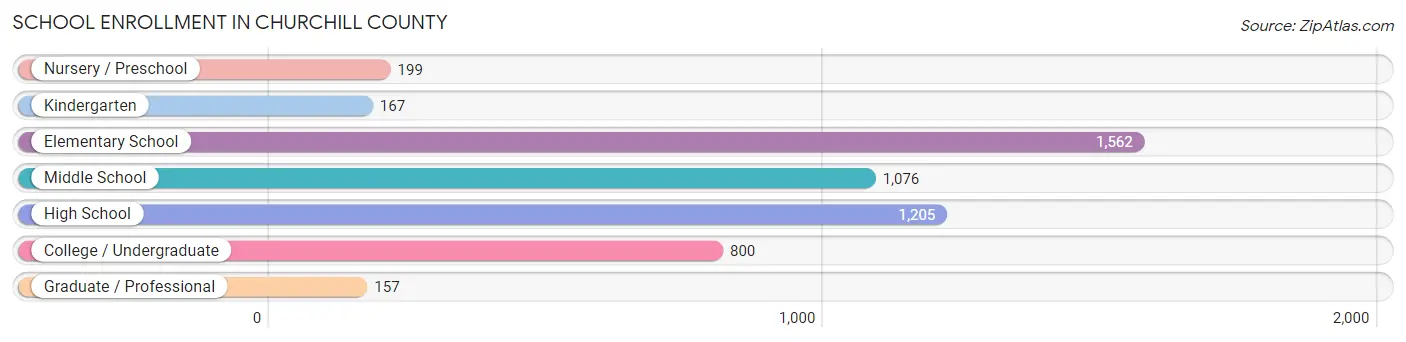
School Enrollment in Churchill County
The most common levels of schooling among the 5,166 students in Churchill County are elementary school (1,562 | 30.2%), high school (1,205 | 23.3%), and middle school (1,076 | 20.8%).
| School Level | # Students | % Students |
| Nursery / Preschool | 199 | 3.8% |
| Kindergarten | 167 | 3.2% |
| Elementary School | 1,562 | 30.2% |
| Middle School | 1,076 | 20.8% |
| High School | 1,205 | 23.3% |
| College / Undergraduate | 800 | 15.5% |
| Graduate / Professional | 157 | 3.0% |
| Total | 5,166 | 100.0% |
School Enrollment by Age by Funding Source in Churchill County
Out of a total of 5,166 students who are enrolled in schools in Churchill County, 692 (13.4%) attend a private institution, while the remaining 4,474 (86.6%) are enrolled in public schools. The age group of 20 to 24 year olds has the highest likelihood of being enrolled in private schools, with 192 (54.5% in the age bracket) enrolled. Conversely, the age group of 15 to 17 year olds has the lowest likelihood of being enrolled in a private school, with 787 (97.5% in the age bracket) attending a public institution.
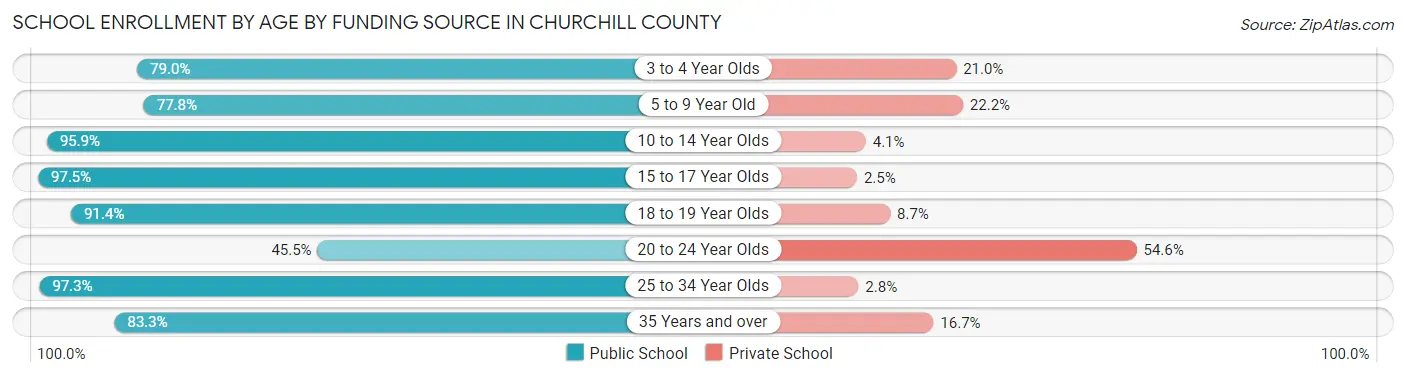
| Age Bracket | Public School | Private School |
| 3 to 4 Year Olds | 181 (79.0%) | 48 (21.0%) |
| 5 to 9 Year Old | 977 (77.8%) | 279 (22.2%) |
| 10 to 14 Year Olds | 1,700 (95.9%) | 73 (4.1%) |
| 15 to 17 Year Olds | 787 (97.5%) | 20 (2.5%) |
| 18 to 19 Year Olds | 190 (91.3%) | 18 (8.6%) |
| 20 to 24 Year Olds | 160 (45.5%) | 192 (54.5%) |
| 25 to 34 Year Olds | 212 (97.3%) | 6 (2.8%) |
| 35 Years and over | 269 (83.3%) | 54 (16.7%) |
| Total | 4,474 (86.6%) | 692 (13.4%) |
Educational Attainment by Field of Study in Churchill County
Education (500 | 15.2%), science & technology (416 | 12.7%), business (389 | 11.9%), computers & mathematics (311 | 9.5%), and arts & humanities (292 | 8.9%) are the most common fields of study among 3,280 individuals in Churchill County who have obtained a bachelor's degree or higher.
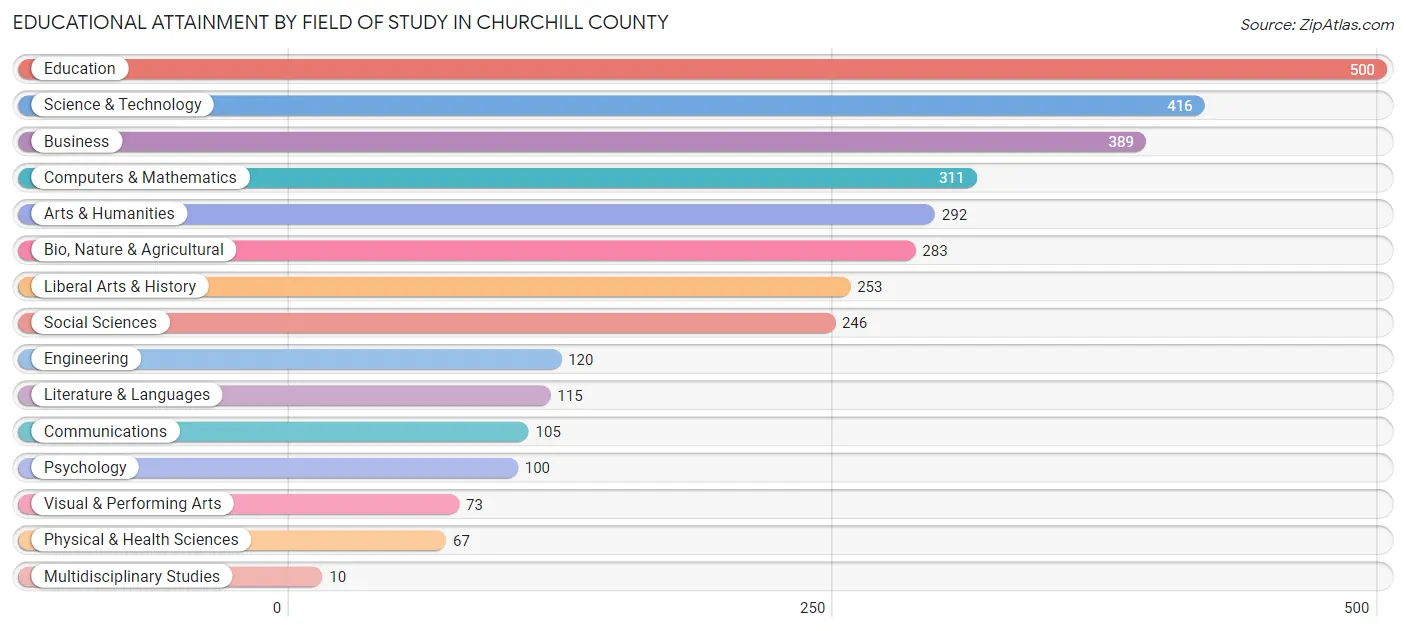
| Field of Study | # Graduates | % Graduates |
| Computers & Mathematics | 311 | 9.5% |
| Bio, Nature & Agricultural | 283 | 8.6% |
| Physical & Health Sciences | 67 | 2.0% |
| Psychology | 100 | 3.0% |
| Social Sciences | 246 | 7.5% |
| Engineering | 120 | 3.7% |
| Multidisciplinary Studies | 10 | 0.3% |
| Science & Technology | 416 | 12.7% |
| Business | 389 | 11.9% |
| Education | 500 | 15.2% |
| Literature & Languages | 115 | 3.5% |
| Liberal Arts & History | 253 | 7.7% |
| Visual & Performing Arts | 73 | 2.2% |
| Communications | 105 | 3.2% |
| Arts & Humanities | 292 | 8.9% |
| Total | 3,280 | 100.0% |
Transportation & Commute in Churchill County
Vehicle Availability by Sex in Churchill County
The most prevalent vehicle ownership categories in Churchill County are males with 2 vehicles (2,170, accounting for 34.4%) and females with 2 vehicles (2,005, making up 43.5%).
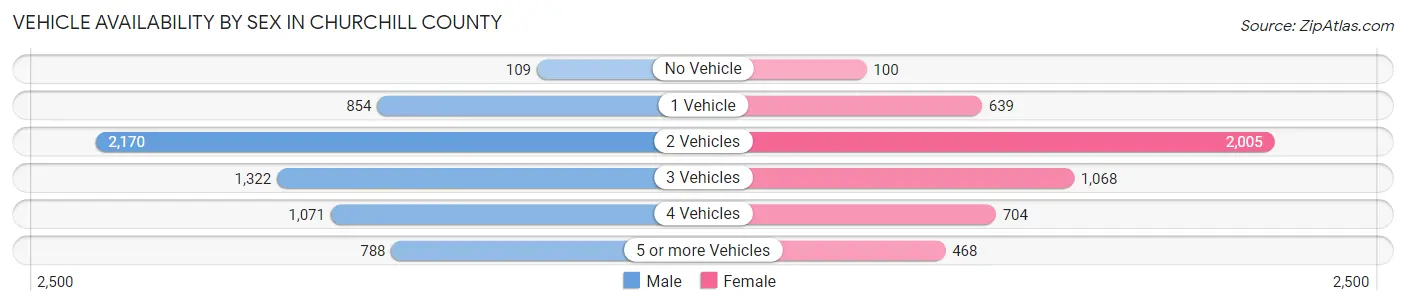
| Vehicles Available | Male | Female |
| No Vehicle | 109 (1.7%) | 100 (2.0%) |
| 1 Vehicle | 854 (13.5%) | 639 (12.8%) |
| 2 Vehicles | 2,170 (34.4%) | 2,005 (40.2%) |
| 3 Vehicles | 1,322 (20.9%) | 1,068 (21.4%) |
| 4 Vehicles | 1,071 (17.0%) | 704 (14.1%) |
| 5 or more Vehicles | 788 (12.5%) | 468 (9.4%) |
| Total | 6,314 (100.0%) | 4,984 (100.0%) |
Commute Time in Churchill County
The most frequently occuring commute durations in Churchill County are 10 to 14 minutes (2,358 commuters, 21.4%), 5 to 9 minutes (1,910 commuters, 17.3%), and 15 to 19 minutes (1,871 commuters, 17.0%).
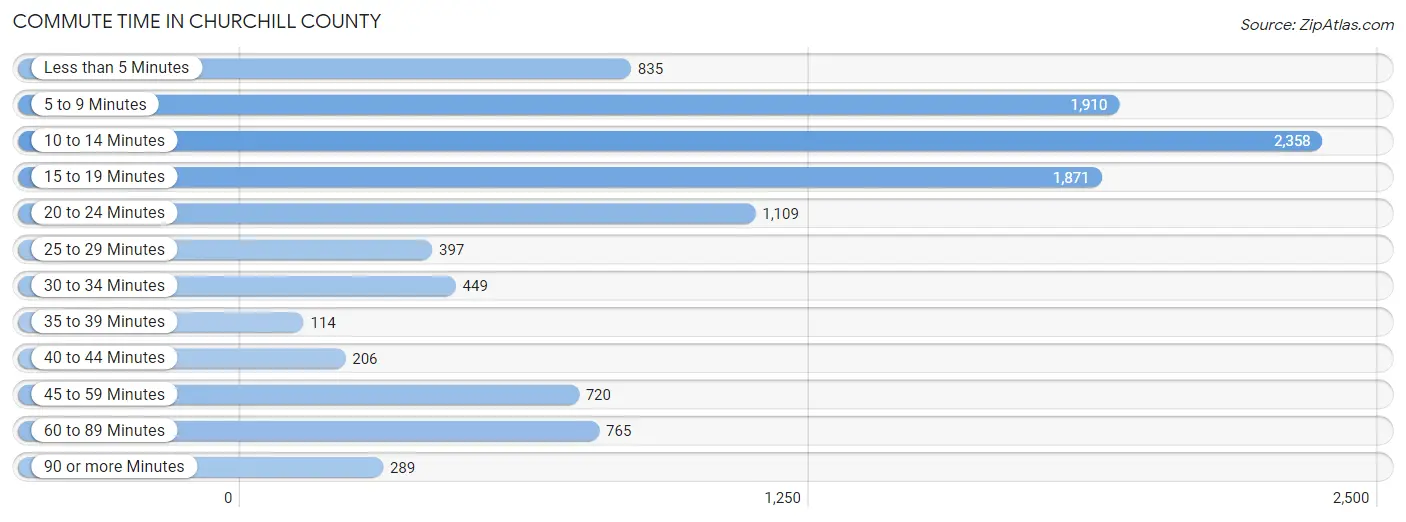
| Commute Time | # Commuters | % Commuters |
| Less than 5 Minutes | 835 | 7.6% |
| 5 to 9 Minutes | 1,910 | 17.3% |
| 10 to 14 Minutes | 2,358 | 21.4% |
| 15 to 19 Minutes | 1,871 | 17.0% |
| 20 to 24 Minutes | 1,109 | 10.1% |
| 25 to 29 Minutes | 397 | 3.6% |
| 30 to 34 Minutes | 449 | 4.1% |
| 35 to 39 Minutes | 114 | 1.0% |
| 40 to 44 Minutes | 206 | 1.9% |
| 45 to 59 Minutes | 720 | 6.5% |
| 60 to 89 Minutes | 765 | 6.9% |
| 90 or more Minutes | 289 | 2.6% |
Commute Time by Sex in Churchill County
The most common commute times in Churchill County are 10 to 14 minutes (1,148 commuters, 18.0%) for males and 10 to 14 minutes (1,210 commuters, 26.1%) for females.
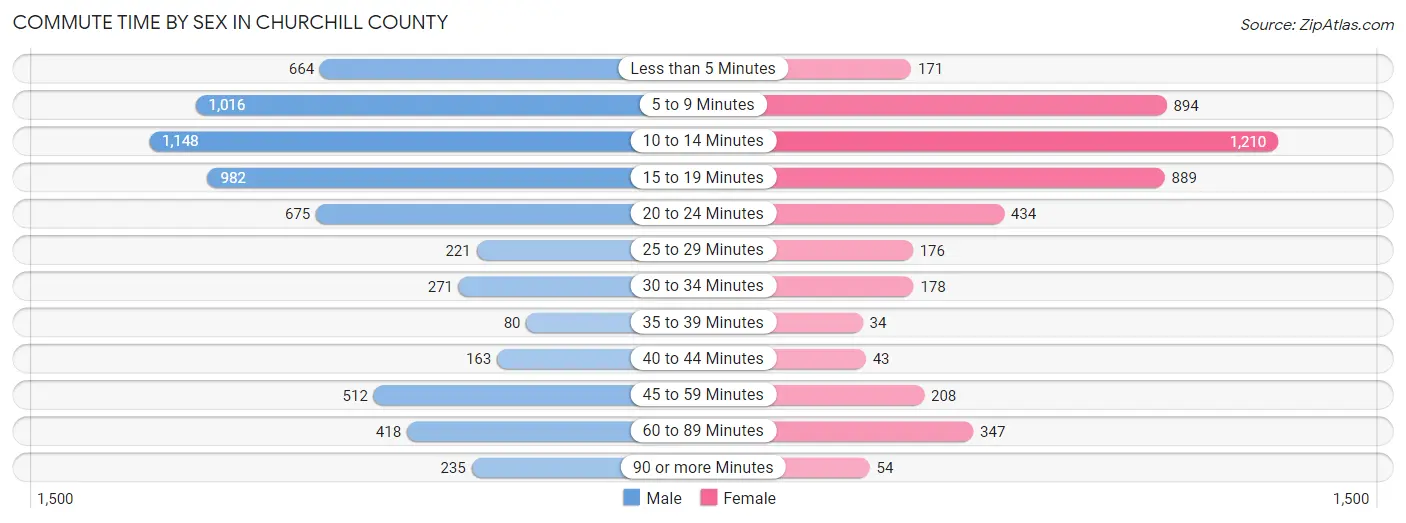
| Commute Time | Male | Female |
| Less than 5 Minutes | 664 (10.4%) | 171 (3.7%) |
| 5 to 9 Minutes | 1,016 (15.9%) | 894 (19.3%) |
| 10 to 14 Minutes | 1,148 (18.0%) | 1,210 (26.1%) |
| 15 to 19 Minutes | 982 (15.4%) | 889 (19.2%) |
| 20 to 24 Minutes | 675 (10.6%) | 434 (9.4%) |
| 25 to 29 Minutes | 221 (3.5%) | 176 (3.8%) |
| 30 to 34 Minutes | 271 (4.2%) | 178 (3.8%) |
| 35 to 39 Minutes | 80 (1.3%) | 34 (0.7%) |
| 40 to 44 Minutes | 163 (2.5%) | 43 (0.9%) |
| 45 to 59 Minutes | 512 (8.0%) | 208 (4.5%) |
| 60 to 89 Minutes | 418 (6.6%) | 347 (7.5%) |
| 90 or more Minutes | 235 (3.7%) | 54 (1.2%) |
Time of Departure to Work by Sex in Churchill County
The most frequent times of departure to work in Churchill County are 7:30 AM to 7:59 AM (1,020, 16.0%) for males and 7:30 AM to 7:59 AM (950, 20.5%) for females.
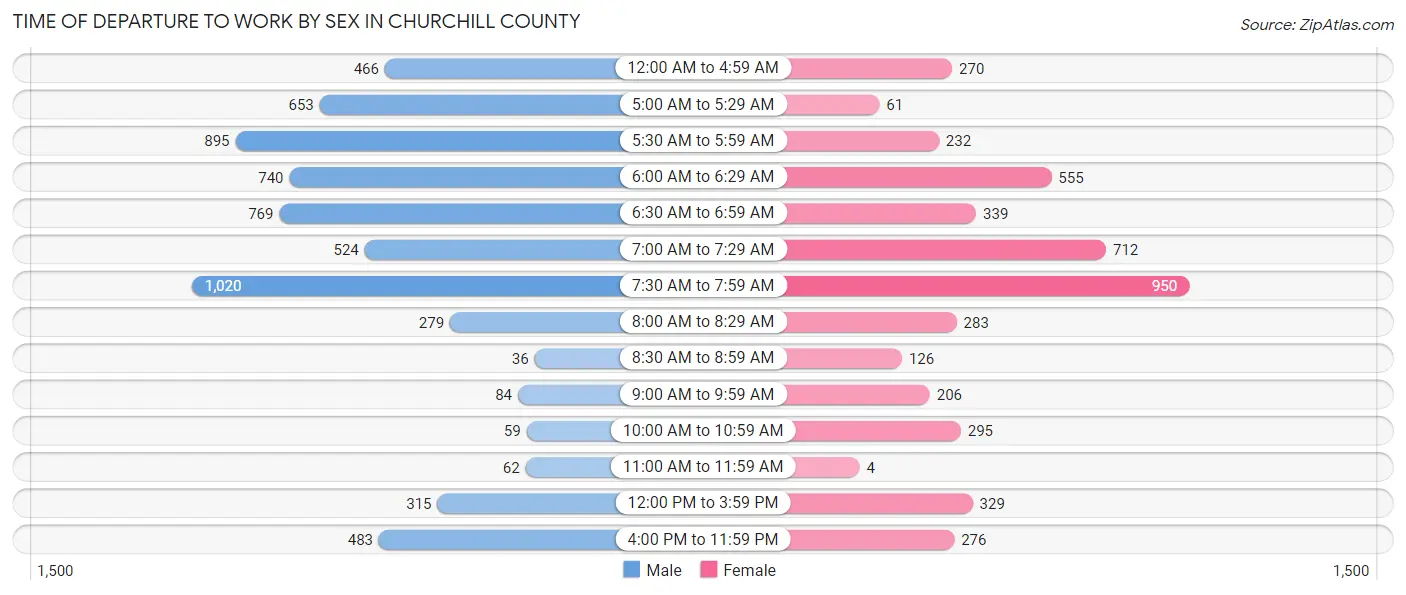
| Time of Departure | Male | Female |
| 12:00 AM to 4:59 AM | 466 (7.3%) | 270 (5.8%) |
| 5:00 AM to 5:29 AM | 653 (10.2%) | 61 (1.3%) |
| 5:30 AM to 5:59 AM | 895 (14.0%) | 232 (5.0%) |
| 6:00 AM to 6:29 AM | 740 (11.6%) | 555 (12.0%) |
| 6:30 AM to 6:59 AM | 769 (12.0%) | 339 (7.3%) |
| 7:00 AM to 7:29 AM | 524 (8.2%) | 712 (15.3%) |
| 7:30 AM to 7:59 AM | 1,020 (16.0%) | 950 (20.5%) |
| 8:00 AM to 8:29 AM | 279 (4.4%) | 283 (6.1%) |
| 8:30 AM to 8:59 AM | 36 (0.6%) | 126 (2.7%) |
| 9:00 AM to 9:59 AM | 84 (1.3%) | 206 (4.4%) |
| 10:00 AM to 10:59 AM | 59 (0.9%) | 295 (6.4%) |
| 11:00 AM to 11:59 AM | 62 (1.0%) | 4 (0.1%) |
| 12:00 PM to 3:59 PM | 315 (4.9%) | 329 (7.1%) |
| 4:00 PM to 11:59 PM | 483 (7.6%) | 276 (5.9%) |
| Total | 6,385 (100.0%) | 4,638 (100.0%) |
Housing Occupancy in Churchill County
Occupancy by Ownership in Churchill County
Of the total 9,595 dwellings in Churchill County, owner-occupied units account for 6,419 (66.9%), while renter-occupied units make up 3,176 (33.1%).
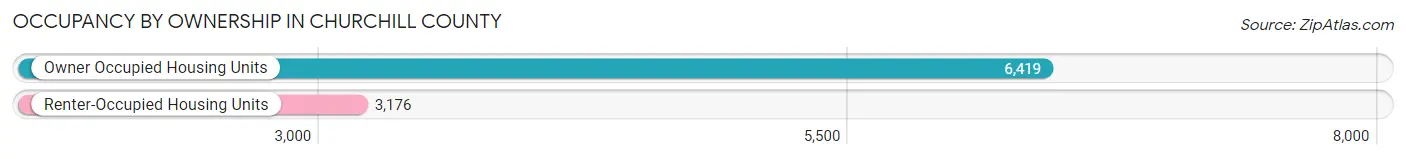
| Occupancy | # Housing Units | % Housing Units |
| Owner Occupied Housing Units | 6,419 | 66.9% |
| Renter-Occupied Housing Units | 3,176 | 33.1% |
| Total Occupied Housing Units | 9,595 | 100.0% |
Occupancy by Household Size in Churchill County
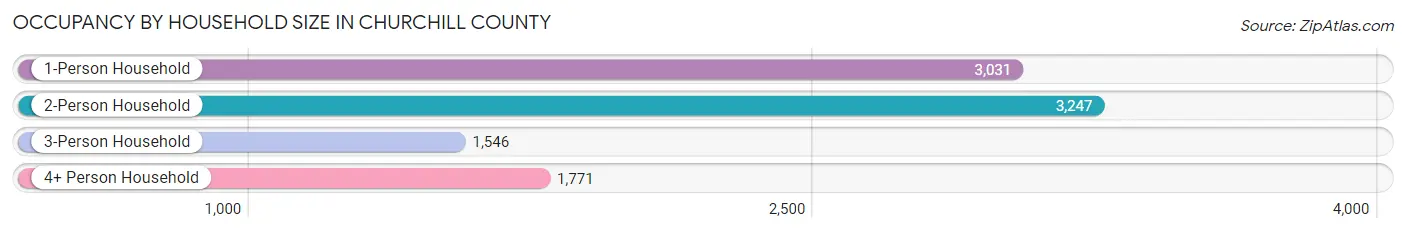
| Household Size | # Housing Units | % Housing Units |
| 1-Person Household | 3,031 | 31.6% |
| 2-Person Household | 3,247 | 33.8% |
| 3-Person Household | 1,546 | 16.1% |
| 4+ Person Household | 1,771 | 18.5% |
| Total Housing Units | 9,595 | 100.0% |
Occupancy by Ownership by Household Size in Churchill County
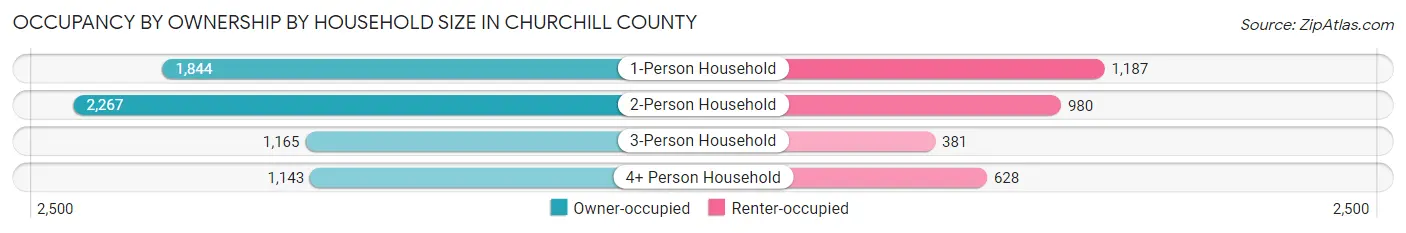
| Household Size | Owner-occupied | Renter-occupied |
| 1-Person Household | 1,844 (60.8%) | 1,187 (39.2%) |
| 2-Person Household | 2,267 (69.8%) | 980 (30.2%) |
| 3-Person Household | 1,165 (75.4%) | 381 (24.6%) |
| 4+ Person Household | 1,143 (64.5%) | 628 (35.5%) |
| Total Housing Units | 6,419 (66.9%) | 3,176 (33.1%) |
Occupancy by Educational Attainment in Churchill County
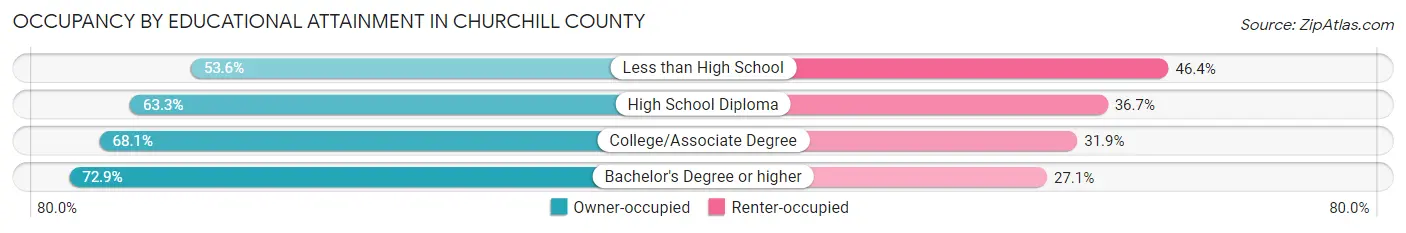
| Household Size | Owner-occupied | Renter-occupied |
| Less than High School | 244 (53.6%) | 211 (46.4%) |
| High School Diploma | 1,878 (63.3%) | 1,090 (36.7%) |
| College/Associate Degree | 2,874 (68.1%) | 1,346 (31.9%) |
| Bachelor's Degree or higher | 1,423 (72.9%) | 529 (27.1%) |
Occupancy by Age of Householder in Churchill County
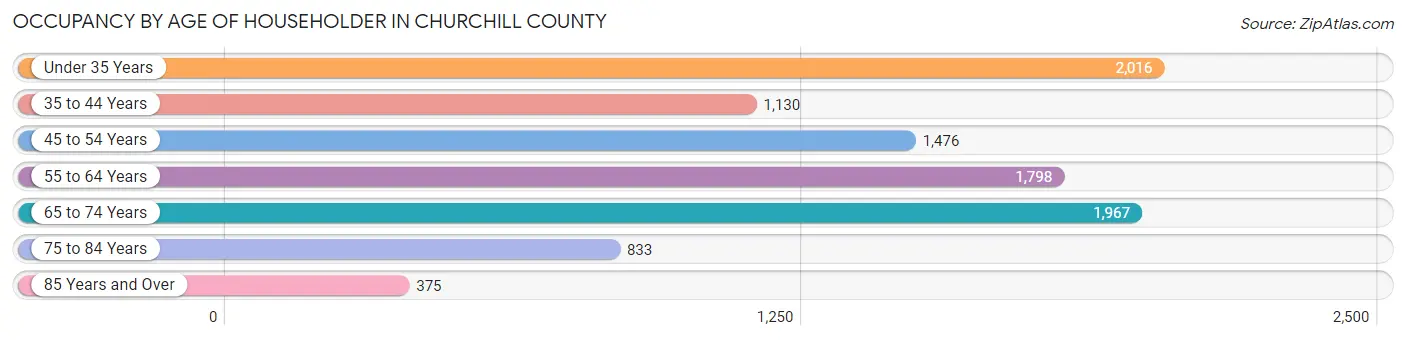
| Age Bracket | # Households | % Households |
| Under 35 Years | 2,016 | 21.0% |
| 35 to 44 Years | 1,130 | 11.8% |
| 45 to 54 Years | 1,476 | 15.4% |
| 55 to 64 Years | 1,798 | 18.7% |
| 65 to 74 Years | 1,967 | 20.5% |
| 75 to 84 Years | 833 | 8.7% |
| 85 Years and Over | 375 | 3.9% |
| Total | 9,595 | 100.0% |
Housing Finances in Churchill County
Median Income by Occupancy in Churchill County
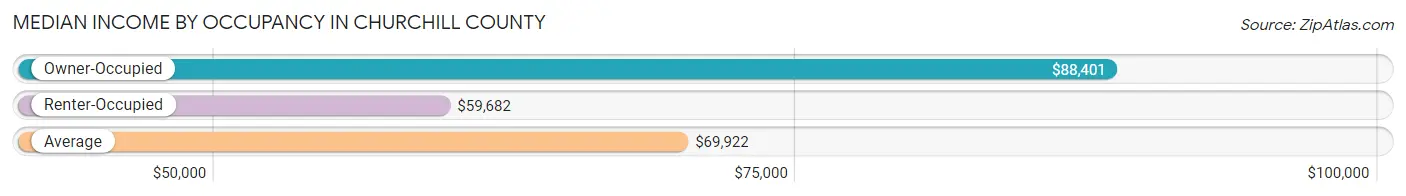
| Occupancy Type | # Households | Median Income |
| Owner-Occupied | 6,419 (66.9%) | $88,401 |
| Renter-Occupied | 3,176 (33.1%) | $59,682 |
| Average | 9,595 (100.0%) | $69,922 |
Occupancy by Householder Income Bracket in Churchill County
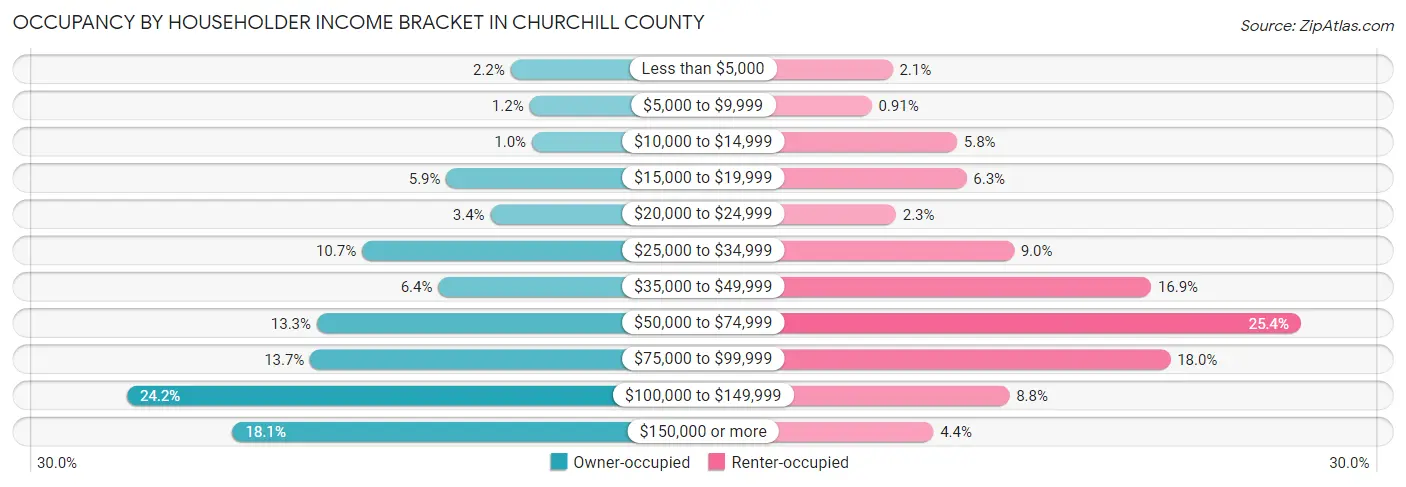
| Income Bracket | Owner-occupied | Renter-occupied |
| Less than $5,000 | 143 (2.2%) | 67 (2.1%) |
| $5,000 to $9,999 | 74 (1.1%) | 29 (0.9%) |
| $10,000 to $14,999 | 65 (1.0%) | 184 (5.8%) |
| $15,000 to $19,999 | 379 (5.9%) | 201 (6.3%) |
| $20,000 to $24,999 | 217 (3.4%) | 73 (2.3%) |
| $25,000 to $34,999 | 688 (10.7%) | 287 (9.0%) |
| $35,000 to $49,999 | 408 (6.4%) | 536 (16.9%) |
| $50,000 to $74,999 | 854 (13.3%) | 808 (25.4%) |
| $75,000 to $99,999 | 878 (13.7%) | 571 (18.0%) |
| $100,000 to $149,999 | 1,550 (24.1%) | 279 (8.8%) |
| $150,000 or more | 1,163 (18.1%) | 141 (4.4%) |
| Total | 6,419 (100.0%) | 3,176 (100.0%) |
Monthly Housing Cost Tiers in Churchill County
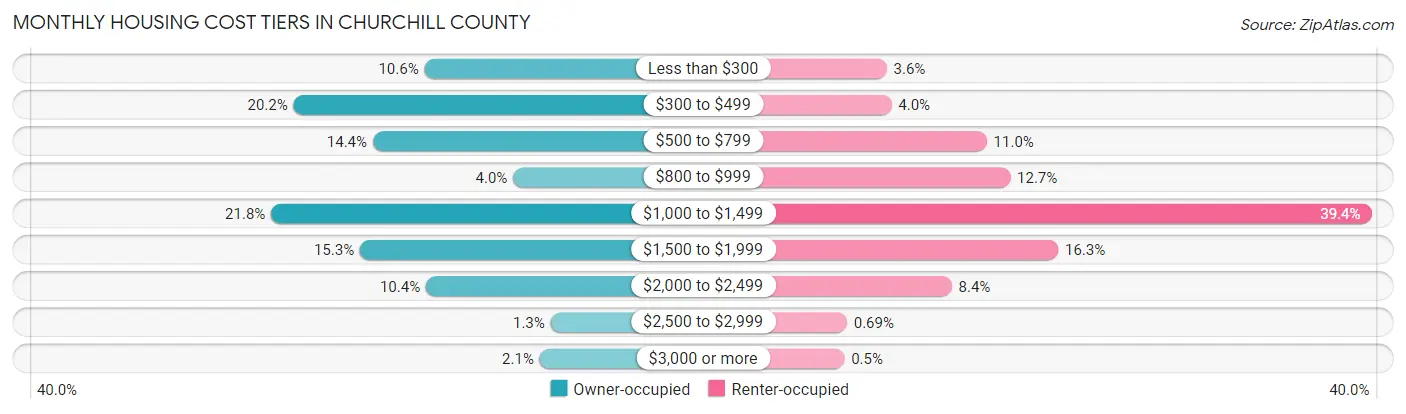
| Monthly Cost | Owner-occupied | Renter-occupied |
| Less than $300 | 677 (10.5%) | 115 (3.6%) |
| $300 to $499 | 1,296 (20.2%) | 126 (4.0%) |
| $500 to $799 | 921 (14.3%) | 349 (11.0%) |
| $800 to $999 | 258 (4.0%) | 404 (12.7%) |
| $1,000 to $1,499 | 1,402 (21.8%) | 1,251 (39.4%) |
| $1,500 to $1,999 | 982 (15.3%) | 516 (16.3%) |
| $2,000 to $2,499 | 670 (10.4%) | 267 (8.4%) |
| $2,500 to $2,999 | 81 (1.3%) | 22 (0.7%) |
| $3,000 or more | 132 (2.1%) | 16 (0.5%) |
| Total | 6,419 (100.0%) | 3,176 (100.0%) |
Physical Housing Characteristics in Churchill County
Housing Structures in Churchill County
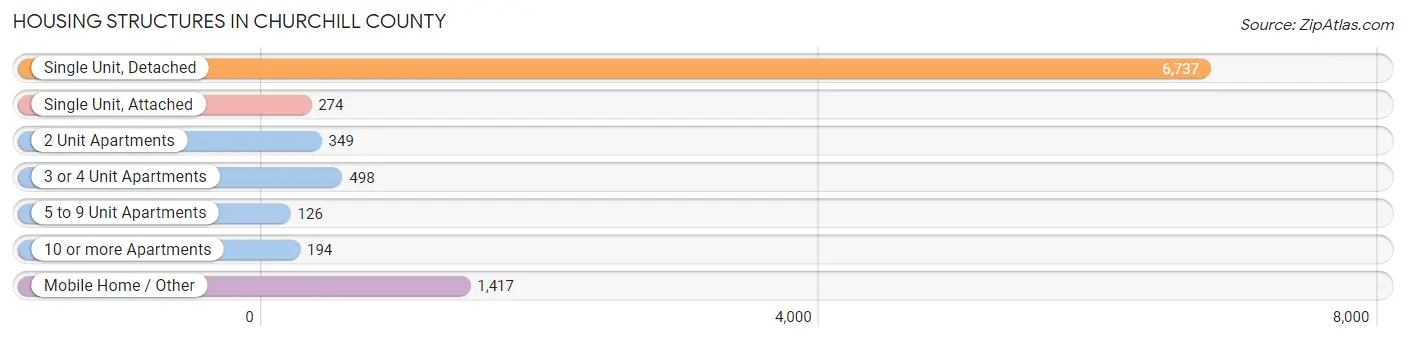
| Structure Type | # Housing Units | % Housing Units |
| Single Unit, Detached | 6,737 | 70.2% |
| Single Unit, Attached | 274 | 2.9% |
| 2 Unit Apartments | 349 | 3.6% |
| 3 or 4 Unit Apartments | 498 | 5.2% |
| 5 to 9 Unit Apartments | 126 | 1.3% |
| 10 or more Apartments | 194 | 2.0% |
| Mobile Home / Other | 1,417 | 14.8% |
| Total | 9,595 | 100.0% |
Housing Structures by Occupancy in Churchill County
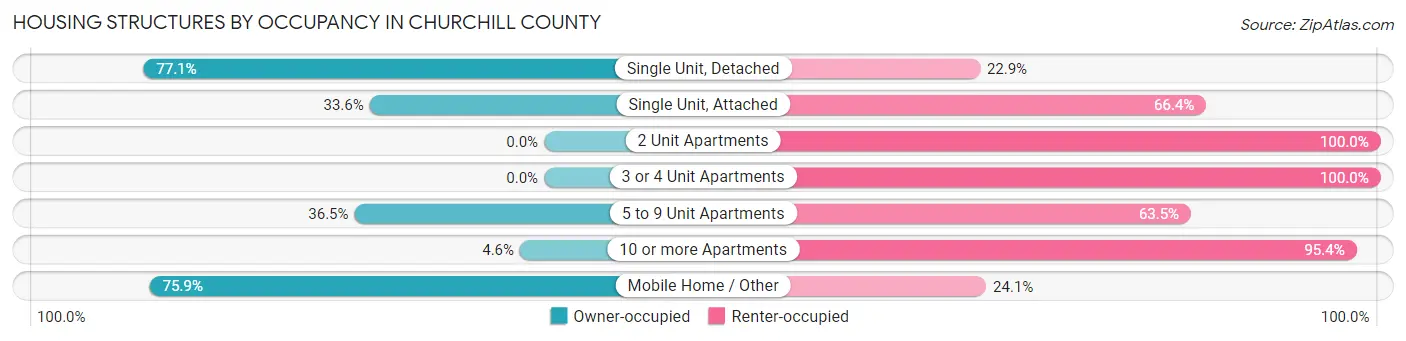
| Structure Type | Owner-occupied | Renter-occupied |
| Single Unit, Detached | 5,196 (77.1%) | 1,541 (22.9%) |
| Single Unit, Attached | 92 (33.6%) | 182 (66.4%) |
| 2 Unit Apartments | 0 (0.0%) | 349 (100.0%) |
| 3 or 4 Unit Apartments | 0 (0.0%) | 498 (100.0%) |
| 5 to 9 Unit Apartments | 46 (36.5%) | 80 (63.5%) |
| 10 or more Apartments | 9 (4.6%) | 185 (95.4%) |
| Mobile Home / Other | 1,076 (75.9%) | 341 (24.1%) |
| Total | 6,419 (66.9%) | 3,176 (33.1%) |
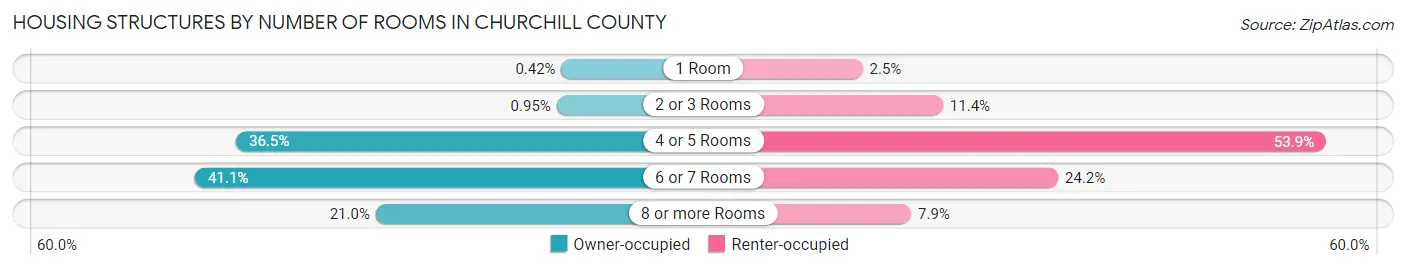
Housing Structures by Number of Rooms in Churchill County
| Number of Rooms | Owner-occupied | Renter-occupied |
| 1 Room | 27 (0.4%) | 80 (2.5%) |
| 2 or 3 Rooms | 61 (0.9%) | 363 (11.4%) |
| 4 or 5 Rooms | 2,345 (36.5%) | 1,713 (53.9%) |
| 6 or 7 Rooms | 2,636 (41.1%) | 769 (24.2%) |
| 8 or more Rooms | 1,350 (21.0%) | 251 (7.9%) |
| Total | 6,419 (100.0%) | 3,176 (100.0%) |
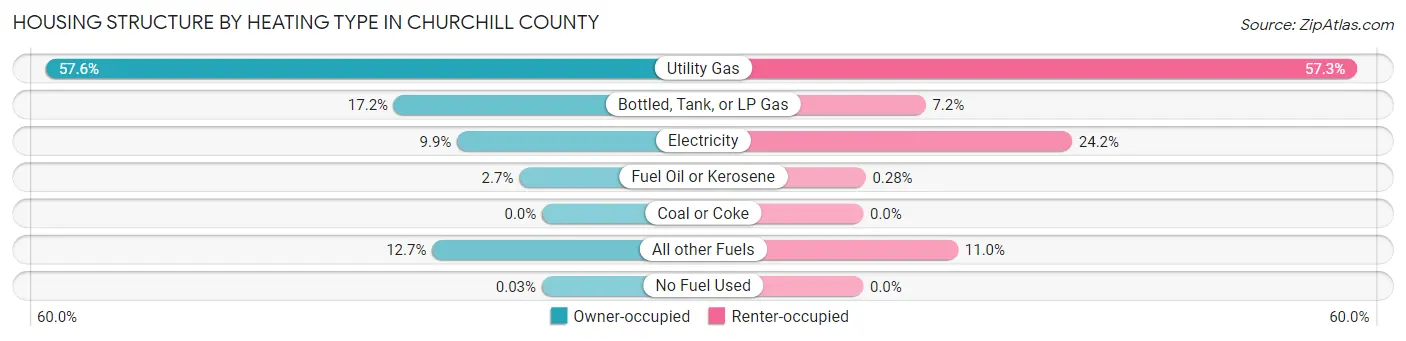
Housing Structure by Heating Type in Churchill County
| Heating Type | Owner-occupied | Renter-occupied |
| Utility Gas | 3,694 (57.6%) | 1,819 (57.3%) |
| Bottled, Tank, or LP Gas | 1,103 (17.2%) | 230 (7.2%) |
| Electricity | 632 (9.9%) | 769 (24.2%) |
| Fuel Oil or Kerosene | 170 (2.6%) | 9 (0.3%) |
| Coal or Coke | 0 (0.0%) | 0 (0.0%) |
| All other Fuels | 818 (12.7%) | 349 (11.0%) |
| No Fuel Used | 2 (0.0%) | 0 (0.0%) |
| Total | 6,419 (100.0%) | 3,176 (100.0%) |
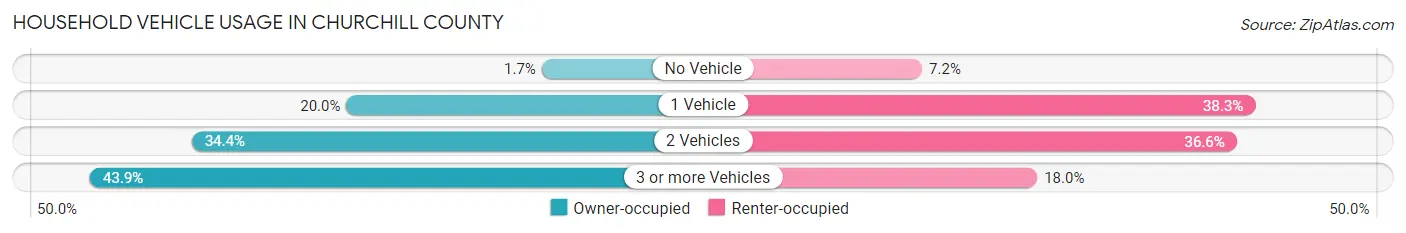
Household Vehicle Usage in Churchill County
| Vehicles per Household | Owner-occupied | Renter-occupied |
| No Vehicle | 111 (1.7%) | 229 (7.2%) |
| 1 Vehicle | 1,282 (20.0%) | 1,216 (38.3%) |
| 2 Vehicles | 2,208 (34.4%) | 1,161 (36.6%) |
| 3 or more Vehicles | 2,818 (43.9%) | 570 (17.9%) |
| Total | 6,419 (100.0%) | 3,176 (100.0%) |
Real Estate & Mortgages in Churchill County
Real Estate and Mortgage Overview in Churchill County
| Characteristic | Without Mortgage | With Mortgage |
| Housing Units | 2,920 | 3,499 |
| Median Property Value | $229,300 | $282,500 |
| Median Household Income | $57,789 | $801 |
| Monthly Housing Costs | $421 | $132 |
| Real Estate Taxes | $1,465 | $42 |
Property Value by Mortgage Status in Churchill County
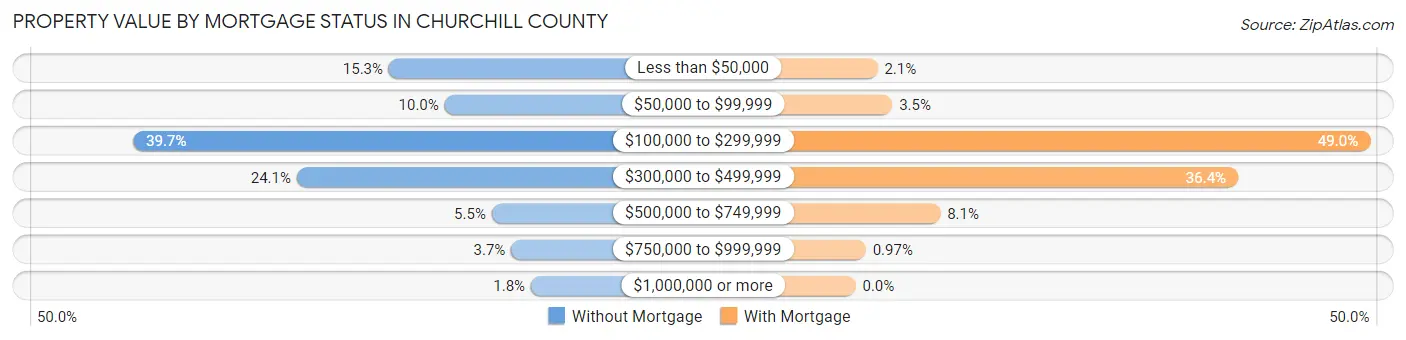
| Property Value | Without Mortgage | With Mortgage |
| Less than $50,000 | 447 (15.3%) | 73 (2.1%) |
| $50,000 to $99,999 | 292 (10.0%) | 122 (3.5%) |
| $100,000 to $299,999 | 1,158 (39.7%) | 1,714 (49.0%) |
| $300,000 to $499,999 | 703 (24.1%) | 1,274 (36.4%) |
| $500,000 to $749,999 | 161 (5.5%) | 282 (8.1%) |
| $750,000 to $999,999 | 107 (3.7%) | 34 (1.0%) |
| $1,000,000 or more | 52 (1.8%) | 0 (0.0%) |
| Total | 2,920 (100.0%) | 3,499 (100.0%) |
Household Income by Mortgage Status in Churchill County
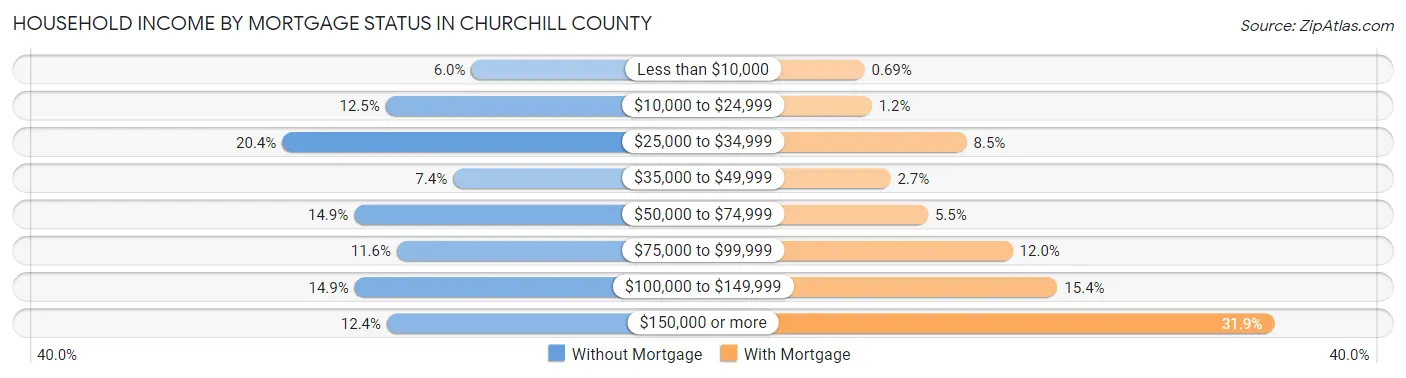
| Household Income | Without Mortgage | With Mortgage |
| Less than $10,000 | 174 (6.0%) | 24 (0.7%) |
| $10,000 to $24,999 | 365 (12.5%) | 43 (1.2%) |
| $25,000 to $34,999 | 595 (20.4%) | 296 (8.5%) |
| $35,000 to $49,999 | 215 (7.4%) | 93 (2.7%) |
| $50,000 to $74,999 | 435 (14.9%) | 193 (5.5%) |
| $75,000 to $99,999 | 340 (11.6%) | 419 (12.0%) |
| $100,000 to $149,999 | 434 (14.9%) | 538 (15.4%) |
| $150,000 or more | 362 (12.4%) | 1,116 (31.9%) |
| Total | 2,920 (100.0%) | 3,499 (100.0%) |
Property Value to Household Income Ratio in Churchill County
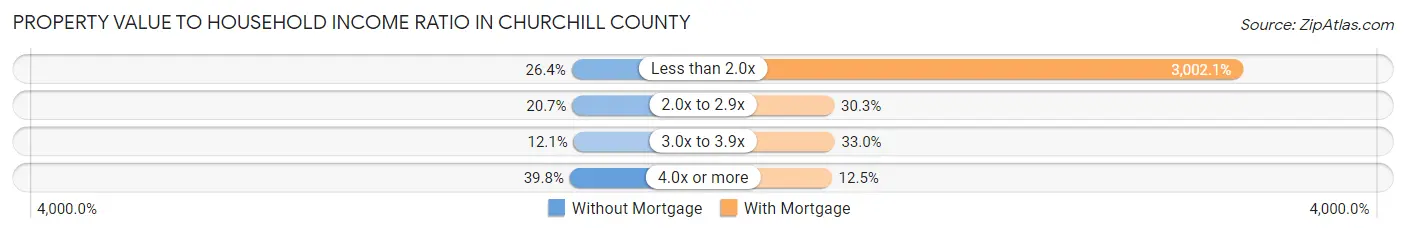
| Value-to-Income Ratio | Without Mortgage | With Mortgage |
| Less than 2.0x | 770 (26.4%) | 105,042 (3,002.1%) |
| 2.0x to 2.9x | 604 (20.7%) | 1,060 (30.3%) |
| 3.0x to 3.9x | 353 (12.1%) | 1,156 (33.0%) |
| 4.0x or more | 1,162 (39.8%) | 438 (12.5%) |
| Total | 2,920 (100.0%) | 3,499 (100.0%) |
Real Estate Taxes by Mortgage Status in Churchill County
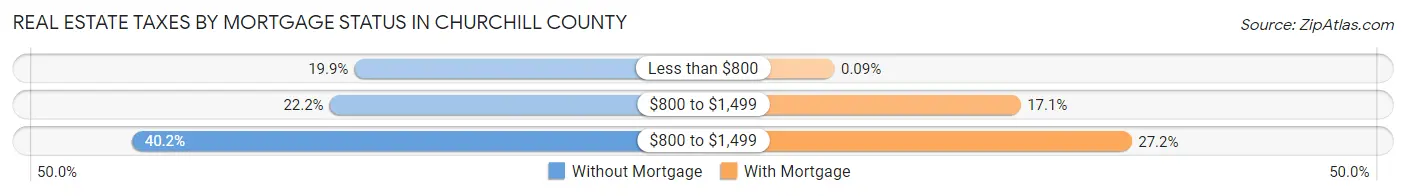
| Property Taxes | Without Mortgage | With Mortgage |
| Less than $800 | 581 (19.9%) | 3 (0.1%) |
| $800 to $1,499 | 647 (22.2%) | 598 (17.1%) |
| $800 to $1,499 | 1,174 (40.2%) | 953 (27.2%) |
| Total | 2,920 (100.0%) | 3,499 (100.0%) |
Health & Disability in Churchill County
Health Insurance Coverage by Age in Churchill County
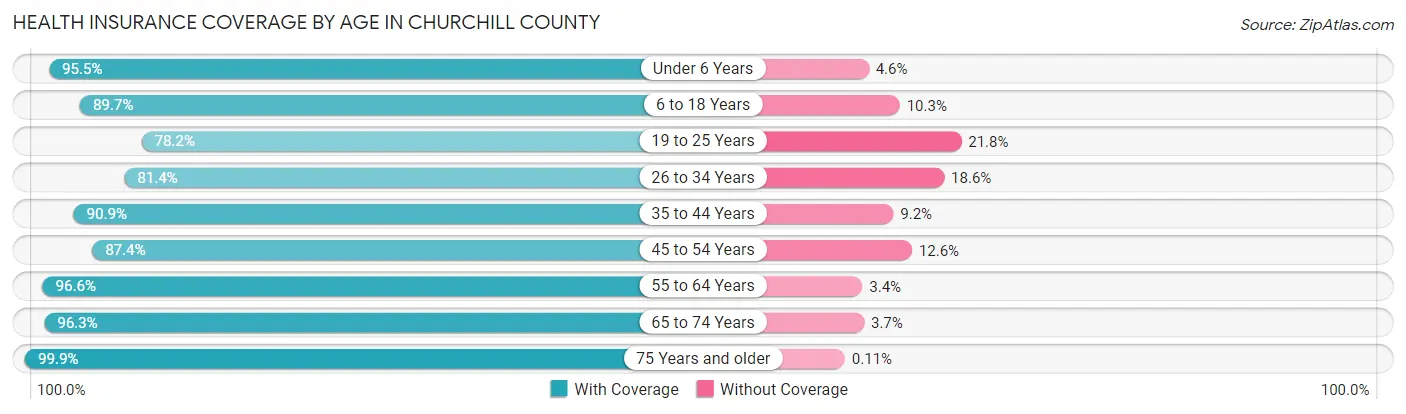
| Age Bracket | With Coverage | Without Coverage |
| Under 6 Years | 1,679 (95.5%) | 80 (4.5%) |
| 6 to 18 Years | 3,791 (89.7%) | 437 (10.3%) |
| 19 to 25 Years | 1,287 (78.2%) | 359 (21.8%) |
| 26 to 34 Years | 2,128 (81.4%) | 487 (18.6%) |
| 35 to 44 Years | 2,434 (90.8%) | 245 (9.1%) |
| 45 to 54 Years | 2,493 (87.4%) | 360 (12.6%) |
| 55 to 64 Years | 3,324 (96.6%) | 116 (3.4%) |
| 65 to 74 Years | 2,855 (96.3%) | 109 (3.7%) |
| 75 Years and older | 1,898 (99.9%) | 2 (0.1%) |
| Total | 21,889 (90.9%) | 2,195 (9.1%) |
Health Insurance Coverage by Citizenship Status in Churchill County
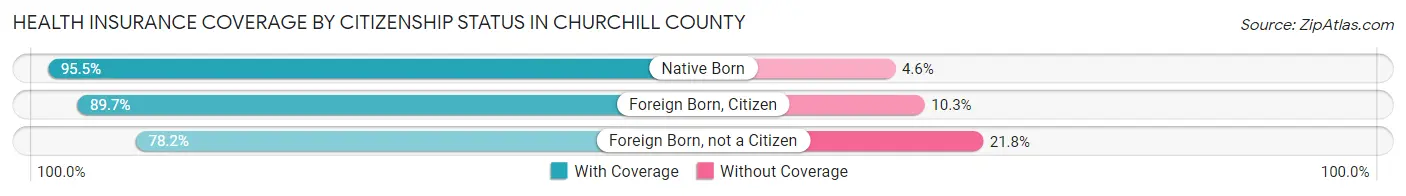
| Citizenship Status | With Coverage | Without Coverage |
| Native Born | 1,679 (95.5%) | 80 (4.5%) |
| Foreign Born, Citizen | 3,791 (89.7%) | 437 (10.3%) |
| Foreign Born, not a Citizen | 1,287 (78.2%) | 359 (21.8%) |
Health Insurance Coverage by Household Income in Churchill County
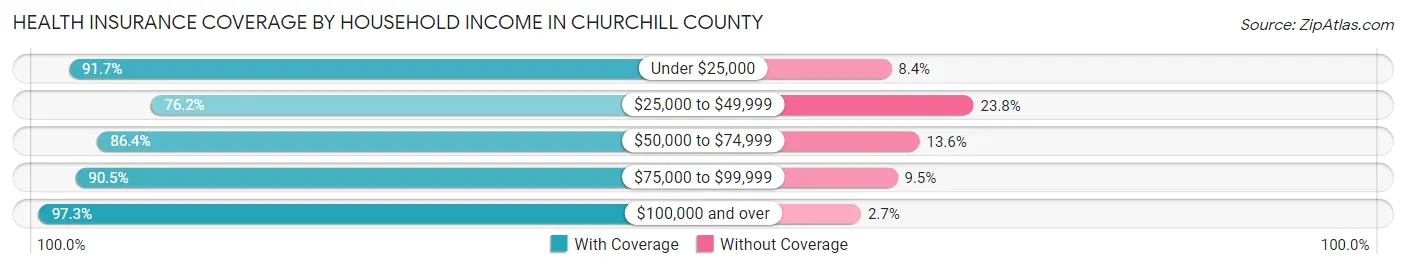
| Household Income | With Coverage | Without Coverage |
| Under $25,000 | 2,163 (91.6%) | 197 (8.4%) |
| $25,000 to $49,999 | 2,791 (76.2%) | 870 (23.8%) |
| $50,000 to $74,999 | 3,014 (86.4%) | 476 (13.6%) |
| $75,000 to $99,999 | 3,487 (90.5%) | 366 (9.5%) |
| $100,000 and over | 10,361 (97.3%) | 283 (2.7%) |
Public vs Private Health Insurance Coverage by Age in Churchill County
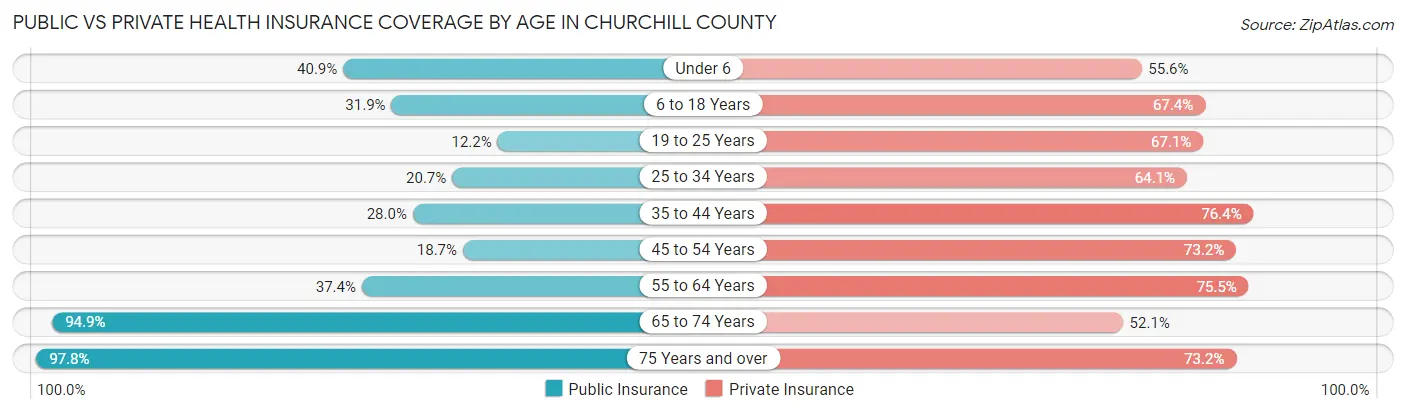
| Age Bracket | Public Insurance | Private Insurance |
| Under 6 | 719 (40.9%) | 978 (55.6%) |
| 6 to 18 Years | 1,349 (31.9%) | 2,851 (67.4%) |
| 19 to 25 Years | 201 (12.2%) | 1,104 (67.1%) |
| 25 to 34 Years | 540 (20.6%) | 1,675 (64.0%) |
| 35 to 44 Years | 749 (28.0%) | 2,047 (76.4%) |
| 45 to 54 Years | 532 (18.6%) | 2,088 (73.2%) |
| 55 to 64 Years | 1,287 (37.4%) | 2,598 (75.5%) |
| 65 to 74 Years | 2,812 (94.9%) | 1,545 (52.1%) |
| 75 Years and over | 1,859 (97.8%) | 1,391 (73.2%) |
| Total | 10,048 (41.7%) | 16,277 (67.6%) |
Disability Status by Sex by Age in Churchill County
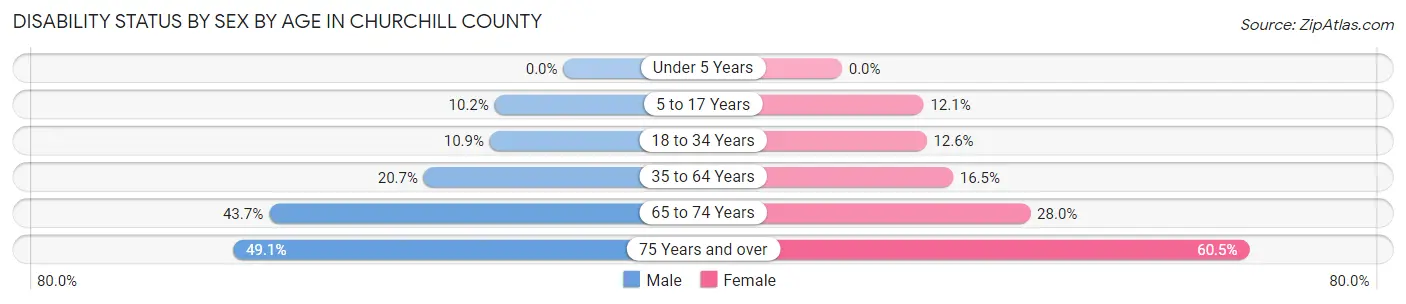
| Age Bracket | Male | Female |
| Under 5 Years | 0 (0.0%) | 0 (0.0%) |
| 5 to 17 Years | 202 (10.2%) | 250 (12.1%) |
| 18 to 34 Years | 253 (10.9%) | 288 (12.6%) |
| 35 to 64 Years | 935 (20.7%) | 735 (16.5%) |
| 65 to 74 Years | 622 (43.7%) | 431 (28.0%) |
| 75 Years and over | 439 (49.0%) | 608 (60.5%) |
Disability Class by Sex by Age in Churchill County
Disability Class: Hearing Difficulty
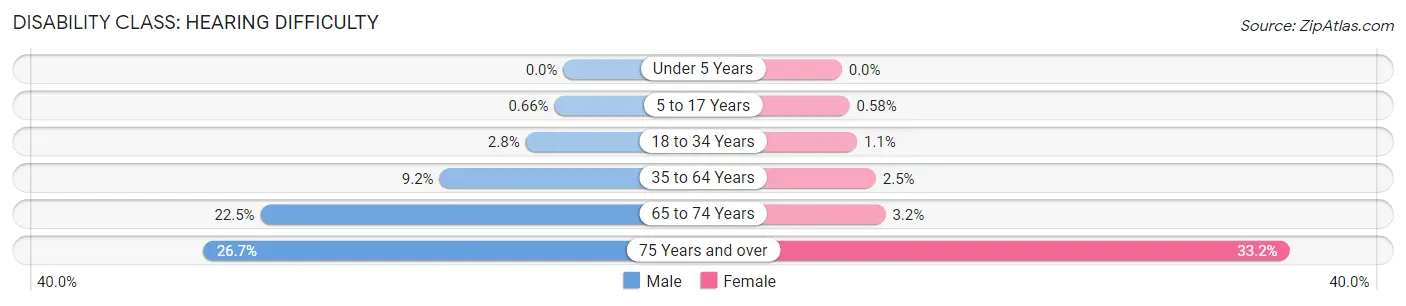
| Age Bracket | Male | Female |
| Under 5 Years | 0 (0.0%) | 0 (0.0%) |
| 5 to 17 Years | 13 (0.7%) | 12 (0.6%) |
| 18 to 34 Years | 65 (2.8%) | 26 (1.1%) |
| 35 to 64 Years | 415 (9.2%) | 113 (2.5%) |
| 65 to 74 Years | 320 (22.5%) | 50 (3.2%) |
| 75 Years and over | 239 (26.7%) | 334 (33.2%) |
Disability Class: Vision Difficulty
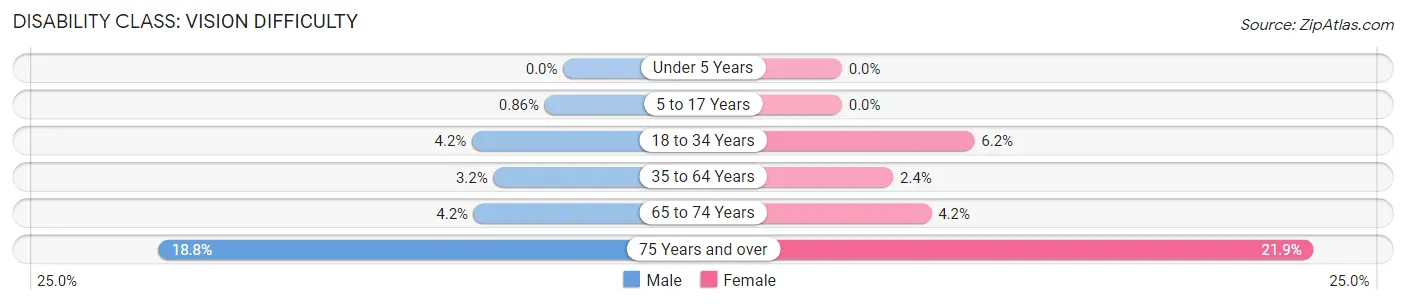
| Age Bracket | Male | Female |
| Under 5 Years | 0 (0.0%) | 0 (0.0%) |
| 5 to 17 Years | 17 (0.9%) | 0 (0.0%) |
| 18 to 34 Years | 98 (4.2%) | 141 (6.1%) |
| 35 to 64 Years | 146 (3.2%) | 106 (2.4%) |
| 65 to 74 Years | 59 (4.2%) | 64 (4.2%) |
| 75 Years and over | 168 (18.8%) | 220 (21.9%) |
Disability Class: Cognitive Difficulty
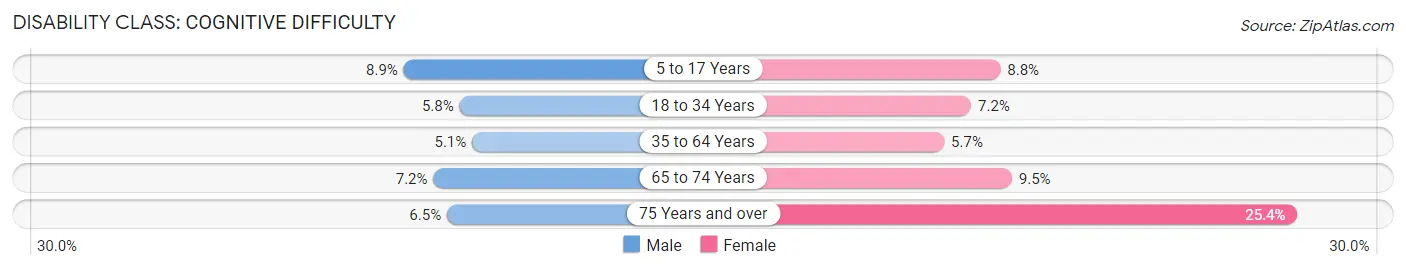
| Age Bracket | Male | Female |
| 5 to 17 Years | 176 (8.9%) | 182 (8.8%) |
| 18 to 34 Years | 134 (5.8%) | 165 (7.2%) |
| 35 to 64 Years | 229 (5.1%) | 254 (5.7%) |
| 65 to 74 Years | 103 (7.2%) | 146 (9.5%) |
| 75 Years and over | 58 (6.5%) | 255 (25.4%) |
Disability Class: Ambulatory Difficulty
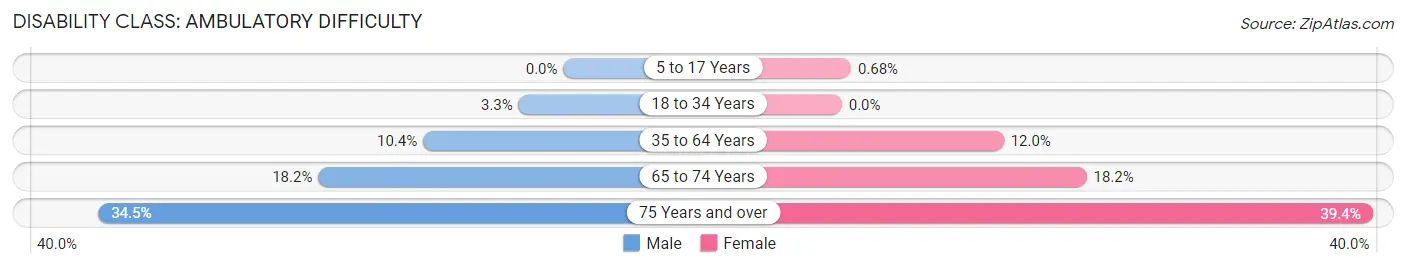
| Age Bracket | Male | Female |
| 5 to 17 Years | 0 (0.0%) | 14 (0.7%) |
| 18 to 34 Years | 77 (3.3%) | 0 (0.0%) |
| 35 to 64 Years | 470 (10.4%) | 536 (12.0%) |
| 65 to 74 Years | 259 (18.2%) | 280 (18.2%) |
| 75 Years and over | 309 (34.5%) | 396 (39.4%) |
Disability Class: Self-Care Difficulty
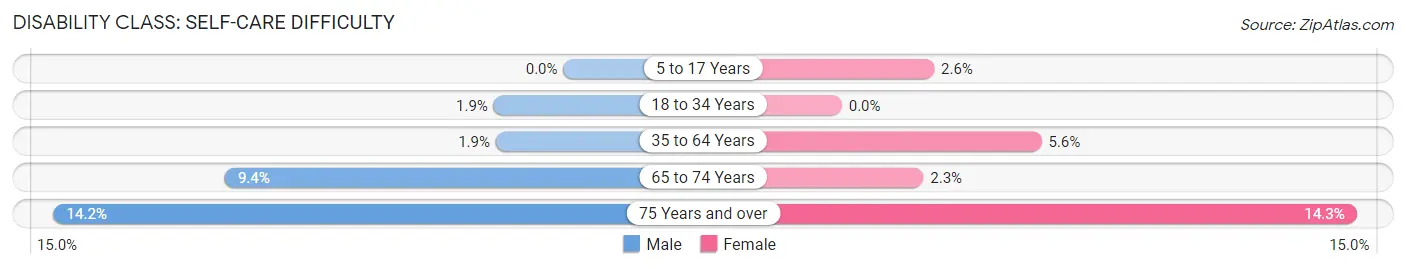
| Age Bracket | Male | Female |
| 5 to 17 Years | 0 (0.0%) | 53 (2.6%) |
| 18 to 34 Years | 45 (1.9%) | 0 (0.0%) |
| 35 to 64 Years | 85 (1.9%) | 248 (5.6%) |
| 65 to 74 Years | 134 (9.4%) | 35 (2.3%) |
| 75 Years and over | 127 (14.2%) | 144 (14.3%) |
Technology Access in Churchill County
Computing Device Access in Churchill County
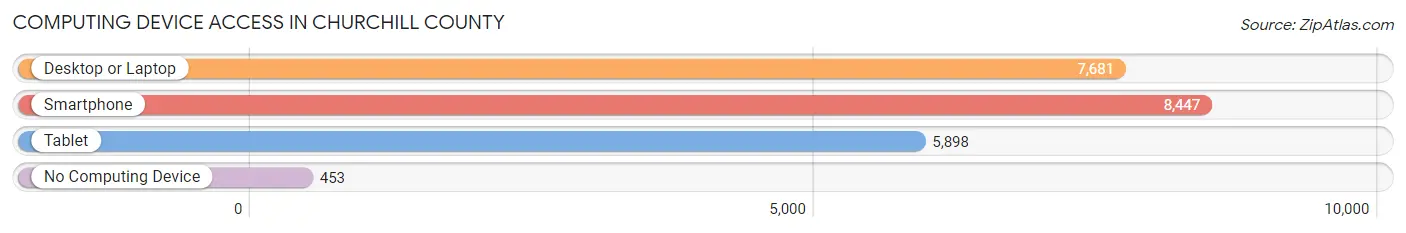
| Device Type | # Households | % Households |
| Desktop or Laptop | 7,681 | 80.0% |
| Smartphone | 8,447 | 88.0% |
| Tablet | 5,898 | 61.5% |
| No Computing Device | 453 | 4.7% |
| Total | 9,595 | 100.0% |
Internet Access in Churchill County
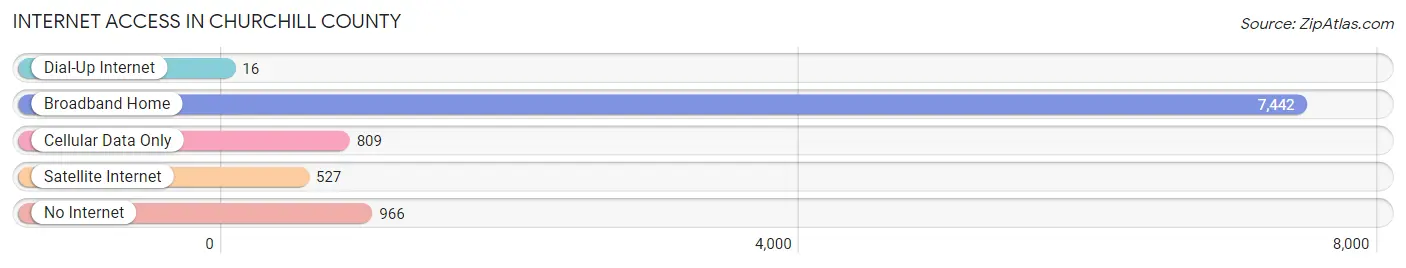
| Internet Type | # Households | % Households |
| Dial-Up Internet | 16 | 0.2% |
| Broadband Home | 7,442 | 77.6% |
| Cellular Data Only | 809 | 8.4% |
| Satellite Internet | 527 | 5.5% |
| No Internet | 966 | 10.1% |
| Total | 9,595 | 100.0% |
Churchill County Summary
Churchill County is located in the western part of the state of Nevada, in the United States. It is bordered by Lyon County to the south, Pershing County to the east, and Humboldt County to the north. The county seat is Fallon, and the largest city is Fallon. The county was named after the British statesman, Winston Churchill.
History
Churchill County was established in 1861, and was originally part of the Utah Territory. It was named after the British statesman, Winston Churchill. The county was originally inhabited by the Paiute and Shoshone Native American tribes. The first settlers in the area were ranchers and farmers, who arrived in the late 19th century.
The county was an important part of the Pony Express route, and the first post office in the county was established in 1864. The county was also an important part of the transcontinental railroad, and the first railroad line in the county was completed in 1869.
Geography
Churchill County is located in the western part of the state of Nevada. It is bordered by Lyon County to the south, Pershing County to the east, and Humboldt County to the north. The county has a total area of 4,936 square miles, of which 4,919 square miles is land and 17 square miles is water.
The county is mostly flat, with some rolling hills in the northern part of the county. The highest point in the county is the summit of Mount Jefferson, which has an elevation of 8,845 feet. The county is home to several lakes, including Lahontan Reservoir, which is the largest lake in the county.
Economy
The economy of Churchill County is largely based on agriculture and mining. The county is home to several large farms, which produce a variety of crops, including alfalfa, hay, wheat, and barley. The county is also home to several large mining operations, which produce gold, silver, copper, and other minerals.
The county is also home to several military installations, including Naval Air Station Fallon and the Fallon Range Training Complex. These installations provide a significant boost to the local economy.
Demographics
As of the 2010 census, the population of Churchill County was 24,877. The population density was 5.1 people per square mile. The racial makeup of the county was 79.3% White, 1.2% African American, 1.2% Native American, 0.7% Asian, 0.1% Pacific Islander, 15.2% from other races, and 2.5% from two or more races. Hispanic or Latino of any race were 28.3% of the population.
The median income for a household in the county was $45,945, and the median income for a family was $51,945. The per capita income for the county was $20,945. About 11.3% of families and 14.2% of the population were below the poverty line, including 19.2% of those under age 18 and 8.2% of those age 65 or over.
Common Questions
What is Per Capita Income in Churchill County?
Per Capita income in Churchill County is $35,869.
What is the Median Family Income in Churchill County?
Median Family Income in Churchill County is $94,505.
What is the Median Household income in Churchill County?
Median Household Income in Churchill County is $69,922.
What is Income or Wage Gap in Churchill County?
Income or Wage Gap in Churchill County is 30.1%.
Women in Churchill County earn 69.9 cents for every dollar earned by a man.
What is Family Income Deficit in Churchill County?
Family Income Deficit in Churchill County is $9,512.
Families that are below poverty line in Churchill County earn $9,512 less on average than the poverty threshold level.
What is Inequality or Gini Index in Churchill County?
Inequality or Gini Index in Churchill County is 0.42.
What is the Total Population of Churchill County?
Total Population of Churchill County is 25,409.
What is the Total Male Population of Churchill County?
Total Male Population of Churchill County is 13,112.
What is the Total Female Population of Churchill County?
Total Female Population of Churchill County is 12,297.
What is the Ratio of Males per 100 Females in Churchill County?
There are 106.63 Males per 100 Females in Churchill County.
What is the Ratio of Females per 100 Males in Churchill County?
There are 93.78 Females per 100 Males in Churchill County.
What is the Median Population Age in Churchill County?
Median Population Age in Churchill County is 39.7 Years.
What is the Average Family Size in Churchill County
Average Family Size in Churchill County is 3.3 People.
What is the Average Household Size in Churchill County
Average Household Size in Churchill County is 2.6 People.
How Large is the Labor Force in Churchill County?
There are 12,695 People in the Labor Forcein in Churchill County.
What is the Percentage of People in the Labor Force in Churchill County?
62.5% of People are in the Labor Force in Churchill County.
What is the Unemployment Rate in Churchill County?
Unemployment Rate in Churchill County is 6.3%.