Carson City, NV Map & Demographics
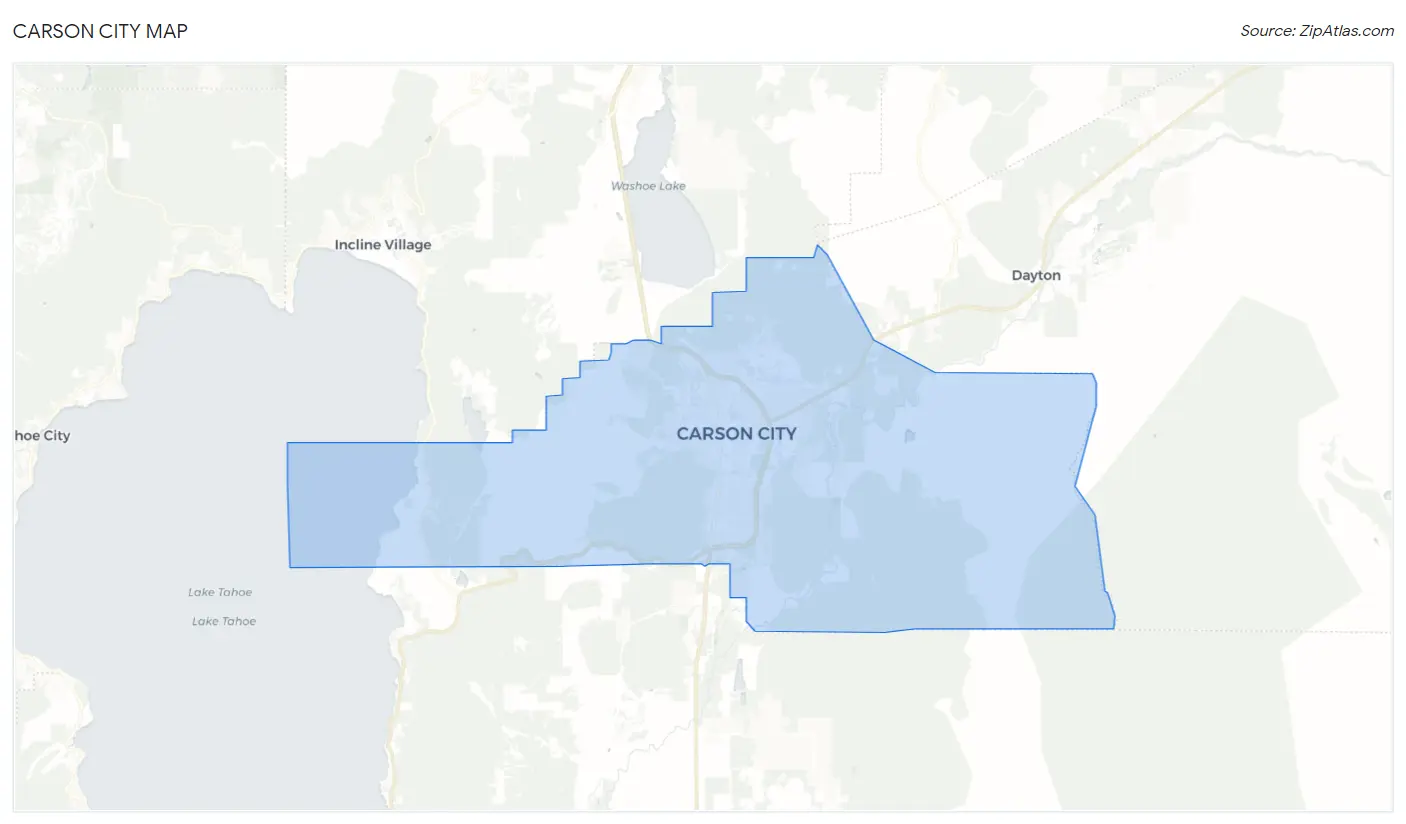
Carson City Map
Carson City Overview
$37,677
PER CAPITA INCOME
$82,109
AVG FAMILY INCOME
$67,465
AVG HOUSEHOLD INCOME
19.9%
WAGE / INCOME GAP [ % ]
80.1¢/ $1
WAGE / INCOME GAP [ $ ]
$8,797
FAMILY INCOME DEFICIT
0.46
INEQUALITY / GINI INDEX
58,249
TOTAL POPULATION
30,199
MALE POPULATION
28,050
FEMALE POPULATION
107.66
MALES / 100 FEMALES
92.88
FEMALES / 100 MALES
42.1
MEDIAN AGE
2.9
AVG FAMILY SIZE
2.4
AVG HOUSEHOLD SIZE
28,759
LABOR FORCE [ PEOPLE ]
60.0%
PERCENT IN LABOR FORCE
4.7%
UNEMPLOYMENT RATE
Carson City Area Codes
Income in Carson City
Income Overview in Carson City
Per Capita Income in Carson City is $37,677, while median incomes of families and households are $82,109 and $67,465 respectively.
| Characteristic | Number | Measure |
| Per Capita Income | 58,249 | $37,677 |
| Median Family Income | 14,717 | $82,109 |
| Mean Family Income | 14,717 | $103,688 |
| Median Household Income | 23,355 | $67,465 |
| Mean Household Income | 23,355 | $91,960 |
| Income Deficit | 14,717 | $8,797 |
| Wage / Income Gap (%) | 58,249 | 19.93% |
| Wage / Income Gap ($) | 58,249 | 80.07¢ per $1 |
| Gini / Inequality Index | 58,249 | 0.46 |
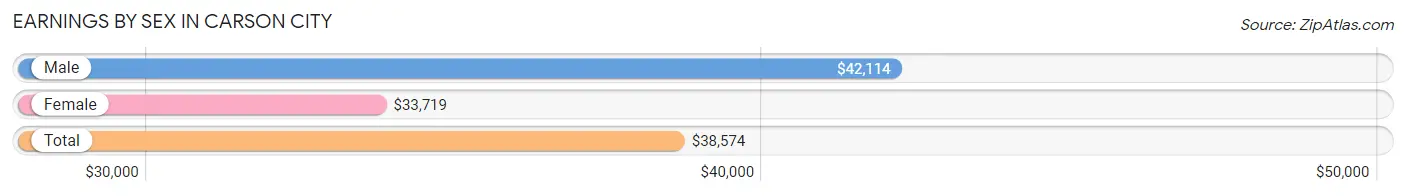
Earnings by Sex in Carson City
Average Earnings in Carson City are $38,574, $42,114 for men and $33,719 for women, a difference of 19.9%.
| Sex | Number | Average Earnings |
| Male | 16,917 (55.1%) | $42,114 |
| Female | 13,803 (44.9%) | $33,719 |
| Total | 30,720 (100.0%) | $38,574 |
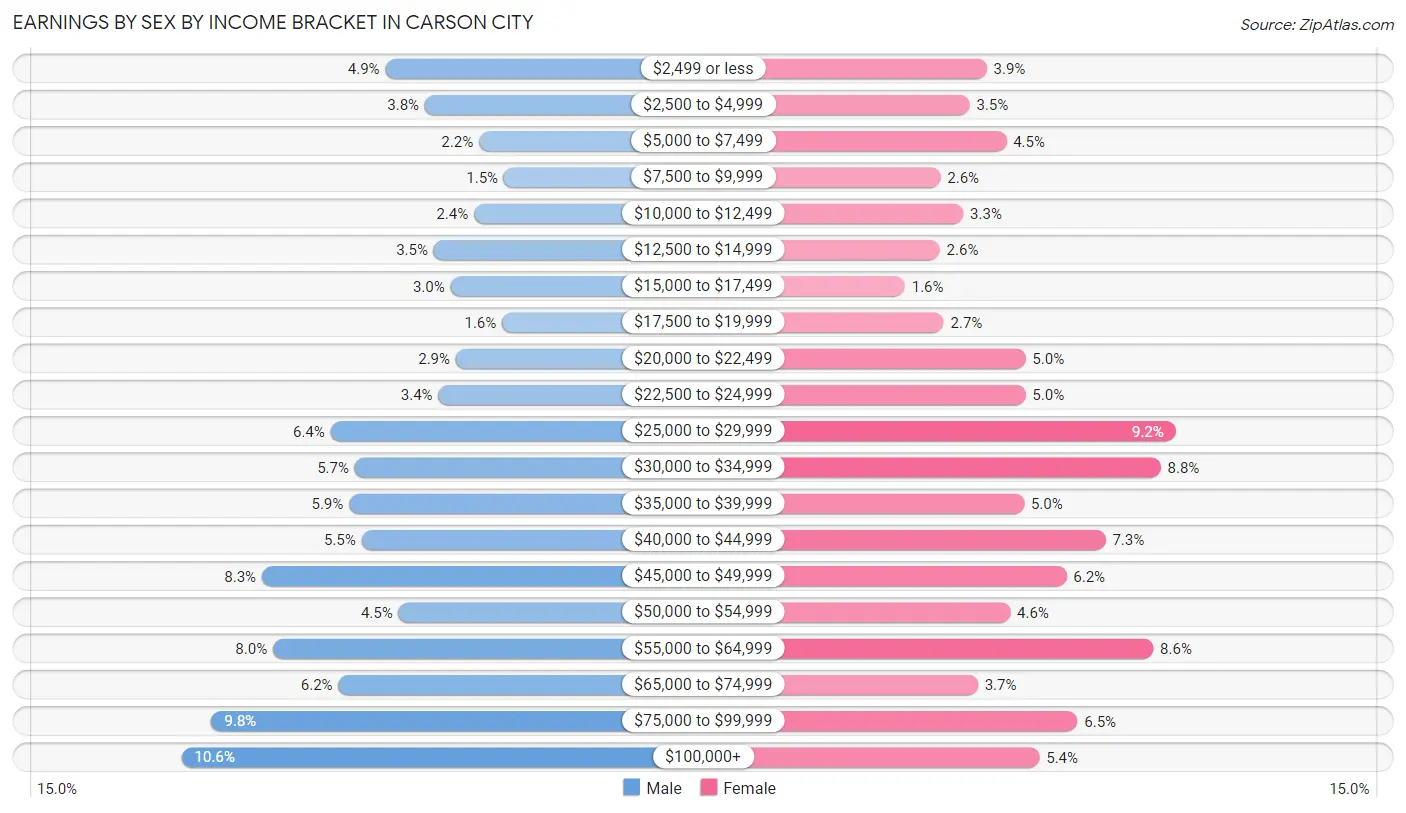
Earnings by Sex by Income Bracket in Carson City
The most common earnings brackets in Carson City are $100,000+ for men (1,792 | 10.6%) and $25,000 to $29,999 for women (1,275 | 9.2%).
| Income | Male | Female |
| $2,499 or less | 822 (4.9%) | 542 (3.9%) |
| $2,500 to $4,999 | 635 (3.7%) | 476 (3.5%) |
| $5,000 to $7,499 | 378 (2.2%) | 619 (4.5%) |
| $7,500 to $9,999 | 258 (1.5%) | 363 (2.6%) |
| $10,000 to $12,499 | 401 (2.4%) | 451 (3.3%) |
| $12,500 to $14,999 | 592 (3.5%) | 360 (2.6%) |
| $15,000 to $17,499 | 513 (3.0%) | 225 (1.6%) |
| $17,500 to $19,999 | 268 (1.6%) | 376 (2.7%) |
| $20,000 to $22,499 | 487 (2.9%) | 693 (5.0%) |
| $22,500 to $24,999 | 570 (3.4%) | 693 (5.0%) |
| $25,000 to $29,999 | 1,083 (6.4%) | 1,275 (9.2%) |
| $30,000 to $34,999 | 967 (5.7%) | 1,217 (8.8%) |
| $35,000 to $39,999 | 995 (5.9%) | 687 (5.0%) |
| $40,000 to $44,999 | 936 (5.5%) | 1,004 (7.3%) |
| $45,000 to $49,999 | 1,410 (8.3%) | 852 (6.2%) |
| $50,000 to $54,999 | 760 (4.5%) | 633 (4.6%) |
| $55,000 to $64,999 | 1,356 (8.0%) | 1,188 (8.6%) |
| $65,000 to $74,999 | 1,045 (6.2%) | 508 (3.7%) |
| $75,000 to $99,999 | 1,649 (9.8%) | 894 (6.5%) |
| $100,000+ | 1,792 (10.6%) | 747 (5.4%) |
| Total | 16,917 (100.0%) | 13,803 (100.0%) |
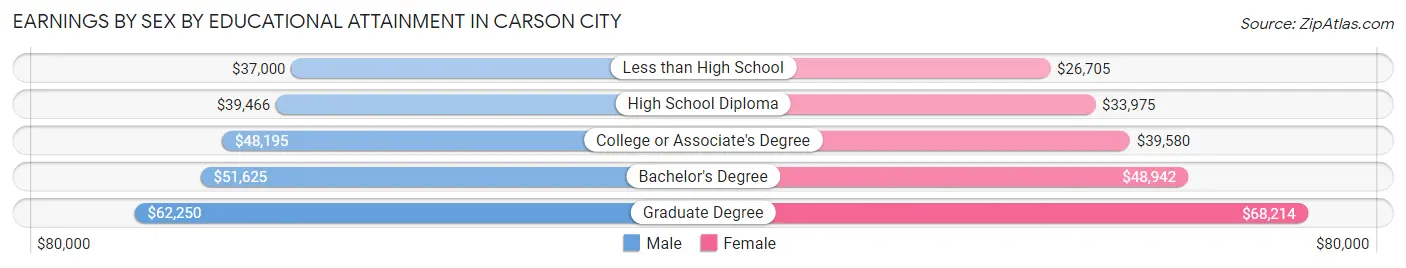
Earnings by Sex by Educational Attainment in Carson City
Average earnings in Carson City are $46,217 for men and $37,853 for women, a difference of 18.1%. Men with an educational attainment of graduate degree enjoy the highest average annual earnings of $62,250, while those with less than high school education earn the least with $37,000. Women with an educational attainment of graduate degree earn the most with the average annual earnings of $68,214, while those with less than high school education have the smallest earnings of $26,705.
| Educational Attainment | Male Income | Female Income |
| Less than High School | $37,000 | $26,705 |
| High School Diploma | $39,466 | $33,975 |
| College or Associate's Degree | $48,195 | $39,580 |
| Bachelor's Degree | $51,625 | $48,942 |
| Graduate Degree | $62,250 | $68,214 |
| Total | $46,217 | $37,853 |
Family Income in Carson City
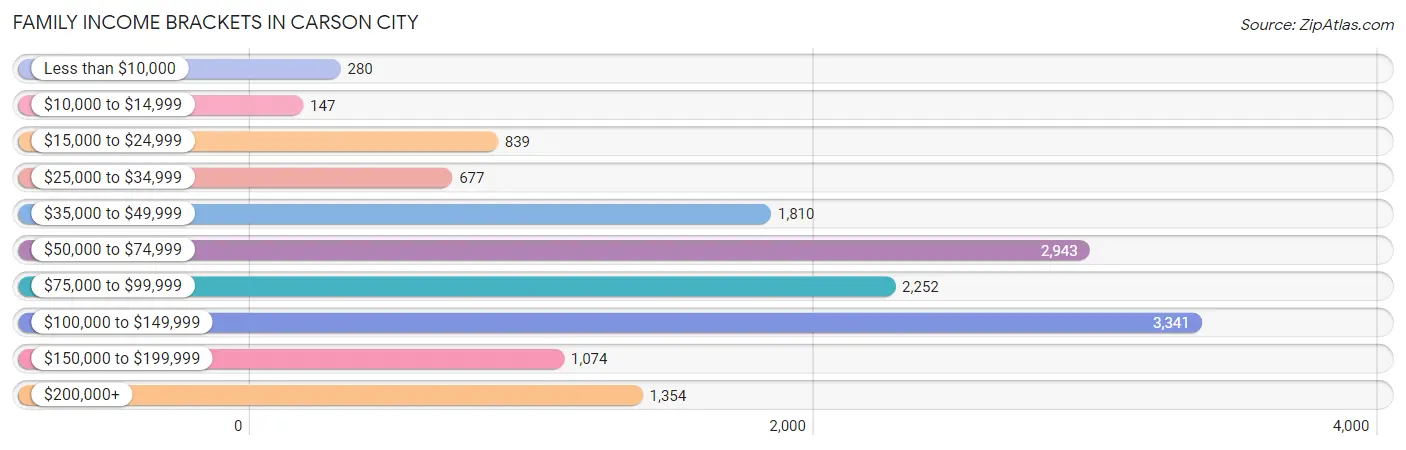
Family Income Brackets in Carson City
According to the Carson City family income data, there are 3,341 families falling into the $100,000 to $149,999 income range, which is the most common income bracket and makes up 22.7% of all families. Conversely, the $10,000 to $14,999 income bracket is the least frequent group with only 147 families (1.0%) belonging to this category.
| Income Bracket | # Families | % Families |
| Less than $10,000 | 280 | 1.9% |
| $10,000 to $14,999 | 147 | 1.0% |
| $15,000 to $24,999 | 839 | 5.7% |
| $25,000 to $34,999 | 677 | 4.6% |
| $35,000 to $49,999 | 1,810 | 12.3% |
| $50,000 to $74,999 | 2,943 | 20.0% |
| $75,000 to $99,999 | 2,252 | 15.3% |
| $100,000 to $149,999 | 3,341 | 22.7% |
| $150,000 to $199,999 | 1,074 | 7.3% |
| $200,000+ | 1,354 | 9.2% |
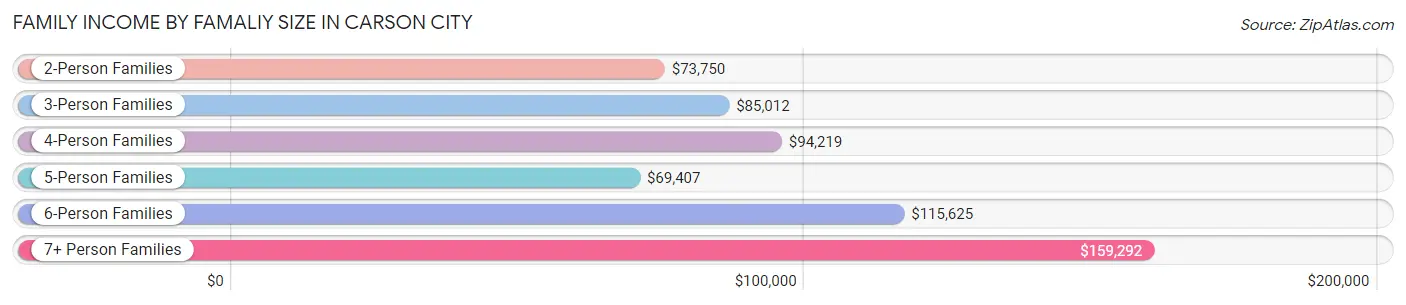
Family Income by Famaliy Size in Carson City
7+ person families (141 | 1.0%) account for the highest median family income in Carson City with $159,292 per family, while 2-person families (7,185 | 48.8%) have the highest median income of $36,875 per family member.
| Income Bracket | # Families | Median Income |
| 2-Person Families | 7,185 (48.8%) | $73,750 |
| 3-Person Families | 3,319 (22.6%) | $85,012 |
| 4-Person Families | 2,435 (16.6%) | $94,219 |
| 5-Person Families | 1,249 (8.5%) | $69,407 |
| 6-Person Families | 388 (2.6%) | $115,625 |
| 7+ Person Families | 141 (1.0%) | $159,292 |
| Total | 14,717 (100.0%) | $82,109 |
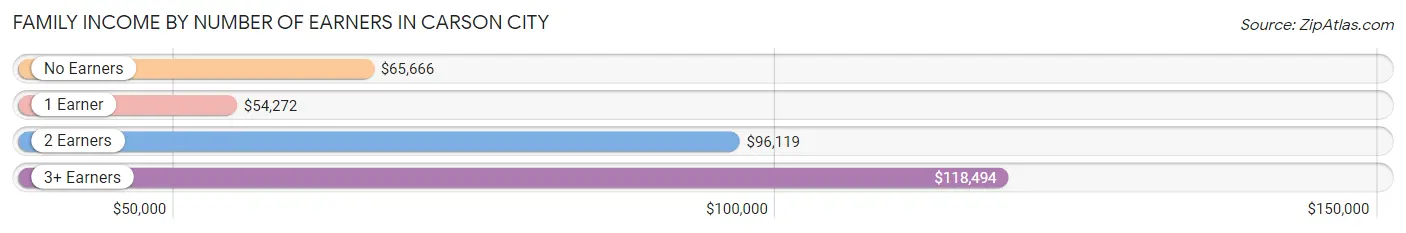
Family Income by Number of Earners in Carson City
The median family income in Carson City is $82,109, with families comprising 3+ earners (1,667) having the highest median family income of $118,494, while families with 1 earner (4,792) have the lowest median family income of $54,272, accounting for 11.3% and 32.6% of families, respectively.
| Number of Earners | # Families | Median Income |
| No Earners | 2,433 (16.5%) | $65,666 |
| 1 Earner | 4,792 (32.6%) | $54,272 |
| 2 Earners | 5,825 (39.6%) | $96,119 |
| 3+ Earners | 1,667 (11.3%) | $118,494 |
| Total | 14,717 (100.0%) | $82,109 |
Household Income in Carson City
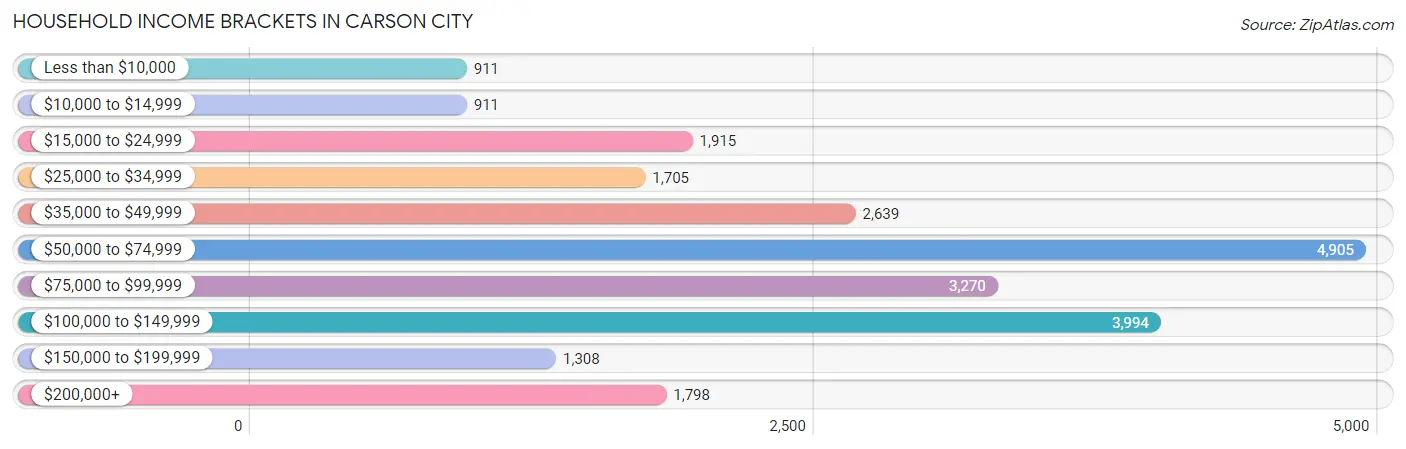
Household Income Brackets in Carson City
With 4,905 households falling in the category, the $50,000 to $74,999 income range is the most frequent in Carson City, accounting for 21.0% of all households. In contrast, only 911 households (3.9%) fall into the less than $10,000 income bracket, making it the least populous group.
| Income Bracket | # Households | % Households |
| Less than $10,000 | 911 | 3.9% |
| $10,000 to $14,999 | 911 | 3.9% |
| $15,000 to $24,999 | 1,915 | 8.2% |
| $25,000 to $34,999 | 1,705 | 7.3% |
| $35,000 to $49,999 | 2,639 | 11.3% |
| $50,000 to $74,999 | 4,905 | 21.0% |
| $75,000 to $99,999 | 3,270 | 14.0% |
| $100,000 to $149,999 | 3,994 | 17.1% |
| $150,000 to $199,999 | 1,308 | 5.6% |
| $200,000+ | 1,798 | 7.7% |
Household Income by Householder Age in Carson City
The median household income in Carson City is $67,465, with the highest median household income of $81,702 found in the 45 to 64 years age bracket for the primary householder. A total of 8,328 households (35.7%) fall into this category. Meanwhile, the 65+ years age bracket for the primary householder has the lowest median household income of $52,689, with 7,868 households (33.7%) in this group.
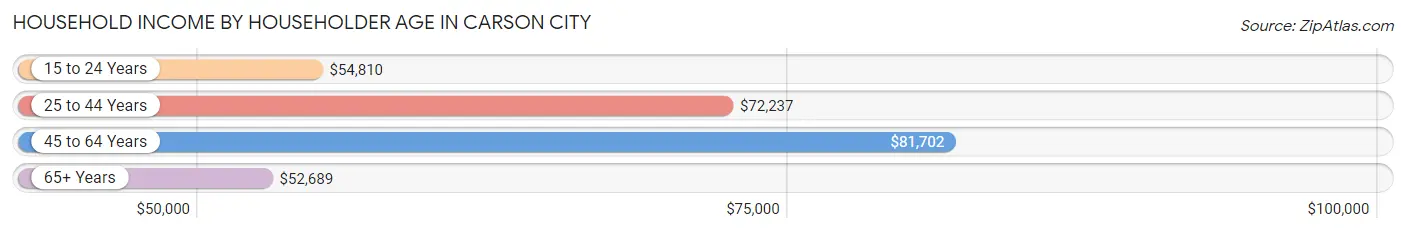
| Income Bracket | # Households | Median Income |
| 15 to 24 Years | 825 (3.5%) | $54,810 |
| 25 to 44 Years | 6,334 (27.1%) | $72,237 |
| 45 to 64 Years | 8,328 (35.7%) | $81,702 |
| 65+ Years | 7,868 (33.7%) | $52,689 |
| Total | 23,355 (100.0%) | $67,465 |
Poverty in Carson City
Income Below Poverty by Sex and Age in Carson City
With 9.3% poverty level for males and 13.0% for females among the residents of Carson City, 5 year old males and 16 and 17 year old females are the most vulnerable to poverty, with 134 males (49.6%) and 224 females (30.1%) in their respective age groups living below the poverty level.
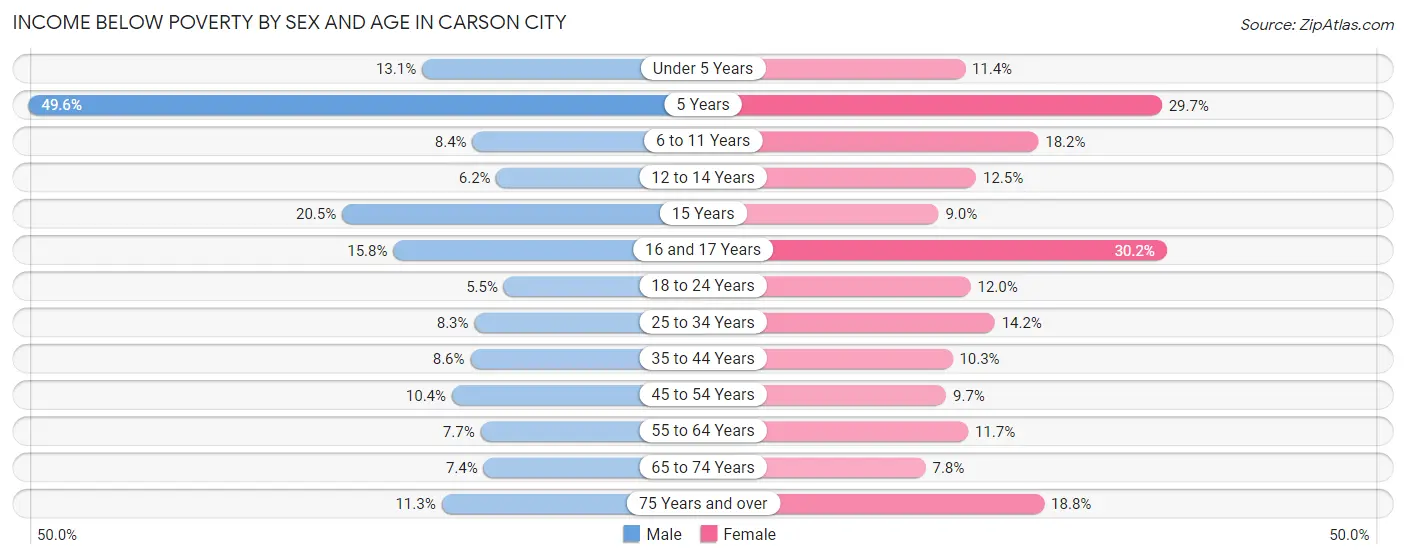
| Age Bracket | Male | Female |
| Under 5 Years | 196 (13.1%) | 168 (11.4%) |
| 5 Years | 134 (49.6%) | 133 (29.7%) |
| 6 to 11 Years | 153 (8.4%) | 349 (18.2%) |
| 12 to 14 Years | 72 (6.2%) | 107 (12.5%) |
| 15 Years | 91 (20.5%) | 21 (9.0%) |
| 16 and 17 Years | 95 (15.8%) | 224 (30.1%) |
| 18 to 24 Years | 128 (5.5%) | 245 (11.9%) |
| 25 to 34 Years | 311 (8.3%) | 475 (14.2%) |
| 35 to 44 Years | 293 (8.6%) | 318 (10.3%) |
| 45 to 54 Years | 372 (10.3%) | 305 (9.7%) |
| 55 to 64 Years | 301 (7.7%) | 476 (11.7%) |
| 65 to 74 Years | 230 (7.4%) | 280 (7.8%) |
| 75 Years and over | 232 (11.3%) | 504 (18.8%) |
| Total | 2,608 (9.3%) | 3,605 (13.0%) |
Income Above Poverty by Sex and Age in Carson City
According to the poverty statistics in Carson City, males aged 18 to 24 years and females aged 65 to 74 years are the age groups that are most secure financially, with 94.5% of males and 92.2% of females in these age groups living above the poverty line.
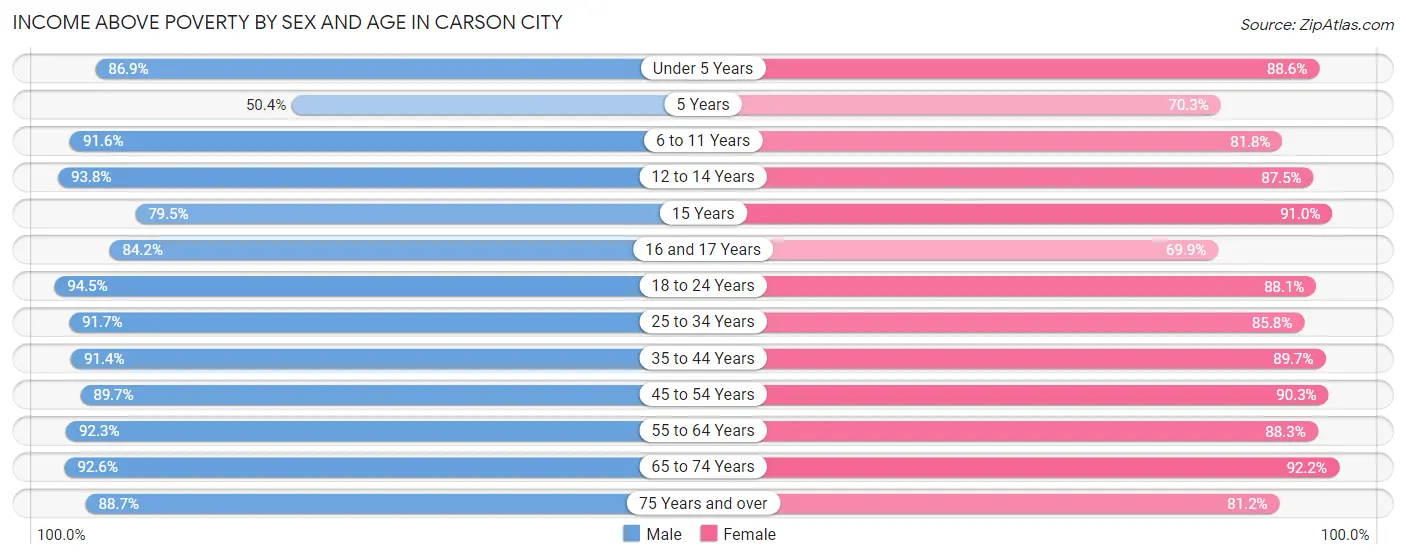
| Age Bracket | Male | Female |
| Under 5 Years | 1,298 (86.9%) | 1,302 (88.6%) |
| 5 Years | 136 (50.4%) | 315 (70.3%) |
| 6 to 11 Years | 1,660 (91.6%) | 1,564 (81.8%) |
| 12 to 14 Years | 1,088 (93.8%) | 752 (87.5%) |
| 15 Years | 352 (79.5%) | 213 (91.0%) |
| 16 and 17 Years | 507 (84.2%) | 519 (69.9%) |
| 18 to 24 Years | 2,185 (94.5%) | 1,805 (88.0%) |
| 25 to 34 Years | 3,456 (91.7%) | 2,873 (85.8%) |
| 35 to 44 Years | 3,102 (91.4%) | 2,779 (89.7%) |
| 45 to 54 Years | 3,222 (89.6%) | 2,846 (90.3%) |
| 55 to 64 Years | 3,614 (92.3%) | 3,588 (88.3%) |
| 65 to 74 Years | 2,875 (92.6%) | 3,322 (92.2%) |
| 75 Years and over | 1,820 (88.7%) | 2,180 (81.2%) |
| Total | 25,315 (90.7%) | 24,058 (87.0%) |
Income Below Poverty Among Married-Couple Families in Carson City
The poverty statistics for married-couple families in Carson City show that 4.6% or 463 of the total 10,115 families live below the poverty line. Families with 3 or 4 children have the highest poverty rate of 16.7%, comprising of 102 families. On the other hand, families with 5 or more children have the lowest poverty rate of 0.0%, which includes 0 families.
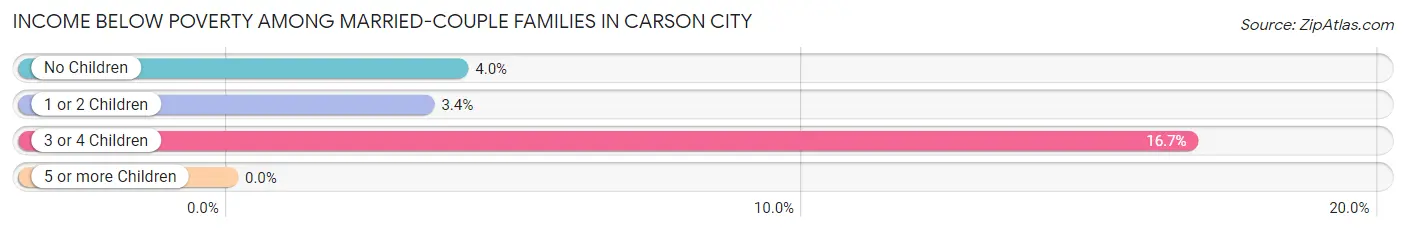
| Children | Above Poverty | Below Poverty |
| No Children | 6,135 (96.0%) | 256 (4.0%) |
| 1 or 2 Children | 2,964 (96.6%) | 105 (3.4%) |
| 3 or 4 Children | 508 (83.3%) | 102 (16.7%) |
| 5 or more Children | 45 (100.0%) | 0 (0.0%) |
| Total | 9,652 (95.4%) | 463 (4.6%) |
Income Below Poverty Among Single-Parent Households in Carson City
According to the poverty data in Carson City, 7.8% or 132 single-father households and 20.6% or 601 single-mother households are living below the poverty line. Among single-father households, those with 3 or 4 children have the highest poverty rate, with 59 households (89.4%) experiencing poverty. Likewise, among single-mother households, those with 5 or more children have the highest poverty rate, with 18 households (100.0%) falling below the poverty line.
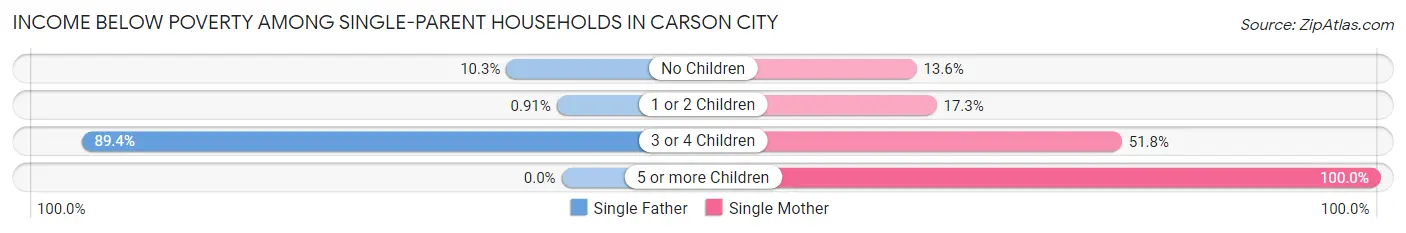
| Children | Single Father | Single Mother |
| No Children | 64 (10.3%) | 153 (13.6%) |
| 1 or 2 Children | 9 (0.9%) | 243 (17.3%) |
| 3 or 4 Children | 59 (89.4%) | 187 (51.8%) |
| 5 or more Children | 0 (0.0%) | 18 (100.0%) |
| Total | 132 (7.8%) | 601 (20.6%) |
Income Below Poverty Among Married-Couple vs Single-Parent Households in Carson City
The poverty data for Carson City shows that 463 of the married-couple family households (4.6%) and 733 of the single-parent households (15.9%) are living below the poverty level. Within the married-couple family households, those with 3 or 4 children have the highest poverty rate, with 102 households (16.7%) falling below the poverty line. Among the single-parent households, those with 5 or more children have the highest poverty rate, with 18 household (66.7%) living below poverty.
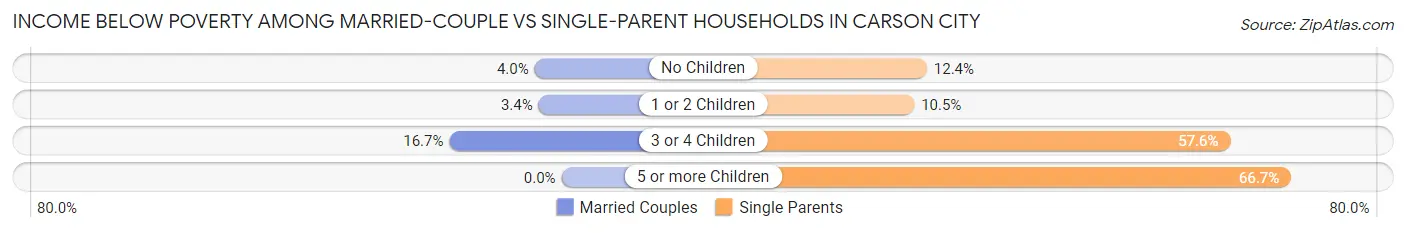
| Children | Married-Couple Families | Single-Parent Households |
| No Children | 256 (4.0%) | 217 (12.4%) |
| 1 or 2 Children | 105 (3.4%) | 252 (10.5%) |
| 3 or 4 Children | 102 (16.7%) | 246 (57.6%) |
| 5 or more Children | 0 (0.0%) | 18 (66.7%) |
| Total | 463 (4.6%) | 733 (15.9%) |
Race in Carson City
The most populous races in Carson City are White / Caucasian (43,436 | 74.6%), Hispanic or Latino (14,576 | 25.0%), and Two or more Races (6,093 | 10.5%).
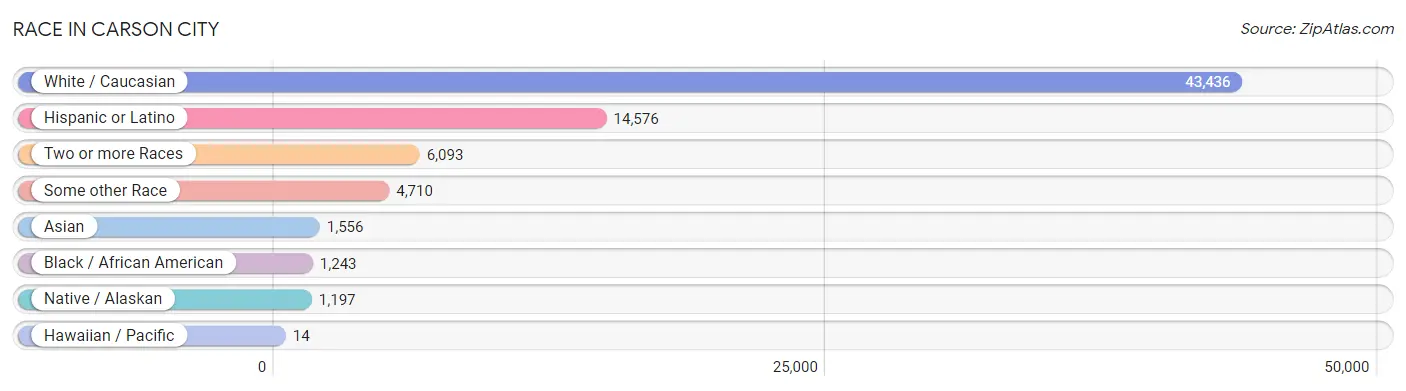
| Race | # Population | % Population |
| Asian | 1,556 | 2.7% |
| Black / African American | 1,243 | 2.1% |
| Hawaiian / Pacific | 14 | 0.0% |
| Hispanic or Latino | 14,576 | 25.0% |
| Native / Alaskan | 1,197 | 2.1% |
| White / Caucasian | 43,436 | 74.6% |
| Two or more Races | 6,093 | 10.5% |
| Some other Race | 4,710 | 8.1% |
| Total | 58,249 | 100.0% |
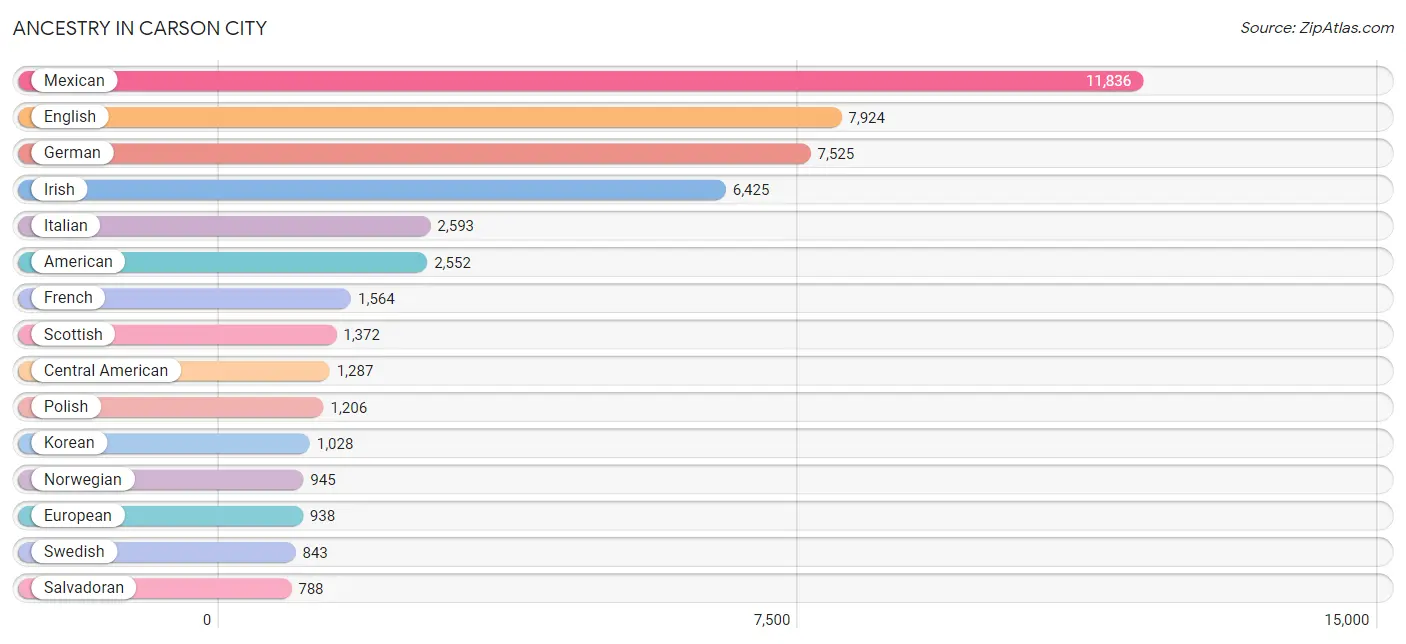
Ancestry in Carson City
The most populous ancestries reported in Carson City are Mexican (11,836 | 20.3%), English (7,924 | 13.6%), German (7,525 | 12.9%), Irish (6,425 | 11.0%), and Italian (2,593 | 4.4%), together accounting for 62.3% of all Carson City residents.
| Ancestry | # Population | % Population |
| African | 437 | 0.7% |
| Alaska Native | 13 | 0.0% |
| American | 2,552 | 4.4% |
| Apache | 93 | 0.2% |
| Arab | 109 | 0.2% |
| Armenian | 29 | 0.1% |
| Assyrian / Chaldean / Syriac | 9 | 0.0% |
| Austrian | 184 | 0.3% |
| Bangladeshi | 4 | 0.0% |
| Basque | 198 | 0.3% |
| Belgian | 28 | 0.1% |
| Bhutanese | 131 | 0.2% |
| Blackfeet | 79 | 0.1% |
| Bolivian | 7 | 0.0% |
| Brazilian | 50 | 0.1% |
| British | 259 | 0.4% |
| Burmese | 101 | 0.2% |
| Canadian | 42 | 0.1% |
| Central American | 1,287 | 2.2% |
| Cherokee | 285 | 0.5% |
| Chilean | 32 | 0.1% |
| Chippewa | 10 | 0.0% |
| Choctaw | 64 | 0.1% |
| Colombian | 132 | 0.2% |
| Cree | 14 | 0.0% |
| Creek | 6 | 0.0% |
| Croatian | 92 | 0.2% |
| Cuban | 116 | 0.2% |
| Czech | 424 | 0.7% |
| Czechoslovakian | 73 | 0.1% |
| Danish | 414 | 0.7% |
| Dutch | 623 | 1.1% |
| Eastern European | 125 | 0.2% |
| Egyptian | 13 | 0.0% |
| English | 7,924 | 13.6% |
| Ethiopian | 3 | 0.0% |
| European | 938 | 1.6% |
| Filipino | 13 | 0.0% |
| Finnish | 190 | 0.3% |
| French | 1,564 | 2.7% |
| French American Indian | 2 | 0.0% |
| French Canadian | 181 | 0.3% |
| German | 7,525 | 12.9% |
| Greek | 165 | 0.3% |
| Guatemalan | 152 | 0.3% |
| Honduran | 207 | 0.4% |
| Hopi | 8 | 0.0% |
| Hungarian | 128 | 0.2% |
| Icelander | 15 | 0.0% |
| Indian (Asian) | 173 | 0.3% |
| Iraqi | 6 | 0.0% |
| Irish | 6,425 | 11.0% |
| Iroquois | 27 | 0.1% |
| Italian | 2,593 | 4.4% |
| Jamaican | 4 | 0.0% |
| Kenyan | 8 | 0.0% |
| Kiowa | 5 | 0.0% |
| Korean | 1,028 | 1.8% |
| Laotian | 167 | 0.3% |
| Latvian | 31 | 0.1% |
| Lebanese | 47 | 0.1% |
| Lithuanian | 21 | 0.0% |
| Luxembourger | 6 | 0.0% |
| Mexican | 11,836 | 20.3% |
| Mexican American Indian | 167 | 0.3% |
| Native Hawaiian | 47 | 0.1% |
| Navajo | 135 | 0.2% |
| New Zealander | 8 | 0.0% |
| Nicaraguan | 114 | 0.2% |
| Northern European | 75 | 0.1% |
| Norwegian | 945 | 1.6% |
| Osage | 32 | 0.1% |
| Paiute | 182 | 0.3% |
| Panamanian | 26 | 0.0% |
| Paraguayan | 9 | 0.0% |
| Pennsylvania German | 22 | 0.0% |
| Polish | 1,206 | 2.1% |
| Portuguese | 580 | 1.0% |
| Potawatomi | 3 | 0.0% |
| Puerto Rican | 121 | 0.2% |
| Romanian | 40 | 0.1% |
| Russian | 486 | 0.8% |
| Salvadoran | 788 | 1.3% |
| Scandinavian | 270 | 0.5% |
| Scotch-Irish | 485 | 0.8% |
| Scottish | 1,372 | 2.4% |
| Shoshone | 70 | 0.1% |
| Sioux | 37 | 0.1% |
| Slavic | 75 | 0.1% |
| Slovak | 13 | 0.0% |
| South American | 188 | 0.3% |
| South American Indian | 7 | 0.0% |
| Spaniard | 197 | 0.3% |
| Spanish | 505 | 0.9% |
| Spanish American | 74 | 0.1% |
| Sri Lankan | 483 | 0.8% |
| Subsaharan African | 482 | 0.8% |
| Sudanese | 16 | 0.0% |
| Swedish | 843 | 1.5% |
| Swiss | 297 | 0.5% |
| Syrian | 5 | 0.0% |
| Thai | 80 | 0.1% |
| Tongan | 2 | 0.0% |
| Turkish | 11 | 0.0% |
| Ukrainian | 200 | 0.3% |
| Venezuelan | 8 | 0.0% |
| Welsh | 395 | 0.7% |
| West Indian | 54 | 0.1% |
| Yugoslavian | 44 | 0.1% |
| Yuman | 1 | 0.0% | View All 110 Rows |
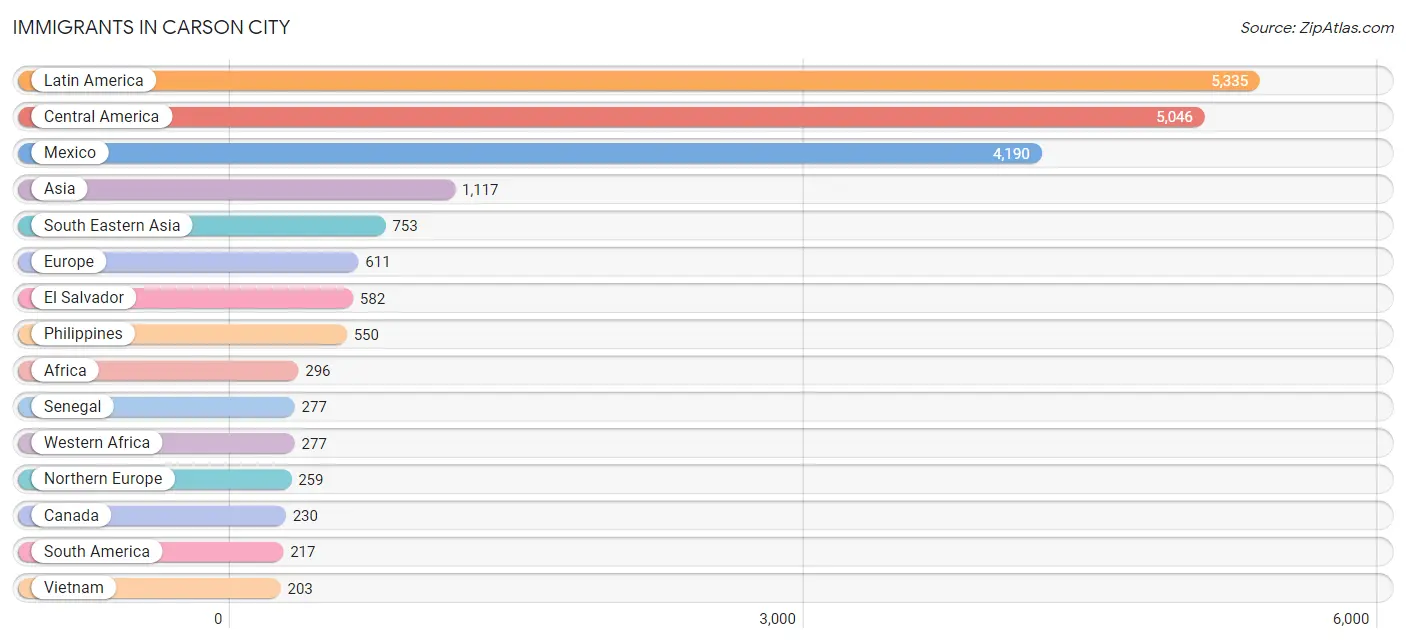
Immigrants in Carson City
The most numerous immigrant groups reported in Carson City came from Latin America (5,335 | 9.2%), Central America (5,046 | 8.7%), Mexico (4,190 | 7.2%), Asia (1,117 | 1.9%), and South Eastern Asia (753 | 1.3%), together accounting for 28.2% of all Carson City residents.
| Immigration Origin | # Population | % Population |
| Africa | 296 | 0.5% |
| Asia | 1,117 | 1.9% |
| Australia | 7 | 0.0% |
| Bolivia | 7 | 0.0% |
| Brazil | 66 | 0.1% |
| Canada | 230 | 0.4% |
| Caribbean | 72 | 0.1% |
| Central America | 5,046 | 8.7% |
| Chile | 16 | 0.0% |
| China | 97 | 0.2% |
| Colombia | 111 | 0.2% |
| Cuba | 72 | 0.1% |
| Czechoslovakia | 32 | 0.1% |
| Eastern Africa | 3 | 0.0% |
| Eastern Asia | 190 | 0.3% |
| Eastern Europe | 196 | 0.3% |
| El Salvador | 582 | 1.0% |
| England | 192 | 0.3% |
| Ethiopia | 3 | 0.0% |
| Europe | 611 | 1.1% |
| France | 36 | 0.1% |
| Germany | 83 | 0.1% |
| Guatemala | 88 | 0.2% |
| Honduras | 101 | 0.2% |
| Hungary | 19 | 0.0% |
| India | 28 | 0.1% |
| Iran | 9 | 0.0% |
| Iraq | 22 | 0.0% |
| Italy | 20 | 0.0% |
| Japan | 79 | 0.1% |
| Kazakhstan | 8 | 0.0% |
| Korea | 14 | 0.0% |
| Latin America | 5,335 | 9.2% |
| Latvia | 8 | 0.0% |
| Lebanon | 21 | 0.0% |
| Mexico | 4,190 | 7.2% |
| Netherlands | 8 | 0.0% |
| Nicaragua | 85 | 0.2% |
| Northern Africa | 16 | 0.0% |
| Northern Europe | 259 | 0.4% |
| Oceania | 19 | 0.0% |
| Pakistan | 86 | 0.2% |
| Philippines | 550 | 0.9% |
| Poland | 137 | 0.2% |
| Portugal | 6 | 0.0% |
| Senegal | 277 | 0.5% |
| South America | 217 | 0.4% |
| South Central Asia | 131 | 0.2% |
| South Eastern Asia | 753 | 1.3% |
| Southern Europe | 29 | 0.1% |
| Spain | 3 | 0.0% |
| Sudan | 16 | 0.0% |
| Sweden | 9 | 0.0% |
| Taiwan | 27 | 0.1% |
| Venezuela | 8 | 0.0% |
| Vietnam | 203 | 0.4% |
| Western Africa | 277 | 0.5% |
| Western Asia | 43 | 0.1% |
| Western Europe | 127 | 0.2% | View All 59 Rows |
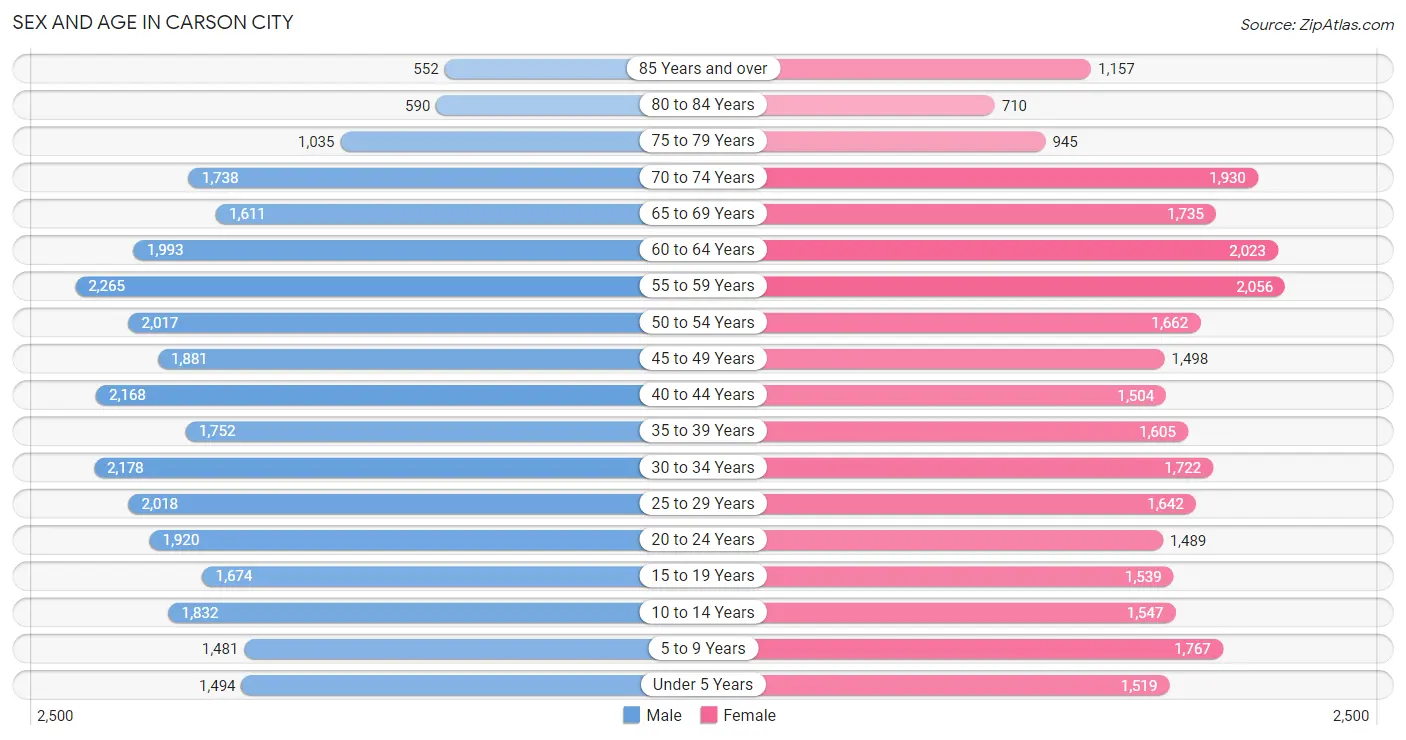
Sex and Age in Carson City
Sex and Age in Carson City
The most populous age groups in Carson City are 55 to 59 Years (2,265 | 7.5%) for men and 55 to 59 Years (2,056 | 7.3%) for women.
| Age Bracket | Male | Female |
| Under 5 Years | 1,494 (5.0%) | 1,519 (5.4%) |
| 5 to 9 Years | 1,481 (4.9%) | 1,767 (6.3%) |
| 10 to 14 Years | 1,832 (6.1%) | 1,547 (5.5%) |
| 15 to 19 Years | 1,674 (5.5%) | 1,539 (5.5%) |
| 20 to 24 Years | 1,920 (6.4%) | 1,489 (5.3%) |
| 25 to 29 Years | 2,018 (6.7%) | 1,642 (5.9%) |
| 30 to 34 Years | 2,178 (7.2%) | 1,722 (6.1%) |
| 35 to 39 Years | 1,752 (5.8%) | 1,605 (5.7%) |
| 40 to 44 Years | 2,168 (7.2%) | 1,504 (5.4%) |
| 45 to 49 Years | 1,881 (6.2%) | 1,498 (5.3%) |
| 50 to 54 Years | 2,017 (6.7%) | 1,662 (5.9%) |
| 55 to 59 Years | 2,265 (7.5%) | 2,056 (7.3%) |
| 60 to 64 Years | 1,993 (6.6%) | 2,023 (7.2%) |
| 65 to 69 Years | 1,611 (5.3%) | 1,735 (6.2%) |
| 70 to 74 Years | 1,738 (5.8%) | 1,930 (6.9%) |
| 75 to 79 Years | 1,035 (3.4%) | 945 (3.4%) |
| 80 to 84 Years | 590 (1.9%) | 710 (2.5%) |
| 85 Years and over | 552 (1.8%) | 1,157 (4.1%) |
| Total | 30,199 (100.0%) | 28,050 (100.0%) |
Families and Households in Carson City
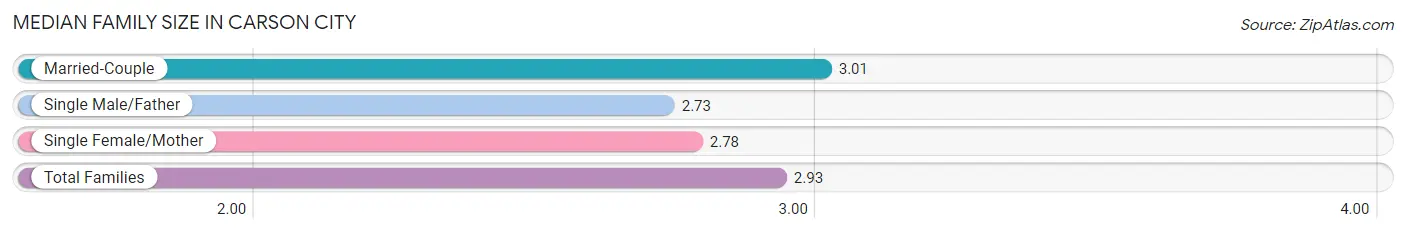
Median Family Size in Carson City
The median family size in Carson City is 2.93 persons per family, with married-couple families (10,115 | 68.7%) accounting for the largest median family size of 3.01 persons per family. On the other hand, single male/father families (1,690 | 11.5%) represent the smallest median family size with 2.73 persons per family.
| Family Type | # Families | Family Size |
| Married-Couple | 10,115 (68.7%) | 3.01 |
| Single Male/Father | 1,690 (11.5%) | 2.73 |
| Single Female/Mother | 2,912 (19.8%) | 2.78 |
| Total Families | 14,717 (100.0%) | 2.93 |
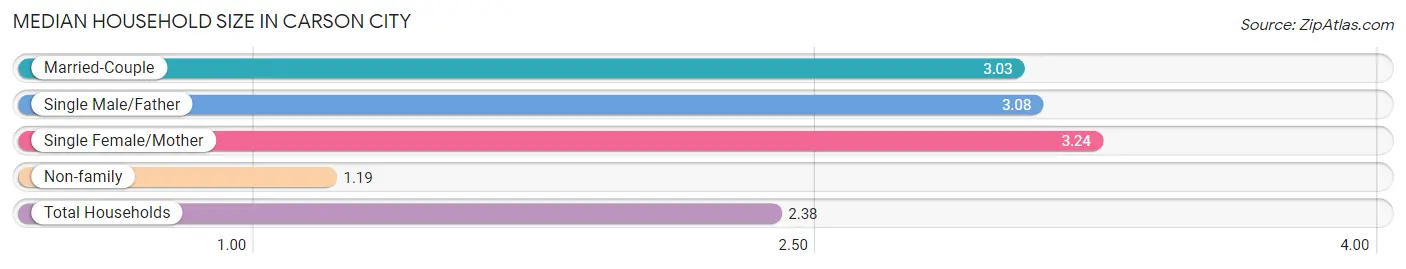
Median Household Size in Carson City
The median household size in Carson City is 2.38 persons per household, with single female/mother households (2,912 | 12.5%) accounting for the largest median household size of 3.24 persons per household. non-family households (8,638 | 37.0%) represent the smallest median household size with 1.19 persons per household.
| Household Type | # Households | Household Size |
| Married-Couple | 10,115 (43.3%) | 3.03 |
| Single Male/Father | 1,690 (7.2%) | 3.08 |
| Single Female/Mother | 2,912 (12.5%) | 3.24 |
| Non-family | 8,638 (37.0%) | 1.19 |
| Total Households | 23,355 (100.0%) | 2.38 |
Household Size by Marriage Status in Carson City
Out of a total of 23,355 households in Carson City, 14,717 (63.0%) are family households, while 8,638 (37.0%) are nonfamily households. The most numerous type of family households are 2-person households, comprising 6,332, and the most common type of nonfamily households are 1-person households, comprising 7,228.
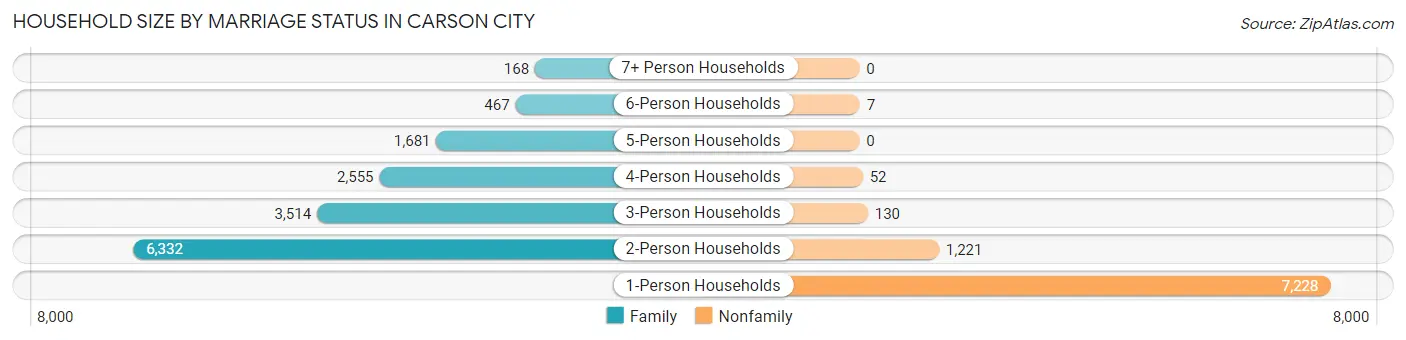
| Household Size | Family Households | Nonfamily Households |
| 1-Person Households | - | 7,228 (30.9%) |
| 2-Person Households | 6,332 (27.1%) | 1,221 (5.2%) |
| 3-Person Households | 3,514 (15.0%) | 130 (0.6%) |
| 4-Person Households | 2,555 (10.9%) | 52 (0.2%) |
| 5-Person Households | 1,681 (7.2%) | 0 (0.0%) |
| 6-Person Households | 467 (2.0%) | 7 (0.0%) |
| 7+ Person Households | 168 (0.7%) | 0 (0.0%) |
| Total | 14,717 (63.0%) | 8,638 (37.0%) |
Female Fertility in Carson City
Fertility by Age in Carson City
Average fertility rate in Carson City is 69.0 births per 1,000 women. Women in the age bracket of 20 to 34 years have the highest fertility rate with 100.0 births per 1,000 women. Women in the age bracket of 20 to 34 years acount for 61.6% of all women with births.
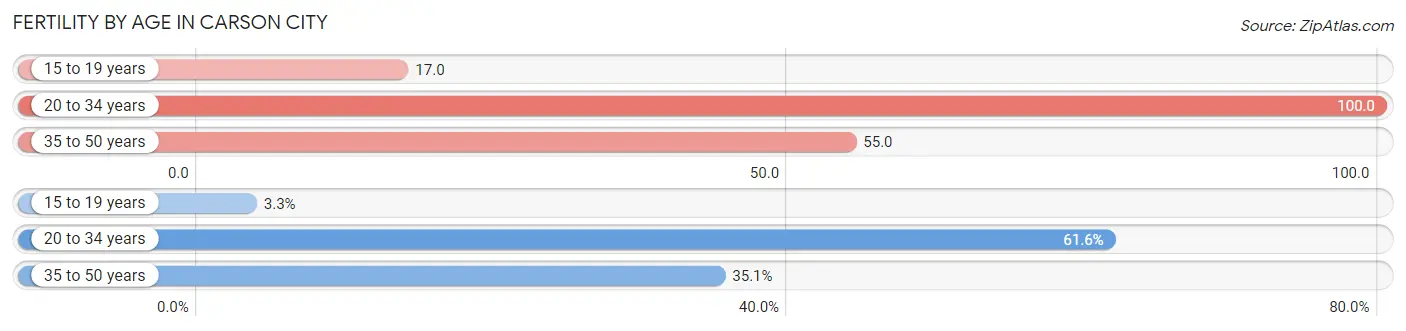
| Age Bracket | Women with Births | Births / 1,000 Women |
| 15 to 19 years | 26 (3.3%) | 17.0 |
| 20 to 34 years | 484 (61.6%) | 100.0 |
| 35 to 50 years | 276 (35.1%) | 55.0 |
| Total | 786 (100.0%) | 69.0 |
Fertility by Age by Marriage Status in Carson City
83.7% of women with births (786) in Carson City are married. The highest percentage of unmarried women with births falls into 15 to 19 years age bracket with 100.0% of them unmarried at the time of birth, while the lowest percentage of unmarried women with births belong to 35 to 50 years age bracket with 0.0% of them unmarried.
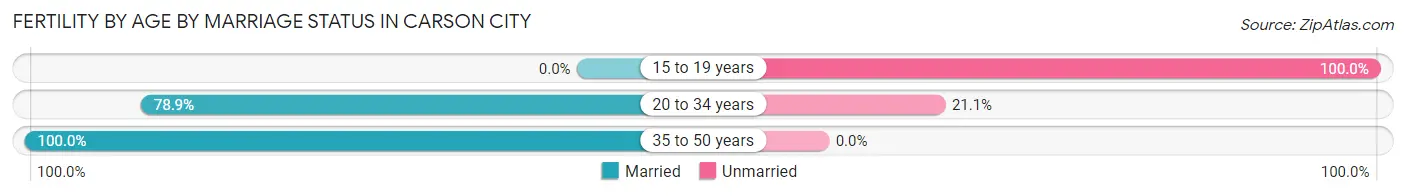
| Age Bracket | Married | Unmarried |
| 15 to 19 years | 0 (0.0%) | 26 (100.0%) |
| 20 to 34 years | 382 (78.9%) | 102 (21.1%) |
| 35 to 50 years | 276 (100.0%) | 0 (0.0%) |
| Total | 658 (83.7%) | 128 (16.3%) |
Fertility by Education in Carson City
Average fertility rate in Carson City is 69.0 births per 1,000 women. Women with the education attainment of bachelor's degree have the highest fertility rate of 111.0 births per 1,000 women, while women with the education attainment of high school diploma have the lowest fertility at 41.0 births per 1,000 women. Women with the education attainment of bachelor's degree represent 26.3% of all women with births.
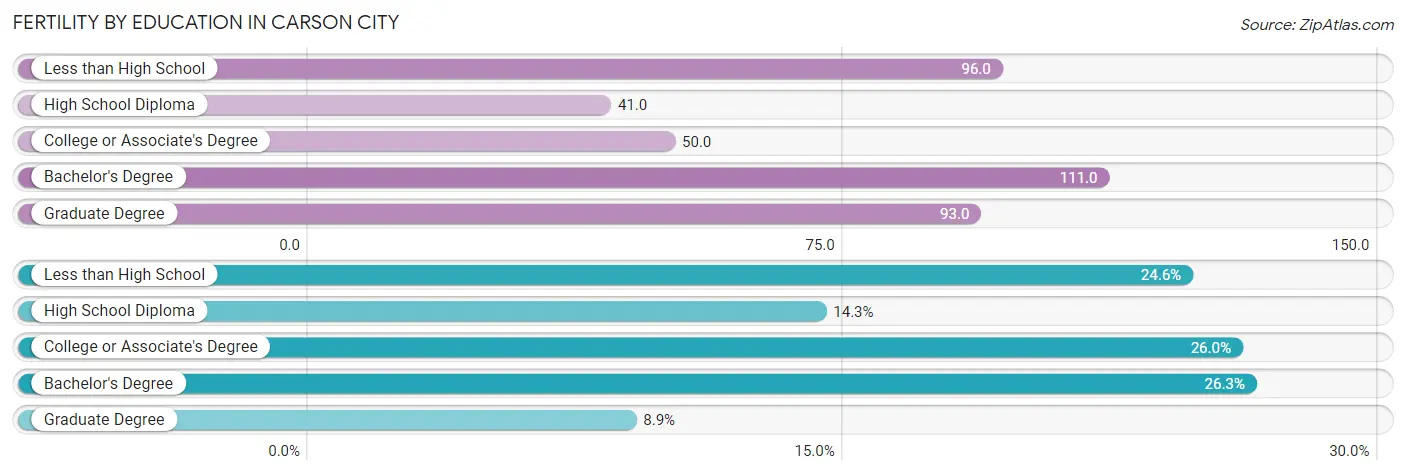
| Educational Attainment | Women with Births | Births / 1,000 Women |
| Less than High School | 193 (24.5%) | 96.0 |
| High School Diploma | 112 (14.2%) | 41.0 |
| College or Associate's Degree | 204 (26.0%) | 50.0 |
| Bachelor's Degree | 207 (26.3%) | 111.0 |
| Graduate Degree | 70 (8.9%) | 93.0 |
| Total | 786 (100.0%) | 69.0 |
Fertility by Education by Marriage Status in Carson City
16.3% of women with births in Carson City are unmarried. Women with the educational attainment of bachelor's degree are most likely to be married with 100.0% of them married at childbirth, while women with the educational attainment of less than high school are least likely to be married with 29.5% of them unmarried at childbirth.
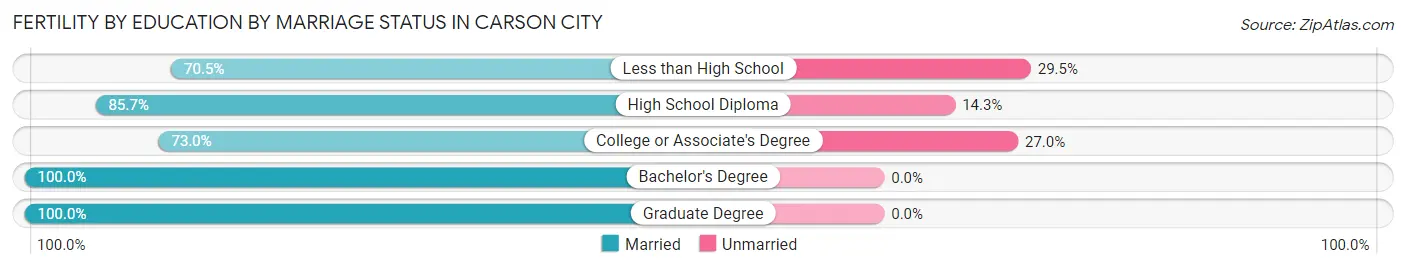
| Educational Attainment | Married | Unmarried |
| Less than High School | 136 (70.5%) | 57 (29.5%) |
| High School Diploma | 96 (85.7%) | 16 (14.3%) |
| College or Associate's Degree | 149 (73.0%) | 55 (27.0%) |
| Bachelor's Degree | 207 (100.0%) | 0 (0.0%) |
| Graduate Degree | 70 (100.0%) | 0 (0.0%) |
| Total | 658 (83.7%) | 128 (16.3%) |
Employment Characteristics in Carson City
Employment by Class of Employer in Carson City
Among the 26,695 employed individuals in Carson City, private company employees (17,115 | 64.1%), state government employees (3,215 | 12.0%), and local government employees (1,978 | 7.4%) make up the most common classes of employment.
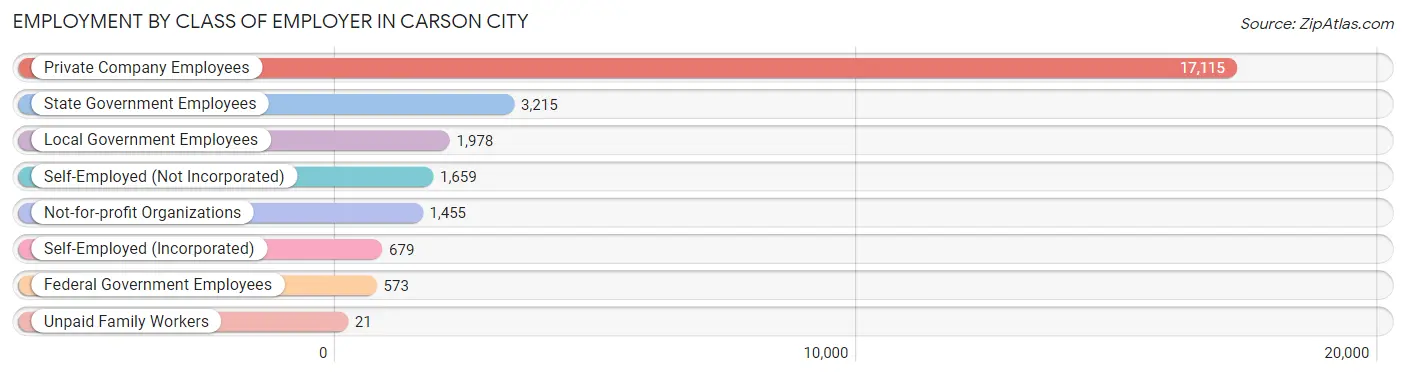
| Employer Class | # Employees | % Employees |
| Private Company Employees | 17,115 | 64.1% |
| Self-Employed (Incorporated) | 679 | 2.5% |
| Self-Employed (Not Incorporated) | 1,659 | 6.2% |
| Not-for-profit Organizations | 1,455 | 5.4% |
| Local Government Employees | 1,978 | 7.4% |
| State Government Employees | 3,215 | 12.0% |
| Federal Government Employees | 573 | 2.1% |
| Unpaid Family Workers | 21 | 0.1% |
| Total | 26,695 | 100.0% |
Employment Status by Age in Carson City
According to the labor force statistics for Carson City, out of the total population over 16 years of age (47,931), 60.0% or 28,759 individuals are in the labor force, with 4.7% or 1,352 of them unemployed. The age group with the highest labor force participation rate is 25 to 29 years, with 85.8% or 3,140 individuals in the labor force. Within the labor force, the 16 to 19 years age range has the highest percentage of unemployed individuals, with 13.0% or 143 of them being unemployed.
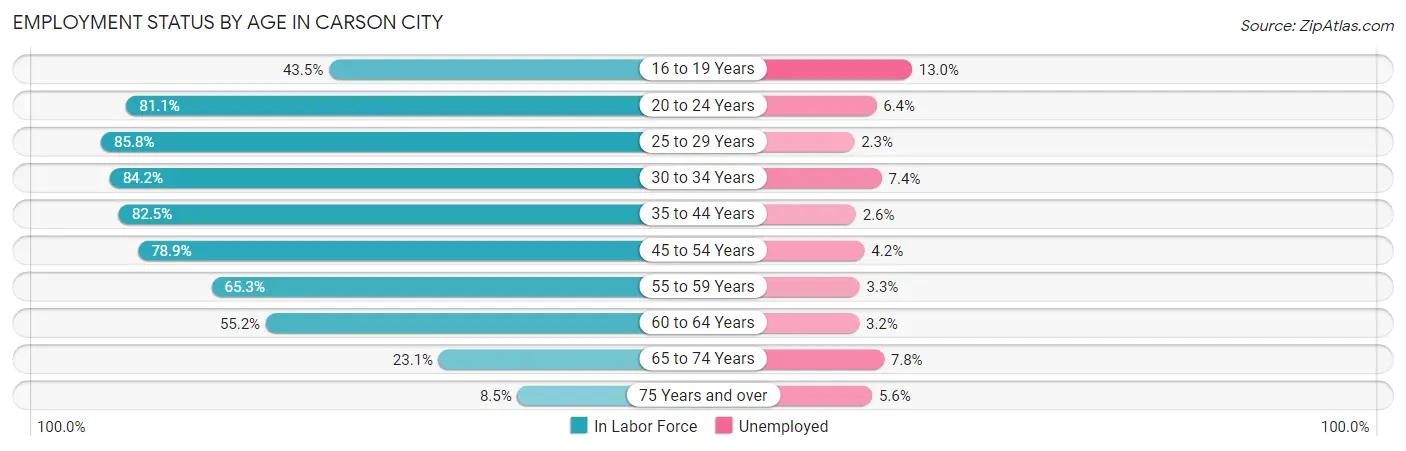
| Age Bracket | In Labor Force | Unemployed |
| 16 to 19 Years | 1,103 (43.5%) | 143 (13.0%) |
| 20 to 24 Years | 2,765 (81.1%) | 177 (6.4%) |
| 25 to 29 Years | 3,140 (85.8%) | 72 (2.3%) |
| 30 to 34 Years | 3,284 (84.2%) | 243 (7.4%) |
| 35 to 44 Years | 5,799 (82.5%) | 151 (2.6%) |
| 45 to 54 Years | 5,569 (78.9%) | 234 (4.2%) |
| 55 to 59 Years | 2,822 (65.3%) | 93 (3.3%) |
| 60 to 64 Years | 2,217 (55.2%) | 71 (3.2%) |
| 65 to 74 Years | 1,620 (23.1%) | 126 (7.8%) |
| 75 Years and over | 424 (8.5%) | 24 (5.6%) |
| Total | 28,759 (60.0%) | 1,352 (4.7%) |
Employment Status by Educational Attainment in Carson City
According to labor force statistics for Carson City, 76.1% of individuals (22,818) out of the total population between 25 and 64 years of age (29,984) are in the labor force, with 3.8% or 867 of them being unemployed. The group with the highest labor force participation rate are those with the educational attainment of bachelor's degree or higher, with 81.2% or 5,769 individuals in the labor force. Within the labor force, individuals with less than high school education have the highest percentage of unemployment, with 8.2% or 215 of them being unemployed.
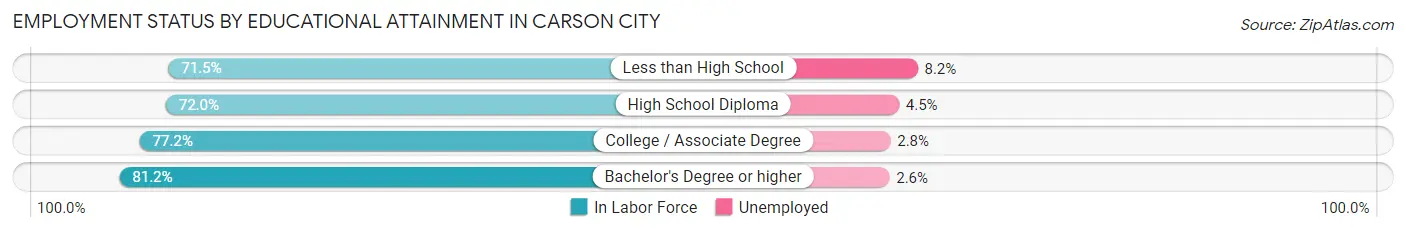
| Educational Attainment | In Labor Force | Unemployed |
| Less than High School | 2,623 (71.5%) | 301 (8.2%) |
| High School Diploma | 5,569 (72.0%) | 348 (4.5%) |
| College / Associate Degree | 8,859 (77.2%) | 321 (2.8%) |
| Bachelor's Degree or higher | 5,769 (81.2%) | 185 (2.6%) |
| Total | 22,818 (76.1%) | 1,139 (3.8%) |
Employment Occupations by Sex in Carson City
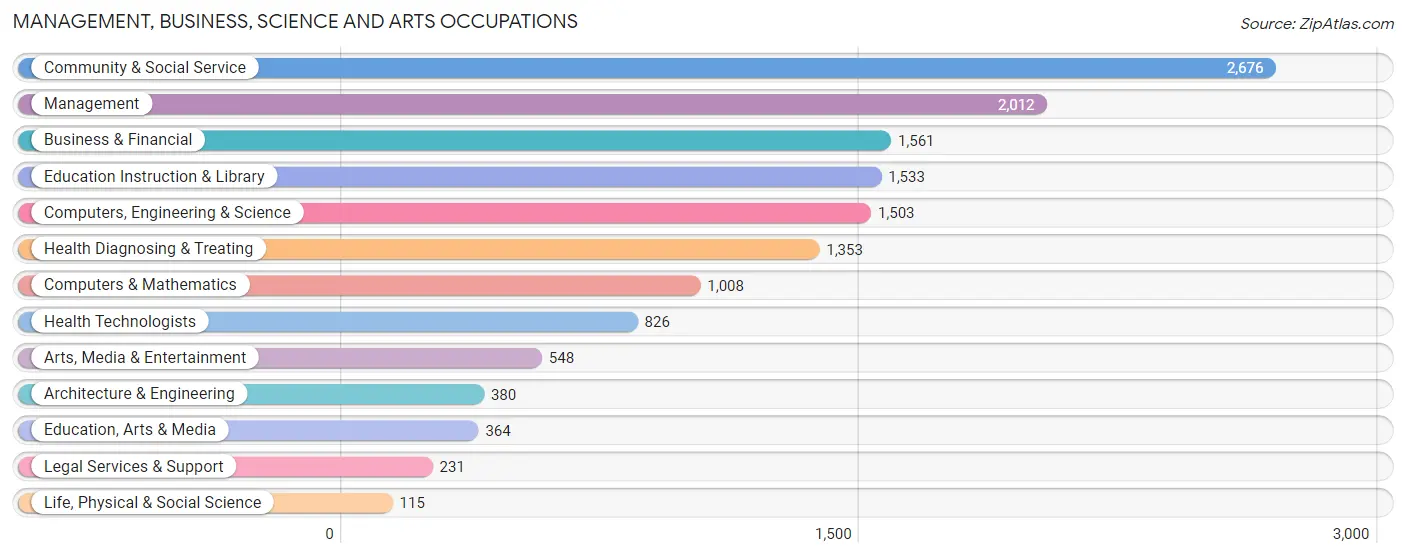
Management, Business, Science and Arts Occupations
The most common Management, Business, Science and Arts occupations in Carson City are Community & Social Service (2,676 | 9.8%), Management (2,012 | 7.4%), Business & Financial (1,561 | 5.7%), Education Instruction & Library (1,533 | 5.6%), and Computers, Engineering & Science (1,503 | 5.5%).
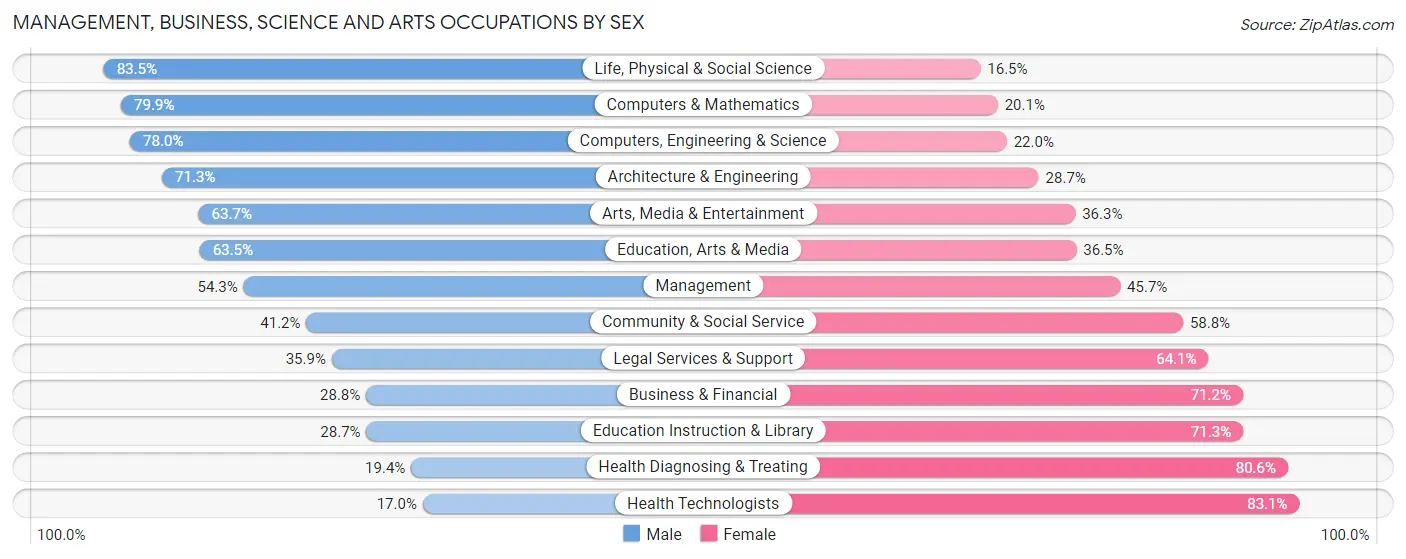
Management, Business, Science and Arts Occupations by Sex
Within the Management, Business, Science and Arts occupations in Carson City, the most male-oriented occupations are Life, Physical & Social Science (83.5%), Computers & Mathematics (79.9%), and Computers, Engineering & Science (78.0%), while the most female-oriented occupations are Health Technologists (83.1%), Health Diagnosing & Treating (80.6%), and Education Instruction & Library (71.3%).
| Occupation | Male | Female |
| Management | 1,093 (54.3%) | 919 (45.7%) |
| Business & Financial | 449 (28.8%) | 1,112 (71.2%) |
| Computers, Engineering & Science | 1,172 (78.0%) | 331 (22.0%) |
| Computers & Mathematics | 805 (79.9%) | 203 (20.1%) |
| Architecture & Engineering | 271 (71.3%) | 109 (28.7%) |
| Life, Physical & Social Science | 96 (83.5%) | 19 (16.5%) |
| Community & Social Service | 1,103 (41.2%) | 1,573 (58.8%) |
| Education, Arts & Media | 231 (63.5%) | 133 (36.5%) |
| Legal Services & Support | 83 (35.9%) | 148 (64.1%) |
| Education Instruction & Library | 440 (28.7%) | 1,093 (71.3%) |
| Arts, Media & Entertainment | 349 (63.7%) | 199 (36.3%) |
| Health Diagnosing & Treating | 262 (19.4%) | 1,091 (80.6%) |
| Health Technologists | 140 (17.0%) | 686 (83.1%) |
| Total (Category) | 4,079 (44.8%) | 5,026 (55.2%) |
| Total (Overall) | 14,576 (53.3%) | 12,764 (46.7%) |
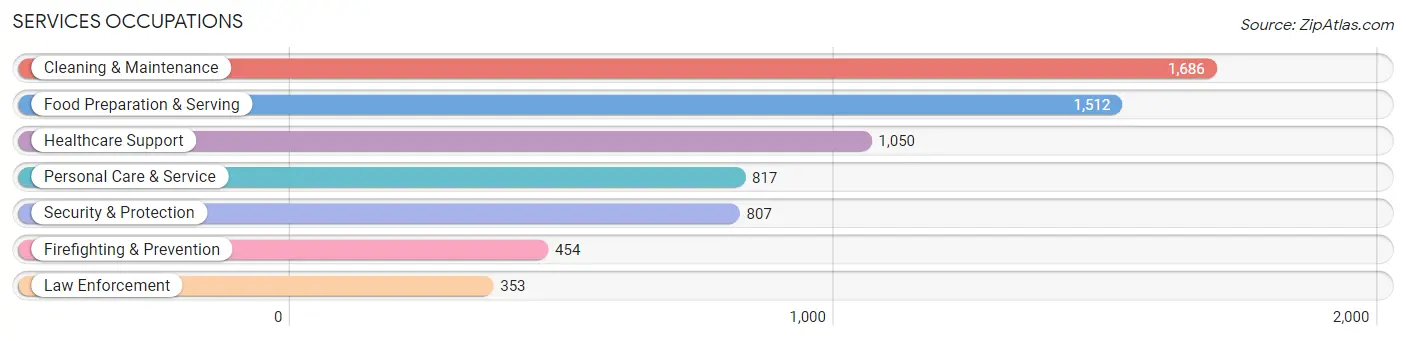
Services Occupations
The most common Services occupations in Carson City are Cleaning & Maintenance (1,686 | 6.2%), Food Preparation & Serving (1,512 | 5.5%), Healthcare Support (1,050 | 3.8%), Personal Care & Service (817 | 3.0%), and Security & Protection (807 | 2.9%).
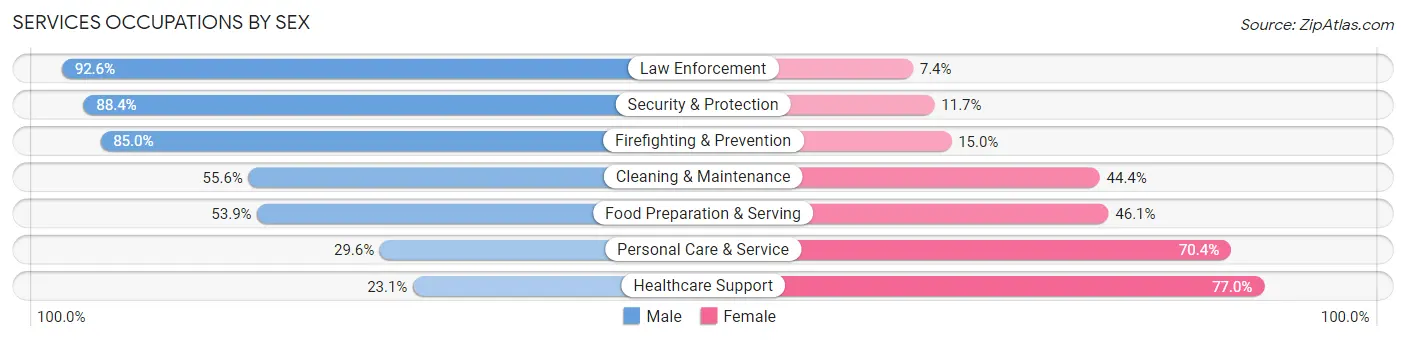
Services Occupations by Sex
Within the Services occupations in Carson City, the most male-oriented occupations are Law Enforcement (92.6%), Security & Protection (88.3%), and Firefighting & Prevention (85.0%), while the most female-oriented occupations are Healthcare Support (76.9%), Personal Care & Service (70.4%), and Food Preparation & Serving (46.1%).
| Occupation | Male | Female |
| Healthcare Support | 242 (23.1%) | 808 (76.9%) |
| Security & Protection | 713 (88.3%) | 94 (11.7%) |
| Firefighting & Prevention | 386 (85.0%) | 68 (15.0%) |
| Law Enforcement | 327 (92.6%) | 26 (7.4%) |
| Food Preparation & Serving | 815 (53.9%) | 697 (46.1%) |
| Cleaning & Maintenance | 938 (55.6%) | 748 (44.4%) |
| Personal Care & Service | 242 (29.6%) | 575 (70.4%) |
| Total (Category) | 2,950 (50.2%) | 2,922 (49.8%) |
| Total (Overall) | 14,576 (53.3%) | 12,764 (46.7%) |
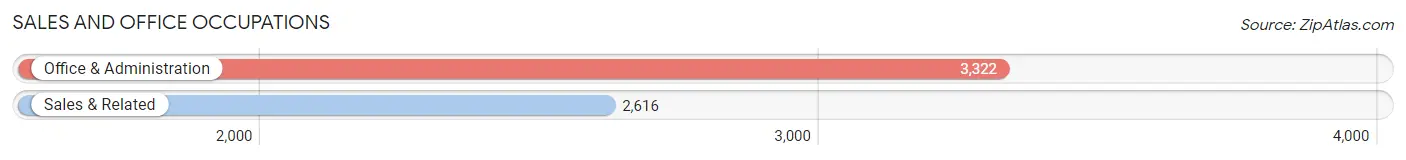
Sales and Office Occupations
The most common Sales and Office occupations in Carson City are Office & Administration (3,322 | 12.1%), and Sales & Related (2,616 | 9.6%).
Sales and Office Occupations by Sex
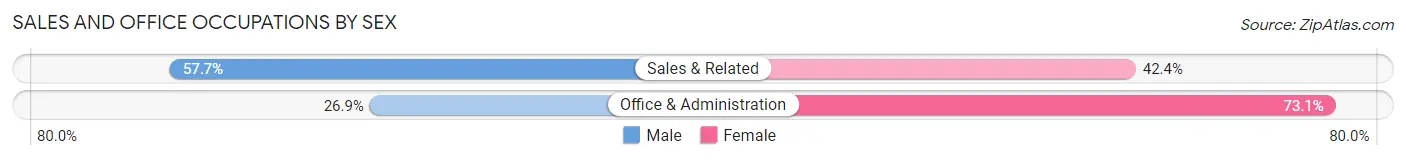
| Occupation | Male | Female |
| Sales & Related | 1,508 (57.7%) | 1,108 (42.3%) |
| Office & Administration | 894 (26.9%) | 2,428 (73.1%) |
| Total (Category) | 2,402 (40.5%) | 3,536 (59.6%) |
| Total (Overall) | 14,576 (53.3%) | 12,764 (46.7%) |
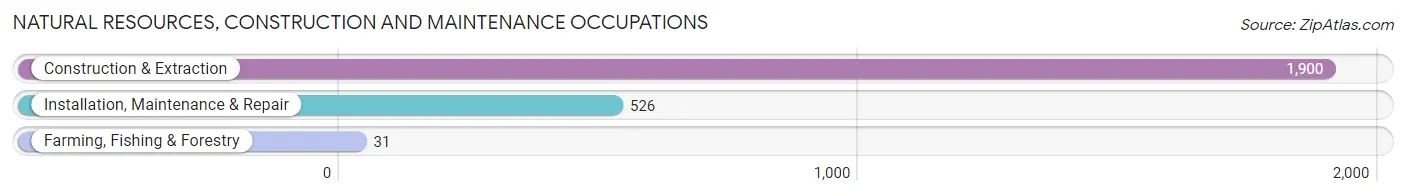
Natural Resources, Construction and Maintenance Occupations
The most common Natural Resources, Construction and Maintenance occupations in Carson City are Construction & Extraction (1,900 | 7.0%), Installation, Maintenance & Repair (526 | 1.9%), and Farming, Fishing & Forestry (31 | 0.1%).
Natural Resources, Construction and Maintenance Occupations by Sex
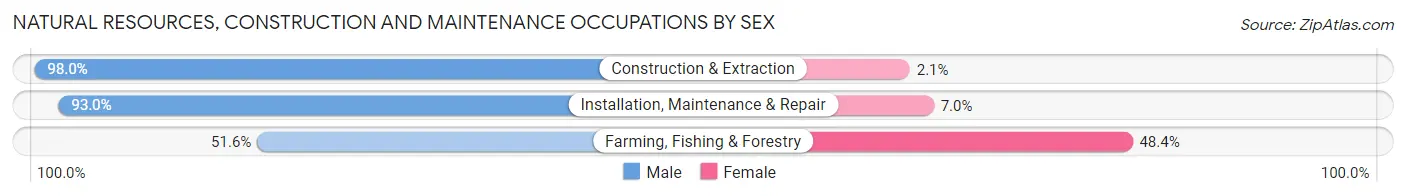
| Occupation | Male | Female |
| Farming, Fishing & Forestry | 16 (51.6%) | 15 (48.4%) |
| Construction & Extraction | 1,861 (98.0%) | 39 (2.1%) |
| Installation, Maintenance & Repair | 489 (93.0%) | 37 (7.0%) |
| Total (Category) | 2,366 (96.3%) | 91 (3.7%) |
| Total (Overall) | 14,576 (53.3%) | 12,764 (46.7%) |
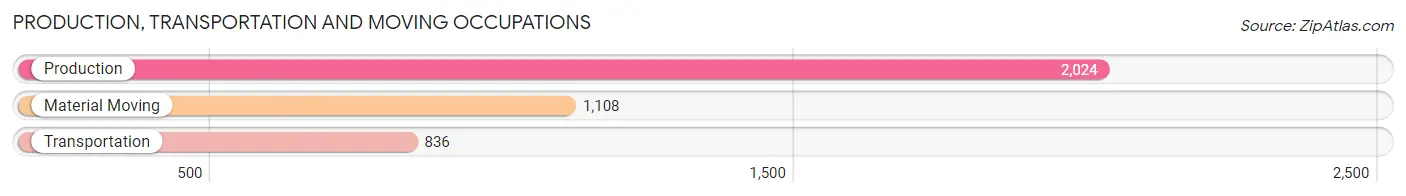
Production, Transportation and Moving Occupations
The most common Production, Transportation and Moving occupations in Carson City are Production (2,024 | 7.4%), Material Moving (1,108 | 4.1%), and Transportation (836 | 3.1%).
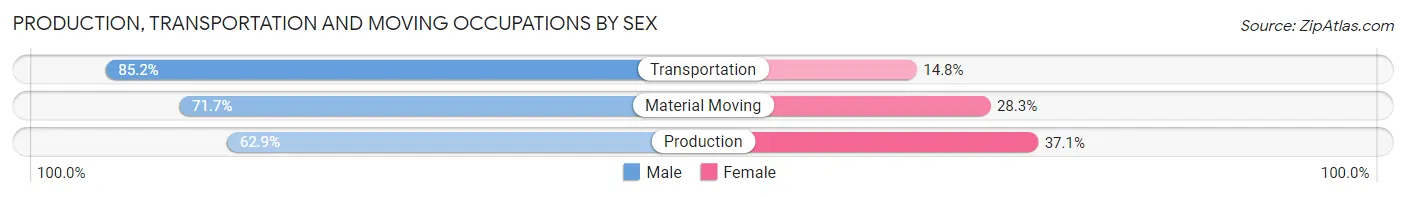
Production, Transportation and Moving Occupations by Sex
| Occupation | Male | Female |
| Production | 1,273 (62.9%) | 751 (37.1%) |
| Transportation | 712 (85.2%) | 124 (14.8%) |
| Material Moving | 794 (71.7%) | 314 (28.3%) |
| Total (Category) | 2,779 (70.0%) | 1,189 (30.0%) |
| Total (Overall) | 14,576 (53.3%) | 12,764 (46.7%) |
Employment Industries by Sex in Carson City
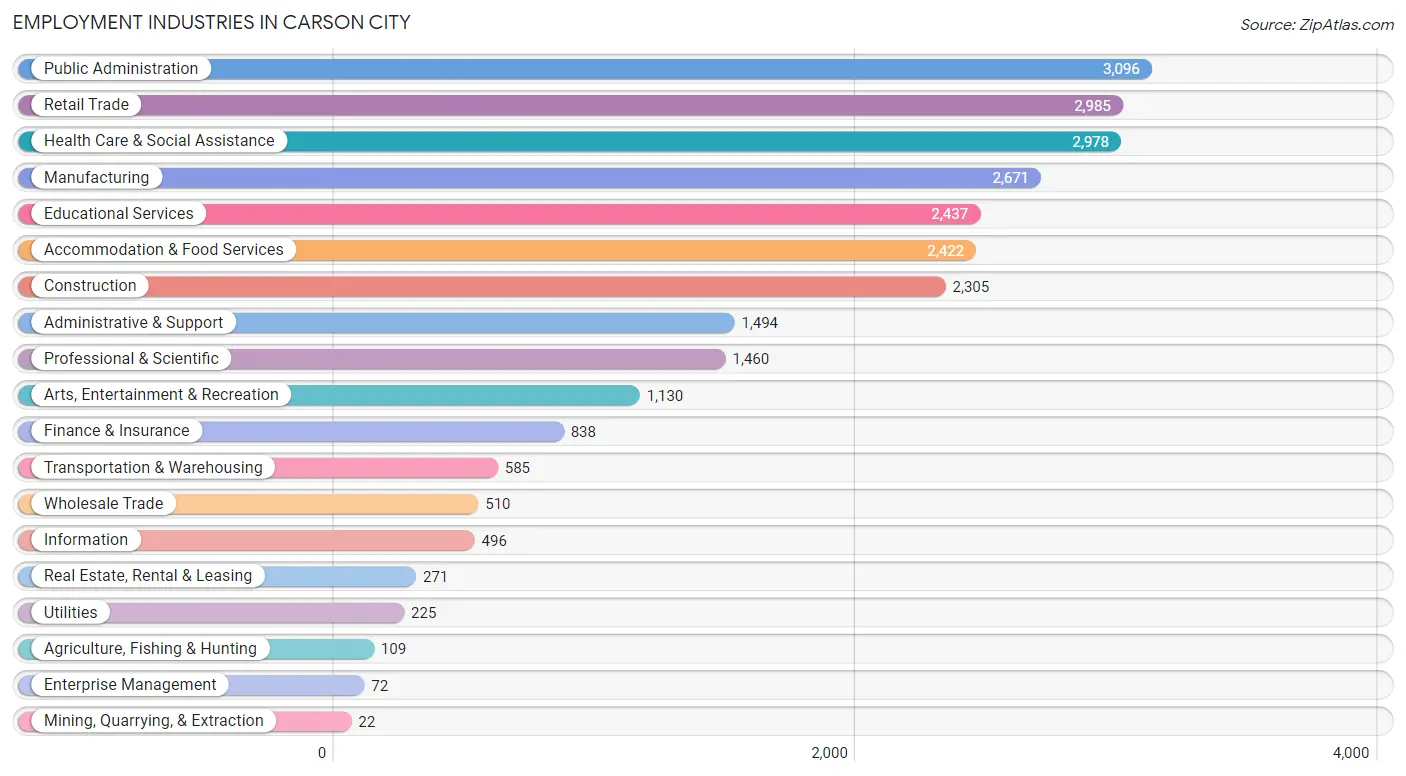
Employment Industries in Carson City
The major employment industries in Carson City include Public Administration (3,096 | 11.3%), Retail Trade (2,985 | 10.9%), Health Care & Social Assistance (2,978 | 10.9%), Manufacturing (2,671 | 9.8%), and Educational Services (2,437 | 8.9%).
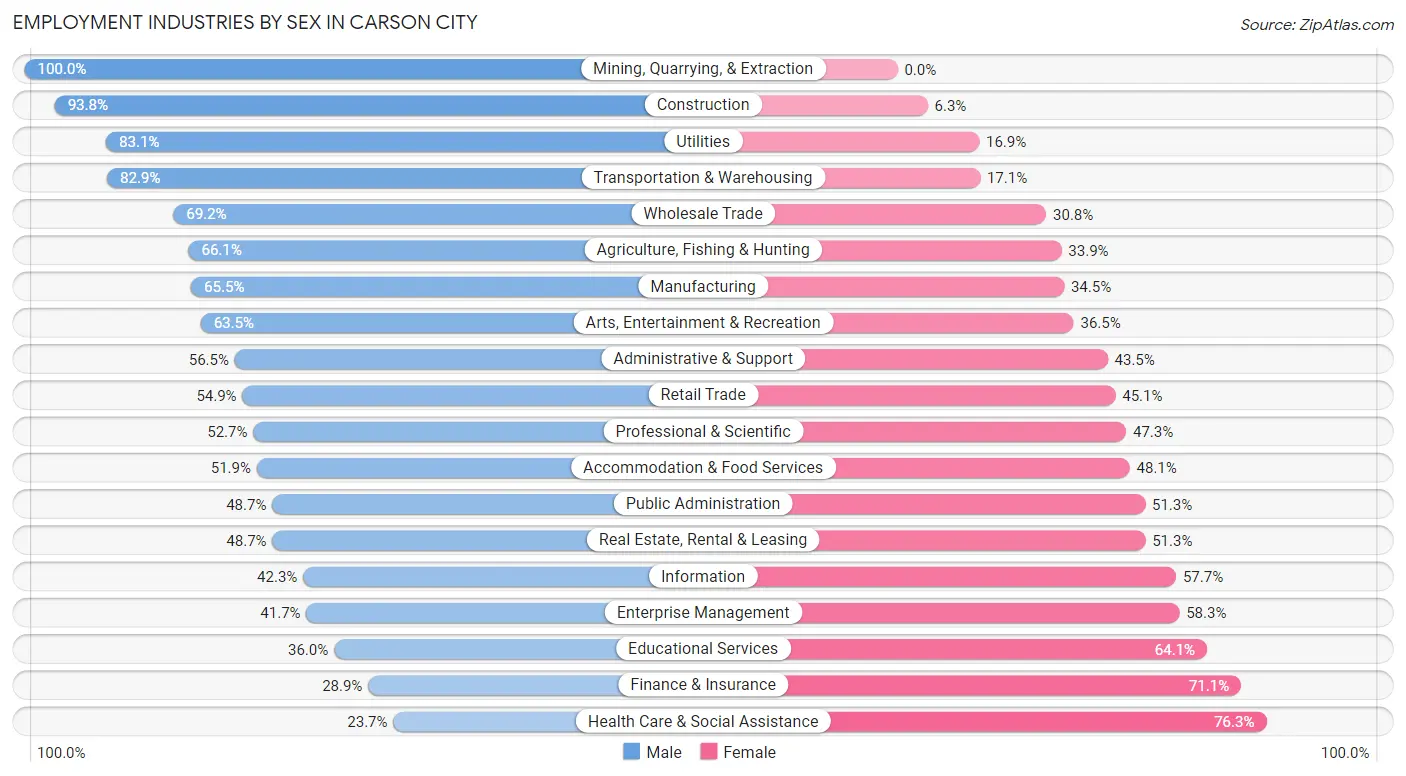
Employment Industries by Sex in Carson City
The Carson City industries that see more men than women are Mining, Quarrying, & Extraction (100.0%), Construction (93.8%), and Utilities (83.1%), whereas the industries that tend to have a higher number of women are Health Care & Social Assistance (76.3%), Finance & Insurance (71.1%), and Educational Services (64.0%).
| Industry | Male | Female |
| Agriculture, Fishing & Hunting | 72 (66.1%) | 37 (33.9%) |
| Mining, Quarrying, & Extraction | 22 (100.0%) | 0 (0.0%) |
| Construction | 2,161 (93.8%) | 144 (6.2%) |
| Manufacturing | 1,750 (65.5%) | 921 (34.5%) |
| Wholesale Trade | 353 (69.2%) | 157 (30.8%) |
| Retail Trade | 1,639 (54.9%) | 1,346 (45.1%) |
| Transportation & Warehousing | 485 (82.9%) | 100 (17.1%) |
| Utilities | 187 (83.1%) | 38 (16.9%) |
| Information | 210 (42.3%) | 286 (57.7%) |
| Finance & Insurance | 242 (28.9%) | 596 (71.1%) |
| Real Estate, Rental & Leasing | 132 (48.7%) | 139 (51.3%) |
| Professional & Scientific | 769 (52.7%) | 691 (47.3%) |
| Enterprise Management | 30 (41.7%) | 42 (58.3%) |
| Administrative & Support | 844 (56.5%) | 650 (43.5%) |
| Educational Services | 876 (35.9%) | 1,561 (64.0%) |
| Health Care & Social Assistance | 705 (23.7%) | 2,273 (76.3%) |
| Arts, Entertainment & Recreation | 718 (63.5%) | 412 (36.5%) |
| Accommodation & Food Services | 1,258 (51.9%) | 1,164 (48.1%) |
| Public Administration | 1,509 (48.7%) | 1,587 (51.3%) |
| Total | 14,576 (53.3%) | 12,764 (46.7%) |
Education in Carson City
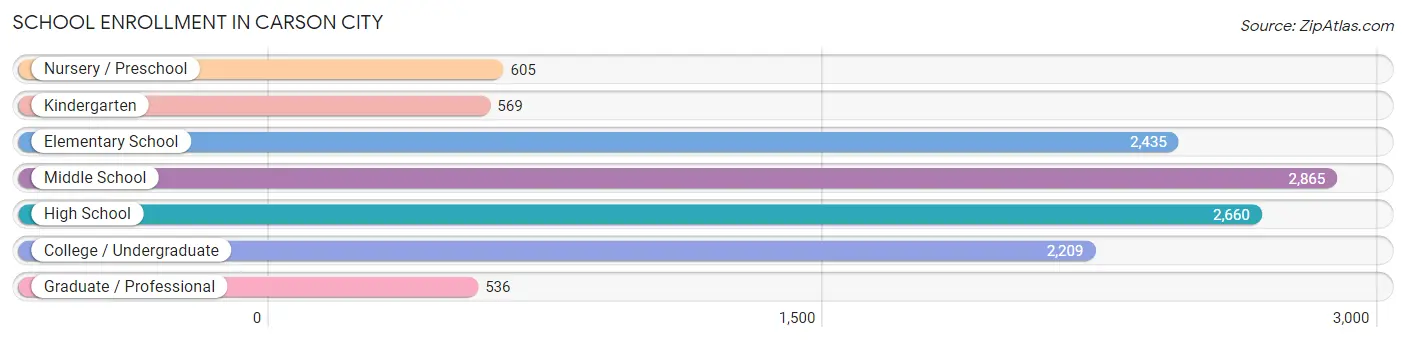
School Enrollment in Carson City
The most common levels of schooling among the 11,879 students in Carson City are middle school (2,865 | 24.1%), high school (2,660 | 22.4%), and elementary school (2,435 | 20.5%).
| School Level | # Students | % Students |
| Nursery / Preschool | 605 | 5.1% |
| Kindergarten | 569 | 4.8% |
| Elementary School | 2,435 | 20.5% |
| Middle School | 2,865 | 24.1% |
| High School | 2,660 | 22.4% |
| College / Undergraduate | 2,209 | 18.6% |
| Graduate / Professional | 536 | 4.5% |
| Total | 11,879 | 100.0% |
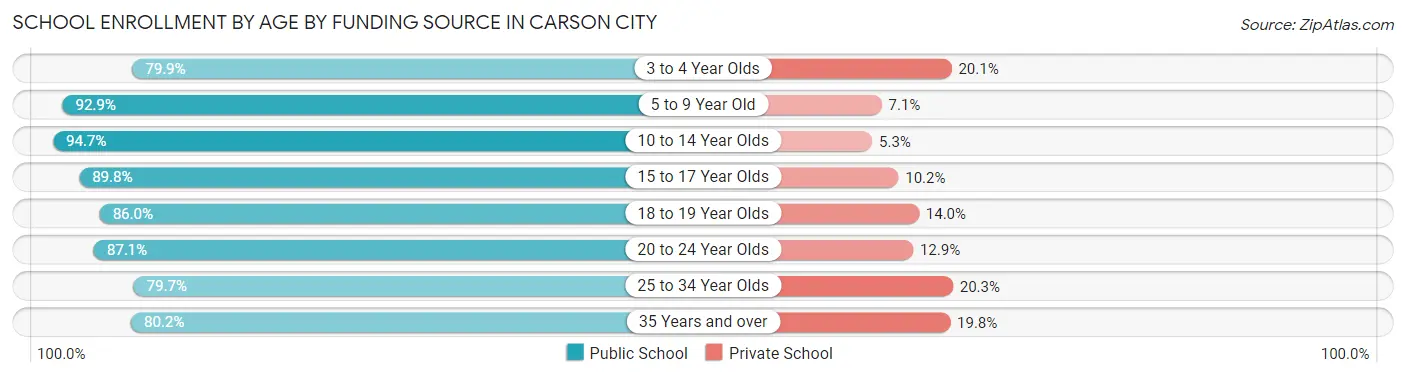
School Enrollment by Age by Funding Source in Carson City
Out of a total of 11,879 students who are enrolled in schools in Carson City, 1,212 (10.2%) attend a private institution, while the remaining 10,667 (89.8%) are enrolled in public schools. The age group of 25 to 34 year olds has the highest likelihood of being enrolled in private schools, with 165 (20.3% in the age bracket) enrolled. Conversely, the age group of 10 to 14 year olds has the lowest likelihood of being enrolled in a private school, with 3,200 (94.7% in the age bracket) attending a public institution.
| Age Bracket | Public School | Private School |
| 3 to 4 Year Olds | 378 (79.9%) | 95 (20.1%) |
| 5 to 9 Year Old | 2,694 (92.9%) | 205 (7.1%) |
| 10 to 14 Year Olds | 3,200 (94.7%) | 179 (5.3%) |
| 15 to 17 Year Olds | 1,668 (89.8%) | 189 (10.2%) |
| 18 to 19 Year Olds | 639 (86.0%) | 104 (14.0%) |
| 20 to 24 Year Olds | 796 (87.1%) | 118 (12.9%) |
| 25 to 34 Year Olds | 647 (79.7%) | 165 (20.3%) |
| 35 Years and over | 643 (80.2%) | 159 (19.8%) |
| Total | 10,667 (89.8%) | 1,212 (10.2%) |
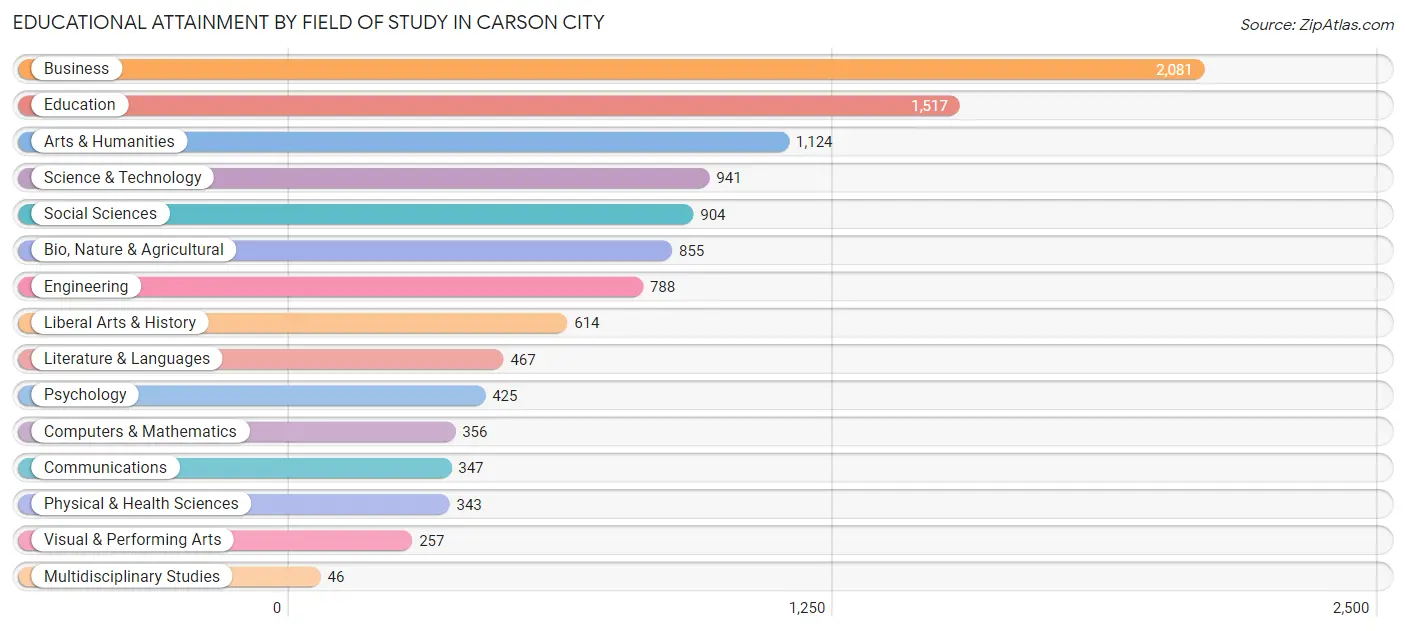
Educational Attainment by Field of Study in Carson City
Business (2,081 | 18.8%), education (1,517 | 13.7%), arts & humanities (1,124 | 10.2%), science & technology (941 | 8.5%), and social sciences (904 | 8.2%) are the most common fields of study among 11,065 individuals in Carson City who have obtained a bachelor's degree or higher.
| Field of Study | # Graduates | % Graduates |
| Computers & Mathematics | 356 | 3.2% |
| Bio, Nature & Agricultural | 855 | 7.7% |
| Physical & Health Sciences | 343 | 3.1% |
| Psychology | 425 | 3.8% |
| Social Sciences | 904 | 8.2% |
| Engineering | 788 | 7.1% |
| Multidisciplinary Studies | 46 | 0.4% |
| Science & Technology | 941 | 8.5% |
| Business | 2,081 | 18.8% |
| Education | 1,517 | 13.7% |
| Literature & Languages | 467 | 4.2% |
| Liberal Arts & History | 614 | 5.6% |
| Visual & Performing Arts | 257 | 2.3% |
| Communications | 347 | 3.1% |
| Arts & Humanities | 1,124 | 10.2% |
| Total | 11,065 | 100.0% |
Transportation & Commute in Carson City
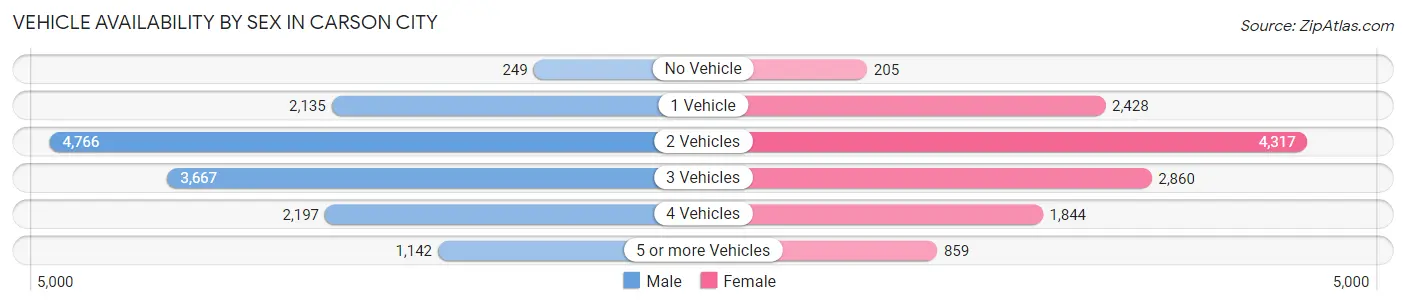
Vehicle Availability by Sex in Carson City
The most prevalent vehicle ownership categories in Carson City are males with 2 vehicles (4,766, accounting for 33.7%) and females with 2 vehicles (4,317, making up 38.1%).
| Vehicles Available | Male | Female |
| No Vehicle | 249 (1.8%) | 205 (1.6%) |
| 1 Vehicle | 2,135 (15.1%) | 2,428 (19.4%) |
| 2 Vehicles | 4,766 (33.7%) | 4,317 (34.5%) |
| 3 Vehicles | 3,667 (25.9%) | 2,860 (22.9%) |
| 4 Vehicles | 2,197 (15.5%) | 1,844 (14.7%) |
| 5 or more Vehicles | 1,142 (8.1%) | 859 (6.9%) |
| Total | 14,156 (100.0%) | 12,513 (100.0%) |
Commute Time in Carson City
The most frequently occuring commute durations in Carson City are 5 to 9 minutes (5,075 commuters, 20.4%), 10 to 14 minutes (4,727 commuters, 19.0%), and 15 to 19 minutes (4,387 commuters, 17.6%).
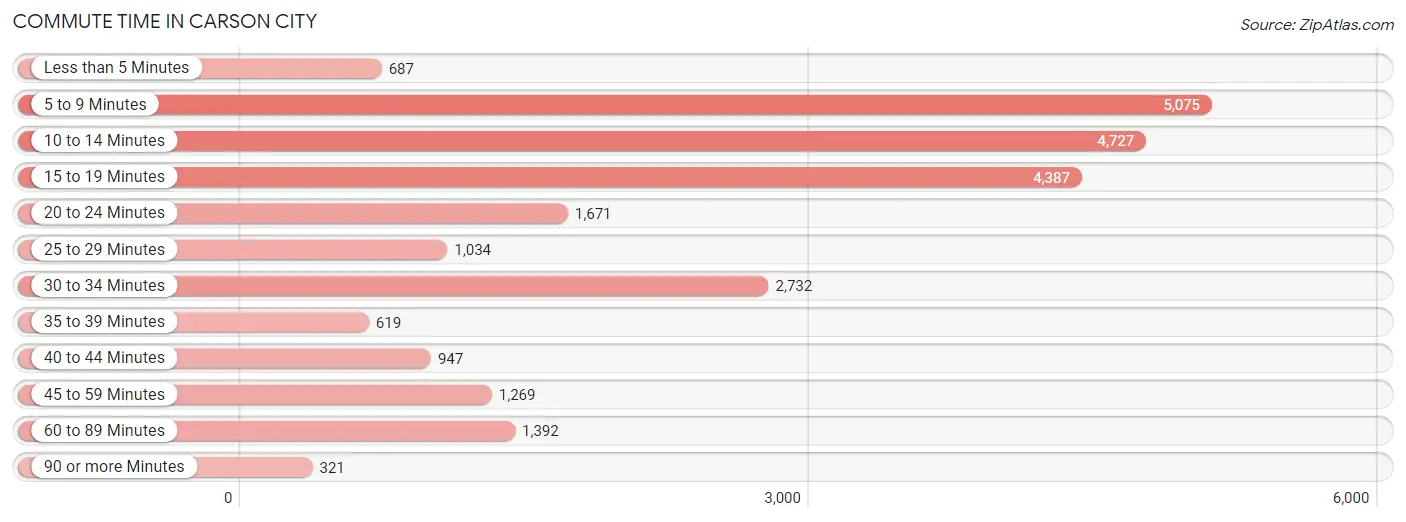
| Commute Time | # Commuters | % Commuters |
| Less than 5 Minutes | 687 | 2.8% |
| 5 to 9 Minutes | 5,075 | 20.4% |
| 10 to 14 Minutes | 4,727 | 19.0% |
| 15 to 19 Minutes | 4,387 | 17.6% |
| 20 to 24 Minutes | 1,671 | 6.7% |
| 25 to 29 Minutes | 1,034 | 4.2% |
| 30 to 34 Minutes | 2,732 | 11.0% |
| 35 to 39 Minutes | 619 | 2.5% |
| 40 to 44 Minutes | 947 | 3.8% |
| 45 to 59 Minutes | 1,269 | 5.1% |
| 60 to 89 Minutes | 1,392 | 5.6% |
| 90 or more Minutes | 321 | 1.3% |
Commute Time by Sex in Carson City
The most common commute times in Carson City are 10 to 14 minutes (2,534 commuters, 19.2%) for males and 5 to 9 minutes (3,029 commuters, 26.0%) for females.
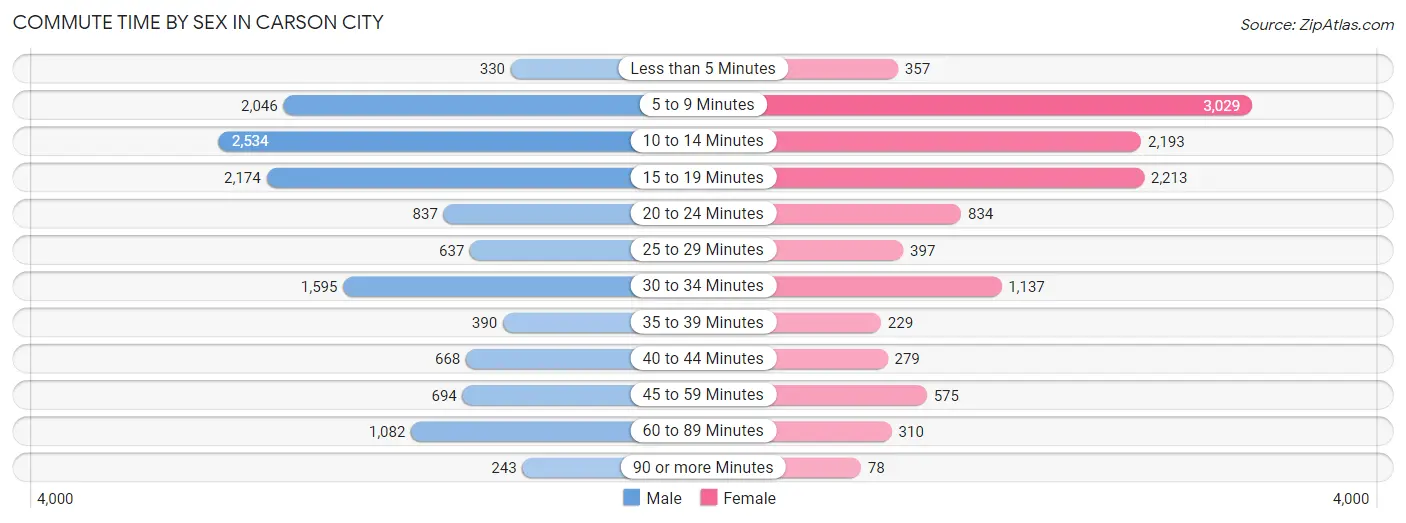
| Commute Time | Male | Female |
| Less than 5 Minutes | 330 (2.5%) | 357 (3.1%) |
| 5 to 9 Minutes | 2,046 (15.5%) | 3,029 (26.0%) |
| 10 to 14 Minutes | 2,534 (19.2%) | 2,193 (18.9%) |
| 15 to 19 Minutes | 2,174 (16.4%) | 2,213 (19.0%) |
| 20 to 24 Minutes | 837 (6.3%) | 834 (7.2%) |
| 25 to 29 Minutes | 637 (4.8%) | 397 (3.4%) |
| 30 to 34 Minutes | 1,595 (12.1%) | 1,137 (9.8%) |
| 35 to 39 Minutes | 390 (2.9%) | 229 (2.0%) |
| 40 to 44 Minutes | 668 (5.1%) | 279 (2.4%) |
| 45 to 59 Minutes | 694 (5.2%) | 575 (4.9%) |
| 60 to 89 Minutes | 1,082 (8.2%) | 310 (2.7%) |
| 90 or more Minutes | 243 (1.8%) | 78 (0.7%) |
Time of Departure to Work by Sex in Carson City
The most frequent times of departure to work in Carson City are 6:30 AM to 6:59 AM (1,771, 13.4%) for males and 7:30 AM to 7:59 AM (2,154, 18.5%) for females.
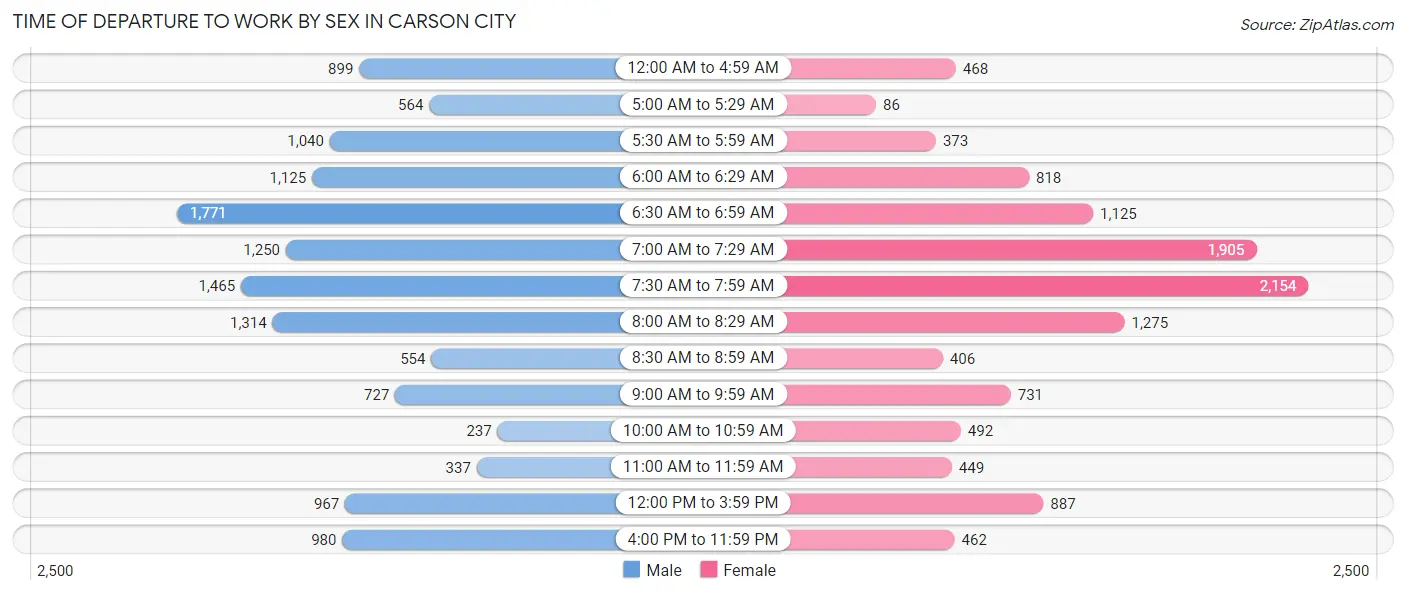
| Time of Departure | Male | Female |
| 12:00 AM to 4:59 AM | 899 (6.8%) | 468 (4.0%) |
| 5:00 AM to 5:29 AM | 564 (4.3%) | 86 (0.7%) |
| 5:30 AM to 5:59 AM | 1,040 (7.9%) | 373 (3.2%) |
| 6:00 AM to 6:29 AM | 1,125 (8.5%) | 818 (7.0%) |
| 6:30 AM to 6:59 AM | 1,771 (13.4%) | 1,125 (9.7%) |
| 7:00 AM to 7:29 AM | 1,250 (9.5%) | 1,905 (16.4%) |
| 7:30 AM to 7:59 AM | 1,465 (11.1%) | 2,154 (18.5%) |
| 8:00 AM to 8:29 AM | 1,314 (9.9%) | 1,275 (11.0%) |
| 8:30 AM to 8:59 AM | 554 (4.2%) | 406 (3.5%) |
| 9:00 AM to 9:59 AM | 727 (5.5%) | 731 (6.3%) |
| 10:00 AM to 10:59 AM | 237 (1.8%) | 492 (4.2%) |
| 11:00 AM to 11:59 AM | 337 (2.5%) | 449 (3.9%) |
| 12:00 PM to 3:59 PM | 967 (7.3%) | 887 (7.6%) |
| 4:00 PM to 11:59 PM | 980 (7.4%) | 462 (4.0%) |
| Total | 13,230 (100.0%) | 11,631 (100.0%) |
Housing Occupancy in Carson City
Occupancy by Ownership in Carson City
Of the total 23,355 dwellings in Carson City, owner-occupied units account for 14,450 (61.9%), while renter-occupied units make up 8,905 (38.1%).
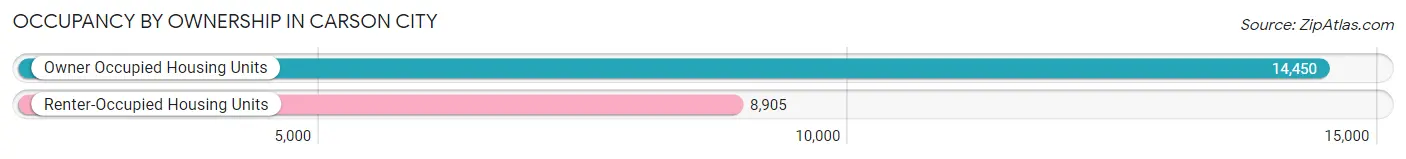
| Occupancy | # Housing Units | % Housing Units |
| Owner Occupied Housing Units | 14,450 | 61.9% |
| Renter-Occupied Housing Units | 8,905 | 38.1% |
| Total Occupied Housing Units | 23,355 | 100.0% |
Occupancy by Household Size in Carson City
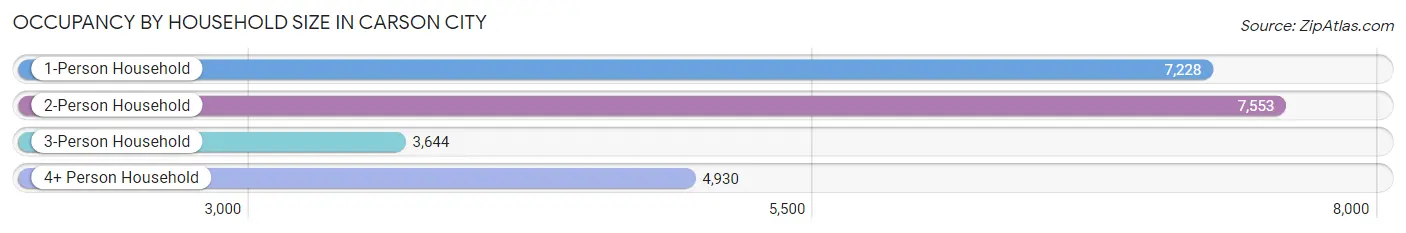
| Household Size | # Housing Units | % Housing Units |
| 1-Person Household | 7,228 | 30.9% |
| 2-Person Household | 7,553 | 32.3% |
| 3-Person Household | 3,644 | 15.6% |
| 4+ Person Household | 4,930 | 21.1% |
| Total Housing Units | 23,355 | 100.0% |
Occupancy by Ownership by Household Size in Carson City
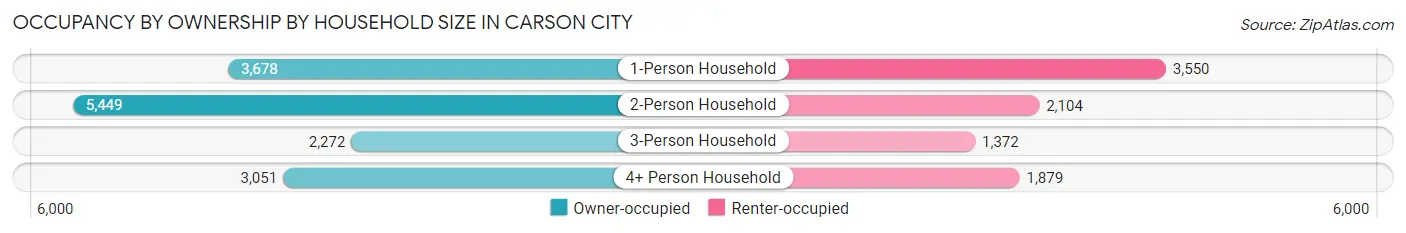
| Household Size | Owner-occupied | Renter-occupied |
| 1-Person Household | 3,678 (50.9%) | 3,550 (49.1%) |
| 2-Person Household | 5,449 (72.1%) | 2,104 (27.9%) |
| 3-Person Household | 2,272 (62.4%) | 1,372 (37.7%) |
| 4+ Person Household | 3,051 (61.9%) | 1,879 (38.1%) |
| Total Housing Units | 14,450 (61.9%) | 8,905 (38.1%) |
Occupancy by Educational Attainment in Carson City
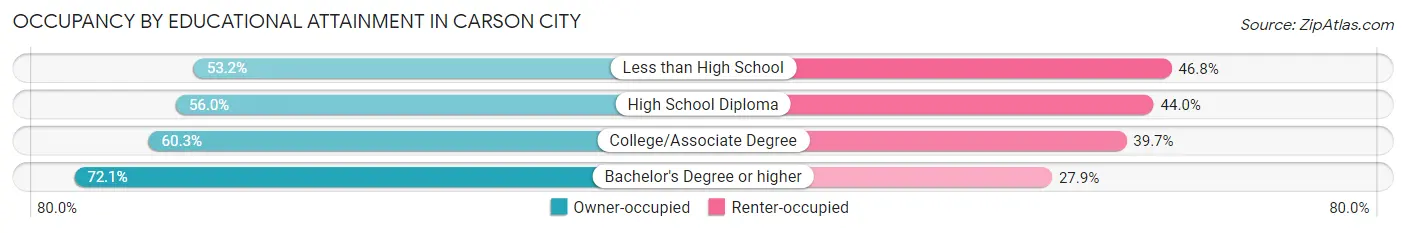
| Household Size | Owner-occupied | Renter-occupied |
| Less than High School | 1,176 (53.2%) | 1,036 (46.8%) |
| High School Diploma | 2,779 (56.0%) | 2,184 (44.0%) |
| College/Associate Degree | 5,996 (60.3%) | 3,945 (39.7%) |
| Bachelor's Degree or higher | 4,499 (72.1%) | 1,740 (27.9%) |
Occupancy by Age of Householder in Carson City
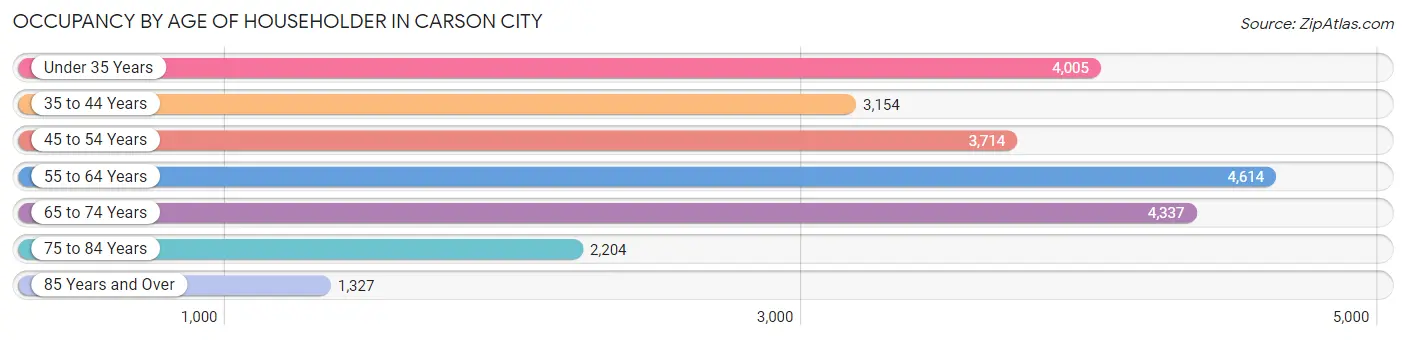
| Age Bracket | # Households | % Households |
| Under 35 Years | 4,005 | 17.2% |
| 35 to 44 Years | 3,154 | 13.5% |
| 45 to 54 Years | 3,714 | 15.9% |
| 55 to 64 Years | 4,614 | 19.8% |
| 65 to 74 Years | 4,337 | 18.6% |
| 75 to 84 Years | 2,204 | 9.4% |
| 85 Years and Over | 1,327 | 5.7% |
| Total | 23,355 | 100.0% |
Housing Finances in Carson City
Median Income by Occupancy in Carson City
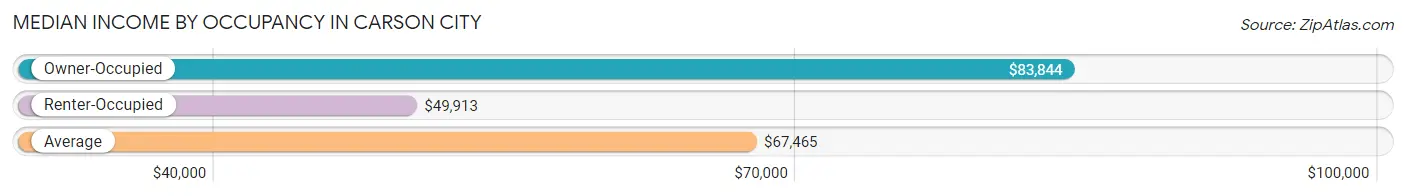
| Occupancy Type | # Households | Median Income |
| Owner-Occupied | 14,450 (61.9%) | $83,844 |
| Renter-Occupied | 8,905 (38.1%) | $49,913 |
| Average | 23,355 (100.0%) | $67,465 |
Occupancy by Householder Income Bracket in Carson City
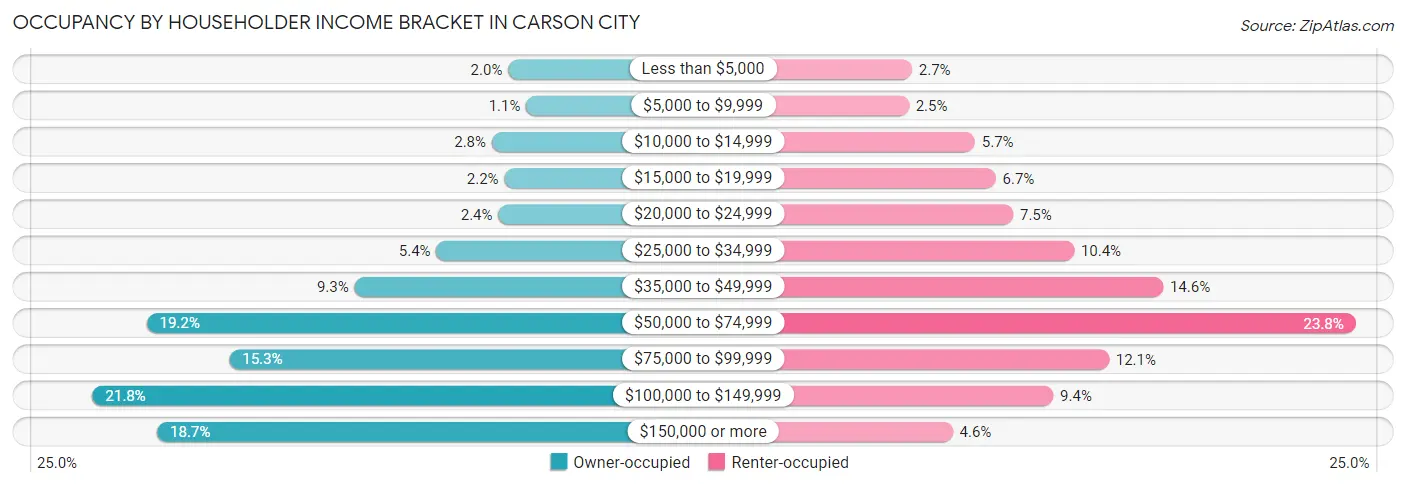
| Income Bracket | Owner-occupied | Renter-occupied |
| Less than $5,000 | 284 (2.0%) | 239 (2.7%) |
| $5,000 to $9,999 | 161 (1.1%) | 225 (2.5%) |
| $10,000 to $14,999 | 398 (2.8%) | 506 (5.7%) |
| $15,000 to $19,999 | 310 (2.1%) | 594 (6.7%) |
| $20,000 to $24,999 | 352 (2.4%) | 668 (7.5%) |
| $25,000 to $34,999 | 779 (5.4%) | 926 (10.4%) |
| $35,000 to $49,999 | 1,342 (9.3%) | 1,304 (14.6%) |
| $50,000 to $74,999 | 2,773 (19.2%) | 2,120 (23.8%) |
| $75,000 to $99,999 | 2,204 (15.2%) | 1,074 (12.1%) |
| $100,000 to $149,999 | 3,146 (21.8%) | 838 (9.4%) |
| $150,000 or more | 2,701 (18.7%) | 411 (4.6%) |
| Total | 14,450 (100.0%) | 8,905 (100.0%) |
Monthly Housing Cost Tiers in Carson City
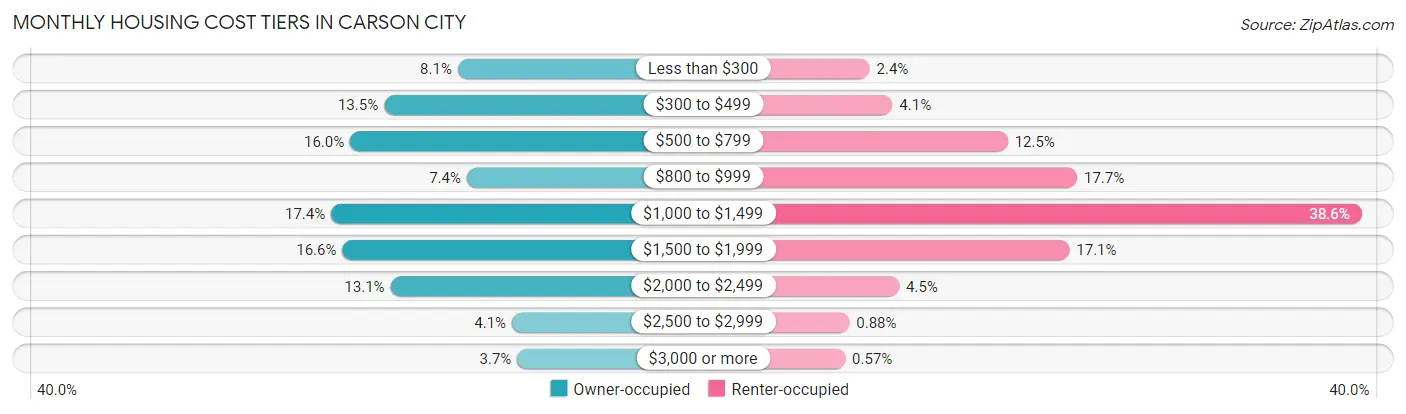
| Monthly Cost | Owner-occupied | Renter-occupied |
| Less than $300 | 1,170 (8.1%) | 211 (2.4%) |
| $300 to $499 | 1,955 (13.5%) | 361 (4.1%) |
| $500 to $799 | 2,317 (16.0%) | 1,117 (12.5%) |
| $800 to $999 | 1,073 (7.4%) | 1,572 (17.6%) |
| $1,000 to $1,499 | 2,518 (17.4%) | 3,437 (38.6%) |
| $1,500 to $1,999 | 2,399 (16.6%) | 1,521 (17.1%) |
| $2,000 to $2,499 | 1,887 (13.1%) | 404 (4.5%) |
| $2,500 to $2,999 | 594 (4.1%) | 78 (0.9%) |
| $3,000 or more | 537 (3.7%) | 51 (0.6%) |
| Total | 14,450 (100.0%) | 8,905 (100.0%) |
Physical Housing Characteristics in Carson City
Housing Structures in Carson City
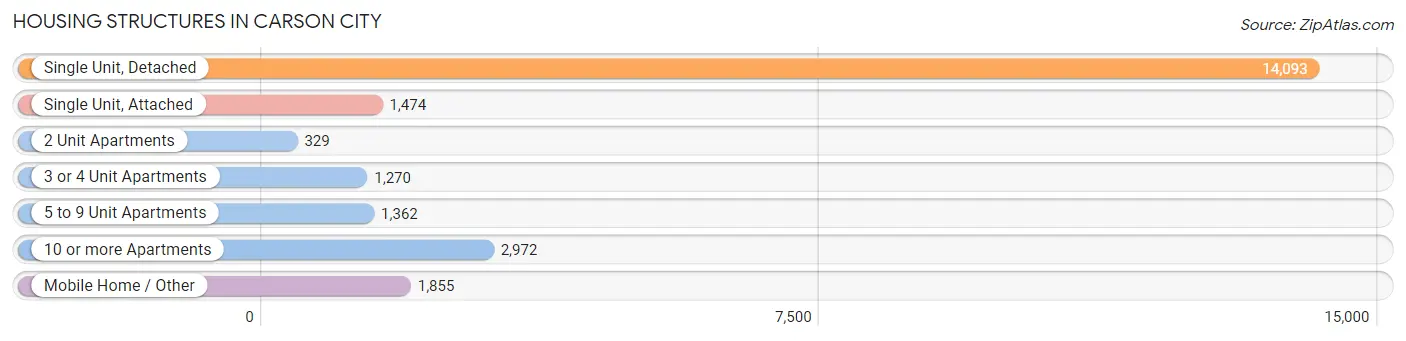
| Structure Type | # Housing Units | % Housing Units |
| Single Unit, Detached | 14,093 | 60.3% |
| Single Unit, Attached | 1,474 | 6.3% |
| 2 Unit Apartments | 329 | 1.4% |
| 3 or 4 Unit Apartments | 1,270 | 5.4% |
| 5 to 9 Unit Apartments | 1,362 | 5.8% |
| 10 or more Apartments | 2,972 | 12.7% |
| Mobile Home / Other | 1,855 | 7.9% |
| Total | 23,355 | 100.0% |
Housing Structures by Occupancy in Carson City
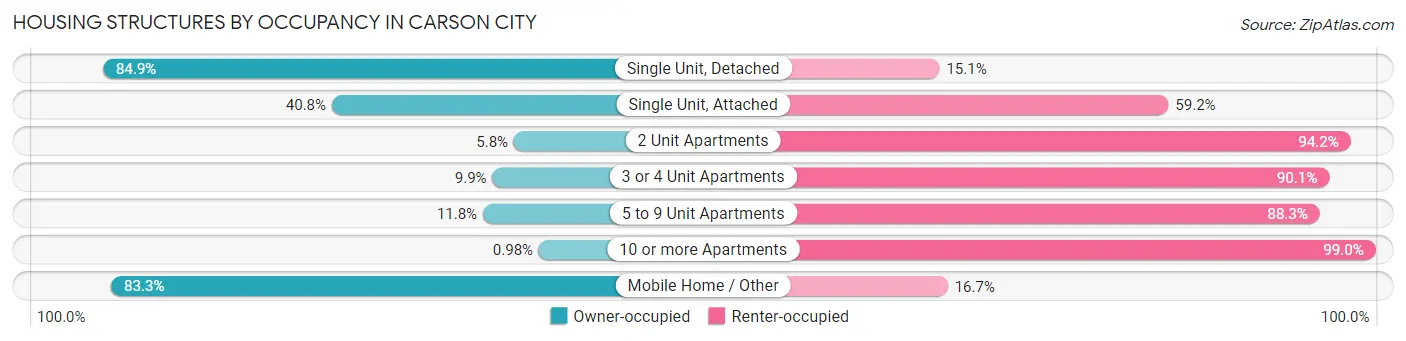
| Structure Type | Owner-occupied | Renter-occupied |
| Single Unit, Detached | 11,968 (84.9%) | 2,125 (15.1%) |
| Single Unit, Attached | 602 (40.8%) | 872 (59.2%) |
| 2 Unit Apartments | 19 (5.8%) | 310 (94.2%) |
| 3 or 4 Unit Apartments | 126 (9.9%) | 1,144 (90.1%) |
| 5 to 9 Unit Apartments | 160 (11.7%) | 1,202 (88.2%) |
| 10 or more Apartments | 29 (1.0%) | 2,943 (99.0%) |
| Mobile Home / Other | 1,546 (83.3%) | 309 (16.7%) |
| Total | 14,450 (61.9%) | 8,905 (38.1%) |
Housing Structures by Number of Rooms in Carson City
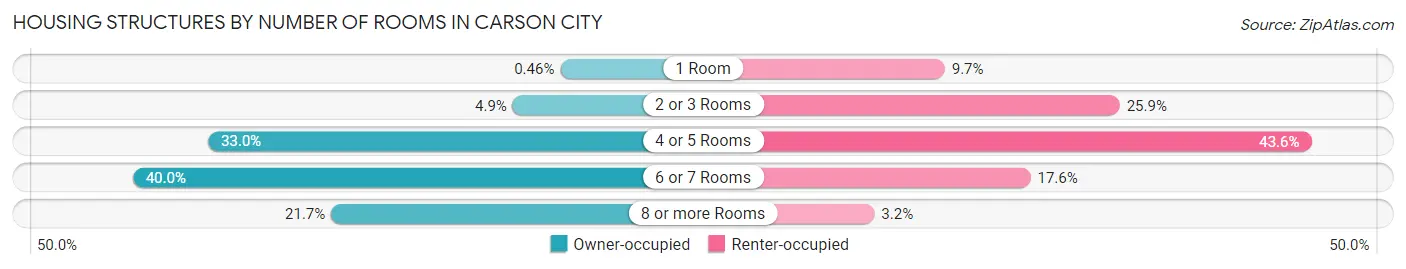
| Number of Rooms | Owner-occupied | Renter-occupied |
| 1 Room | 66 (0.5%) | 864 (9.7%) |
| 2 or 3 Rooms | 702 (4.9%) | 2,305 (25.9%) |
| 4 or 5 Rooms | 4,774 (33.0%) | 3,882 (43.6%) |
| 6 or 7 Rooms | 5,780 (40.0%) | 1,570 (17.6%) |
| 8 or more Rooms | 3,128 (21.6%) | 284 (3.2%) |
| Total | 14,450 (100.0%) | 8,905 (100.0%) |
Housing Structure by Heating Type in Carson City
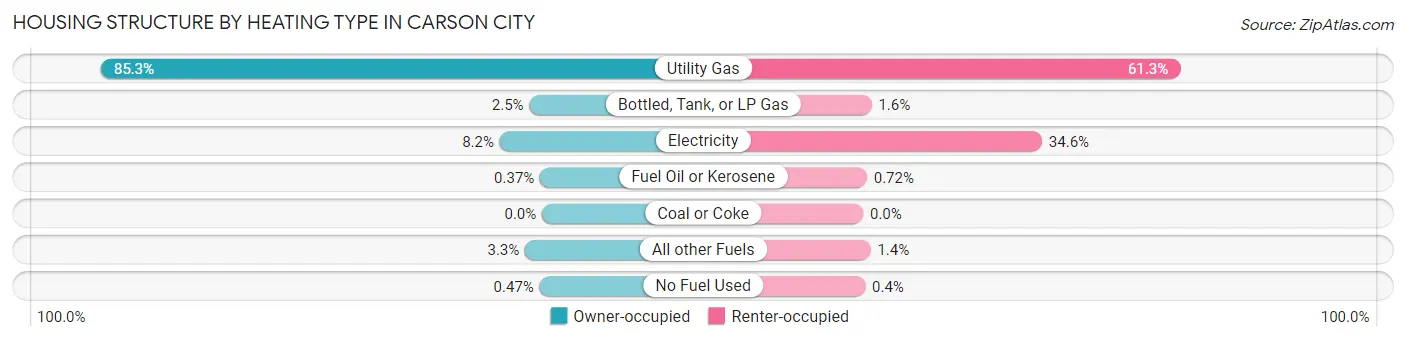
| Heating Type | Owner-occupied | Renter-occupied |
| Utility Gas | 12,321 (85.3%) | 5,455 (61.3%) |
| Bottled, Tank, or LP Gas | 354 (2.5%) | 145 (1.6%) |
| Electricity | 1,180 (8.2%) | 3,078 (34.6%) |
| Fuel Oil or Kerosene | 53 (0.4%) | 64 (0.7%) |
| Coal or Coke | 0 (0.0%) | 0 (0.0%) |
| All other Fuels | 474 (3.3%) | 127 (1.4%) |
| No Fuel Used | 68 (0.5%) | 36 (0.4%) |
| Total | 14,450 (100.0%) | 8,905 (100.0%) |
Household Vehicle Usage in Carson City
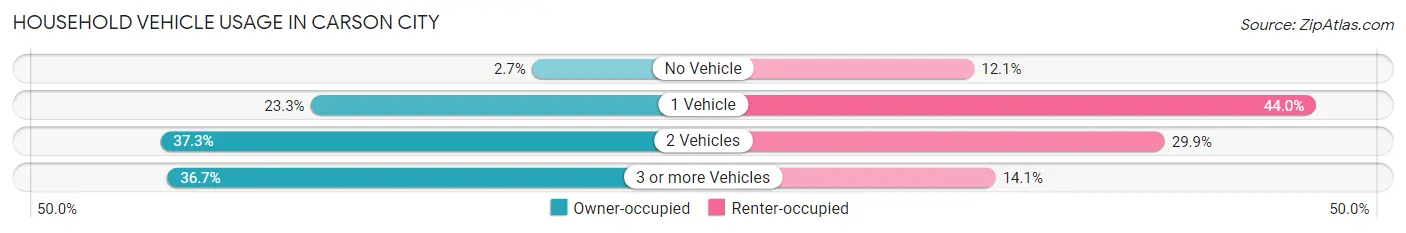
| Vehicles per Household | Owner-occupied | Renter-occupied |
| No Vehicle | 387 (2.7%) | 1,076 (12.1%) |
| 1 Vehicle | 3,370 (23.3%) | 3,916 (44.0%) |
| 2 Vehicles | 5,394 (37.3%) | 2,659 (29.9%) |
| 3 or more Vehicles | 5,299 (36.7%) | 1,254 (14.1%) |
| Total | 14,450 (100.0%) | 8,905 (100.0%) |
Real Estate & Mortgages in Carson City
Real Estate and Mortgage Overview in Carson City
| Characteristic | Without Mortgage | With Mortgage |
| Housing Units | 5,991 | 8,459 |
| Median Property Value | $381,000 | $394,500 |
| Median Household Income | $68,621 | $1,822 |
| Monthly Housing Costs | $507 | $537 |
| Real Estate Taxes | $1,912 | $171 |
Property Value by Mortgage Status in Carson City
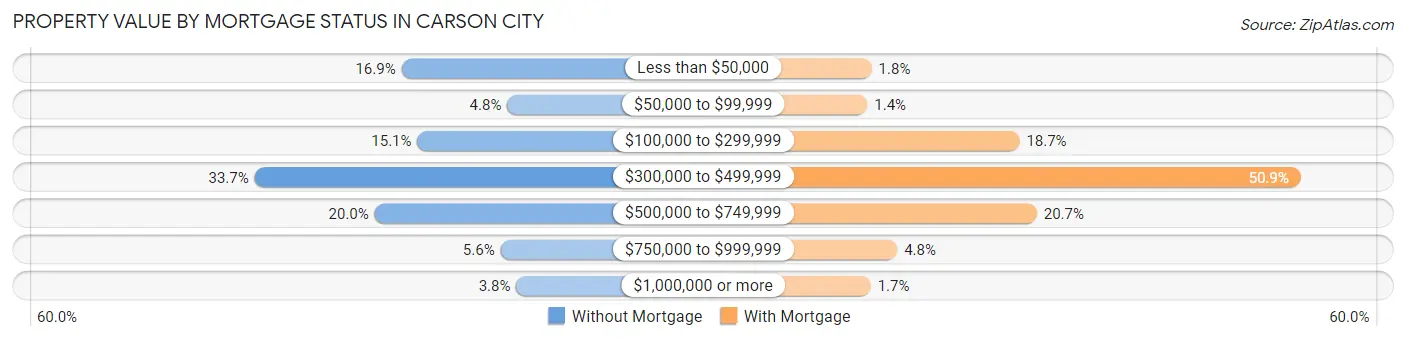
| Property Value | Without Mortgage | With Mortgage |
| Less than $50,000 | 1,014 (16.9%) | 156 (1.8%) |
| $50,000 to $99,999 | 290 (4.8%) | 114 (1.3%) |
| $100,000 to $299,999 | 905 (15.1%) | 1,584 (18.7%) |
| $300,000 to $499,999 | 2,020 (33.7%) | 4,304 (50.9%) |
| $500,000 to $749,999 | 1,198 (20.0%) | 1,752 (20.7%) |
| $750,000 to $999,999 | 336 (5.6%) | 403 (4.8%) |
| $1,000,000 or more | 228 (3.8%) | 146 (1.7%) |
| Total | 5,991 (100.0%) | 8,459 (100.0%) |
Household Income by Mortgage Status in Carson City
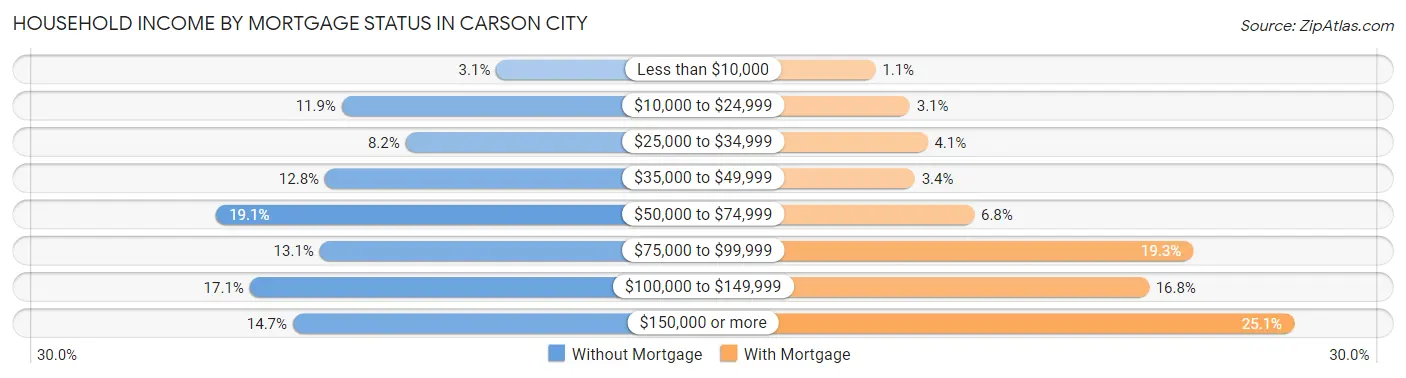
| Household Income | Without Mortgage | With Mortgage |
| Less than $10,000 | 183 (3.0%) | 96 (1.1%) |
| $10,000 to $24,999 | 712 (11.9%) | 262 (3.1%) |
| $25,000 to $34,999 | 493 (8.2%) | 348 (4.1%) |
| $35,000 to $49,999 | 769 (12.8%) | 286 (3.4%) |
| $50,000 to $74,999 | 1,141 (19.1%) | 573 (6.8%) |
| $75,000 to $99,999 | 787 (13.1%) | 1,632 (19.3%) |
| $100,000 to $149,999 | 1,027 (17.1%) | 1,417 (16.8%) |
| $150,000 or more | 879 (14.7%) | 2,119 (25.1%) |
| Total | 5,991 (100.0%) | 8,459 (100.0%) |
Property Value to Household Income Ratio in Carson City
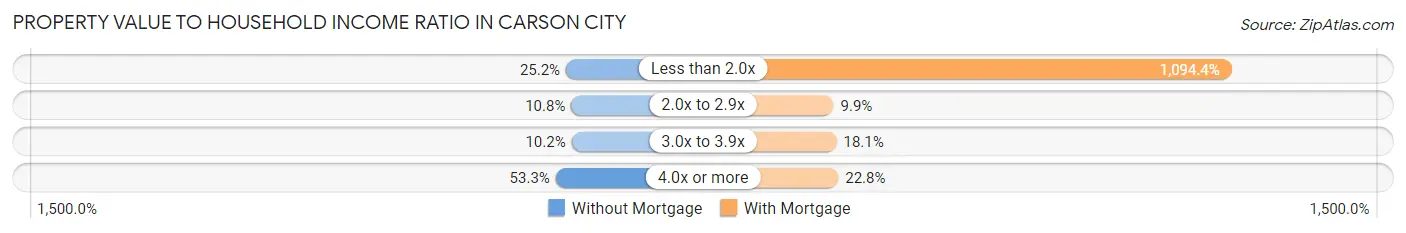
| Value-to-Income Ratio | Without Mortgage | With Mortgage |
| Less than 2.0x | 1,511 (25.2%) | 92,571 (1,094.4%) |
| 2.0x to 2.9x | 648 (10.8%) | 841 (9.9%) |
| 3.0x to 3.9x | 613 (10.2%) | 1,533 (18.1%) |
| 4.0x or more | 3,192 (53.3%) | 1,927 (22.8%) |
| Total | 5,991 (100.0%) | 8,459 (100.0%) |
Real Estate Taxes by Mortgage Status in Carson City
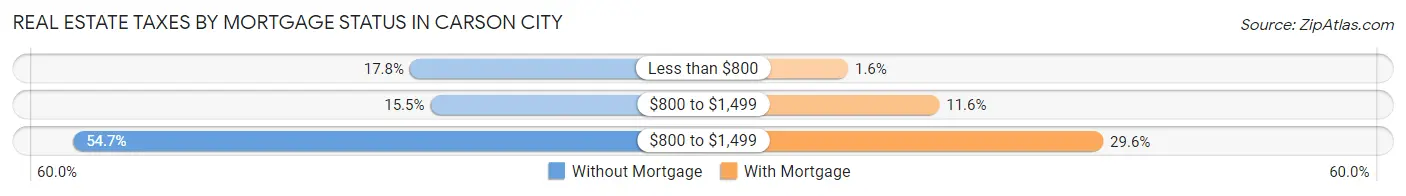
| Property Taxes | Without Mortgage | With Mortgage |
| Less than $800 | 1,066 (17.8%) | 139 (1.6%) |
| $800 to $1,499 | 931 (15.5%) | 985 (11.6%) |
| $800 to $1,499 | 3,275 (54.7%) | 2,504 (29.6%) |
| Total | 5,991 (100.0%) | 8,459 (100.0%) |
Health & Disability in Carson City
Health Insurance Coverage by Age in Carson City
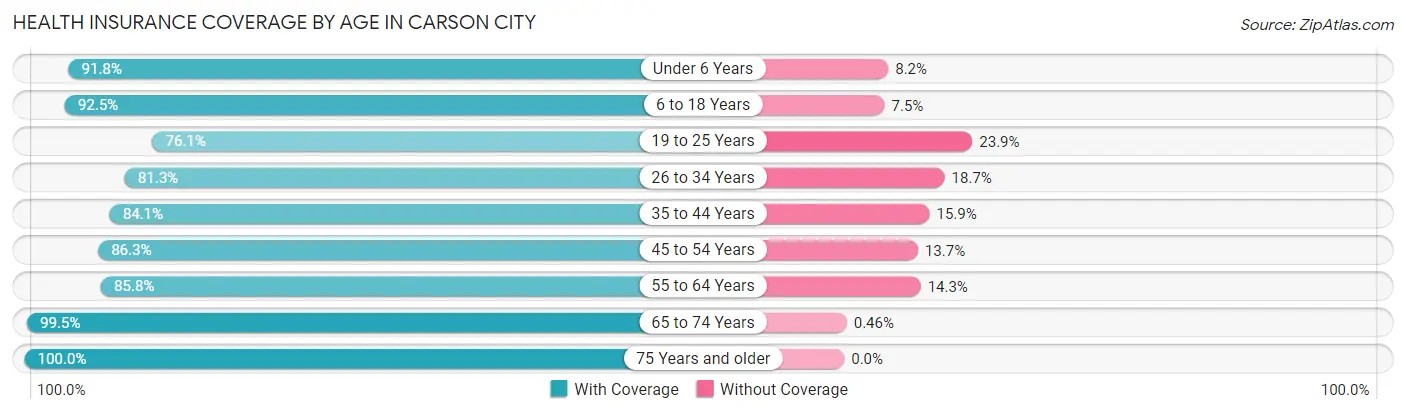
| Age Bracket | With Coverage | Without Coverage |
| Under 6 Years | 3,425 (91.8%) | 306 (8.2%) |
| 6 to 18 Years | 7,916 (92.5%) | 644 (7.5%) |
| 19 to 25 Years | 3,443 (76.1%) | 1,080 (23.9%) |
| 26 to 34 Years | 5,092 (81.3%) | 1,172 (18.7%) |
| 35 to 44 Years | 5,460 (84.1%) | 1,032 (15.9%) |
| 45 to 54 Years | 5,818 (86.3%) | 927 (13.7%) |
| 55 to 64 Years | 6,842 (85.8%) | 1,137 (14.2%) |
| 65 to 74 Years | 6,676 (99.5%) | 31 (0.5%) |
| 75 Years and older | 4,736 (100.0%) | 0 (0.0%) |
| Total | 49,408 (88.6%) | 6,329 (11.4%) |
Health Insurance Coverage by Citizenship Status in Carson City
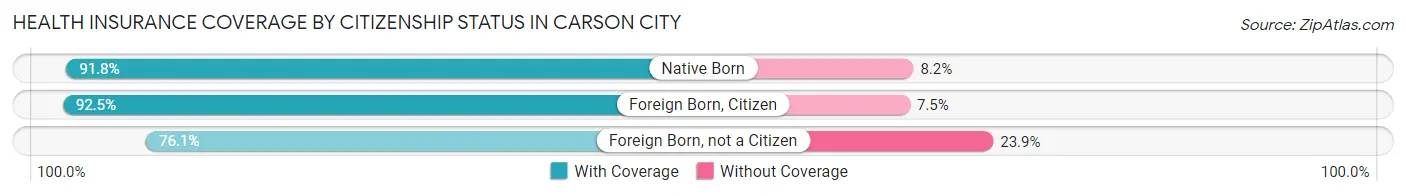
| Citizenship Status | With Coverage | Without Coverage |
| Native Born | 3,425 (91.8%) | 306 (8.2%) |
| Foreign Born, Citizen | 7,916 (92.5%) | 644 (7.5%) |
| Foreign Born, not a Citizen | 3,443 (76.1%) | 1,080 (23.9%) |
Health Insurance Coverage by Household Income in Carson City
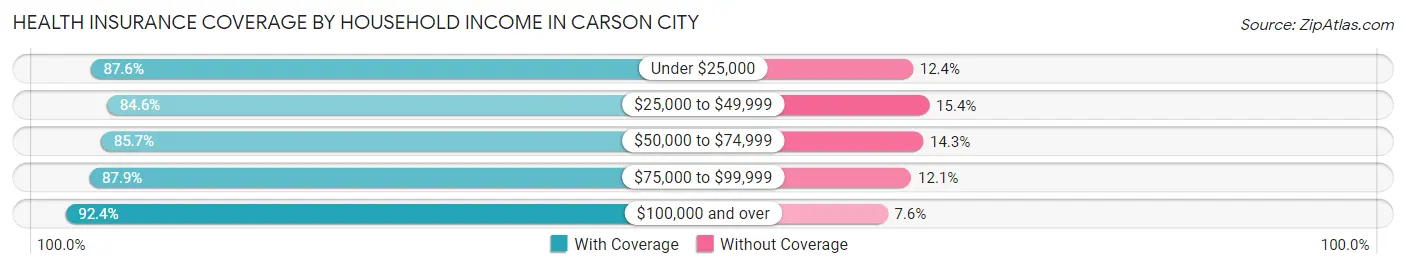
| Household Income | With Coverage | Without Coverage |
| Under $25,000 | 5,078 (87.6%) | 716 (12.4%) |
| $25,000 to $49,999 | 7,329 (84.6%) | 1,337 (15.4%) |
| $50,000 to $74,999 | 9,648 (85.7%) | 1,607 (14.3%) |
| $75,000 to $99,999 | 7,619 (87.9%) | 1,045 (12.1%) |
| $100,000 and over | 19,585 (92.4%) | 1,618 (7.6%) |
Public vs Private Health Insurance Coverage by Age in Carson City
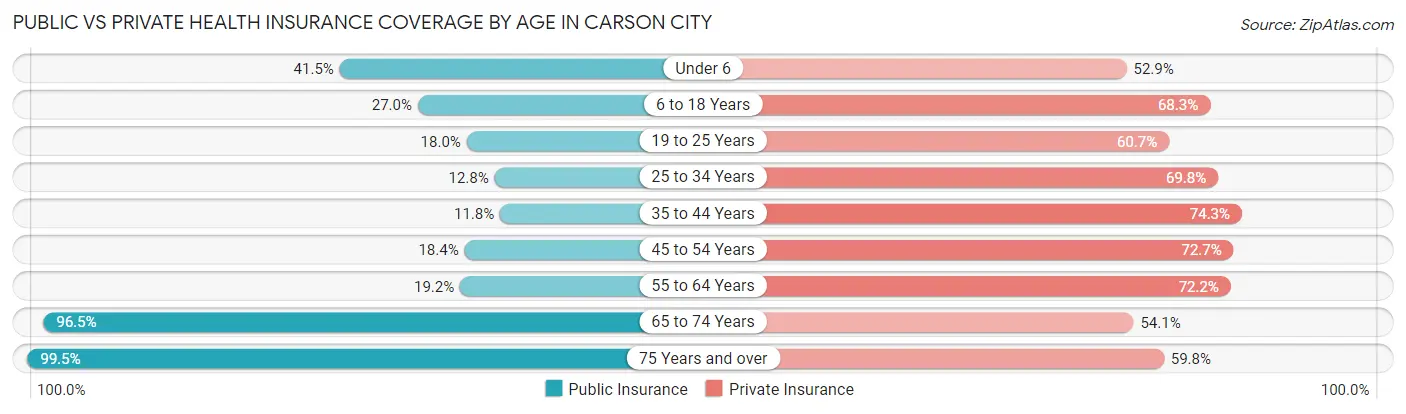
| Age Bracket | Public Insurance | Private Insurance |
| Under 6 | 1,549 (41.5%) | 1,972 (52.8%) |
| 6 to 18 Years | 2,313 (27.0%) | 5,849 (68.3%) |
| 19 to 25 Years | 812 (17.9%) | 2,747 (60.7%) |
| 25 to 34 Years | 800 (12.8%) | 4,374 (69.8%) |
| 35 to 44 Years | 763 (11.7%) | 4,820 (74.3%) |
| 45 to 54 Years | 1,238 (18.3%) | 4,904 (72.7%) |
| 55 to 64 Years | 1,530 (19.2%) | 5,759 (72.2%) |
| 65 to 74 Years | 6,474 (96.5%) | 3,631 (54.1%) |
| 75 Years and over | 4,712 (99.5%) | 2,830 (59.8%) |
| Total | 20,191 (36.2%) | 36,886 (66.2%) |
Disability Status by Sex by Age in Carson City
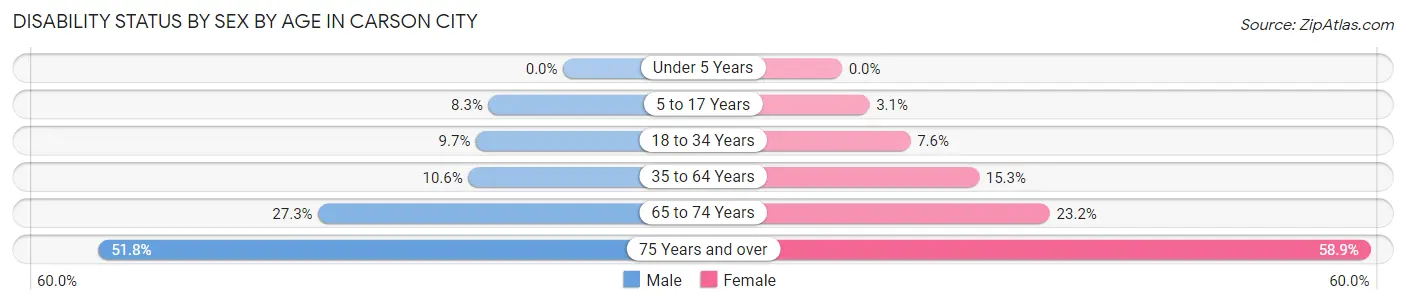
| Age Bracket | Male | Female |
| Under 5 Years | 0 (0.0%) | 0 (0.0%) |
| 5 to 17 Years | 362 (8.3%) | 131 (3.0%) |
| 18 to 34 Years | 588 (9.7%) | 408 (7.6%) |
| 35 to 64 Years | 1,151 (10.6%) | 1,574 (15.3%) |
| 65 to 74 Years | 847 (27.3%) | 834 (23.2%) |
| 75 Years and over | 1,063 (51.8%) | 1,581 (58.9%) |
Disability Class by Sex by Age in Carson City
Disability Class: Hearing Difficulty
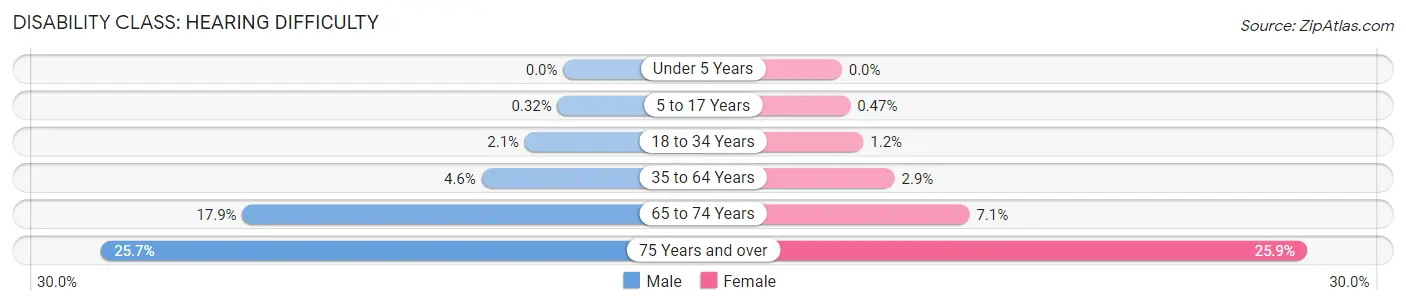
| Age Bracket | Male | Female |
| Under 5 Years | 0 (0.0%) | 0 (0.0%) |
| 5 to 17 Years | 14 (0.3%) | 20 (0.5%) |
| 18 to 34 Years | 130 (2.1%) | 64 (1.2%) |
| 35 to 64 Years | 496 (4.5%) | 303 (2.9%) |
| 65 to 74 Years | 555 (17.9%) | 256 (7.1%) |
| 75 Years and over | 528 (25.7%) | 695 (25.9%) |
Disability Class: Vision Difficulty
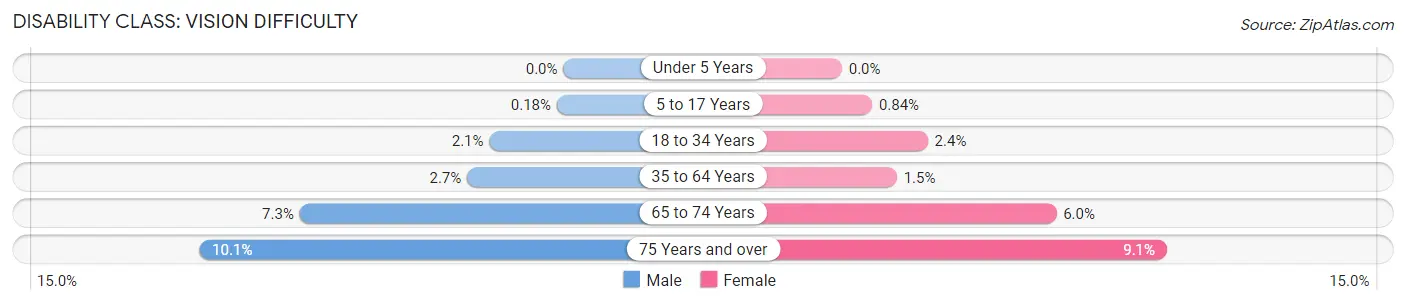
| Age Bracket | Male | Female |
| Under 5 Years | 0 (0.0%) | 0 (0.0%) |
| 5 to 17 Years | 8 (0.2%) | 36 (0.8%) |
| 18 to 34 Years | 125 (2.1%) | 128 (2.4%) |
| 35 to 64 Years | 292 (2.7%) | 158 (1.5%) |
| 65 to 74 Years | 228 (7.3%) | 215 (6.0%) |
| 75 Years and over | 208 (10.1%) | 243 (9.0%) |
Disability Class: Cognitive Difficulty
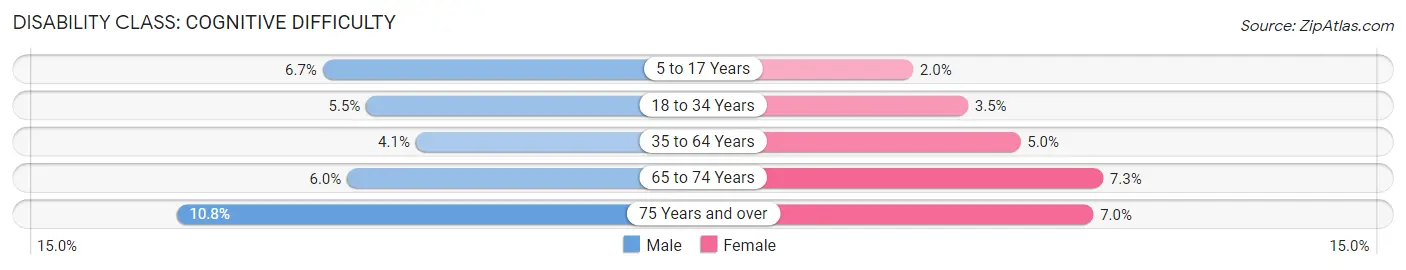
| Age Bracket | Male | Female |
| 5 to 17 Years | 292 (6.7%) | 85 (2.0%) |
| 18 to 34 Years | 333 (5.5%) | 188 (3.5%) |
| 35 to 64 Years | 448 (4.1%) | 512 (5.0%) |
| 65 to 74 Years | 187 (6.0%) | 262 (7.3%) |
| 75 Years and over | 221 (10.8%) | 188 (7.0%) |
Disability Class: Ambulatory Difficulty
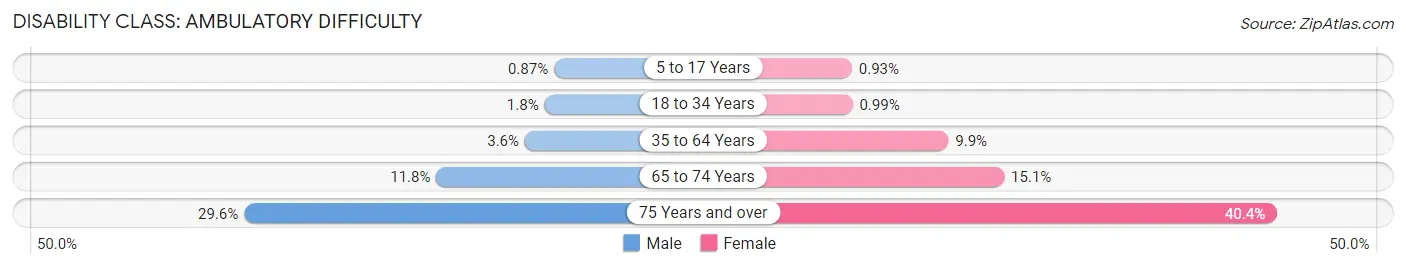
| Age Bracket | Male | Female |
| 5 to 17 Years | 38 (0.9%) | 40 (0.9%) |
| 18 to 34 Years | 106 (1.8%) | 53 (1.0%) |
| 35 to 64 Years | 389 (3.6%) | 1,020 (9.9%) |
| 65 to 74 Years | 366 (11.8%) | 543 (15.1%) |
| 75 Years and over | 608 (29.6%) | 1,084 (40.4%) |
Disability Class: Self-Care Difficulty
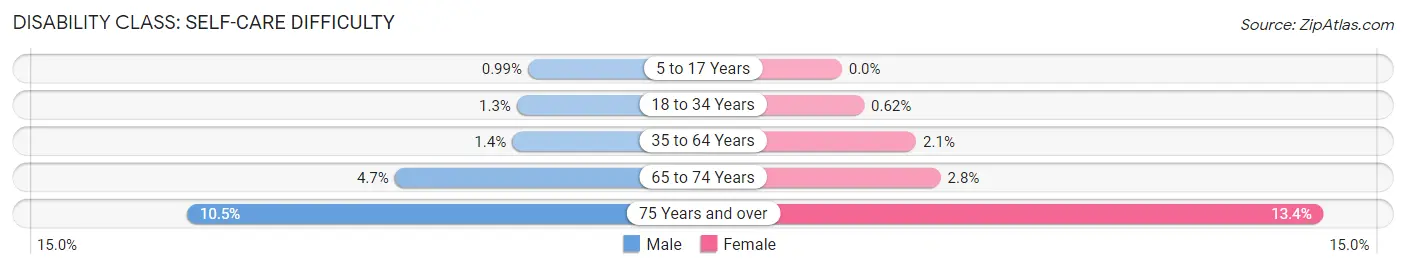
| Age Bracket | Male | Female |
| 5 to 17 Years | 43 (1.0%) | 0 (0.0%) |
| 18 to 34 Years | 79 (1.3%) | 33 (0.6%) |
| 35 to 64 Years | 156 (1.4%) | 213 (2.1%) |
| 65 to 74 Years | 146 (4.7%) | 99 (2.8%) |
| 75 Years and over | 215 (10.5%) | 360 (13.4%) |
Technology Access in Carson City
Computing Device Access in Carson City
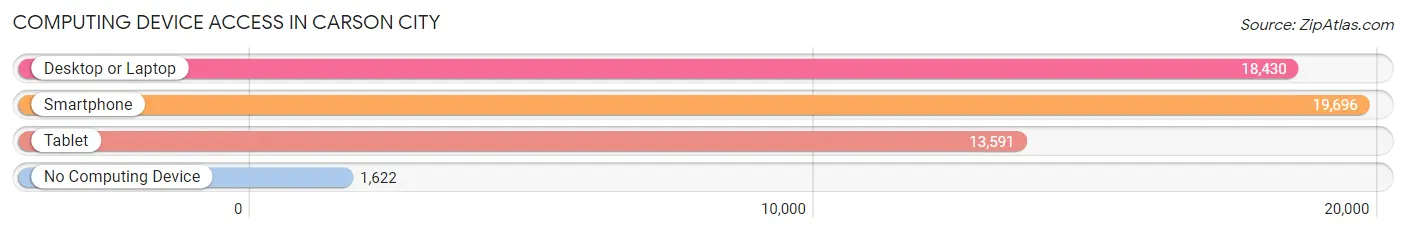
| Device Type | # Households | % Households |
| Desktop or Laptop | 18,430 | 78.9% |
| Smartphone | 19,696 | 84.3% |
| Tablet | 13,591 | 58.2% |
| No Computing Device | 1,622 | 6.9% |
| Total | 23,355 | 100.0% |
Internet Access in Carson City
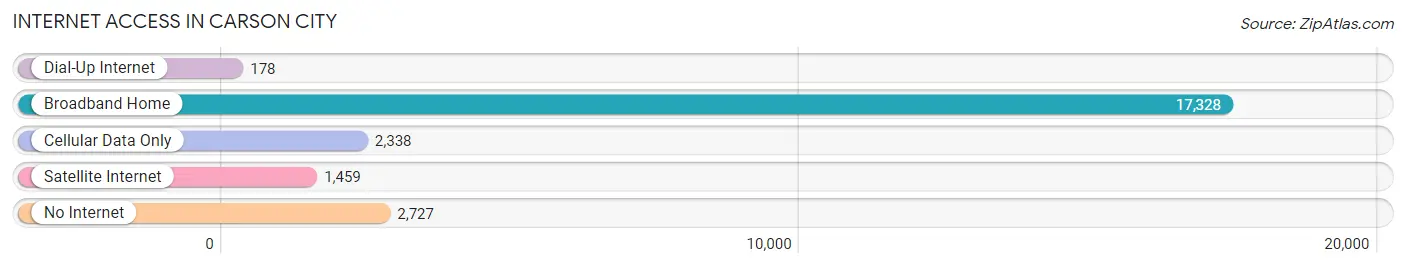
| Internet Type | # Households | % Households |
| Dial-Up Internet | 178 | 0.8% |
| Broadband Home | 17,328 | 74.2% |
| Cellular Data Only | 2,338 | 10.0% |
| Satellite Internet | 1,459 | 6.2% |
| No Internet | 2,727 | 11.7% |
| Total | 23,355 | 100.0% |
Carson City Summary
Carson City is the capital of the state of Nevada and is located in the western part of the state. It is the county seat of Carson City County and is the only incorporated city in the county. The city is named after the mountain man Kit Carson, who was a scout for John C. Fremont's expedition in 1843.
Geography
Carson City is located in the western part of Nevada, about 30 miles south of Reno and about 45 miles east of Lake Tahoe. The city is situated in the Carson Valley, which is surrounded by the Sierra Nevada Mountains to the west and the Carson Range to the east. The city covers an area of about 50 square miles and has an elevation of 4,800 feet.
Climate
Carson City has a semi-arid climate with hot summers and cold winters. The average high temperature in July is 90°F and the average low temperature in January is 24°F. The city receives an average of 8.5 inches of precipitation per year, with most of it falling in the winter months.
Demographics
As of the 2010 census, Carson City had a population of 55,274. The racial makeup of the city was 79.2% White, 4.3% African American, 1.2% Native American, 4.2% Asian, 0.2% Pacific Islander, and 10.1% from other races. Hispanic or Latino of any race were 19.6% of the population.
Economy
Carson City is the economic center of western Nevada. The city is home to a variety of industries, including manufacturing, tourism, government, and retail. The largest employers in the city are the state government, the Carson City School District, and the Carson Tahoe Regional Healthcare System.
The city is also home to a number of casinos, including the Carson Nugget, the Carson Valley Inn, and the Silver Legacy Resort Casino. Tourism is a major industry in the city, with visitors coming to enjoy the city's many attractions, including the Nevada State Museum, the Nevada State Railroad Museum, and the Nevada State Capitol.
History
Carson City was founded in 1858 as a trading post and was named after the mountain man Kit Carson. The city was incorporated in 1875 and became the state capital in 1864. The city grew rapidly in the late 19th century, becoming a major center for mining and ranching.
In the early 20th century, the city's economy shifted to tourism and government. The city was the site of the Nevada State Fair from 1910 to 1942 and hosted the National Championship Air Races from 1964 to 2019.
Today, Carson City is a vibrant city with a diverse economy and a rich history. The city is home to a variety of attractions, including the Nevada State Capitol, the Nevada State Museum, and the Nevada State Railroad Museum. The city is also home to a number of casinos, making it a popular destination for tourists and gamblers alike.
Common Questions
What is Per Capita Income in Carson City?
Per Capita income in Carson City is $37,677.
What is the Median Family Income in Carson City?
Median Family Income in Carson City is $82,109.
What is the Median Household income in Carson City?
Median Household Income in Carson City is $67,465.
What is Income or Wage Gap in Carson City?
Income or Wage Gap in Carson City is 19.9%.
Women in Carson City earn 80.1 cents for every dollar earned by a man.
What is Family Income Deficit in Carson City?
Family Income Deficit in Carson City is $8,797.
Families that are below poverty line in Carson City earn $8,797 less on average than the poverty threshold level.
What is Inequality or Gini Index in Carson City?
Inequality or Gini Index in Carson City is 0.46.
What is the Total Population of Carson City?
Total Population of Carson City is 58,249.
What is the Total Male Population of Carson City?
Total Male Population of Carson City is 30,199.
What is the Total Female Population of Carson City?
Total Female Population of Carson City is 28,050.
What is the Ratio of Males per 100 Females in Carson City?
There are 107.66 Males per 100 Females in Carson City.
What is the Ratio of Females per 100 Males in Carson City?
There are 92.88 Females per 100 Males in Carson City.
What is the Median Population Age in Carson City?
Median Population Age in Carson City is 42.1 Years.
What is the Average Family Size in Carson City
Average Family Size in Carson City is 2.9 People.
What is the Average Household Size in Carson City
Average Household Size in Carson City is 2.4 People.
How Large is the Labor Force in Carson City?
There are 28,759 People in the Labor Forcein in Carson City.
What is the Percentage of People in the Labor Force in Carson City?
60.0% of People are in the Labor Force in Carson City.
What is the Unemployment Rate in Carson City?
Unemployment Rate in Carson City is 4.7%.