Zip Codes with the Highest Percentage of Population Employed in Architecture & Engineering in Ellicott City, MD
RELATED REPORTS & OPTIONS
Architecture & Engineering
Ellicott City
Compare Zip Codes
Map of Zip Codes with the Highest Percentage of Population Employed in Architecture & Engineering in Ellicott City
4.4%
5.2%
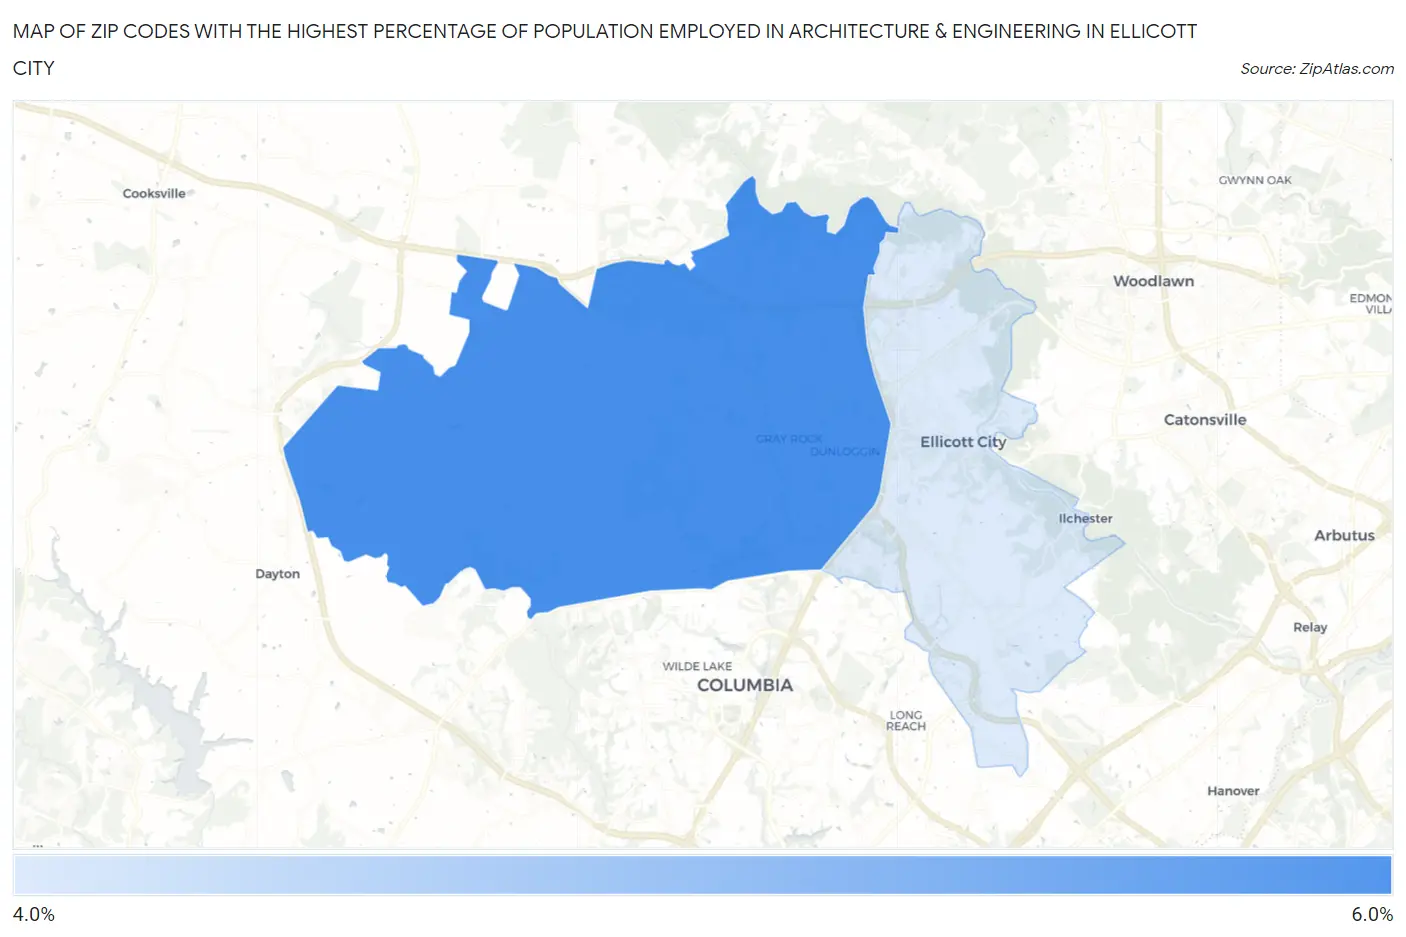
Zip Codes with the Highest Percentage of Population Employed in Architecture & Engineering in Ellicott City, MD
| Zip Code | % Employed | vs State | vs National | |
| 1. | 21042 | 5.2% | 2.4%(+2.86)#38 | 2.1%(+3.10)#1,487 |
| 2. | 21043 | 4.4% | 2.4%(+1.99)#50 | 2.1%(+2.23)#2,283 |
1
Common Questions
What are the Top Zip Codes with the Highest Percentage of Population Employed in Architecture & Engineering in Ellicott City, MD?
Top Zip Codes with the Highest Percentage of Population Employed in Architecture & Engineering in Ellicott City, MD are:
What zip code has the Highest Percentage of Population Employed in Architecture & Engineering in Ellicott City, MD?
21042 has the Highest Percentage of Population Employed in Architecture & Engineering in Ellicott City, MD with 5.2%.
What is the Percentage of Population Employed in Architecture & Engineering in Ellicott City, MD?
Percentage of Population Employed in Architecture & Engineering in Ellicott City is 4.2%.
What is the Percentage of Population Employed in Architecture & Engineering in Maryland?
Percentage of Population Employed in Architecture & Engineering in Maryland is 2.4%.
What is the Percentage of Population Employed in Architecture & Engineering in the United States?
Percentage of Population Employed in Architecture & Engineering in the United States is 2.1%.