Siracusaville, LA Map & Demographics
Siracusaville Map
Siracusaville Overview
$34,511
PER CAPITA INCOME
$73,803
AVG FAMILY INCOME
$73,310
AVG HOUSEHOLD INCOME
0.23
INEQUALITY / GINI INDEX
369
TOTAL POPULATION
170
MALE POPULATION
199
FEMALE POPULATION
85.43
MALES / 100 FEMALES
117.06
FEMALES / 100 MALES
69.1
MEDIAN AGE
2.8
AVG FAMILY SIZE
2.4
AVG HOUSEHOLD SIZE
110
LABOR FORCE [ PEOPLE ]
29.8%
PERCENT IN LABOR FORCE
Income in Siracusaville
Income Overview in Siracusaville
Per Capita Income in Siracusaville is $34,511, while median incomes of families and households are $73,803 and $73,310 respectively.
| Characteristic | Number | Measure |
| Per Capita Income | 369 | $34,511 |
| Median Family Income | 124 | $73,803 |
| Mean Family Income | 124 | $85,481 |
| Median Household Income | 152 | $73,310 |
| Mean Household Income | 152 | $78,576 |
| Income Deficit | 124 | $0 |
| Wage / Income Gap (%) | 369 | 0.00% |
| Wage / Income Gap ($) | 369 | 100.00¢ per $1 |
| Gini / Inequality Index | 369 | 0.23 |
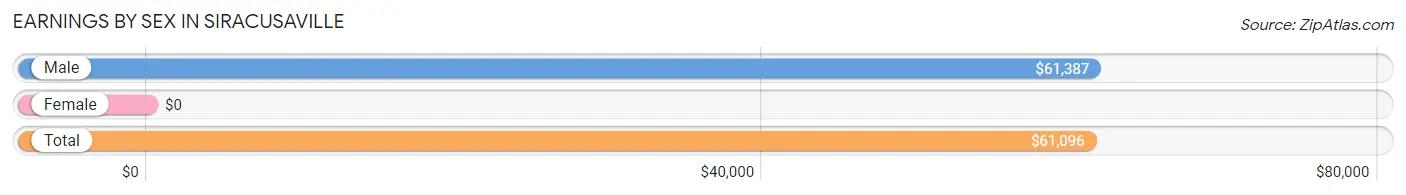
Earnings by Sex in Siracusaville
| Sex | Number | Average Earnings |
| Male | 121 (87.7%) | $61,387 |
| Female | 17 (12.3%) | $0 |
| Total | 138 (100.0%) | $61,096 |
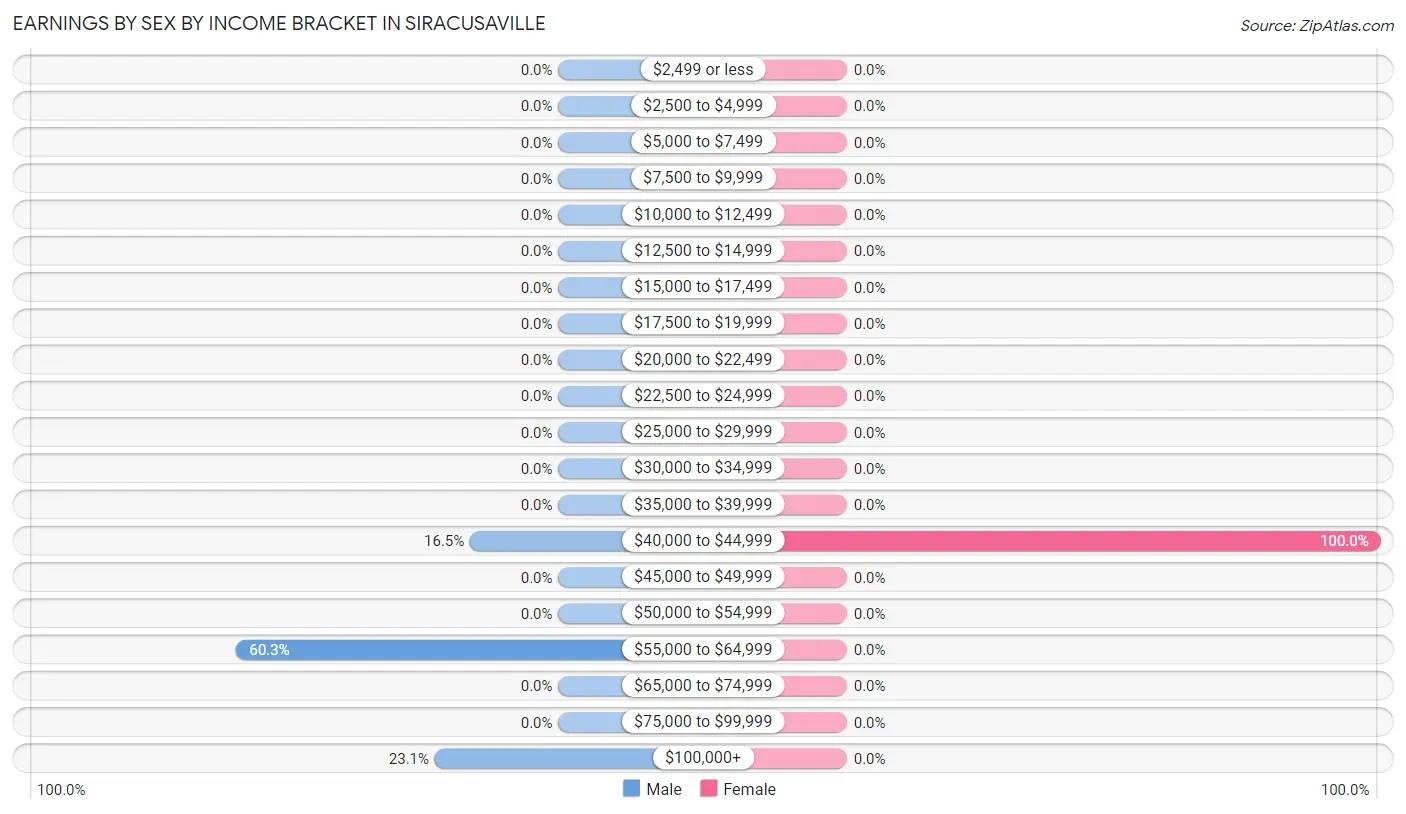
Earnings by Sex by Income Bracket in Siracusaville
The most common earnings brackets in Siracusaville are $55,000 to $64,999 for men (73 | 60.3%) and $40,000 to $44,999 for women (17 | 100.0%).
| Income | Male | Female |
| $2,499 or less | 0 (0.0%) | 0 (0.0%) |
| $2,500 to $4,999 | 0 (0.0%) | 0 (0.0%) |
| $5,000 to $7,499 | 0 (0.0%) | 0 (0.0%) |
| $7,500 to $9,999 | 0 (0.0%) | 0 (0.0%) |
| $10,000 to $12,499 | 0 (0.0%) | 0 (0.0%) |
| $12,500 to $14,999 | 0 (0.0%) | 0 (0.0%) |
| $15,000 to $17,499 | 0 (0.0%) | 0 (0.0%) |
| $17,500 to $19,999 | 0 (0.0%) | 0 (0.0%) |
| $20,000 to $22,499 | 0 (0.0%) | 0 (0.0%) |
| $22,500 to $24,999 | 0 (0.0%) | 0 (0.0%) |
| $25,000 to $29,999 | 0 (0.0%) | 0 (0.0%) |
| $30,000 to $34,999 | 0 (0.0%) | 0 (0.0%) |
| $35,000 to $39,999 | 0 (0.0%) | 0 (0.0%) |
| $40,000 to $44,999 | 20 (16.5%) | 17 (100.0%) |
| $45,000 to $49,999 | 0 (0.0%) | 0 (0.0%) |
| $50,000 to $54,999 | 0 (0.0%) | 0 (0.0%) |
| $55,000 to $64,999 | 73 (60.3%) | 0 (0.0%) |
| $65,000 to $74,999 | 0 (0.0%) | 0 (0.0%) |
| $75,000 to $99,999 | 0 (0.0%) | 0 (0.0%) |
| $100,000+ | 28 (23.1%) | 0 (0.0%) |
| Total | 121 (100.0%) | 17 (100.0%) |
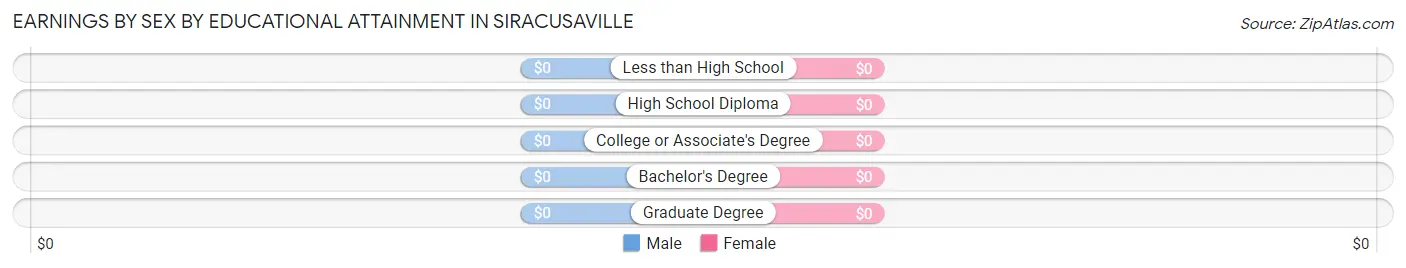
Earnings by Sex by Educational Attainment in Siracusaville
| Educational Attainment | Male Income | Female Income |
| Less than High School | - | - |
| High School Diploma | - | - |
| College or Associate's Degree | - | - |
| Bachelor's Degree | - | - |
| Graduate Degree | - | - |
| Total | $61,387 | $0 |
Family Income in Siracusaville
Family Income Brackets in Siracusaville
According to the Siracusaville family income data, there are 88 families falling into the $50,000 to $74,999 income range, which is the most common income bracket and makes up 71.0% of all families.
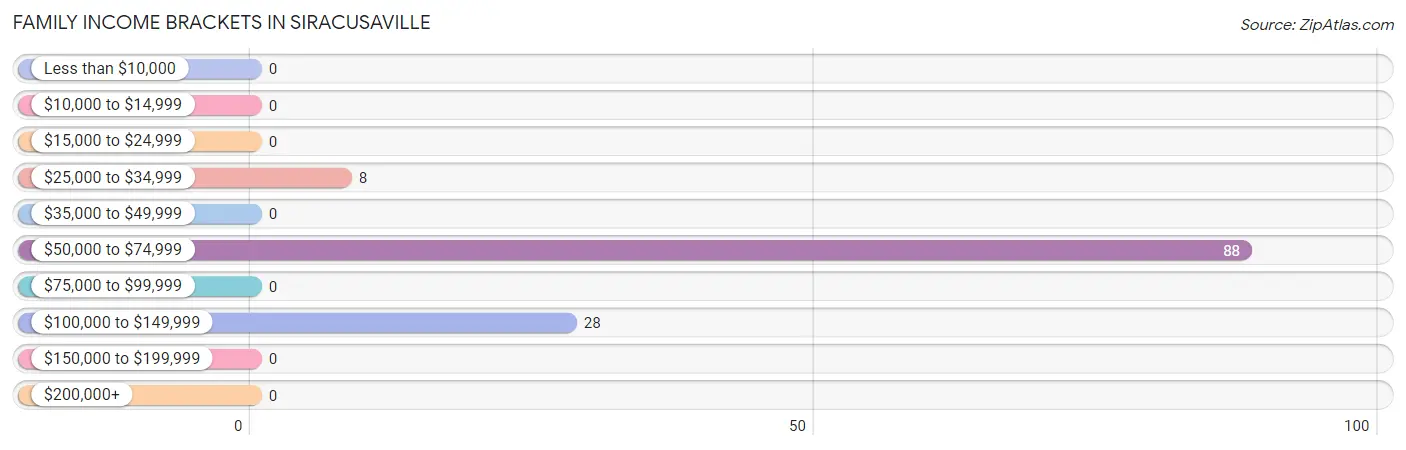
| Income Bracket | # Families | % Families |
| Less than $10,000 | 0 | 0.0% |
| $10,000 to $14,999 | 0 | 0.0% |
| $15,000 to $24,999 | 0 | 0.0% |
| $25,000 to $34,999 | 8 | 6.5% |
| $35,000 to $49,999 | 0 | 0.0% |
| $50,000 to $74,999 | 88 | 71.0% |
| $75,000 to $99,999 | 0 | 0.0% |
| $100,000 to $149,999 | 28 | 22.6% |
| $150,000 to $199,999 | 0 | 0.0% |
| $200,000+ | 0 | 0.0% |
Family Income by Famaliy Size in Siracusaville
2-person families (124 | 100.0%) account for the highest median family income in Siracusaville with $73,803 per family, while 2-person families (124 | 100.0%) have the highest median income of $36,902 per family member.
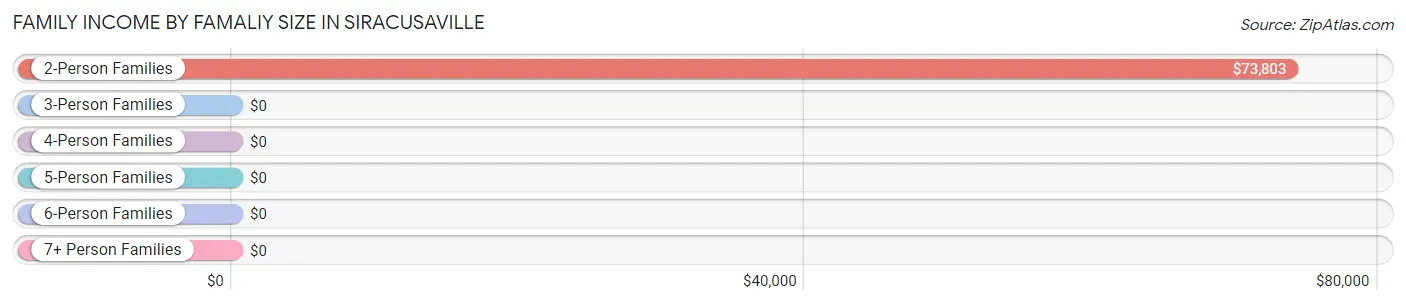
| Income Bracket | # Families | Median Income |
| 2-Person Families | 124 (100.0%) | $73,803 |
| 3-Person Families | 0 (0.0%) | $0 |
| 4-Person Families | 0 (0.0%) | $0 |
| 5-Person Families | 0 (0.0%) | $0 |
| 6-Person Families | 0 (0.0%) | $0 |
| 7+ Person Families | 0 (0.0%) | $0 |
| Total | 124 (100.0%) | $73,803 |
Family Income by Number of Earners in Siracusaville
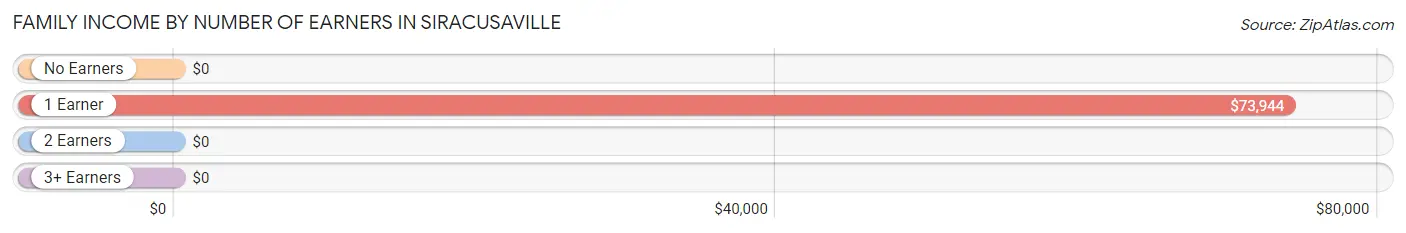
| Number of Earners | # Families | Median Income |
| No Earners | 8 (6.5%) | $0 |
| 1 Earner | 116 (93.5%) | $73,944 |
| 2 Earners | 0 (0.0%) | $0 |
| 3+ Earners | 0 (0.0%) | $0 |
| Total | 124 (100.0%) | $73,803 |
Household Income in Siracusaville
Household Income Brackets in Siracusaville
With 108 households falling in the category, the $50,000 to $74,999 income range is the most frequent in Siracusaville, accounting for 71.1% of all households.
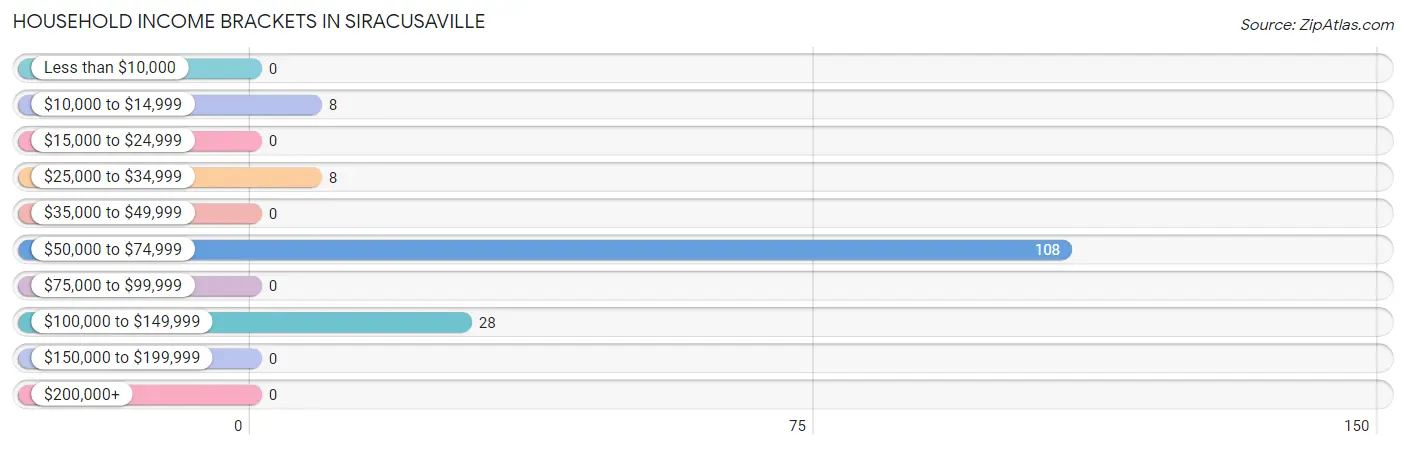
| Income Bracket | # Households | % Households |
| Less than $10,000 | 0 | 0.0% |
| $10,000 to $14,999 | 8 | 5.3% |
| $15,000 to $24,999 | 0 | 0.0% |
| $25,000 to $34,999 | 8 | 5.3% |
| $35,000 to $49,999 | 0 | 0.0% |
| $50,000 to $74,999 | 108 | 71.1% |
| $75,000 to $99,999 | 0 | 0.0% |
| $100,000 to $149,999 | 28 | 18.4% |
| $150,000 to $199,999 | 0 | 0.0% |
| $200,000+ | 0 | 0.0% |
Household Income by Householder Age in Siracusaville
The median household income in Siracusaville is $73,310, with the highest median household income of $73,451 found in the 65+ years age bracket for the primary householder. A total of 144 households (94.7%) fall into this category.
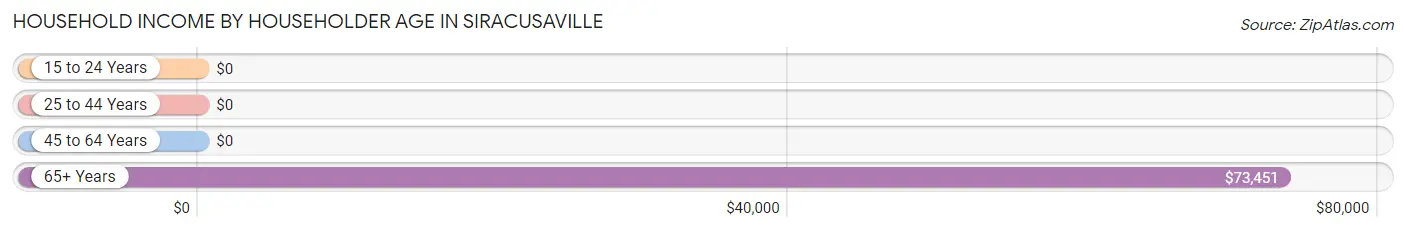
| Income Bracket | # Households | Median Income |
| 15 to 24 Years | 0 (0.0%) | $0 |
| 25 to 44 Years | 0 (0.0%) | $0 |
| 45 to 64 Years | 8 (5.3%) | $0 |
| 65+ Years | 144 (94.7%) | $73,451 |
| Total | 152 (100.0%) | $73,310 |
Poverty in Siracusaville
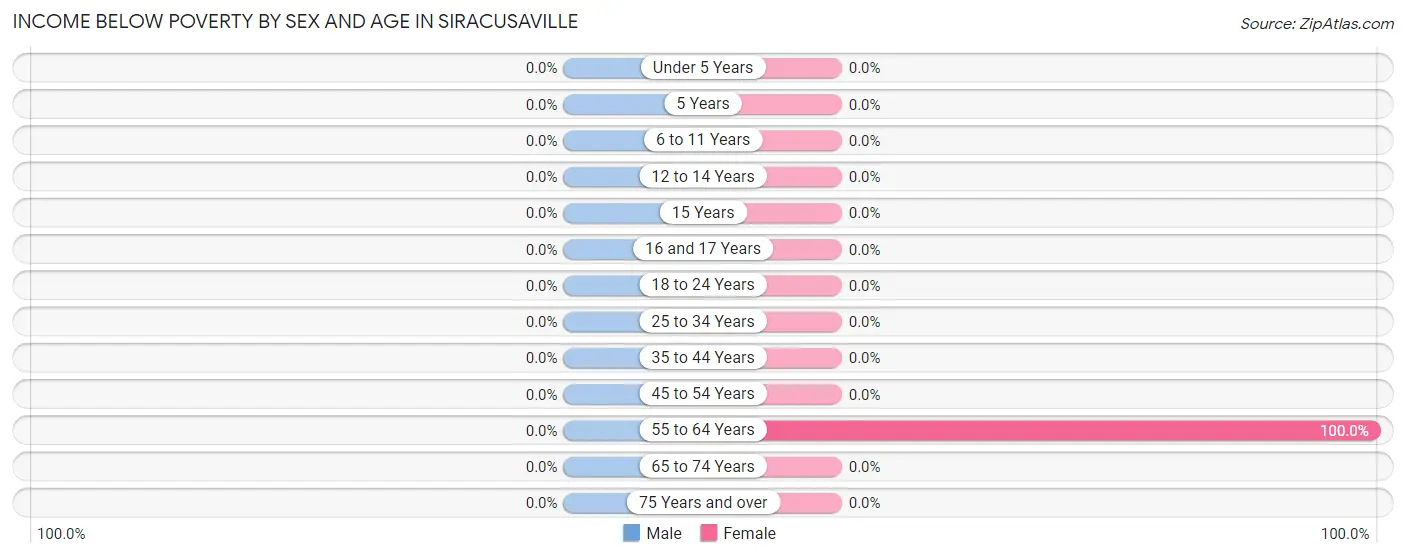
Income Below Poverty by Sex and Age in Siracusaville
| Age Bracket | Male | Female |
| Under 5 Years | 0 (0.0%) | 0 (0.0%) |
| 5 Years | 0 (0.0%) | 0 (0.0%) |
| 6 to 11 Years | 0 (0.0%) | 0 (0.0%) |
| 12 to 14 Years | 0 (0.0%) | 0 (0.0%) |
| 15 Years | 0 (0.0%) | 0 (0.0%) |
| 16 and 17 Years | 0 (0.0%) | 0 (0.0%) |
| 18 to 24 Years | 0 (0.0%) | 0 (0.0%) |
| 25 to 34 Years | 0 (0.0%) | 0 (0.0%) |
| 35 to 44 Years | 0 (0.0%) | 0 (0.0%) |
| 45 to 54 Years | 0 (0.0%) | 0 (0.0%) |
| 55 to 64 Years | 0 (0.0%) | 8 (100.0%) |
| 65 to 74 Years | 0 (0.0%) | 0 (0.0%) |
| 75 Years and over | 0 (0.0%) | 0 (0.0%) |
| Total | 0 (0.0%) | 8 (4.0%) |
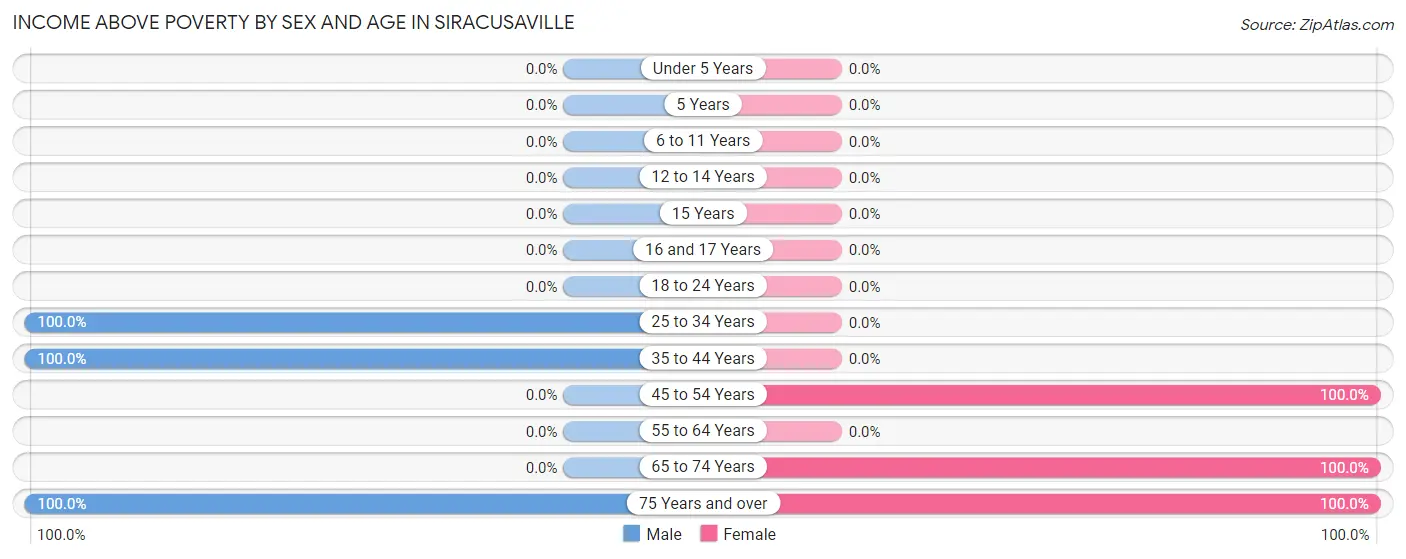
Income Above Poverty by Sex and Age in Siracusaville
According to the poverty statistics in Siracusaville, males aged 25 to 34 years and females aged 45 to 54 years are the age groups that are most secure financially, with 100.0% of males and 100.0% of females in these age groups living above the poverty line.
| Age Bracket | Male | Female |
| Under 5 Years | 0 (0.0%) | 0 (0.0%) |
| 5 Years | 0 (0.0%) | 0 (0.0%) |
| 6 to 11 Years | 0 (0.0%) | 0 (0.0%) |
| 12 to 14 Years | 0 (0.0%) | 0 (0.0%) |
| 15 Years | 0 (0.0%) | 0 (0.0%) |
| 16 and 17 Years | 0 (0.0%) | 0 (0.0%) |
| 18 to 24 Years | 0 (0.0%) | 0 (0.0%) |
| 25 to 34 Years | 41 (100.0%) | 0 (0.0%) |
| 35 to 44 Years | 73 (100.0%) | 0 (0.0%) |
| 45 to 54 Years | 0 (0.0%) | 61 (100.0%) |
| 55 to 64 Years | 0 (0.0%) | 0 (0.0%) |
| 65 to 74 Years | 0 (0.0%) | 59 (100.0%) |
| 75 Years and over | 56 (100.0%) | 71 (100.0%) |
| Total | 170 (100.0%) | 191 (96.0%) |
Income Below Poverty Among Married-Couple Families in Siracusaville
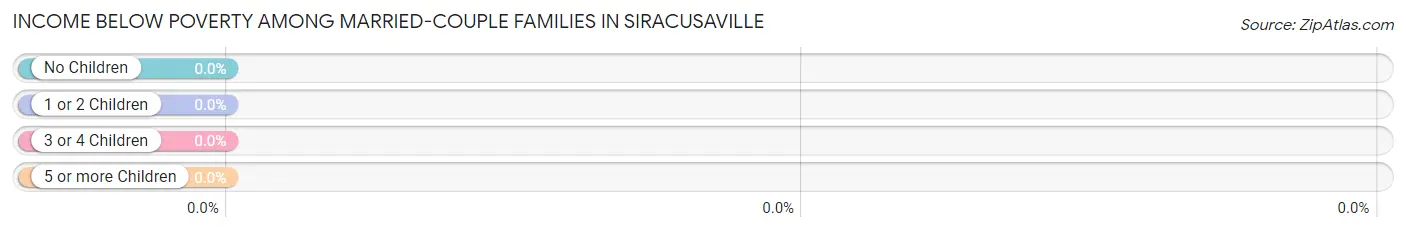
| Children | Above Poverty | Below Poverty |
| No Children | 28 (100.0%) | 0 (0.0%) |
| 1 or 2 Children | 0 (0.0%) | 0 (0.0%) |
| 3 or 4 Children | 0 (0.0%) | 0 (0.0%) |
| 5 or more Children | 0 (0.0%) | 0 (0.0%) |
| Total | 28 (100.0%) | 0 (0.0%) |
Income Below Poverty Among Single-Parent Households in Siracusaville
| Children | Single Father | Single Mother |
| No Children | 0 (0.0%) | 0 (0.0%) |
| 1 or 2 Children | 0 (0.0%) | 0 (0.0%) |
| 3 or 4 Children | 0 (0.0%) | 0 (0.0%) |
| 5 or more Children | 0 (0.0%) | 0 (0.0%) |
| Total | 0 (0.0%) | 0 (0.0%) |
Income Below Poverty Among Married-Couple vs Single-Parent Households in Siracusaville
| Children | Married-Couple Families | Single-Parent Households |
| No Children | 0 (0.0%) | 0 (0.0%) |
| 1 or 2 Children | 0 (0.0%) | 0 (0.0%) |
| 3 or 4 Children | 0 (0.0%) | 0 (0.0%) |
| 5 or more Children | 0 (0.0%) | 0 (0.0%) |
| Total | 0 (0.0%) | 0 (0.0%) |
Race in Siracusaville
The most populous races in Siracusaville are , and Black / African American (369 | 100.0%).
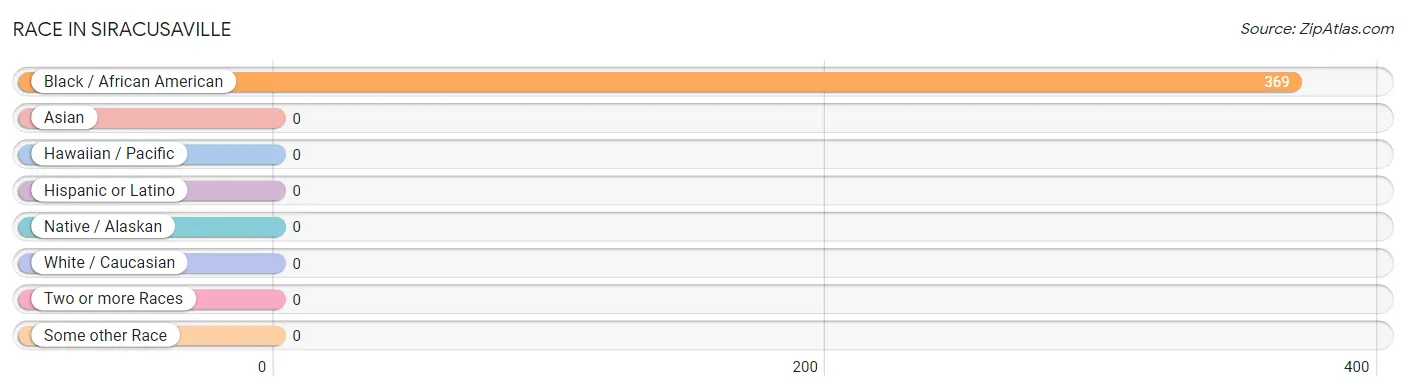
| Race | # Population | % Population |
| Asian | 0 | 0.0% |
| Black / African American | 369 | 100.0% |
| Hawaiian / Pacific | 0 | 0.0% |
| Hispanic or Latino | 0 | 0.0% |
| Native / Alaskan | 0 | 0.0% |
| White / Caucasian | 0 | 0.0% |
| Two or more Races | 0 | 0.0% |
| Some other Race | 0 | 0.0% |
| Total | 369 | 100.0% |
Ancestry in Siracusaville

| Ancestry | # Population | % Population | View All 0 Rows |
Immigrants in Siracusaville

| Immigration Origin | # Population | % Population | View All 0 Rows |
Sex and Age in Siracusaville
Sex and Age in Siracusaville
The most populous age groups in Siracusaville are 40 to 44 Years (73 | 42.9%) for men and 80 to 84 Years (71 | 35.7%) for women.
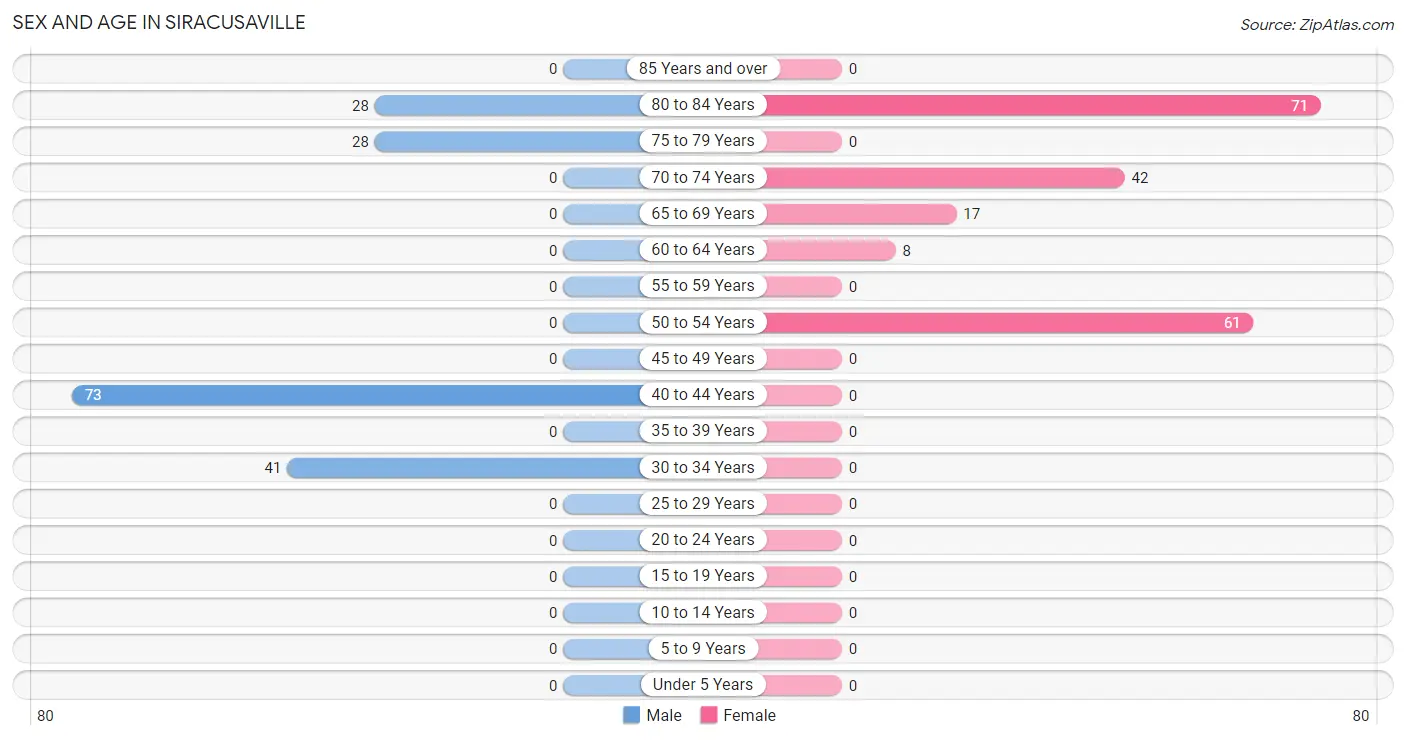
| Age Bracket | Male | Female |
| Under 5 Years | 0 (0.0%) | 0 (0.0%) |
| 5 to 9 Years | 0 (0.0%) | 0 (0.0%) |
| 10 to 14 Years | 0 (0.0%) | 0 (0.0%) |
| 15 to 19 Years | 0 (0.0%) | 0 (0.0%) |
| 20 to 24 Years | 0 (0.0%) | 0 (0.0%) |
| 25 to 29 Years | 0 (0.0%) | 0 (0.0%) |
| 30 to 34 Years | 41 (24.1%) | 0 (0.0%) |
| 35 to 39 Years | 0 (0.0%) | 0 (0.0%) |
| 40 to 44 Years | 73 (42.9%) | 0 (0.0%) |
| 45 to 49 Years | 0 (0.0%) | 0 (0.0%) |
| 50 to 54 Years | 0 (0.0%) | 61 (30.6%) |
| 55 to 59 Years | 0 (0.0%) | 0 (0.0%) |
| 60 to 64 Years | 0 (0.0%) | 8 (4.0%) |
| 65 to 69 Years | 0 (0.0%) | 17 (8.5%) |
| 70 to 74 Years | 0 (0.0%) | 42 (21.1%) |
| 75 to 79 Years | 28 (16.5%) | 0 (0.0%) |
| 80 to 84 Years | 28 (16.5%) | 71 (35.7%) |
| 85 Years and over | 0 (0.0%) | 0 (0.0%) |
| Total | 170 (100.0%) | 199 (100.0%) |
Families and Households in Siracusaville
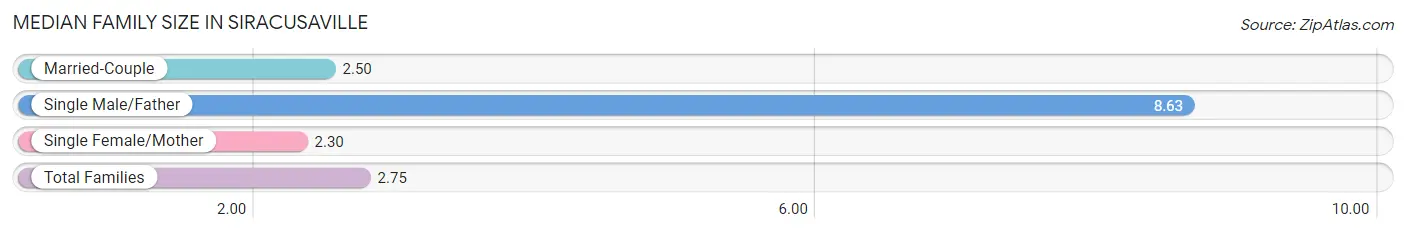
Median Family Size in Siracusaville
The median family size in Siracusaville is 2.75 persons per family, with single male/father families (8 | 6.5%) accounting for the largest median family size of 8.63 persons per family. On the other hand, single female/mother families (88 | 71.0%) represent the smallest median family size with 2.30 persons per family.
| Family Type | # Families | Family Size |
| Married-Couple | 28 (22.6%) | 2.50 |
| Single Male/Father | 8 (6.5%) | 8.63 |
| Single Female/Mother | 88 (71.0%) | 2.30 |
| Total Families | 124 (100.0%) | 2.75 |
Median Household Size in Siracusaville
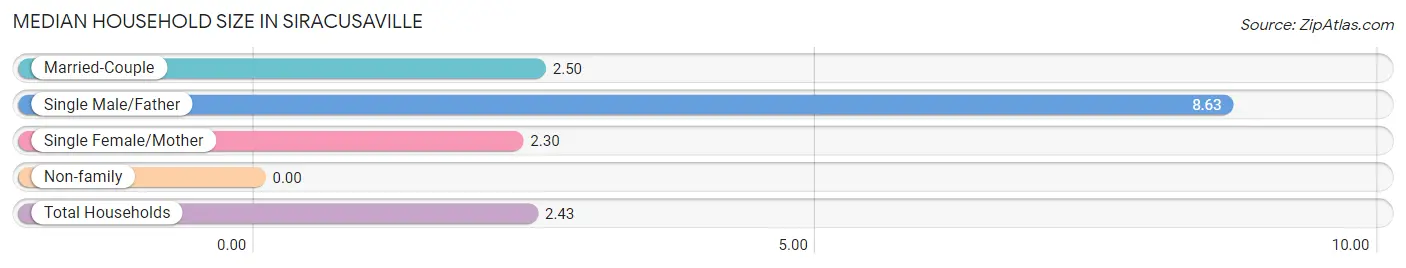
| Household Type | # Households | Household Size |
| Married-Couple | 28 (18.4%) | 2.50 |
| Single Male/Father | 8 (5.3%) | 8.63 |
| Single Female/Mother | 88 (57.9%) | 2.30 |
| Non-family | 28 (18.4%) | - |
| Total Households | 152 (100.0%) | 2.43 |
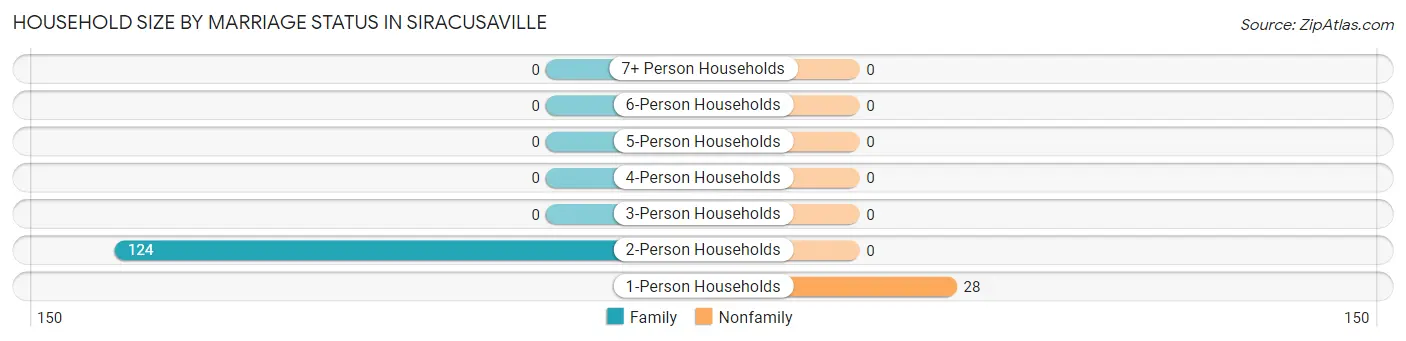
Household Size by Marriage Status in Siracusaville
Out of a total of 152 households in Siracusaville, 124 (81.6%) are family households, while 28 (18.4%) are nonfamily households. The most numerous type of family households are 2-person households, comprising 124, and the most common type of nonfamily households are 1-person households, comprising 28.
| Household Size | Family Households | Nonfamily Households |
| 1-Person Households | - | 28 (18.4%) |
| 2-Person Households | 124 (81.6%) | 0 (0.0%) |
| 3-Person Households | 0 (0.0%) | 0 (0.0%) |
| 4-Person Households | 0 (0.0%) | 0 (0.0%) |
| 5-Person Households | 0 (0.0%) | 0 (0.0%) |
| 6-Person Households | 0 (0.0%) | 0 (0.0%) |
| 7+ Person Households | 0 (0.0%) | 0 (0.0%) |
| Total | 124 (81.6%) | 28 (18.4%) |
Female Fertility in Siracusaville
Fertility by Age in Siracusaville
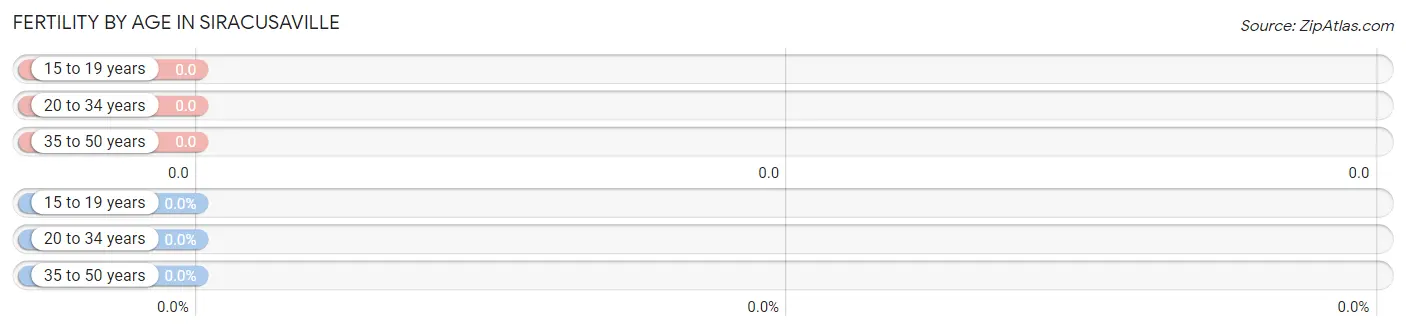
| Age Bracket | Women with Births | Births / 1,000 Women |
| 15 to 19 years | 0 (0.0%) | 0.0 |
| 20 to 34 years | 0 (0.0%) | 0.0 |
| 35 to 50 years | 0 (0.0%) | 0.0 |
| Total | 0 (0.0%) | 0.0 |
Fertility by Age by Marriage Status in Siracusaville
| Age Bracket | Married | Unmarried |
| 15 to 19 years | 0 (0.0%) | 0 (0.0%) |
| 20 to 34 years | 0 (0.0%) | 0 (0.0%) |
| 35 to 50 years | 0 (0.0%) | 0 (0.0%) |
| Total | 0 (0.0%) | 0 (0.0%) |
Fertility by Education in Siracusaville
| Educational Attainment | Women with Births | Births / 1,000 Women |
| Less than High School | 0 (0.0%) | 0.0 |
| High School Diploma | 0 (0.0%) | 0.0 |
| College or Associate's Degree | 0 (0.0%) | 0.0 |
| Bachelor's Degree | 0 (0.0%) | 0.0 |
| Graduate Degree | 0 (0.0%) | 0.0 |
| Total | 0 (0.0%) | 0.0 |
Fertility by Education by Marriage Status in Siracusaville
| Educational Attainment | Married | Unmarried |
| Less than High School | 0 (0.0%) | 0 (0.0%) |
| High School Diploma | 0 (0.0%) | 0 (0.0%) |
| College or Associate's Degree | 0 (0.0%) | 0 (0.0%) |
| Bachelor's Degree | 0 (0.0%) | 0 (0.0%) |
| Graduate Degree | 0 (0.0%) | 0 (0.0%) |
| Total | 0 (0.0%) | 0 (0.0%) |
Employment Characteristics in Siracusaville
Employment by Class of Employer in Siracusaville
Among the 110 employed individuals in Siracusaville, , and private company employees (110 | 100.0%) make up the most common classes of employment.
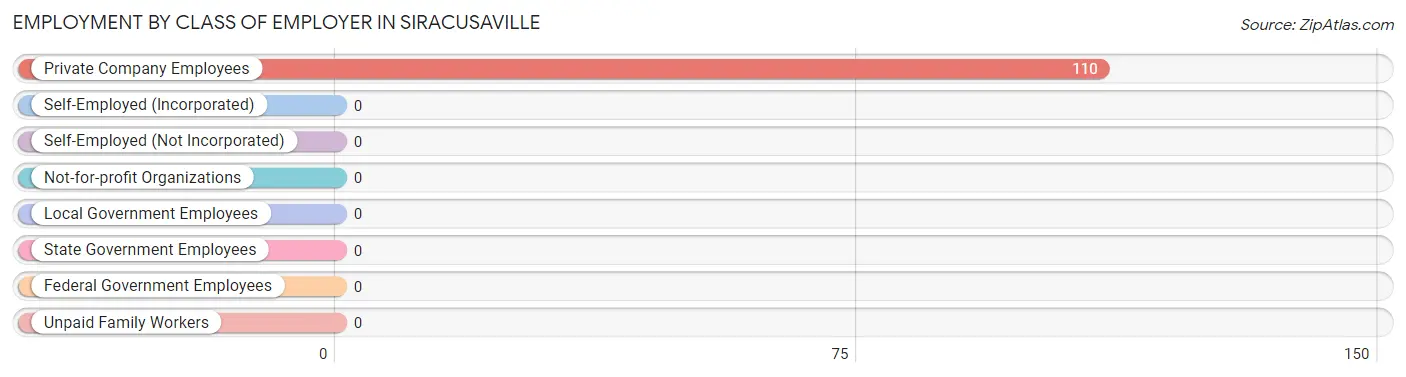
| Employer Class | # Employees | % Employees |
| Private Company Employees | 110 | 100.0% |
| Self-Employed (Incorporated) | 0 | 0.0% |
| Self-Employed (Not Incorporated) | 0 | 0.0% |
| Not-for-profit Organizations | 0 | 0.0% |
| Local Government Employees | 0 | 0.0% |
| State Government Employees | 0 | 0.0% |
| Federal Government Employees | 0 | 0.0% |
| Unpaid Family Workers | 0 | 0.0% |
| Total | 110 | 100.0% |
Employment Status by Age in Siracusaville
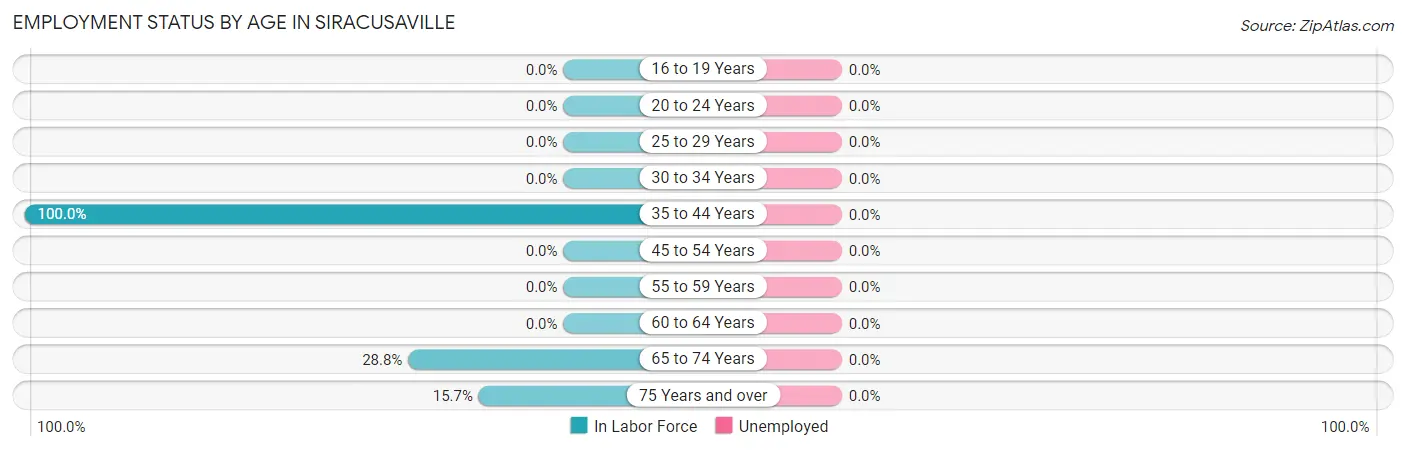
| Age Bracket | In Labor Force | Unemployed |
| 16 to 19 Years | 0 (0.0%) | 0 (0.0%) |
| 20 to 24 Years | 0 (0.0%) | 0 (0.0%) |
| 25 to 29 Years | 0 (0.0%) | 0 (0.0%) |
| 30 to 34 Years | 0 (0.0%) | 0 (0.0%) |
| 35 to 44 Years | 73 (100.0%) | 0 (0.0%) |
| 45 to 54 Years | 0 (0.0%) | 0 (0.0%) |
| 55 to 59 Years | 0 (0.0%) | 0 (0.0%) |
| 60 to 64 Years | 0 (0.0%) | 0 (0.0%) |
| 65 to 74 Years | 17 (28.8%) | 0 (0.0%) |
| 75 Years and over | 20 (15.7%) | 0 (0.0%) |
| Total | 110 (29.8%) | 0 (0.0%) |
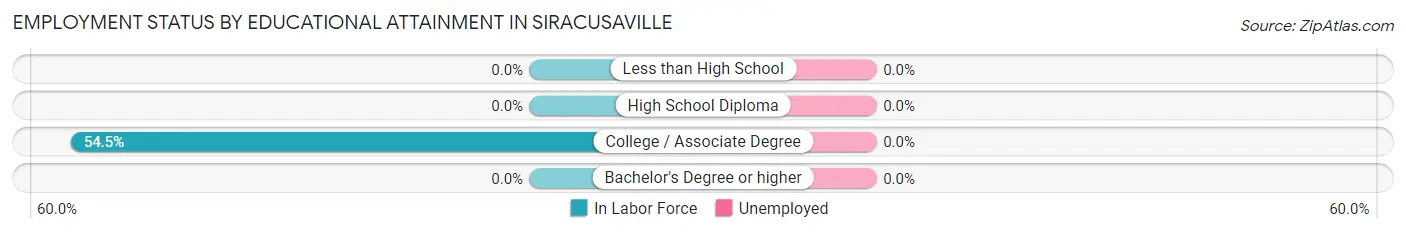
Employment Status by Educational Attainment in Siracusaville
| Educational Attainment | In Labor Force | Unemployed |
| Less than High School | 0 (0.0%) | 0 (0.0%) |
| High School Diploma | 0 (0.0%) | 0 (0.0%) |
| College / Associate Degree | 73 (54.5%) | 0 (0.0%) |
| Bachelor's Degree or higher | 0 (0.0%) | 0 (0.0%) |
| Total | 73 (39.9%) | 0 (0.0%) |
Employment Occupations by Sex in Siracusaville
Management, Business, Science and Arts Occupations
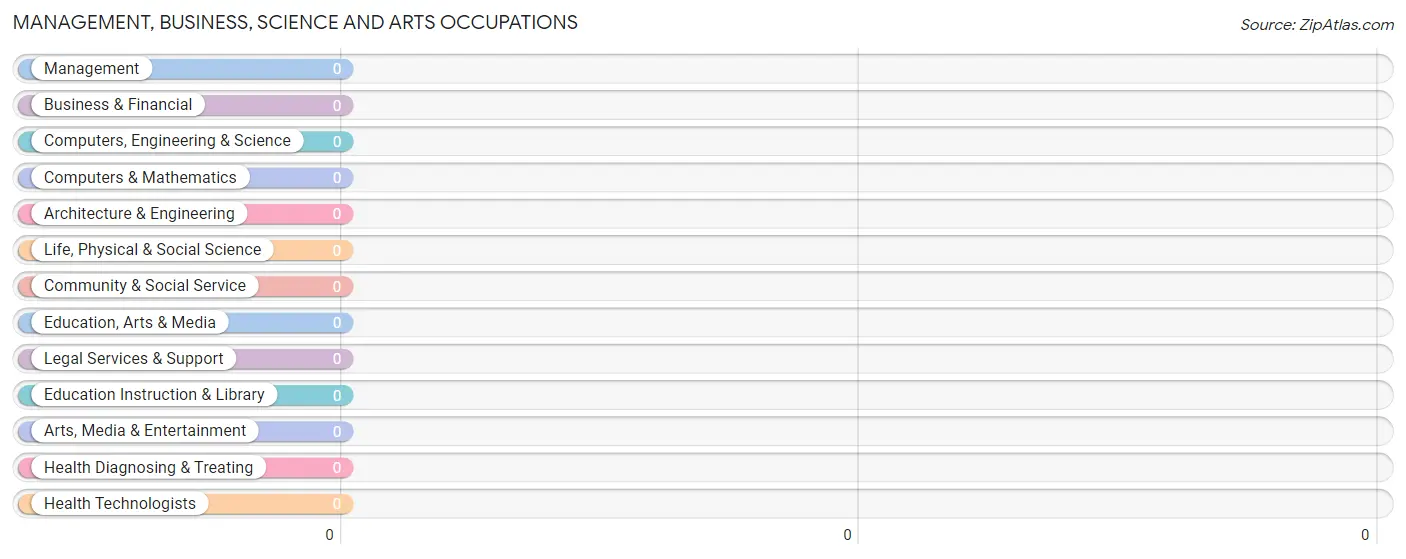
Management, Business, Science and Arts Occupations by Sex
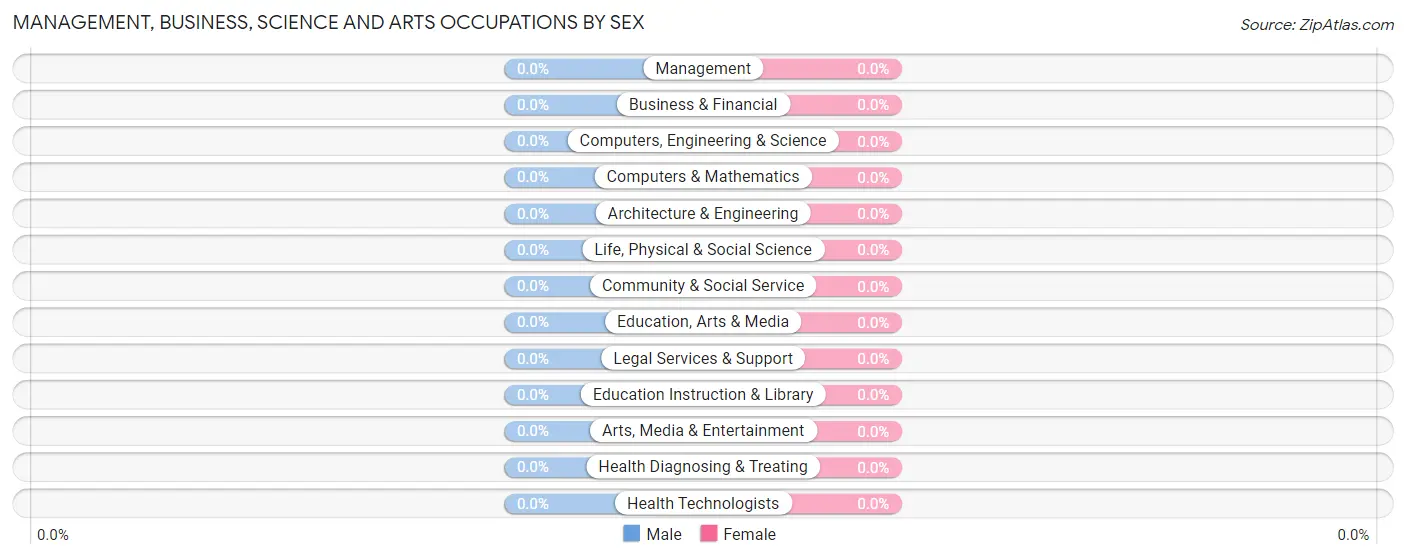
| Occupation | Male | Female |
| Management | 0 (0.0%) | 0 (0.0%) |
| Business & Financial | 0 (0.0%) | 0 (0.0%) |
| Computers, Engineering & Science | 0 (0.0%) | 0 (0.0%) |
| Computers & Mathematics | 0 (0.0%) | 0 (0.0%) |
| Architecture & Engineering | 0 (0.0%) | 0 (0.0%) |
| Life, Physical & Social Science | 0 (0.0%) | 0 (0.0%) |
| Community & Social Service | 0 (0.0%) | 0 (0.0%) |
| Education, Arts & Media | 0 (0.0%) | 0 (0.0%) |
| Legal Services & Support | 0 (0.0%) | 0 (0.0%) |
| Education Instruction & Library | 0 (0.0%) | 0 (0.0%) |
| Arts, Media & Entertainment | 0 (0.0%) | 0 (0.0%) |
| Health Diagnosing & Treating | 0 (0.0%) | 0 (0.0%) |
| Health Technologists | 0 (0.0%) | 0 (0.0%) |
| Total (Category) | 0 (0.0%) | 0 (0.0%) |
| Total (Overall) | 93 (84.6%) | 17 (15.4%) |
Services Occupations
The most common Services occupations in Siracusaville are , and Cleaning & Maintenance (20 | 18.2%).
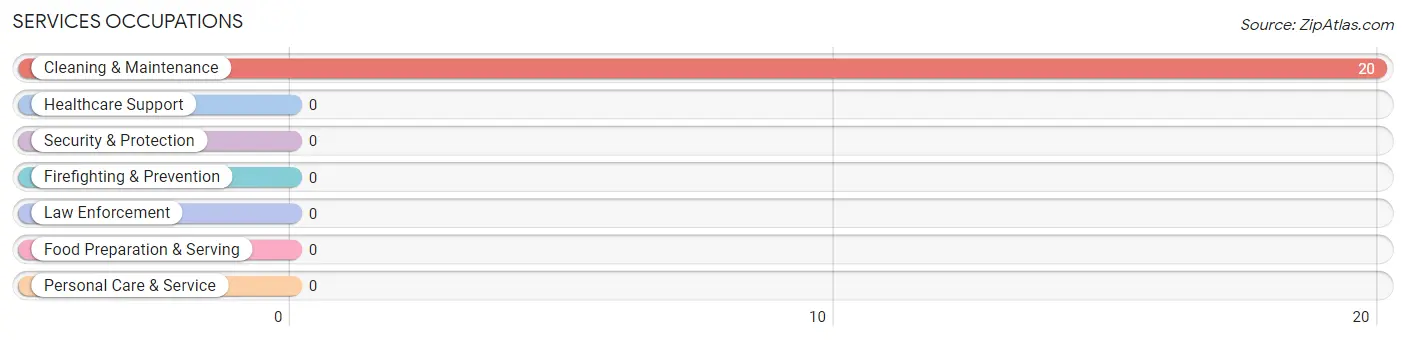
Services Occupations by Sex
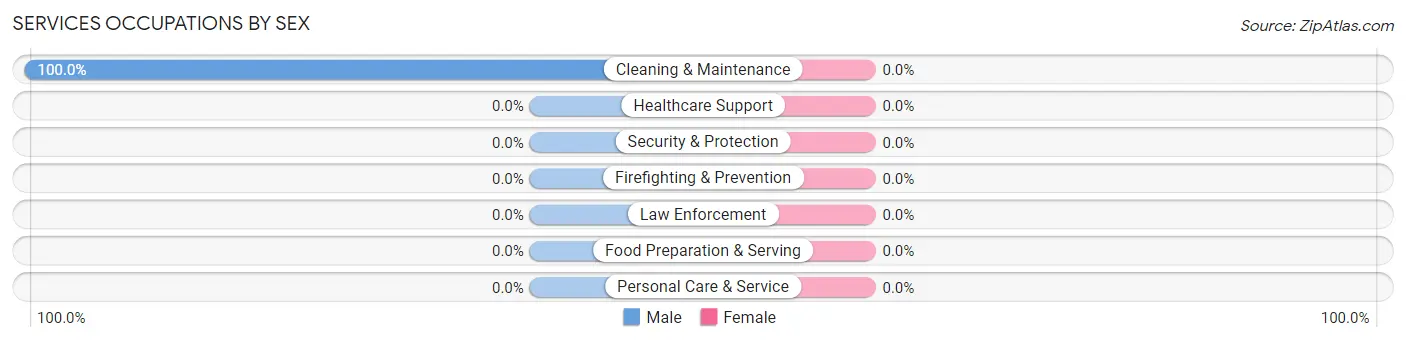
| Occupation | Male | Female |
| Healthcare Support | 0 (0.0%) | 0 (0.0%) |
| Security & Protection | 0 (0.0%) | 0 (0.0%) |
| Firefighting & Prevention | 0 (0.0%) | 0 (0.0%) |
| Law Enforcement | 0 (0.0%) | 0 (0.0%) |
| Food Preparation & Serving | 0 (0.0%) | 0 (0.0%) |
| Cleaning & Maintenance | 20 (100.0%) | 0 (0.0%) |
| Personal Care & Service | 0 (0.0%) | 0 (0.0%) |
| Total (Category) | 20 (100.0%) | 0 (0.0%) |
| Total (Overall) | 93 (84.6%) | 17 (15.4%) |
Sales and Office Occupations
The most common Sales and Office occupations in Siracusaville are , and Sales & Related (17 | 15.4%).
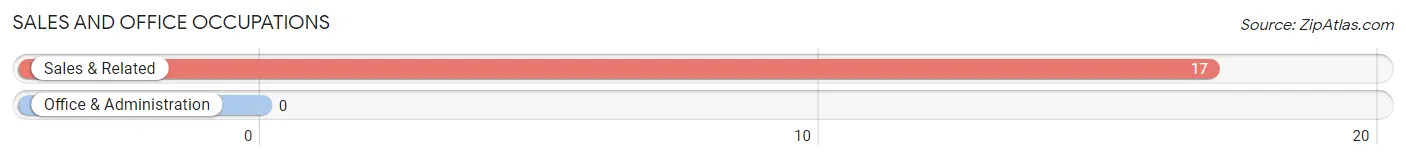
Sales and Office Occupations by Sex
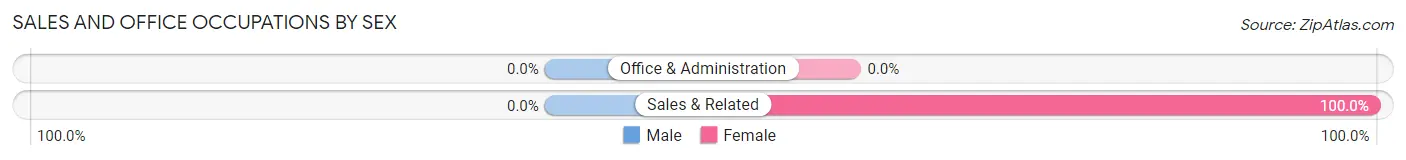
| Occupation | Male | Female |
| Sales & Related | 0 (0.0%) | 17 (100.0%) |
| Office & Administration | 0 (0.0%) | 0 (0.0%) |
| Total (Category) | 0 (0.0%) | 17 (100.0%) |
| Total (Overall) | 93 (84.6%) | 17 (15.4%) |
Natural Resources, Construction and Maintenance Occupations
Natural Resources, Construction and Maintenance Occupations by Sex
| Occupation | Male | Female |
| Farming, Fishing & Forestry | 0 (0.0%) | 0 (0.0%) |
| Construction & Extraction | 0 (0.0%) | 0 (0.0%) |
| Installation, Maintenance & Repair | 0 (0.0%) | 0 (0.0%) |
| Total (Category) | 0 (0.0%) | 0 (0.0%) |
| Total (Overall) | 93 (84.6%) | 17 (15.4%) |
Production, Transportation and Moving Occupations
The most common Production, Transportation and Moving occupations in Siracusaville are , and Transportation (73 | 66.4%).
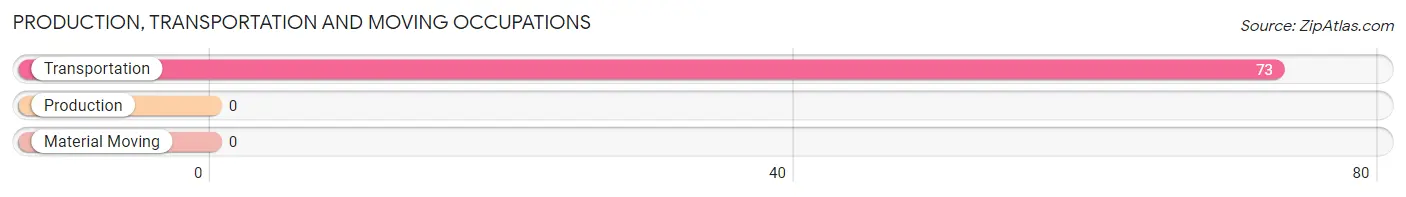
Production, Transportation and Moving Occupations by Sex
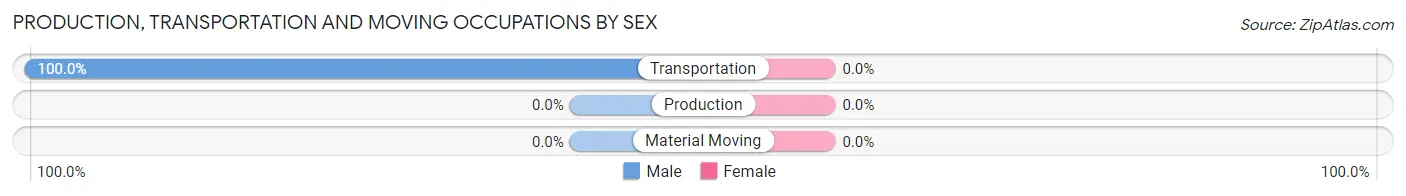
| Occupation | Male | Female |
| Production | 0 (0.0%) | 0 (0.0%) |
| Transportation | 73 (100.0%) | 0 (0.0%) |
| Material Moving | 0 (0.0%) | 0 (0.0%) |
| Total (Category) | 73 (100.0%) | 0 (0.0%) |
| Total (Overall) | 93 (84.6%) | 17 (15.4%) |
Employment Industries by Sex in Siracusaville
Employment Industries in Siracusaville
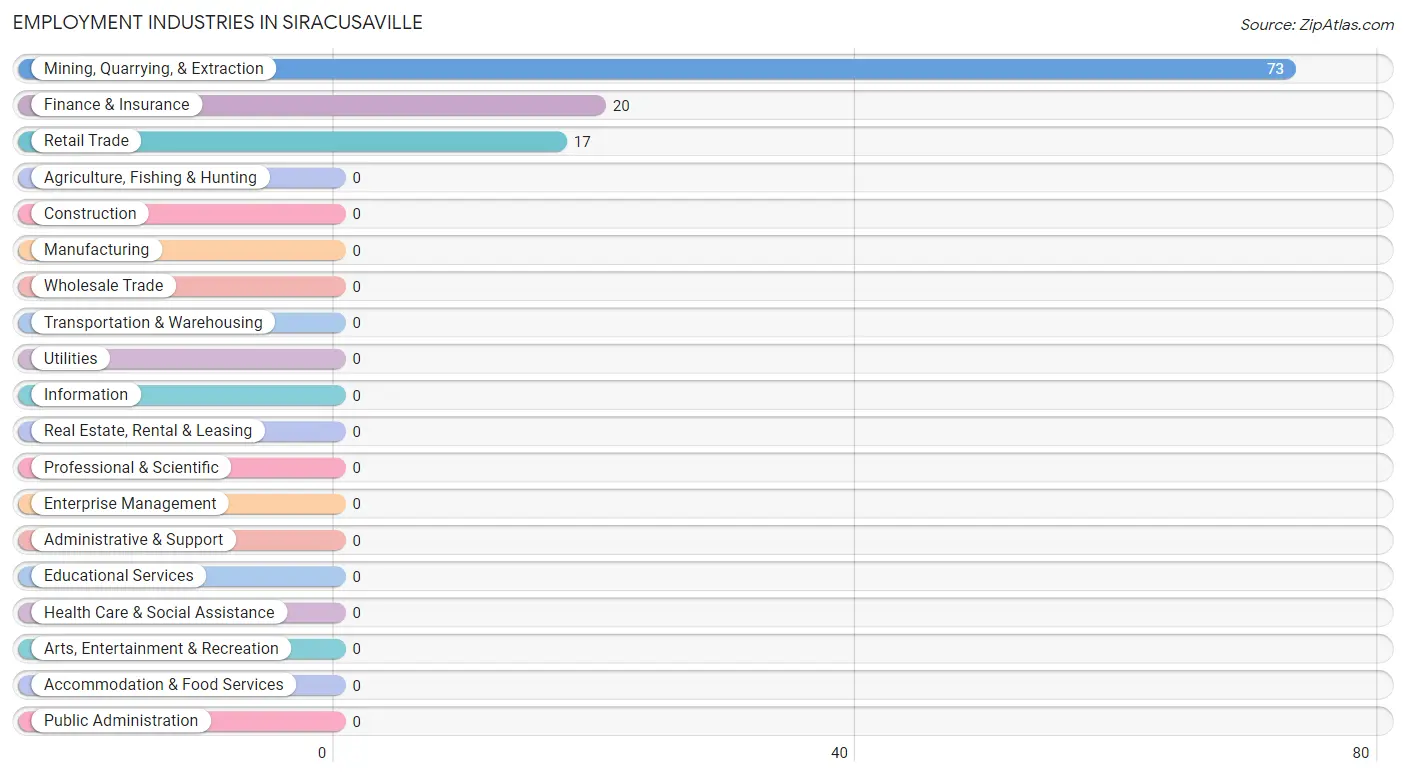
The major employment industries in Siracusaville include Mining, Quarrying, & Extraction (73 | 66.4%), Finance & Insurance (20 | 18.2%), and Retail Trade (17 | 15.4%).
Employment Industries by Sex in Siracusaville
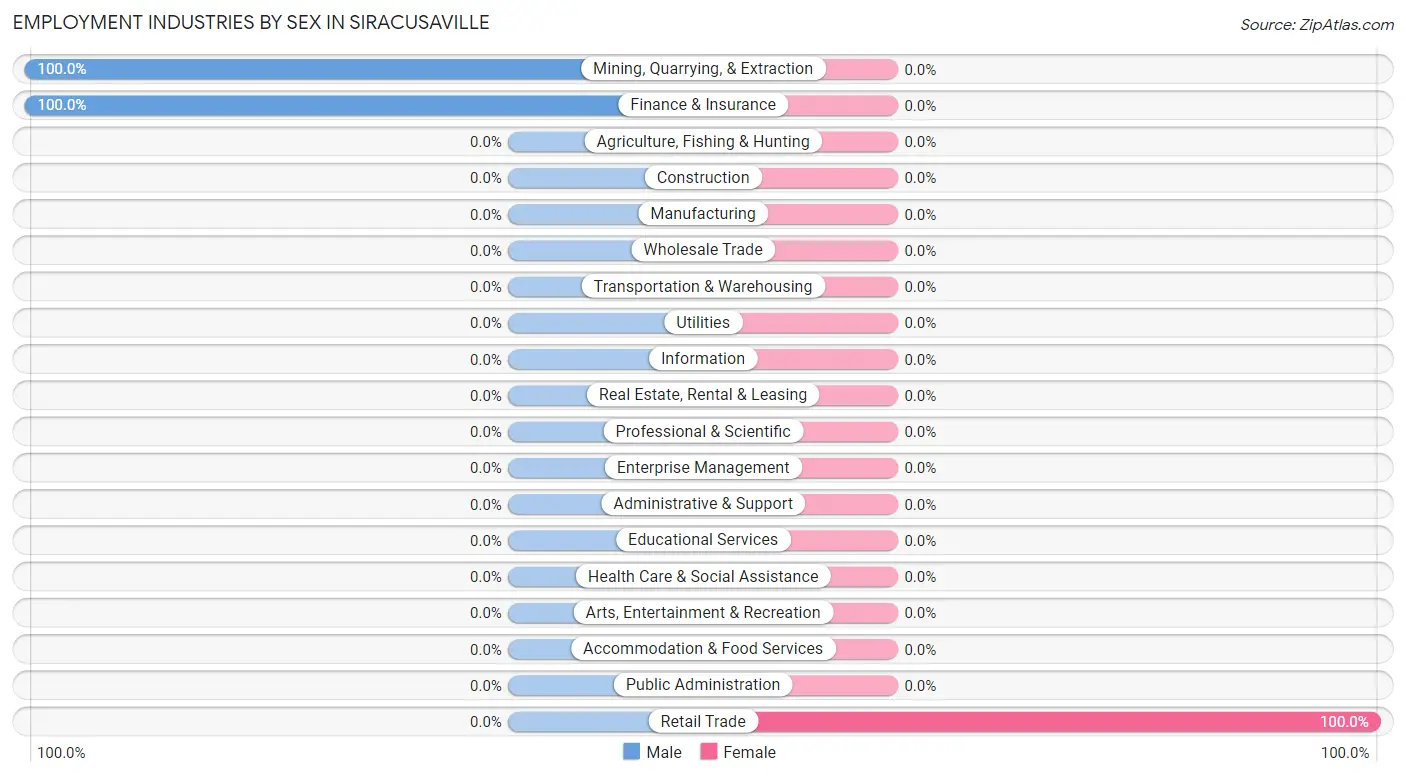
| Industry | Male | Female |
| Agriculture, Fishing & Hunting | 0 (0.0%) | 0 (0.0%) |
| Mining, Quarrying, & Extraction | 73 (100.0%) | 0 (0.0%) |
| Construction | 0 (0.0%) | 0 (0.0%) |
| Manufacturing | 0 (0.0%) | 0 (0.0%) |
| Wholesale Trade | 0 (0.0%) | 0 (0.0%) |
| Retail Trade | 0 (0.0%) | 17 (100.0%) |
| Transportation & Warehousing | 0 (0.0%) | 0 (0.0%) |
| Utilities | 0 (0.0%) | 0 (0.0%) |
| Information | 0 (0.0%) | 0 (0.0%) |
| Finance & Insurance | 20 (100.0%) | 0 (0.0%) |
| Real Estate, Rental & Leasing | 0 (0.0%) | 0 (0.0%) |
| Professional & Scientific | 0 (0.0%) | 0 (0.0%) |
| Enterprise Management | 0 (0.0%) | 0 (0.0%) |
| Administrative & Support | 0 (0.0%) | 0 (0.0%) |
| Educational Services | 0 (0.0%) | 0 (0.0%) |
| Health Care & Social Assistance | 0 (0.0%) | 0 (0.0%) |
| Arts, Entertainment & Recreation | 0 (0.0%) | 0 (0.0%) |
| Accommodation & Food Services | 0 (0.0%) | 0 (0.0%) |
| Public Administration | 0 (0.0%) | 0 (0.0%) |
| Total | 93 (84.6%) | 17 (15.4%) |
Education in Siracusaville
School Enrollment in Siracusaville
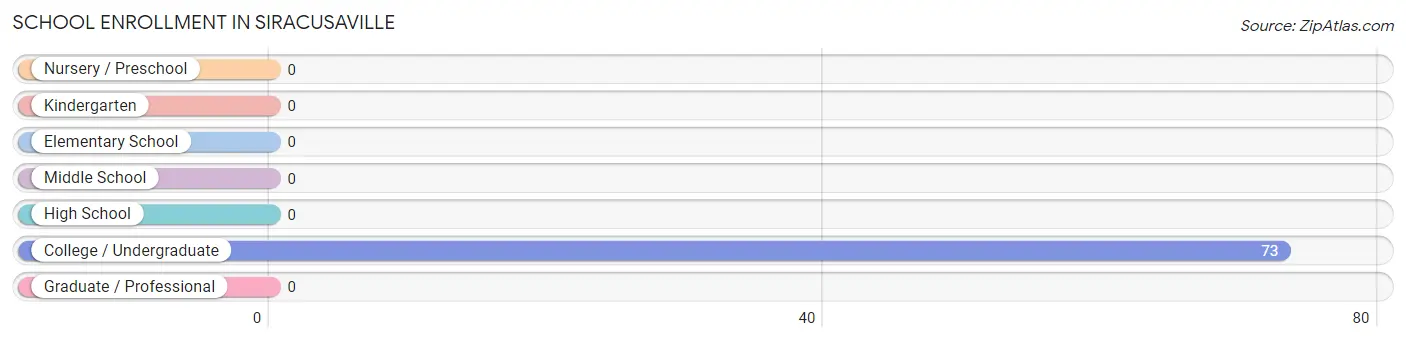
| School Level | # Students | % Students |
| Nursery / Preschool | 0 | 0.0% |
| Kindergarten | 0 | 0.0% |
| Elementary School | 0 | 0.0% |
| Middle School | 0 | 0.0% |
| High School | 0 | 0.0% |
| College / Undergraduate | 73 | 100.0% |
| Graduate / Professional | 0 | 0.0% |
| Total | 73 | 100.0% |
School Enrollment by Age by Funding Source in Siracusaville
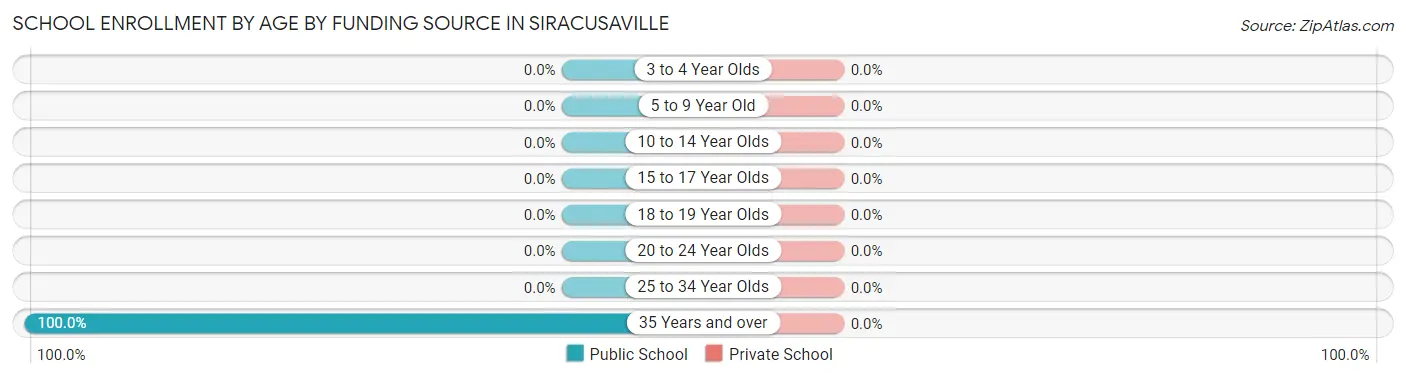
| Age Bracket | Public School | Private School |
| 3 to 4 Year Olds | 0 (0.0%) | 0 (0.0%) |
| 5 to 9 Year Old | 0 (0.0%) | 0 (0.0%) |
| 10 to 14 Year Olds | 0 (0.0%) | 0 (0.0%) |
| 15 to 17 Year Olds | 0 (0.0%) | 0 (0.0%) |
| 18 to 19 Year Olds | 0 (0.0%) | 0 (0.0%) |
| 20 to 24 Year Olds | 0 (0.0%) | 0 (0.0%) |
| 25 to 34 Year Olds | 0 (0.0%) | 0 (0.0%) |
| 35 Years and over | 73 (100.0%) | 0 (0.0%) |
| Total | 73 (100.0%) | 0 (0.0%) |
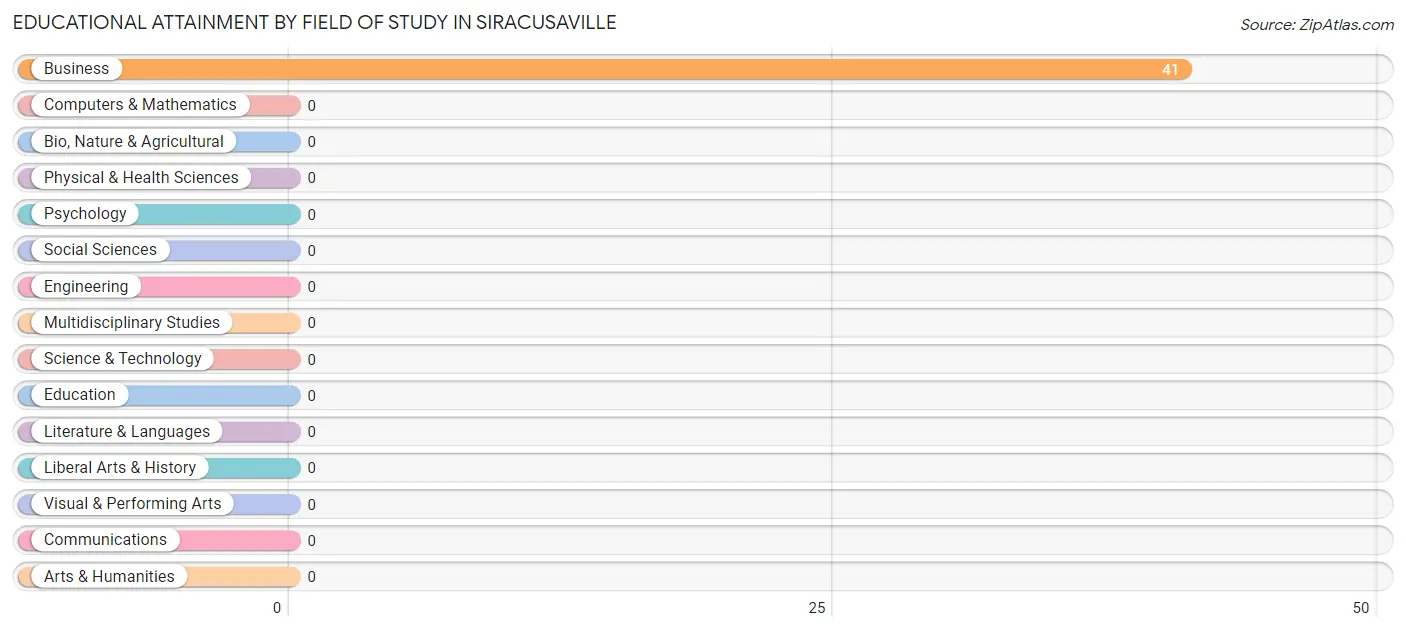
Educational Attainment by Field of Study in Siracusaville
, and business (41 | 100.0%) are the most common fields of study among 41 individuals in Siracusaville who have obtained a bachelor's degree or higher.
| Field of Study | # Graduates | % Graduates |
| Computers & Mathematics | 0 | 0.0% |
| Bio, Nature & Agricultural | 0 | 0.0% |
| Physical & Health Sciences | 0 | 0.0% |
| Psychology | 0 | 0.0% |
| Social Sciences | 0 | 0.0% |
| Engineering | 0 | 0.0% |
| Multidisciplinary Studies | 0 | 0.0% |
| Science & Technology | 0 | 0.0% |
| Business | 41 | 100.0% |
| Education | 0 | 0.0% |
| Literature & Languages | 0 | 0.0% |
| Liberal Arts & History | 0 | 0.0% |
| Visual & Performing Arts | 0 | 0.0% |
| Communications | 0 | 0.0% |
| Arts & Humanities | 0 | 0.0% |
| Total | 41 | 100.0% |
Transportation & Commute in Siracusaville
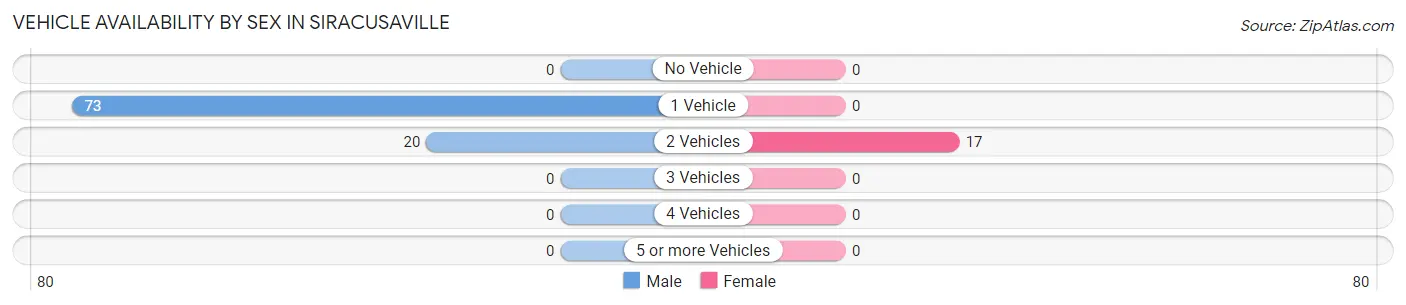
Vehicle Availability by Sex in Siracusaville
The most prevalent vehicle ownership categories in Siracusaville are males with 1 vehicle (73, accounting for 78.5%) and females with 1 vehicle (0, making up 429.4%).
| Vehicles Available | Male | Female |
| No Vehicle | 0 (0.0%) | 0 (0.0%) |
| 1 Vehicle | 73 (78.5%) | 0 (0.0%) |
| 2 Vehicles | 20 (21.5%) | 17 (100.0%) |
| 3 Vehicles | 0 (0.0%) | 0 (0.0%) |
| 4 Vehicles | 0 (0.0%) | 0 (0.0%) |
| 5 or more Vehicles | 0 (0.0%) | 0 (0.0%) |
| Total | 93 (100.0%) | 17 (100.0%) |
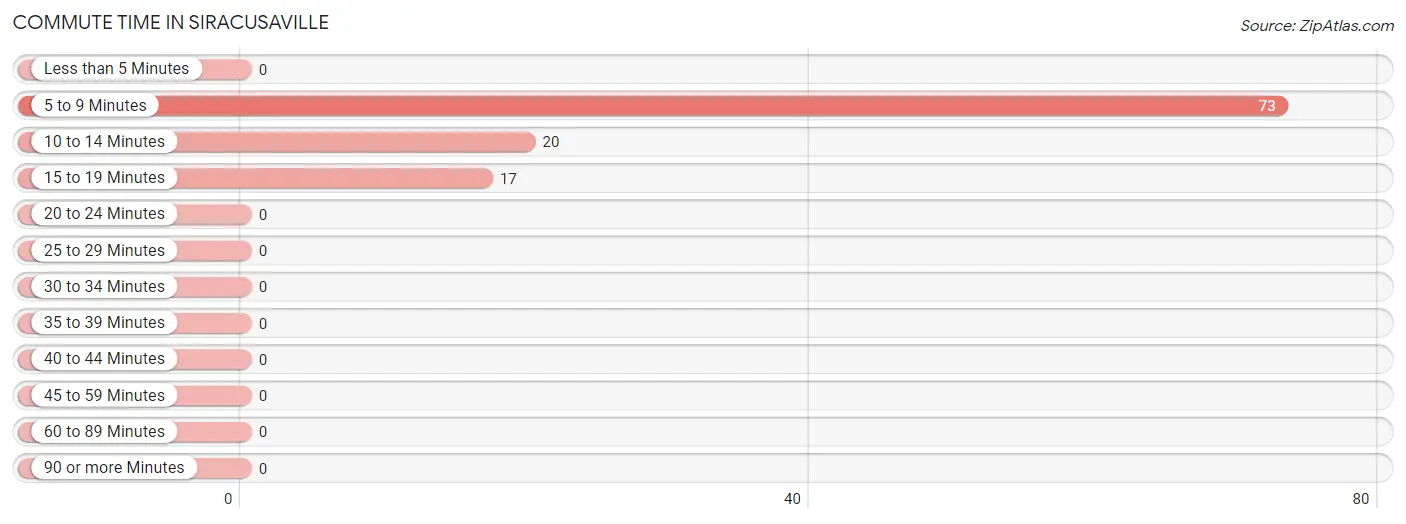
Commute Time in Siracusaville
The most frequently occuring commute durations in Siracusaville are 5 to 9 minutes (73 commuters, 66.4%), 10 to 14 minutes (20 commuters, 18.2%), and 15 to 19 minutes (17 commuters, 15.4%).
| Commute Time | # Commuters | % Commuters |
| Less than 5 Minutes | 0 | 0.0% |
| 5 to 9 Minutes | 73 | 66.4% |
| 10 to 14 Minutes | 20 | 18.2% |
| 15 to 19 Minutes | 17 | 15.4% |
| 20 to 24 Minutes | 0 | 0.0% |
| 25 to 29 Minutes | 0 | 0.0% |
| 30 to 34 Minutes | 0 | 0.0% |
| 35 to 39 Minutes | 0 | 0.0% |
| 40 to 44 Minutes | 0 | 0.0% |
| 45 to 59 Minutes | 0 | 0.0% |
| 60 to 89 Minutes | 0 | 0.0% |
| 90 or more Minutes | 0 | 0.0% |
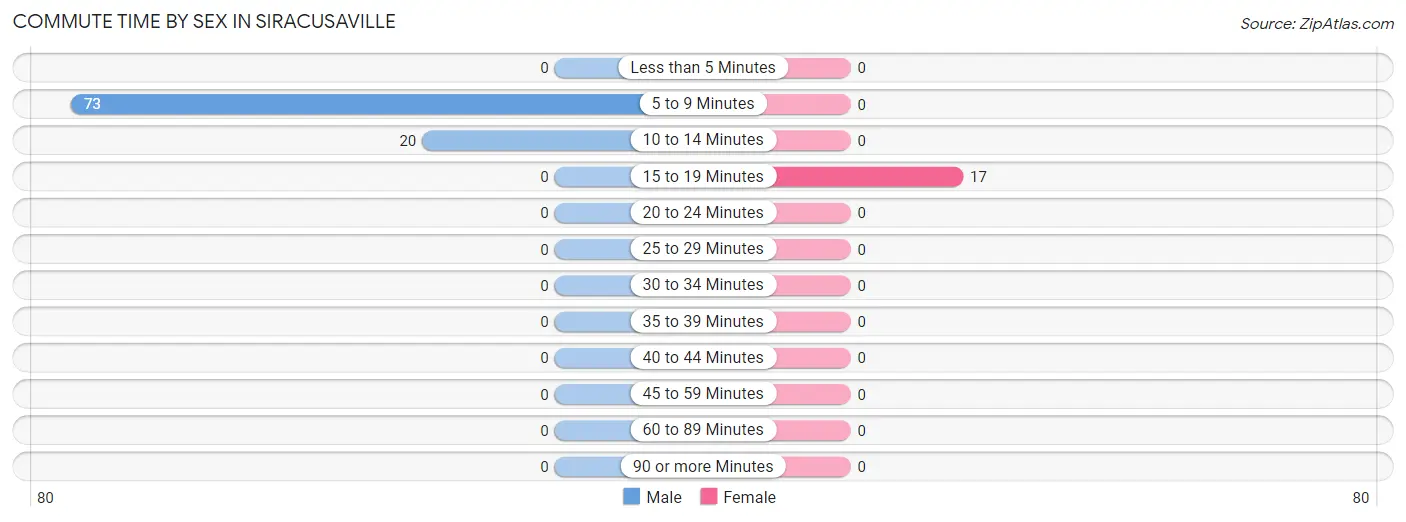
Commute Time by Sex in Siracusaville
The most common commute times in Siracusaville are 5 to 9 minutes (73 commuters, 78.5%) for males and 15 to 19 minutes (17 commuters, 100.0%) for females.
| Commute Time | Male | Female |
| Less than 5 Minutes | 0 (0.0%) | 0 (0.0%) |
| 5 to 9 Minutes | 73 (78.5%) | 0 (0.0%) |
| 10 to 14 Minutes | 20 (21.5%) | 0 (0.0%) |
| 15 to 19 Minutes | 0 (0.0%) | 17 (100.0%) |
| 20 to 24 Minutes | 0 (0.0%) | 0 (0.0%) |
| 25 to 29 Minutes | 0 (0.0%) | 0 (0.0%) |
| 30 to 34 Minutes | 0 (0.0%) | 0 (0.0%) |
| 35 to 39 Minutes | 0 (0.0%) | 0 (0.0%) |
| 40 to 44 Minutes | 0 (0.0%) | 0 (0.0%) |
| 45 to 59 Minutes | 0 (0.0%) | 0 (0.0%) |
| 60 to 89 Minutes | 0 (0.0%) | 0 (0.0%) |
| 90 or more Minutes | 0 (0.0%) | 0 (0.0%) |
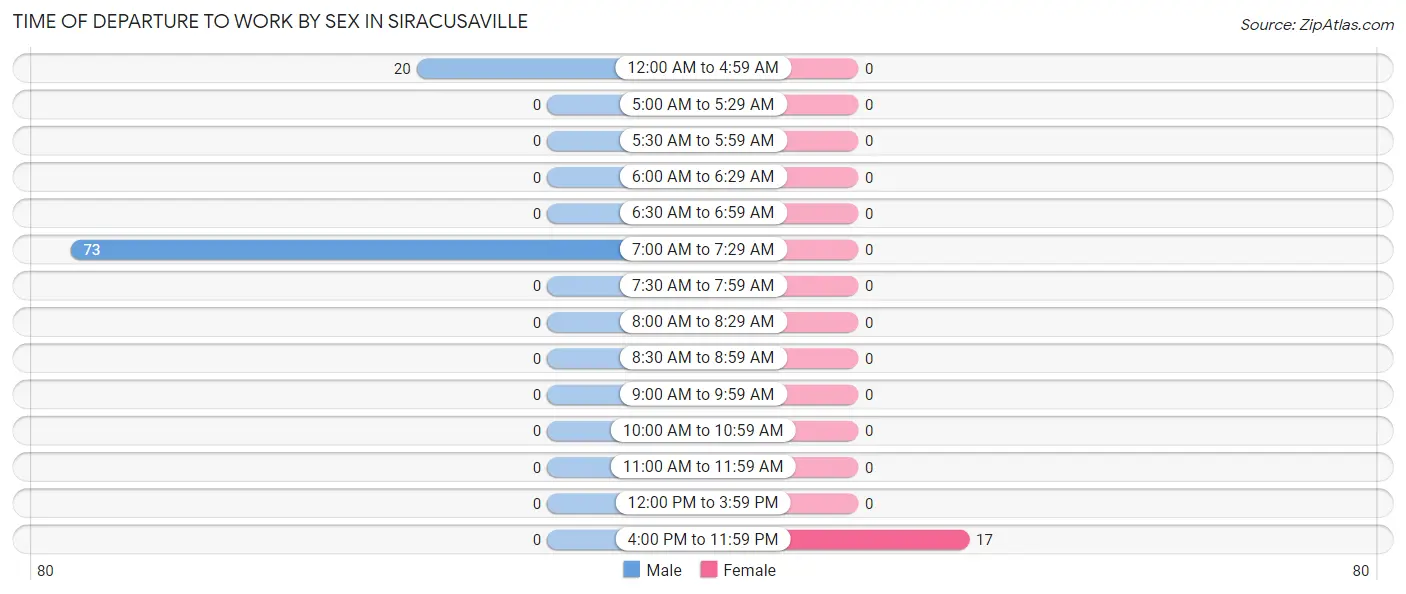
Time of Departure to Work by Sex in Siracusaville
The most frequent times of departure to work in Siracusaville are 7:00 AM to 7:29 AM (73, 78.5%) for males and 4:00 PM to 11:59 PM (17, 100.0%) for females.
| Time of Departure | Male | Female |
| 12:00 AM to 4:59 AM | 20 (21.5%) | 0 (0.0%) |
| 5:00 AM to 5:29 AM | 0 (0.0%) | 0 (0.0%) |
| 5:30 AM to 5:59 AM | 0 (0.0%) | 0 (0.0%) |
| 6:00 AM to 6:29 AM | 0 (0.0%) | 0 (0.0%) |
| 6:30 AM to 6:59 AM | 0 (0.0%) | 0 (0.0%) |
| 7:00 AM to 7:29 AM | 73 (78.5%) | 0 (0.0%) |
| 7:30 AM to 7:59 AM | 0 (0.0%) | 0 (0.0%) |
| 8:00 AM to 8:29 AM | 0 (0.0%) | 0 (0.0%) |
| 8:30 AM to 8:59 AM | 0 (0.0%) | 0 (0.0%) |
| 9:00 AM to 9:59 AM | 0 (0.0%) | 0 (0.0%) |
| 10:00 AM to 10:59 AM | 0 (0.0%) | 0 (0.0%) |
| 11:00 AM to 11:59 AM | 0 (0.0%) | 0 (0.0%) |
| 12:00 PM to 3:59 PM | 0 (0.0%) | 0 (0.0%) |
| 4:00 PM to 11:59 PM | 0 (0.0%) | 17 (100.0%) |
| Total | 93 (100.0%) | 17 (100.0%) |
Housing Occupancy in Siracusaville
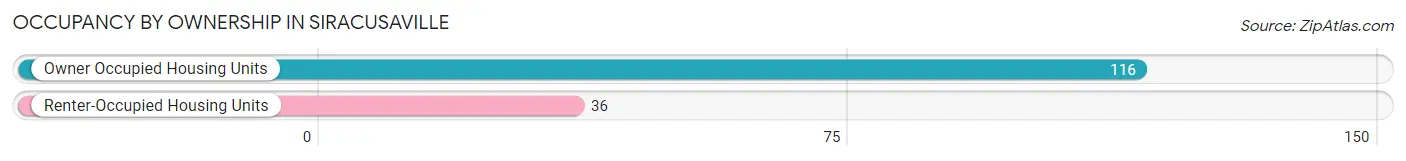
Occupancy by Ownership in Siracusaville
Of the total 152 dwellings in Siracusaville, owner-occupied units account for 116 (76.3%), while renter-occupied units make up 36 (23.7%).
| Occupancy | # Housing Units | % Housing Units |
| Owner Occupied Housing Units | 116 | 76.3% |
| Renter-Occupied Housing Units | 36 | 23.7% |
| Total Occupied Housing Units | 152 | 100.0% |
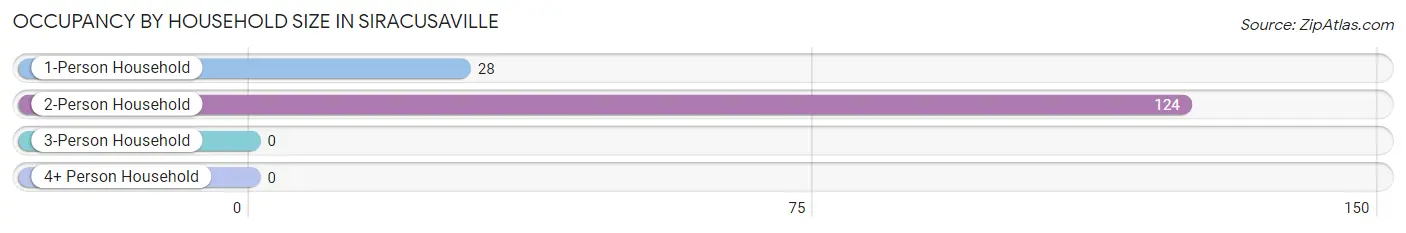
Occupancy by Household Size in Siracusaville
| Household Size | # Housing Units | % Housing Units |
| 1-Person Household | 28 | 18.4% |
| 2-Person Household | 124 | 81.6% |
| 3-Person Household | 0 | 0.0% |
| 4+ Person Household | 0 | 0.0% |
| Total Housing Units | 152 | 100.0% |
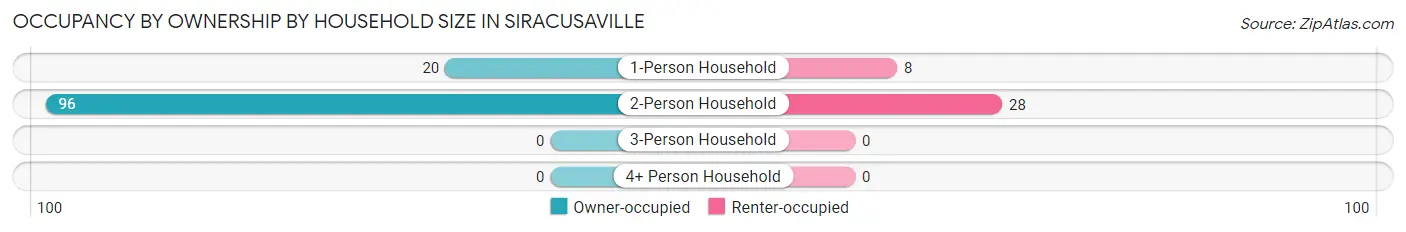
Occupancy by Ownership by Household Size in Siracusaville
| Household Size | Owner-occupied | Renter-occupied |
| 1-Person Household | 20 (71.4%) | 8 (28.6%) |
| 2-Person Household | 96 (77.4%) | 28 (22.6%) |
| 3-Person Household | 0 (0.0%) | 0 (0.0%) |
| 4+ Person Household | 0 (0.0%) | 0 (0.0%) |
| Total Housing Units | 116 (76.3%) | 36 (23.7%) |
Occupancy by Educational Attainment in Siracusaville
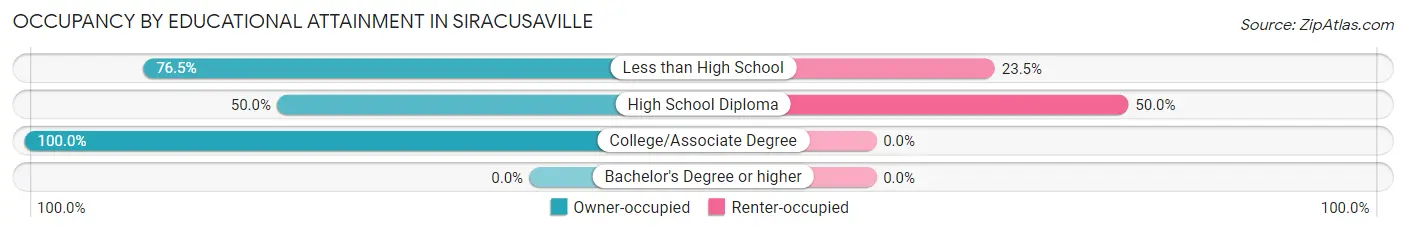
| Household Size | Owner-occupied | Renter-occupied |
| Less than High School | 91 (76.5%) | 28 (23.5%) |
| High School Diploma | 8 (50.0%) | 8 (50.0%) |
| College/Associate Degree | 17 (100.0%) | 0 (0.0%) |
| Bachelor's Degree or higher | 0 (0.0%) | 0 (0.0%) |
Occupancy by Age of Householder in Siracusaville
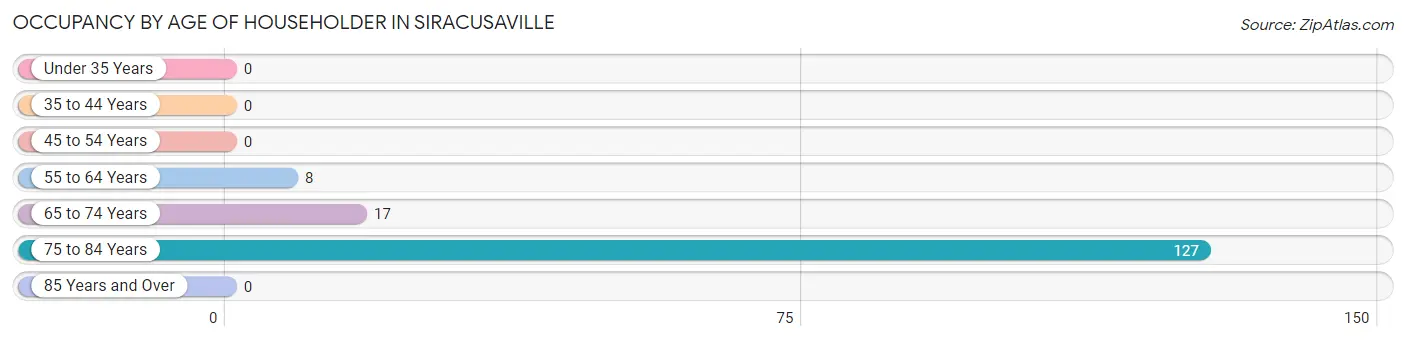
| Age Bracket | # Households | % Households |
| Under 35 Years | 0 | 0.0% |
| 35 to 44 Years | 0 | 0.0% |
| 45 to 54 Years | 0 | 0.0% |
| 55 to 64 Years | 8 | 5.3% |
| 65 to 74 Years | 17 | 11.2% |
| 75 to 84 Years | 127 | 83.6% |
| 85 Years and Over | 0 | 0.0% |
| Total | 152 | 100.0% |
Housing Finances in Siracusaville
Median Income by Occupancy in Siracusaville
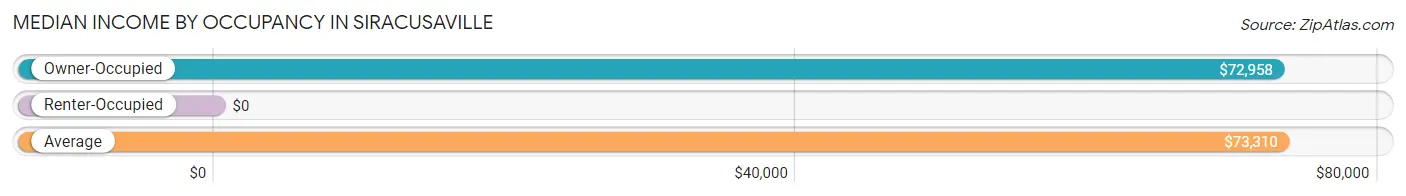
| Occupancy Type | # Households | Median Income |
| Owner-Occupied | 116 (76.3%) | $72,958 |
| Renter-Occupied | 36 (23.7%) | $0 |
| Average | 152 (100.0%) | $73,310 |
Occupancy by Householder Income Bracket in Siracusaville
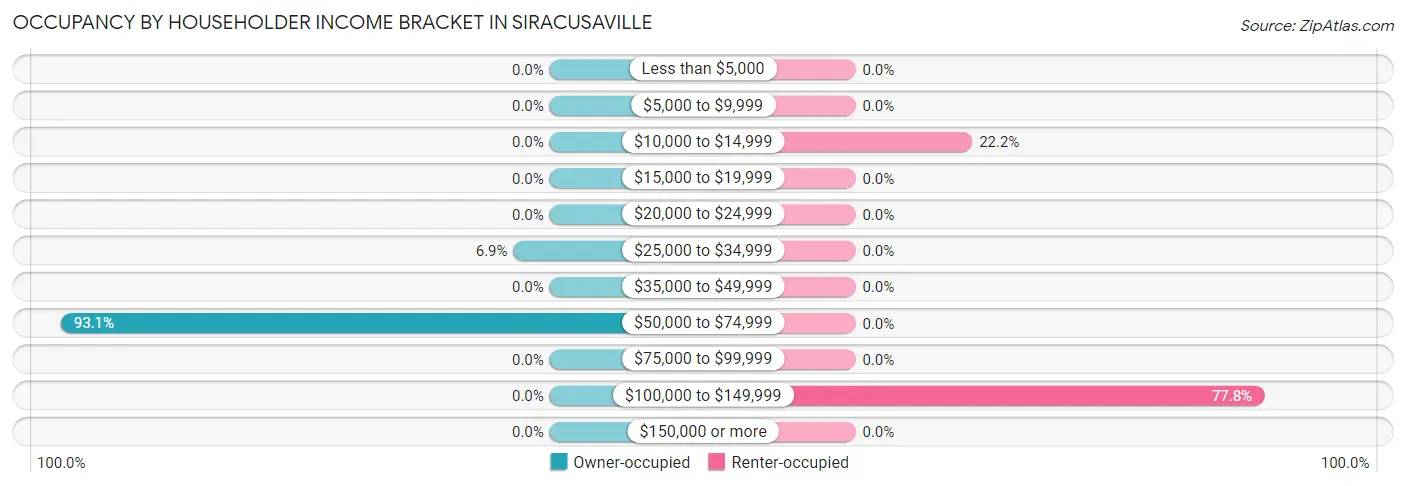
| Income Bracket | Owner-occupied | Renter-occupied |
| Less than $5,000 | 0 (0.0%) | 0 (0.0%) |
| $5,000 to $9,999 | 0 (0.0%) | 0 (0.0%) |
| $10,000 to $14,999 | 0 (0.0%) | 8 (22.2%) |
| $15,000 to $19,999 | 0 (0.0%) | 0 (0.0%) |
| $20,000 to $24,999 | 0 (0.0%) | 0 (0.0%) |
| $25,000 to $34,999 | 8 (6.9%) | 0 (0.0%) |
| $35,000 to $49,999 | 0 (0.0%) | 0 (0.0%) |
| $50,000 to $74,999 | 108 (93.1%) | 0 (0.0%) |
| $75,000 to $99,999 | 0 (0.0%) | 0 (0.0%) |
| $100,000 to $149,999 | 0 (0.0%) | 28 (77.8%) |
| $150,000 or more | 0 (0.0%) | 0 (0.0%) |
| Total | 116 (100.0%) | 36 (100.0%) |
Monthly Housing Cost Tiers in Siracusaville
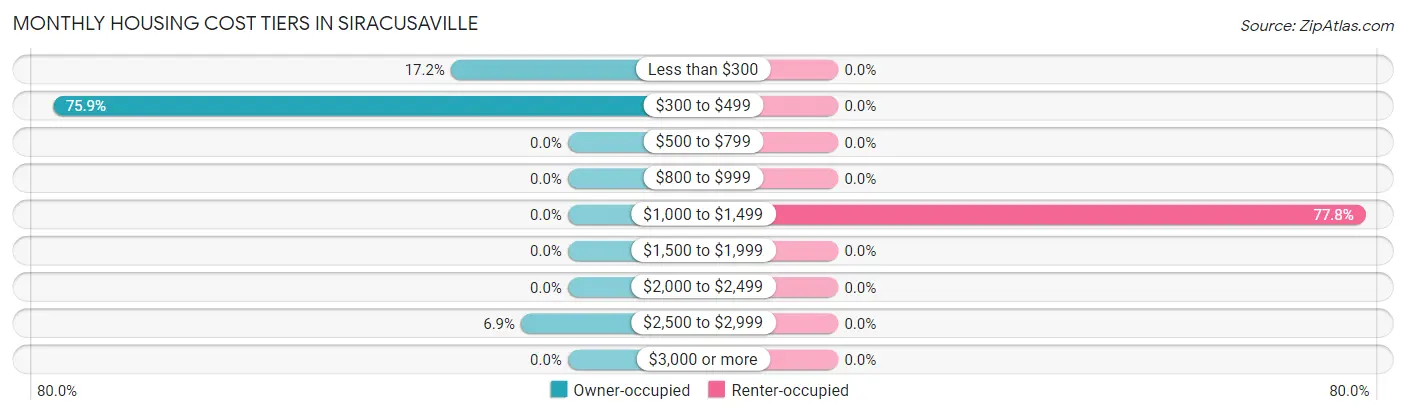
| Monthly Cost | Owner-occupied | Renter-occupied |
| Less than $300 | 20 (17.2%) | 0 (0.0%) |
| $300 to $499 | 88 (75.9%) | 0 (0.0%) |
| $500 to $799 | 0 (0.0%) | 0 (0.0%) |
| $800 to $999 | 0 (0.0%) | 0 (0.0%) |
| $1,000 to $1,499 | 0 (0.0%) | 28 (77.8%) |
| $1,500 to $1,999 | 0 (0.0%) | 0 (0.0%) |
| $2,000 to $2,499 | 0 (0.0%) | 0 (0.0%) |
| $2,500 to $2,999 | 8 (6.9%) | 0 (0.0%) |
| $3,000 or more | 0 (0.0%) | 0 (0.0%) |
| Total | 116 (100.0%) | 36 (100.0%) |
Physical Housing Characteristics in Siracusaville
Housing Structures in Siracusaville
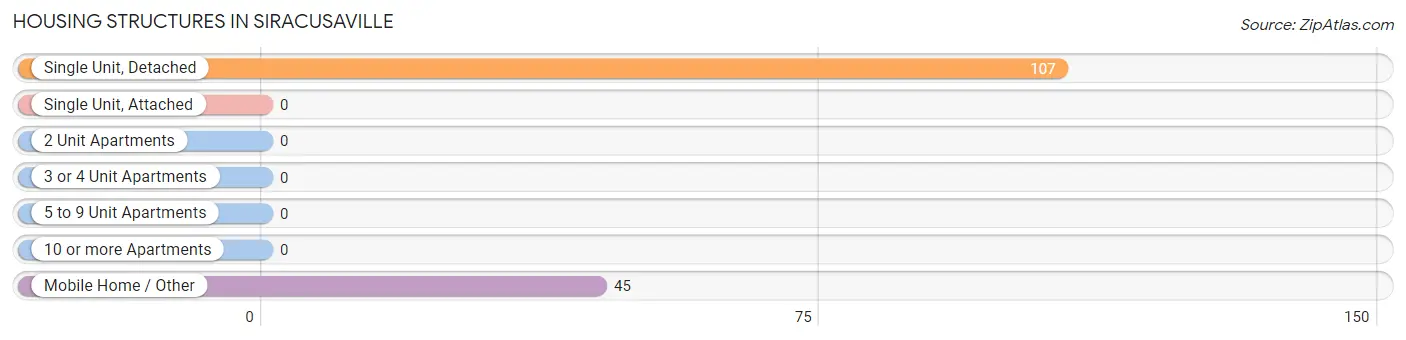
| Structure Type | # Housing Units | % Housing Units |
| Single Unit, Detached | 107 | 70.4% |
| Single Unit, Attached | 0 | 0.0% |
| 2 Unit Apartments | 0 | 0.0% |
| 3 or 4 Unit Apartments | 0 | 0.0% |
| 5 to 9 Unit Apartments | 0 | 0.0% |
| 10 or more Apartments | 0 | 0.0% |
| Mobile Home / Other | 45 | 29.6% |
| Total | 152 | 100.0% |
Housing Structures by Occupancy in Siracusaville
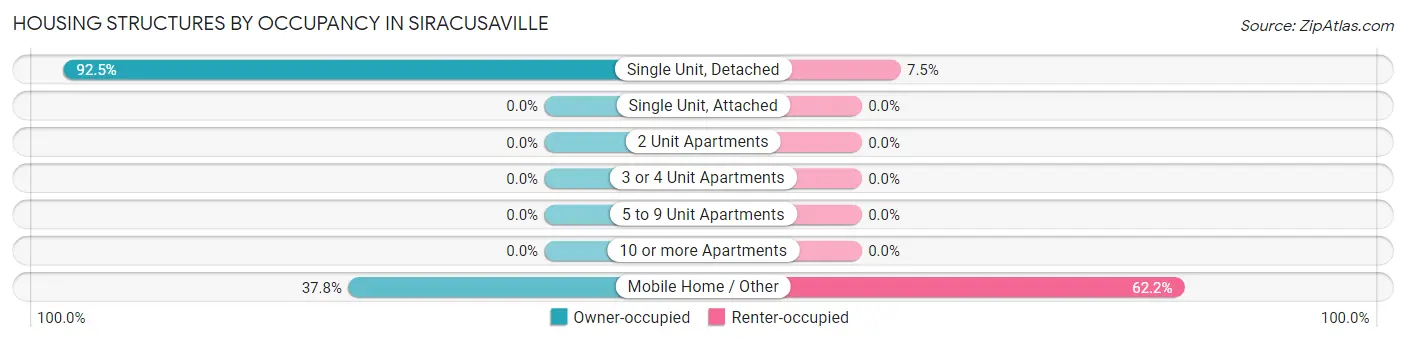
| Structure Type | Owner-occupied | Renter-occupied |
| Single Unit, Detached | 99 (92.5%) | 8 (7.5%) |
| Single Unit, Attached | 0 (0.0%) | 0 (0.0%) |
| 2 Unit Apartments | 0 (0.0%) | 0 (0.0%) |
| 3 or 4 Unit Apartments | 0 (0.0%) | 0 (0.0%) |
| 5 to 9 Unit Apartments | 0 (0.0%) | 0 (0.0%) |
| 10 or more Apartments | 0 (0.0%) | 0 (0.0%) |
| Mobile Home / Other | 17 (37.8%) | 28 (62.2%) |
| Total | 116 (76.3%) | 36 (23.7%) |
Housing Structures by Number of Rooms in Siracusaville
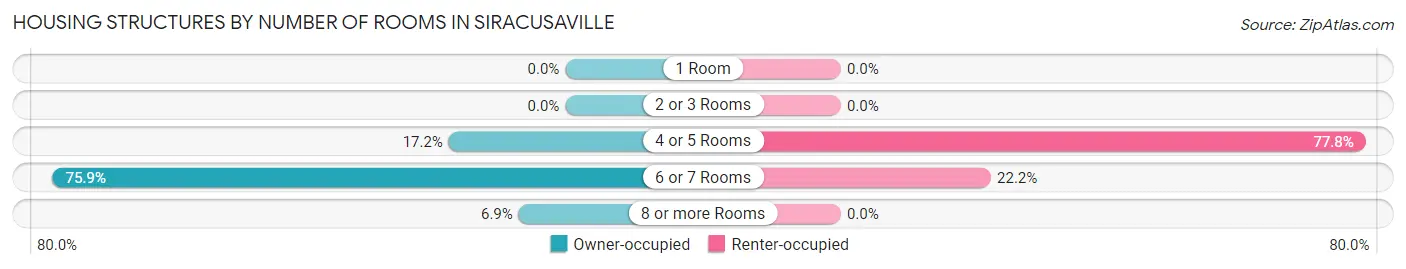
| Number of Rooms | Owner-occupied | Renter-occupied |
| 1 Room | 0 (0.0%) | 0 (0.0%) |
| 2 or 3 Rooms | 0 (0.0%) | 0 (0.0%) |
| 4 or 5 Rooms | 20 (17.2%) | 28 (77.8%) |
| 6 or 7 Rooms | 88 (75.9%) | 8 (22.2%) |
| 8 or more Rooms | 8 (6.9%) | 0 (0.0%) |
| Total | 116 (100.0%) | 36 (100.0%) |
Housing Structure by Heating Type in Siracusaville
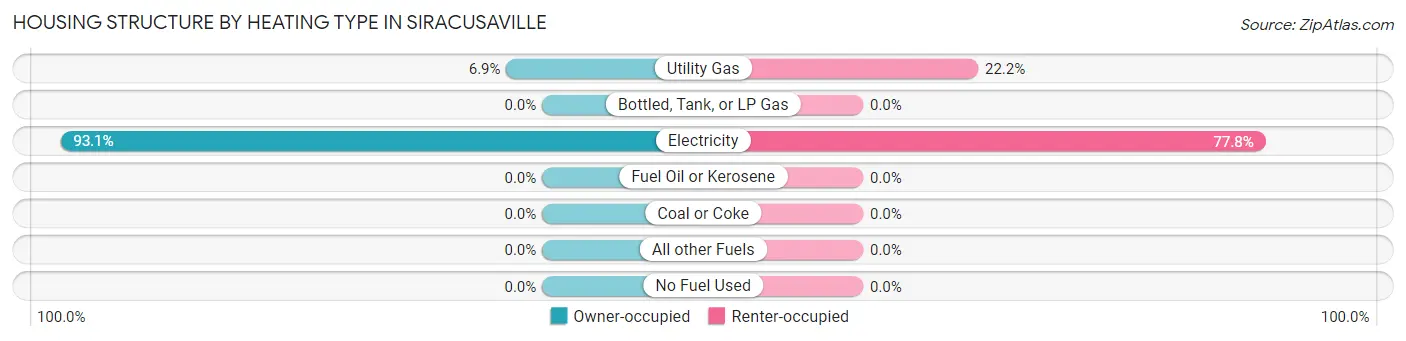
| Heating Type | Owner-occupied | Renter-occupied |
| Utility Gas | 8 (6.9%) | 8 (22.2%) |
| Bottled, Tank, or LP Gas | 0 (0.0%) | 0 (0.0%) |
| Electricity | 108 (93.1%) | 28 (77.8%) |
| Fuel Oil or Kerosene | 0 (0.0%) | 0 (0.0%) |
| Coal or Coke | 0 (0.0%) | 0 (0.0%) |
| All other Fuels | 0 (0.0%) | 0 (0.0%) |
| No Fuel Used | 0 (0.0%) | 0 (0.0%) |
| Total | 116 (100.0%) | 36 (100.0%) |
Household Vehicle Usage in Siracusaville
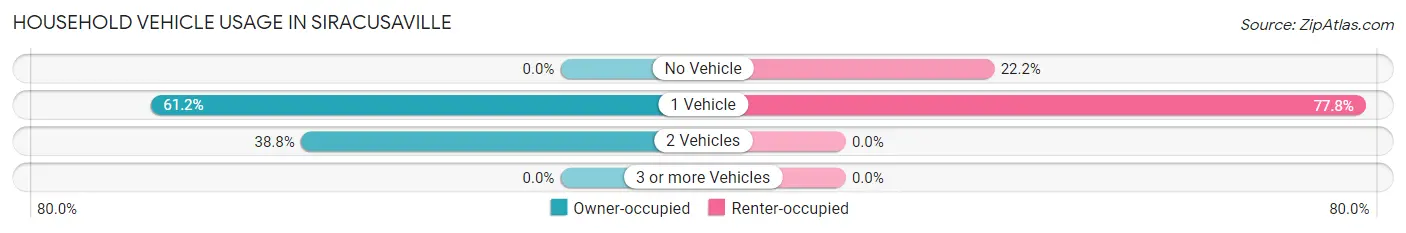
| Vehicles per Household | Owner-occupied | Renter-occupied |
| No Vehicle | 0 (0.0%) | 8 (22.2%) |
| 1 Vehicle | 71 (61.2%) | 28 (77.8%) |
| 2 Vehicles | 45 (38.8%) | 0 (0.0%) |
| 3 or more Vehicles | 0 (0.0%) | 0 (0.0%) |
| Total | 116 (100.0%) | 36 (100.0%) |
Real Estate & Mortgages in Siracusaville
Real Estate and Mortgage Overview in Siracusaville
| Characteristic | Without Mortgage | With Mortgage |
| Housing Units | 108 | 8 |
| Median Property Value | $85,200 | $0 |
| Median Household Income | $73,099 | $0 |
| Monthly Housing Costs | $424 | $0 |
| Real Estate Taxes | - | - |
Property Value by Mortgage Status in Siracusaville
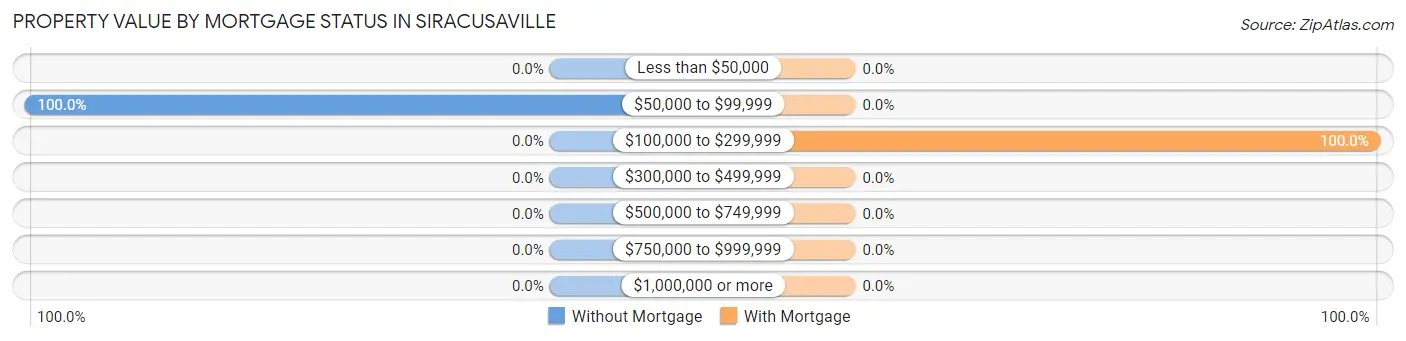
| Property Value | Without Mortgage | With Mortgage |
| Less than $50,000 | 0 (0.0%) | 0 (0.0%) |
| $50,000 to $99,999 | 108 (100.0%) | 0 (0.0%) |
| $100,000 to $299,999 | 0 (0.0%) | 8 (100.0%) |
| $300,000 to $499,999 | 0 (0.0%) | 0 (0.0%) |
| $500,000 to $749,999 | 0 (0.0%) | 0 (0.0%) |
| $750,000 to $999,999 | 0 (0.0%) | 0 (0.0%) |
| $1,000,000 or more | 0 (0.0%) | 0 (0.0%) |
| Total | 108 (100.0%) | 8 (100.0%) |
Household Income by Mortgage Status in Siracusaville
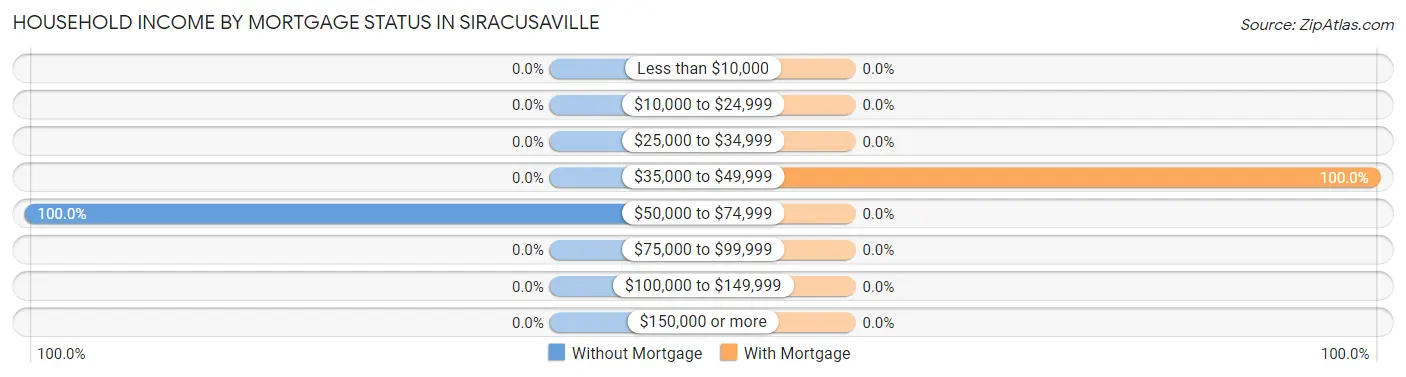
| Household Income | Without Mortgage | With Mortgage |
| Less than $10,000 | 0 (0.0%) | 0 (0.0%) |
| $10,000 to $24,999 | 0 (0.0%) | 0 (0.0%) |
| $25,000 to $34,999 | 0 (0.0%) | 0 (0.0%) |
| $35,000 to $49,999 | 0 (0.0%) | 8 (100.0%) |
| $50,000 to $74,999 | 108 (100.0%) | 0 (0.0%) |
| $75,000 to $99,999 | 0 (0.0%) | 0 (0.0%) |
| $100,000 to $149,999 | 0 (0.0%) | 0 (0.0%) |
| $150,000 or more | 0 (0.0%) | 0 (0.0%) |
| Total | 108 (100.0%) | 8 (100.0%) |
Property Value to Household Income Ratio in Siracusaville
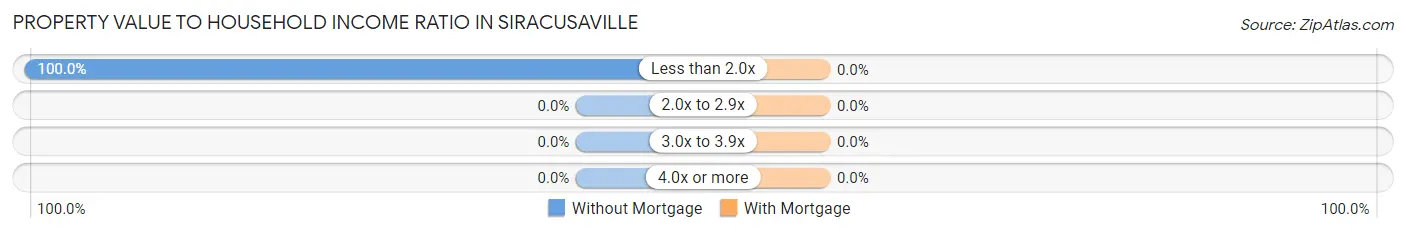
| Value-to-Income Ratio | Without Mortgage | With Mortgage |
| Less than 2.0x | 108 (100.0%) | 0 (0.0%) |
| 2.0x to 2.9x | 0 (0.0%) | 0 (0.0%) |
| 3.0x to 3.9x | 0 (0.0%) | 0 (0.0%) |
| 4.0x or more | 0 (0.0%) | 0 (0.0%) |
| Total | 108 (100.0%) | 8 (100.0%) |
Real Estate Taxes by Mortgage Status in Siracusaville
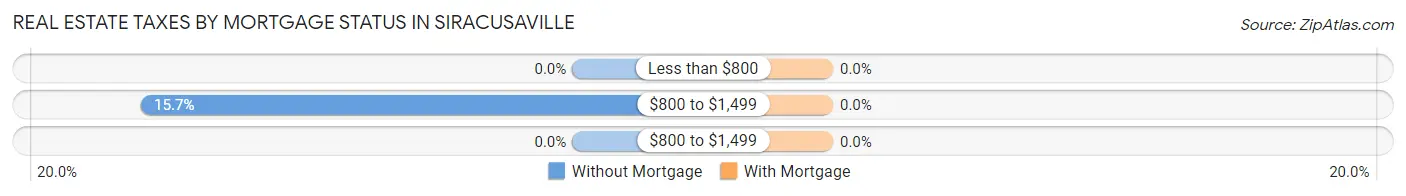
| Property Taxes | Without Mortgage | With Mortgage |
| Less than $800 | 0 (0.0%) | 0 (0.0%) |
| $800 to $1,499 | 17 (15.7%) | 0 (0.0%) |
| $800 to $1,499 | 0 (0.0%) | 0 (0.0%) |
| Total | 108 (100.0%) | 8 (100.0%) |
Health & Disability in Siracusaville
Health Insurance Coverage by Age in Siracusaville
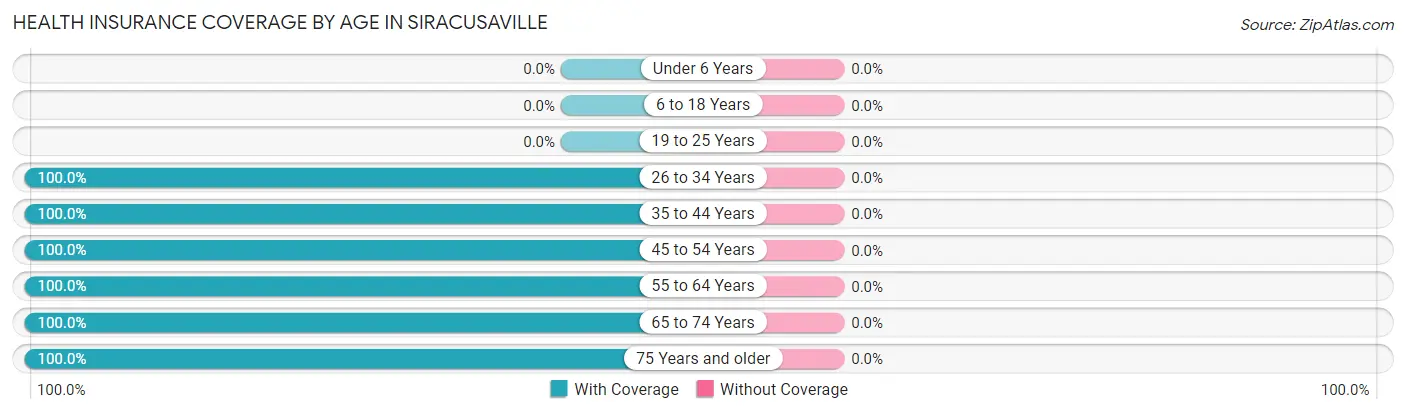
| Age Bracket | With Coverage | Without Coverage |
| Under 6 Years | 0 (0.0%) | 0 (0.0%) |
| 6 to 18 Years | 0 (0.0%) | 0 (0.0%) |
| 19 to 25 Years | 0 (0.0%) | 0 (0.0%) |
| 26 to 34 Years | 41 (100.0%) | 0 (0.0%) |
| 35 to 44 Years | 73 (100.0%) | 0 (0.0%) |
| 45 to 54 Years | 61 (100.0%) | 0 (0.0%) |
| 55 to 64 Years | 8 (100.0%) | 0 (0.0%) |
| 65 to 74 Years | 59 (100.0%) | 0 (0.0%) |
| 75 Years and older | 127 (100.0%) | 0 (0.0%) |
| Total | 369 (100.0%) | 0 (0.0%) |
Health Insurance Coverage by Citizenship Status in Siracusaville
| Citizenship Status | With Coverage | Without Coverage |
| Native Born | 0 (0.0%) | 0 (0.0%) |
| Foreign Born, Citizen | 0 (0.0%) | 0 (0.0%) |
| Foreign Born, not a Citizen | 0 (0.0%) | 0 (0.0%) |
Health Insurance Coverage by Household Income in Siracusaville
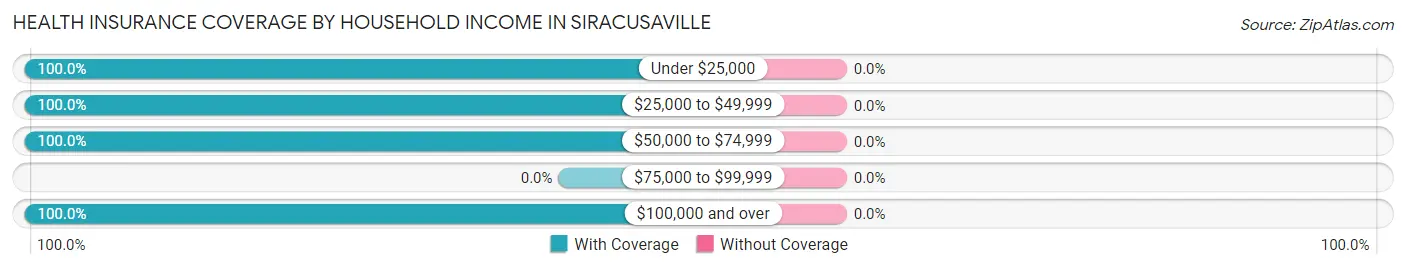
| Household Income | With Coverage | Without Coverage |
| Under $25,000 | 8 (100.0%) | 0 (0.0%) |
| $25,000 to $49,999 | 69 (100.0%) | 0 (0.0%) |
| $50,000 to $74,999 | 222 (100.0%) | 0 (0.0%) |
| $75,000 to $99,999 | 0 (0.0%) | 0 (0.0%) |
| $100,000 and over | 70 (100.0%) | 0 (0.0%) |
Public vs Private Health Insurance Coverage by Age in Siracusaville
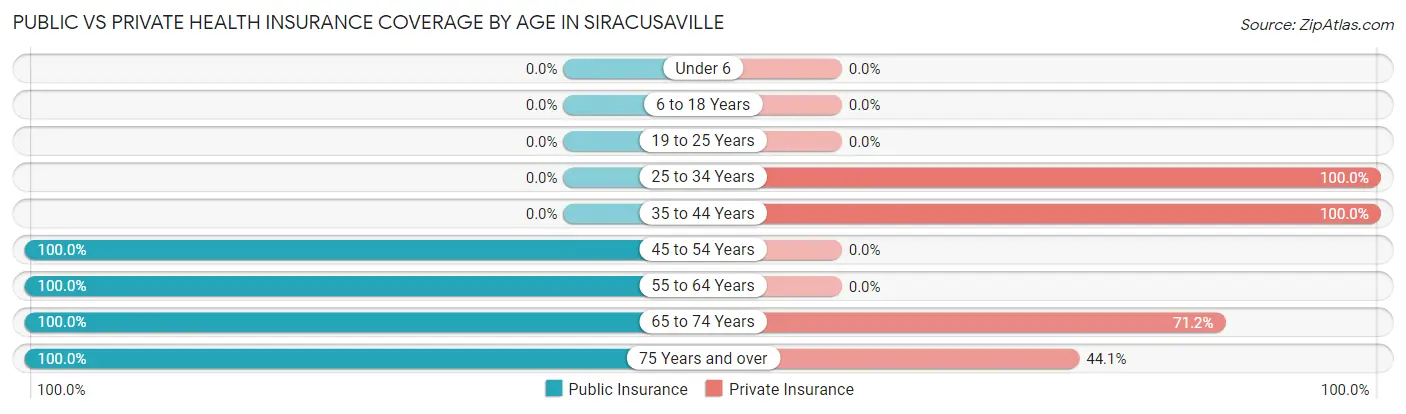
| Age Bracket | Public Insurance | Private Insurance |
| Under 6 | 0 (0.0%) | 0 (0.0%) |
| 6 to 18 Years | 0 (0.0%) | 0 (0.0%) |
| 19 to 25 Years | 0 (0.0%) | 0 (0.0%) |
| 25 to 34 Years | 0 (0.0%) | 41 (100.0%) |
| 35 to 44 Years | 0 (0.0%) | 73 (100.0%) |
| 45 to 54 Years | 61 (100.0%) | 0 (0.0%) |
| 55 to 64 Years | 8 (100.0%) | 0 (0.0%) |
| 65 to 74 Years | 59 (100.0%) | 42 (71.2%) |
| 75 Years and over | 127 (100.0%) | 56 (44.1%) |
| Total | 255 (69.1%) | 212 (57.5%) |
Disability Status by Sex by Age in Siracusaville
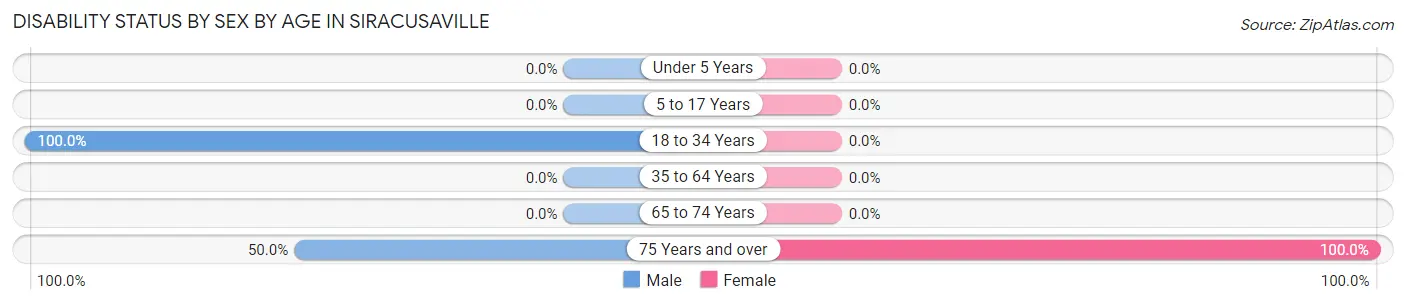
| Age Bracket | Male | Female |
| Under 5 Years | 0 (0.0%) | 0 (0.0%) |
| 5 to 17 Years | 0 (0.0%) | 0 (0.0%) |
| 18 to 34 Years | 41 (100.0%) | 0 (0.0%) |
| 35 to 64 Years | 0 (0.0%) | 0 (0.0%) |
| 65 to 74 Years | 0 (0.0%) | 0 (0.0%) |
| 75 Years and over | 28 (50.0%) | 71 (100.0%) |
Disability Class by Sex by Age in Siracusaville
Disability Class: Hearing Difficulty
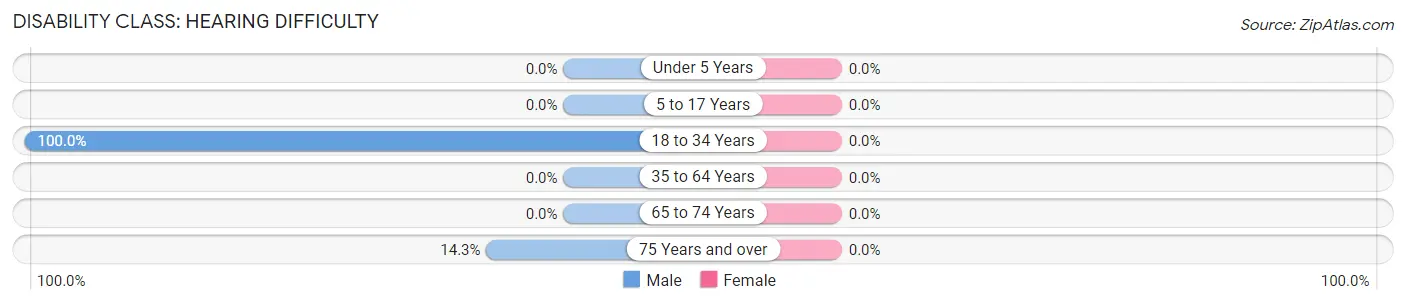
| Age Bracket | Male | Female |
| Under 5 Years | 0 (0.0%) | 0 (0.0%) |
| 5 to 17 Years | 0 (0.0%) | 0 (0.0%) |
| 18 to 34 Years | 41 (100.0%) | 0 (0.0%) |
| 35 to 64 Years | 0 (0.0%) | 0 (0.0%) |
| 65 to 74 Years | 0 (0.0%) | 0 (0.0%) |
| 75 Years and over | 8 (14.3%) | 0 (0.0%) |
Disability Class: Vision Difficulty
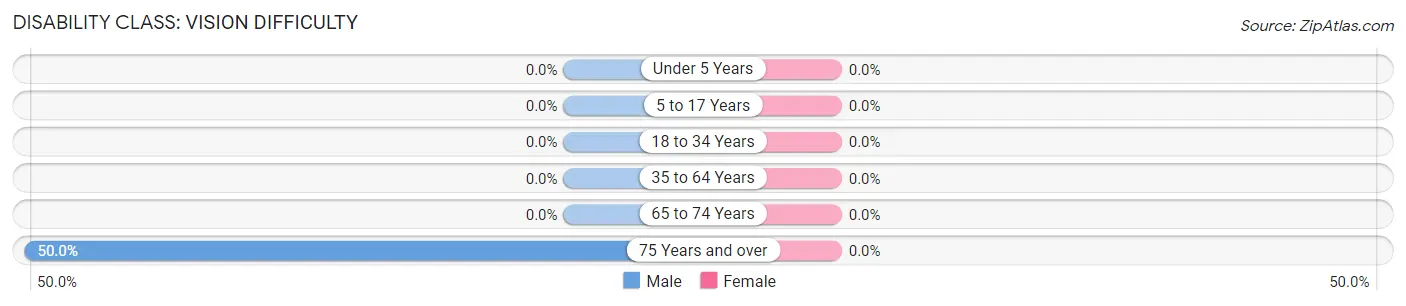
| Age Bracket | Male | Female |
| Under 5 Years | 0 (0.0%) | 0 (0.0%) |
| 5 to 17 Years | 0 (0.0%) | 0 (0.0%) |
| 18 to 34 Years | 0 (0.0%) | 0 (0.0%) |
| 35 to 64 Years | 0 (0.0%) | 0 (0.0%) |
| 65 to 74 Years | 0 (0.0%) | 0 (0.0%) |
| 75 Years and over | 28 (50.0%) | 0 (0.0%) |
Disability Class: Cognitive Difficulty
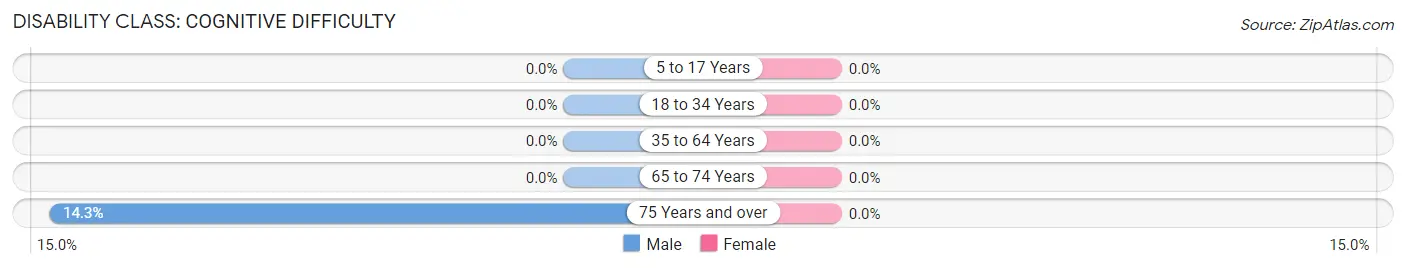
| Age Bracket | Male | Female |
| 5 to 17 Years | 0 (0.0%) | 0 (0.0%) |
| 18 to 34 Years | 0 (0.0%) | 0 (0.0%) |
| 35 to 64 Years | 0 (0.0%) | 0 (0.0%) |
| 65 to 74 Years | 0 (0.0%) | 0 (0.0%) |
| 75 Years and over | 8 (14.3%) | 0 (0.0%) |
Disability Class: Ambulatory Difficulty
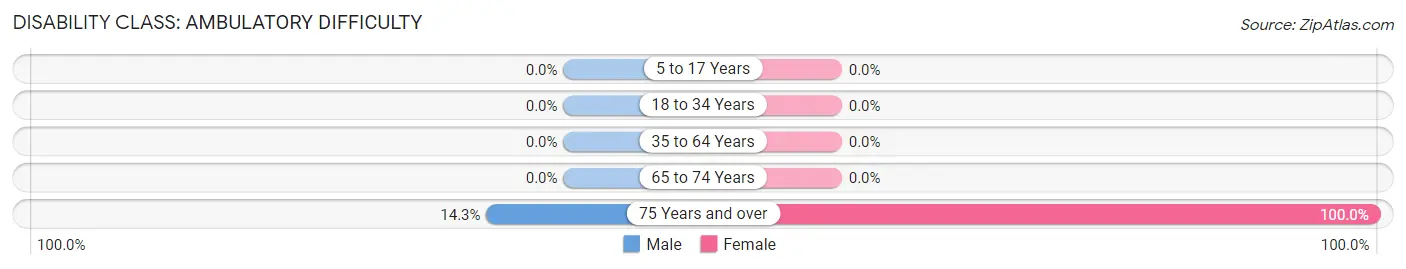
| Age Bracket | Male | Female |
| 5 to 17 Years | 0 (0.0%) | 0 (0.0%) |
| 18 to 34 Years | 0 (0.0%) | 0 (0.0%) |
| 35 to 64 Years | 0 (0.0%) | 0 (0.0%) |
| 65 to 74 Years | 0 (0.0%) | 0 (0.0%) |
| 75 Years and over | 8 (14.3%) | 71 (100.0%) |
Disability Class: Self-Care Difficulty
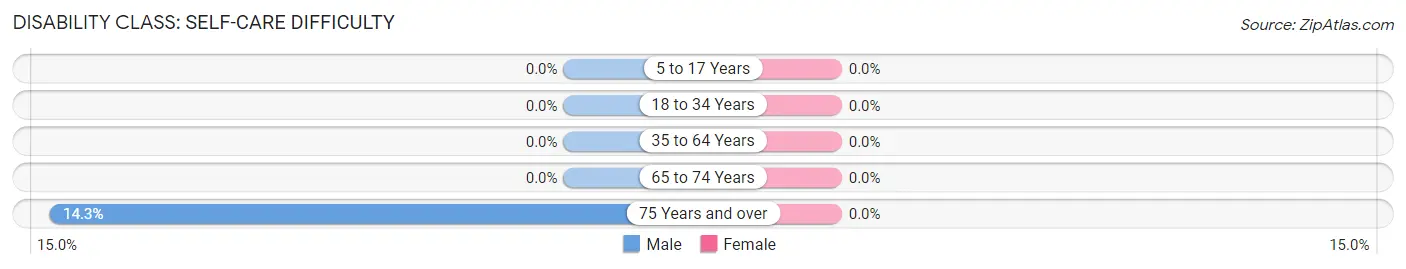
| Age Bracket | Male | Female |
| 5 to 17 Years | 0 (0.0%) | 0 (0.0%) |
| 18 to 34 Years | 0 (0.0%) | 0 (0.0%) |
| 35 to 64 Years | 0 (0.0%) | 0 (0.0%) |
| 65 to 74 Years | 0 (0.0%) | 0 (0.0%) |
| 75 Years and over | 8 (14.3%) | 0 (0.0%) |
Technology Access in Siracusaville
Computing Device Access in Siracusaville
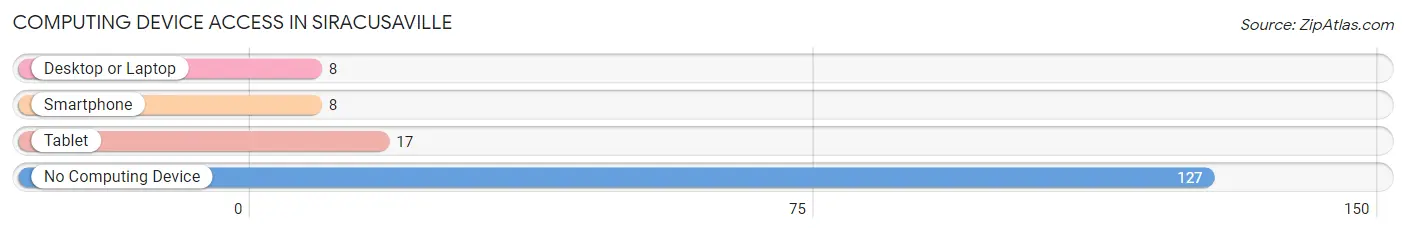
| Device Type | # Households | % Households |
| Desktop or Laptop | 8 | 5.3% |
| Smartphone | 8 | 5.3% |
| Tablet | 17 | 11.2% |
| No Computing Device | 127 | 83.6% |
| Total | 152 | 100.0% |
Internet Access in Siracusaville
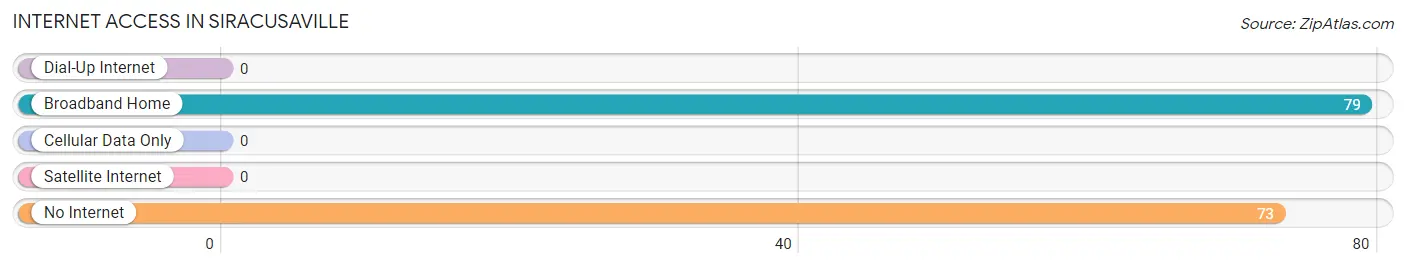
| Internet Type | # Households | % Households |
| Dial-Up Internet | 0 | 0.0% |
| Broadband Home | 79 | 52.0% |
| Cellular Data Only | 0 | 0.0% |
| Satellite Internet | 0 | 0.0% |
| No Internet | 73 | 48.0% |
| Total | 152 | 100.0% |
Siracusaville Summary
Siracusaville is a small town located in the state of Louisiana, United States. It is situated in the northern part of the state, near the border with Arkansas. The town has a population of approximately 1,500 people and is part of the larger DeSoto Parish.
History
Siracusaville was founded in 1845 by a group of settlers from Sicily. The town was named after the Sicilian city of Syracuse, and the settlers brought with them their culture and traditions. The town was originally a farming community, and the settlers grew cotton, corn, and other crops. The town was also known for its brick-making industry, which was established in the late 19th century.
In the early 20th century, Siracusaville began to experience a period of growth and prosperity. The town was home to several businesses, including a bank, a hotel, and a movie theater. The town also had a thriving music scene, with several jazz and blues clubs.
Geography
Siracusaville is located in the northern part of Louisiana, near the border with Arkansas. The town is situated on the banks of the Red River, which is a major tributary of the Mississippi River. The town is surrounded by rolling hills and forests, and is located in a region known as the Red River Valley.
The climate in Siracusaville is humid subtropical, with hot summers and mild winters. The average annual temperature is around 70 degrees Fahrenheit, and the average annual precipitation is around 50 inches.
Economy
The economy of Siracusaville is largely based on agriculture. The town is home to several farms, which produce cotton, corn, soybeans, and other crops. The town is also home to several manufacturing companies, which produce a variety of products, including furniture, clothing, and electronics.
The town is also home to several small businesses, including restaurants, shops, and other services. The town is also home to a few tourist attractions, including a museum and a historic district.
Demographics
As of the 2010 census, the population of Siracusaville was 1,500. The town is predominantly white, with a small African American population. The median household income is around $30,000, and the median home value is around $100,000.
The town is served by the DeSoto Parish School District, which includes several elementary, middle, and high schools. The town is also home to a few churches, including the First Baptist Church and the Church of the Nazarene.
Conclusion
Siracusaville is a small town located in the northern part of Louisiana, near the border with Arkansas. The town has a population of approximately 1,500 people and is part of the larger DeSoto Parish. The town was founded in 1845 by a group of settlers from Sicily, and the town is still home to many of their descendants. The town is largely based on agriculture, and is also home to several small businesses and tourist attractions. The town is predominantly white, with a small African American population. The median household income is around $30,000, and the median home value is around $100,000.
Common Questions
What is Per Capita Income in Siracusaville?
Per Capita income in Siracusaville is $34,511.
What is the Median Family Income in Siracusaville?
Median Family Income in Siracusaville is $73,803.
What is the Median Household income in Siracusaville?
Median Household Income in Siracusaville is $73,310.
What is Inequality or Gini Index in Siracusaville?
Inequality or Gini Index in Siracusaville is 0.23.
What is the Total Population of Siracusaville?
Total Population of Siracusaville is 369.
What is the Total Male Population of Siracusaville?
Total Male Population of Siracusaville is 170.
What is the Total Female Population of Siracusaville?
Total Female Population of Siracusaville is 199.
What is the Ratio of Males per 100 Females in Siracusaville?
There are 85.43 Males per 100 Females in Siracusaville.
What is the Ratio of Females per 100 Males in Siracusaville?
There are 117.06 Females per 100 Males in Siracusaville.
What is the Median Population Age in Siracusaville?
Median Population Age in Siracusaville is 69.1 Years.
What is the Average Family Size in Siracusaville
Average Family Size in Siracusaville is 2.8 People.
What is the Average Household Size in Siracusaville
Average Household Size in Siracusaville is 2.4 People.
How Large is the Labor Force in Siracusaville?
There are 110 People in the Labor Forcein in Siracusaville.
What is the Percentage of People in the Labor Force in Siracusaville?
29.8% of People are in the Labor Force in Siracusaville.