West Feliciana Parish, LA Map & Demographics
West Feliciana Parish Map
West Feliciana Parish Overview
$30,055
PER CAPITA INCOME
$84,426
AVG FAMILY INCOME
$71,985
AVG HOUSEHOLD INCOME
24.9%
WAGE / INCOME GAP [ % ]
75.1¢/ $1
WAGE / INCOME GAP [ $ ]
$9,747
FAMILY INCOME DEFICIT
0.48
INEQUALITY / GINI INDEX
15,358
TOTAL POPULATION
10,458
MALE POPULATION
4,900
FEMALE POPULATION
213.43
MALES / 100 FEMALES
46.85
FEMALES / 100 MALES
42.6
MEDIAN AGE
3.8
AVG FAMILY SIZE
3.1
AVG HOUSEHOLD SIZE
6,189
LABOR FORCE [ PEOPLE ]
47.0%
PERCENT IN LABOR FORCE
8.9%
UNEMPLOYMENT RATE
West Feliciana Parish Area Codes
Income in West Feliciana Parish
Income Overview in West Feliciana Parish
Per Capita Income in West Feliciana Parish is $30,055, while median incomes of families and households are $84,426 and $71,985 respectively.
| Characteristic | Number | Measure |
| Per Capita Income | 15,358 | $30,055 |
| Median Family Income | 2,731 | $84,426 |
| Mean Family Income | 2,731 | $121,982 |
| Median Household Income | 3,822 | $71,985 |
| Mean Household Income | 3,822 | $102,485 |
| Income Deficit | 2,731 | $9,747 |
| Wage / Income Gap (%) | 15,358 | 24.91% |
| Wage / Income Gap ($) | 15,358 | 75.09¢ per $1 |
| Gini / Inequality Index | 15,358 | 0.48 |
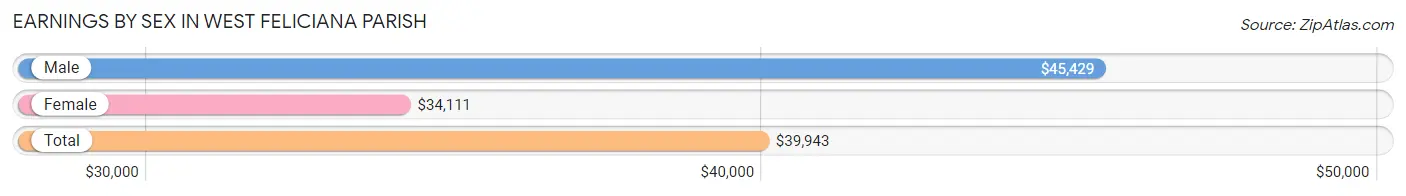
Earnings by Sex in West Feliciana Parish
Average Earnings in West Feliciana Parish are $39,943, $45,429 for men and $34,111 for women, a difference of 24.9%.
| Sex | Number | Average Earnings |
| Male | 4,279 (65.0%) | $45,429 |
| Female | 2,308 (35.0%) | $34,111 |
| Total | 6,587 (100.0%) | $39,943 |
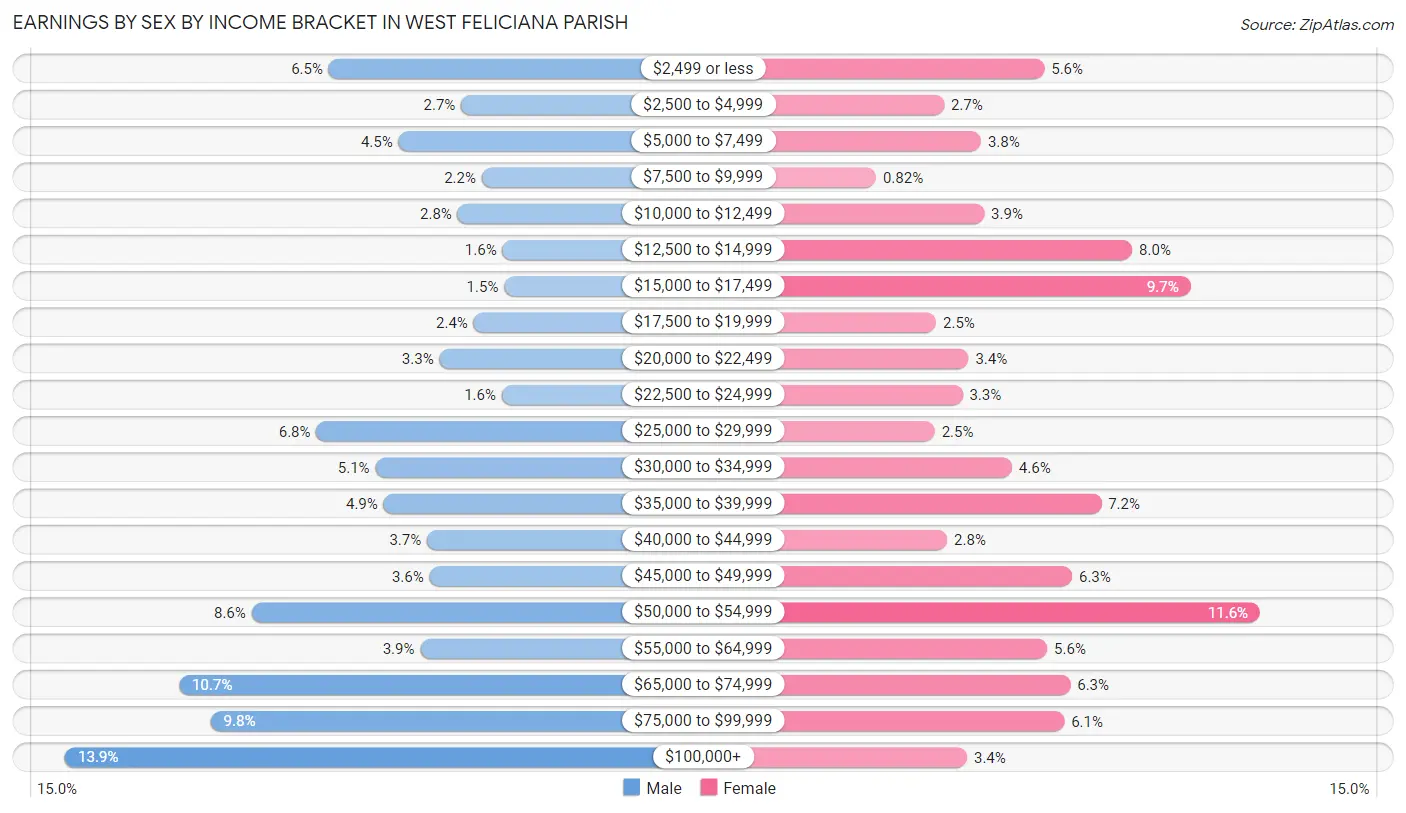
Earnings by Sex by Income Bracket in West Feliciana Parish
The most common earnings brackets in West Feliciana Parish are $100,000+ for men (593 | 13.9%) and $50,000 to $54,999 for women (268 | 11.6%).
| Income | Male | Female |
| $2,499 or less | 276 (6.5%) | 128 (5.6%) |
| $2,500 to $4,999 | 117 (2.7%) | 63 (2.7%) |
| $5,000 to $7,499 | 192 (4.5%) | 87 (3.8%) |
| $7,500 to $9,999 | 92 (2.1%) | 19 (0.8%) |
| $10,000 to $12,499 | 121 (2.8%) | 89 (3.9%) |
| $12,500 to $14,999 | 67 (1.6%) | 185 (8.0%) |
| $15,000 to $17,499 | 65 (1.5%) | 223 (9.7%) |
| $17,500 to $19,999 | 102 (2.4%) | 58 (2.5%) |
| $20,000 to $22,499 | 143 (3.3%) | 79 (3.4%) |
| $22,500 to $24,999 | 68 (1.6%) | 75 (3.3%) |
| $25,000 to $29,999 | 291 (6.8%) | 57 (2.5%) |
| $30,000 to $34,999 | 220 (5.1%) | 107 (4.6%) |
| $35,000 to $39,999 | 210 (4.9%) | 165 (7.1%) |
| $40,000 to $44,999 | 158 (3.7%) | 65 (2.8%) |
| $45,000 to $49,999 | 155 (3.6%) | 146 (6.3%) |
| $50,000 to $54,999 | 369 (8.6%) | 268 (11.6%) |
| $55,000 to $64,999 | 166 (3.9%) | 130 (5.6%) |
| $65,000 to $74,999 | 456 (10.7%) | 145 (6.3%) |
| $75,000 to $99,999 | 418 (9.8%) | 141 (6.1%) |
| $100,000+ | 593 (13.9%) | 78 (3.4%) |
| Total | 4,279 (100.0%) | 2,308 (100.0%) |
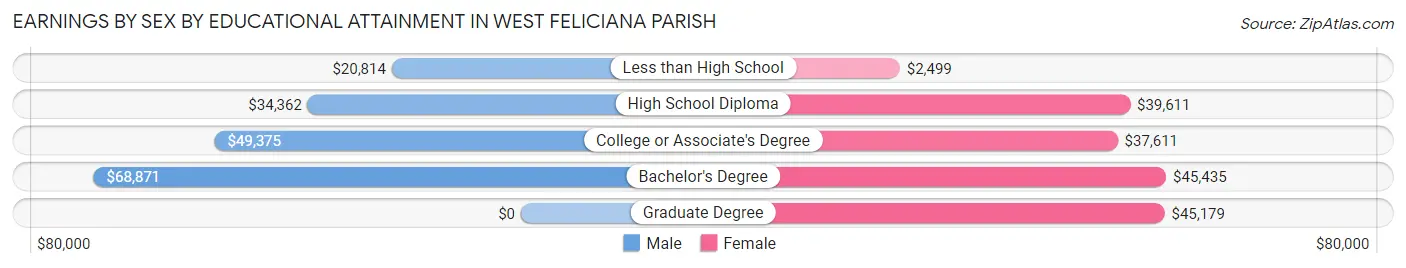
Earnings by Sex by Educational Attainment in West Feliciana Parish
Average earnings in West Feliciana Parish are $51,012 for men and $38,759 for women, a difference of 24.0%. Men with an educational attainment of bachelor's degree enjoy the highest average annual earnings of $68,871, while those with less than high school education earn the least with $20,814. Women with an educational attainment of bachelor's degree earn the most with the average annual earnings of $45,435, while those with less than high school education have the smallest earnings of $2,499.
| Educational Attainment | Male Income | Female Income |
| Less than High School | $20,814 | $2,499 |
| High School Diploma | $34,362 | $39,611 |
| College or Associate's Degree | $49,375 | $37,611 |
| Bachelor's Degree | $68,871 | $45,435 |
| Graduate Degree | - | - |
| Total | $51,012 | $38,759 |
Family Income in West Feliciana Parish
Family Income Brackets in West Feliciana Parish
According to the West Feliciana Parish family income data, there are 511 families falling into the $100,000 to $149,999 income range, which is the most common income bracket and makes up 18.7% of all families. Conversely, the $10,000 to $14,999 income bracket is the least frequent group with only 27 families (1.0%) belonging to this category.
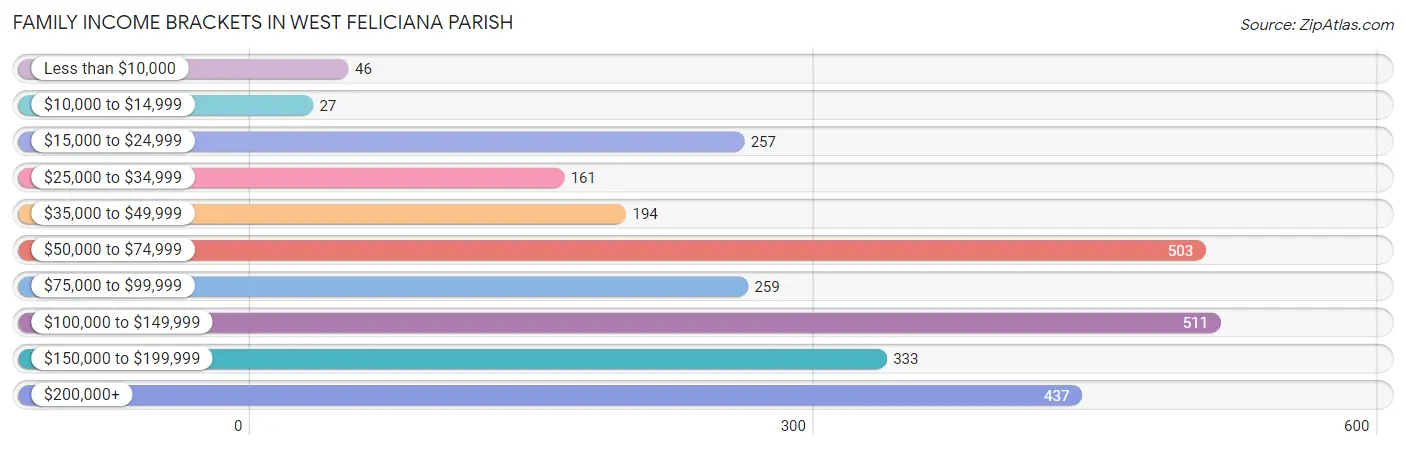
| Income Bracket | # Families | % Families |
| Less than $10,000 | 46 | 1.7% |
| $10,000 to $14,999 | 27 | 1.0% |
| $15,000 to $24,999 | 257 | 9.4% |
| $25,000 to $34,999 | 161 | 5.9% |
| $35,000 to $49,999 | 194 | 7.1% |
| $50,000 to $74,999 | 503 | 18.4% |
| $75,000 to $99,999 | 259 | 9.5% |
| $100,000 to $149,999 | 511 | 18.7% |
| $150,000 to $199,999 | 333 | 12.2% |
| $200,000+ | 437 | 16.0% |
Family Income by Famaliy Size in West Feliciana Parish
4-person families (559 | 20.5%) account for the highest median family income in West Feliciana Parish with $142,750 per family, while 2-person families (1,162 | 42.5%) have the highest median income of $40,987 per family member.
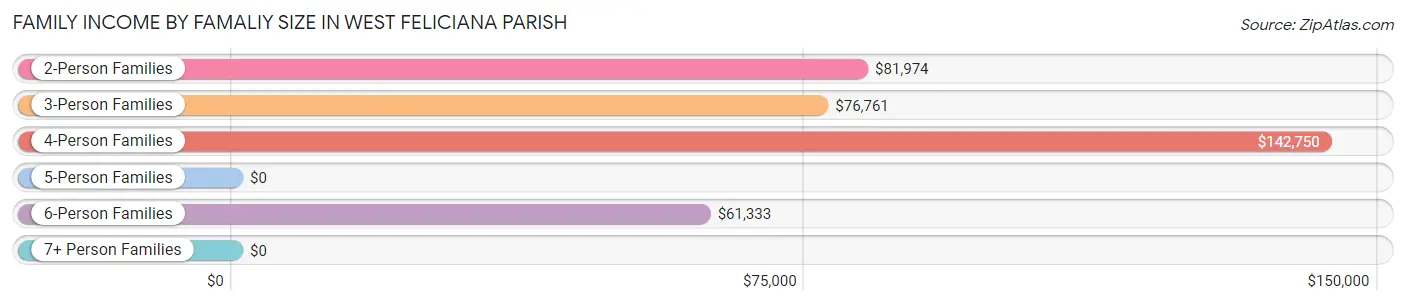
| Income Bracket | # Families | Median Income |
| 2-Person Families | 1,162 (42.5%) | $81,974 |
| 3-Person Families | 546 (20.0%) | $76,761 |
| 4-Person Families | 559 (20.5%) | $142,750 |
| 5-Person Families | 403 (14.8%) | $0 |
| 6-Person Families | 60 (2.2%) | $61,333 |
| 7+ Person Families | 1 (0.0%) | $0 |
| Total | 2,731 (100.0%) | $84,426 |
Family Income by Number of Earners in West Feliciana Parish
The median family income in West Feliciana Parish is $84,426, with families comprising 3+ earners (383) having the highest median family income of $151,406, while families with no earners (644) have the lowest median family income of $36,212, accounting for 14.0% and 23.6% of families, respectively.
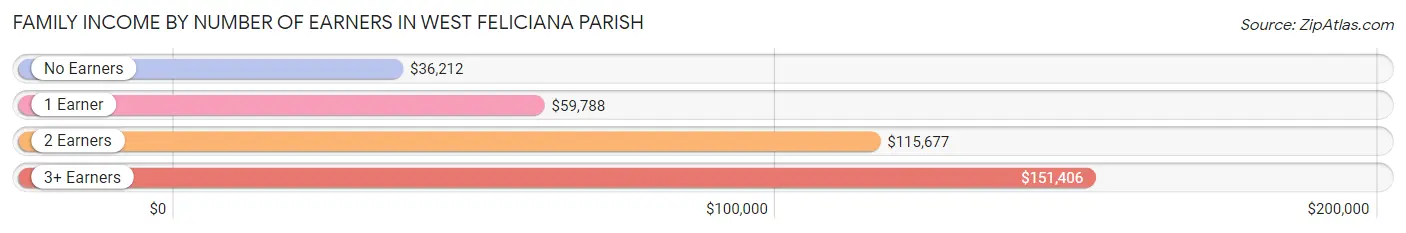
| Number of Earners | # Families | Median Income |
| No Earners | 644 (23.6%) | $36,212 |
| 1 Earner | 708 (25.9%) | $59,788 |
| 2 Earners | 996 (36.5%) | $115,677 |
| 3+ Earners | 383 (14.0%) | $151,406 |
| Total | 2,731 (100.0%) | $84,426 |
Household Income in West Feliciana Parish
Household Income Brackets in West Feliciana Parish
With 650 households falling in the category, the $50,000 to $74,999 income range is the most frequent in West Feliciana Parish, accounting for 17.0% of all households. In contrast, only 115 households (3.0%) fall into the less than $10,000 income bracket, making it the least populous group.
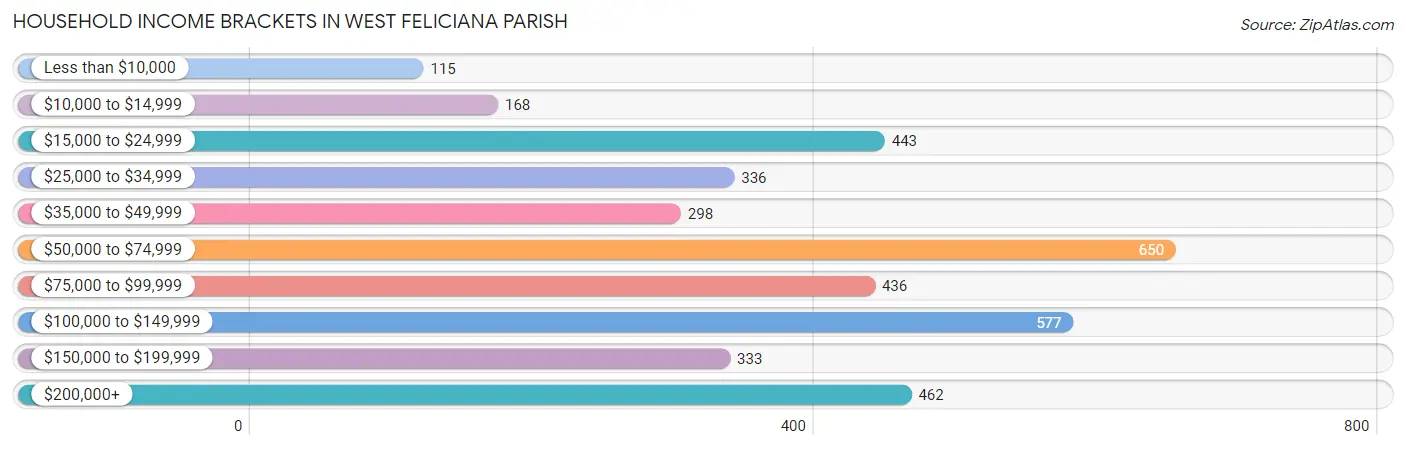
| Income Bracket | # Households | % Households |
| Less than $10,000 | 115 | 3.0% |
| $10,000 to $14,999 | 168 | 4.4% |
| $15,000 to $24,999 | 443 | 11.6% |
| $25,000 to $34,999 | 336 | 8.8% |
| $35,000 to $49,999 | 298 | 7.8% |
| $50,000 to $74,999 | 650 | 17.0% |
| $75,000 to $99,999 | 436 | 11.4% |
| $100,000 to $149,999 | 577 | 15.1% |
| $150,000 to $199,999 | 333 | 8.7% |
| $200,000+ | 462 | 12.1% |
Household Income by Householder Age in West Feliciana Parish
The median household income in West Feliciana Parish is $71,985, with the highest median household income of $80,156 found in the 45 to 64 years age bracket for the primary householder. A total of 1,516 households (39.7%) fall into this category. Meanwhile, the 15 to 24 years age bracket for the primary householder has the lowest median household income of $53,583, with 68 households (1.8%) in this group.
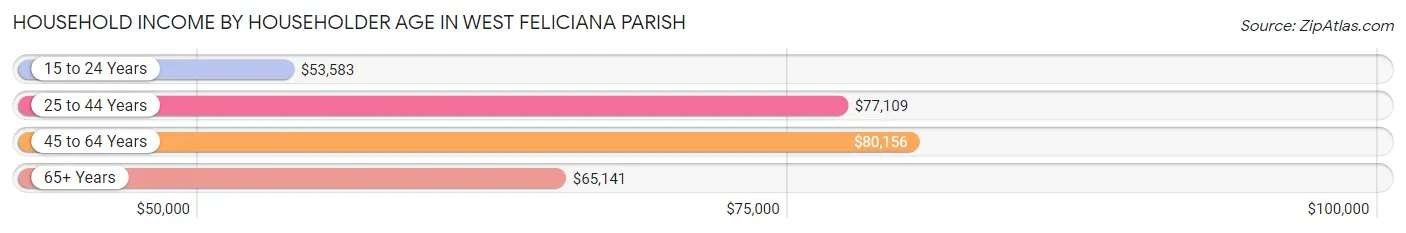
| Income Bracket | # Households | Median Income |
| 15 to 24 Years | 68 (1.8%) | $53,583 |
| 25 to 44 Years | 1,140 (29.8%) | $77,109 |
| 45 to 64 Years | 1,516 (39.7%) | $80,156 |
| 65+ Years | 1,098 (28.7%) | $65,141 |
| Total | 3,822 (100.0%) | $71,985 |
Poverty in West Feliciana Parish
Income Below Poverty by Sex and Age in West Feliciana Parish
With 16.3% poverty level for males and 11.3% for females among the residents of West Feliciana Parish, under 5 year old males and 5 year old females are the most vulnerable to poverty, with 169 males (46.1%) and 65 females (38.5%) in their respective age groups living below the poverty level.
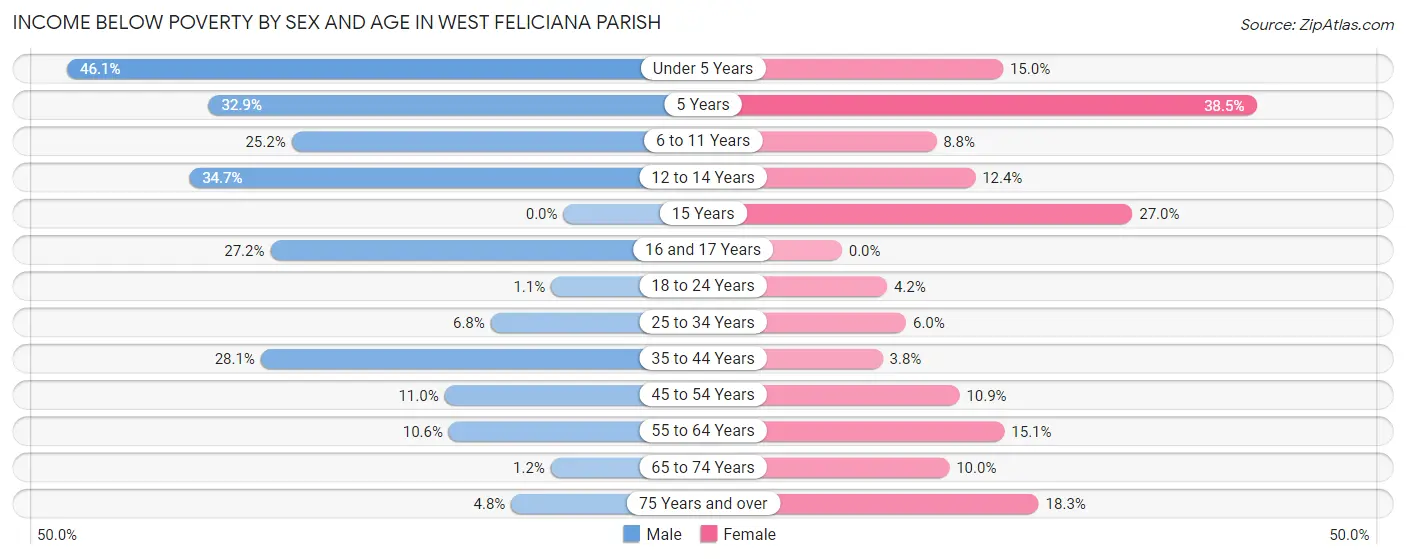
| Age Bracket | Male | Female |
| Under 5 Years | 169 (46.1%) | 35 (15.0%) |
| 5 Years | 27 (32.9%) | 65 (38.5%) |
| 6 to 11 Years | 108 (25.2%) | 29 (8.8%) |
| 12 to 14 Years | 100 (34.7%) | 13 (12.4%) |
| 15 Years | 0 (0.0%) | 31 (27.0%) |
| 16 and 17 Years | 65 (27.2%) | 0 (0.0%) |
| 18 to 24 Years | 7 (1.1%) | 14 (4.2%) |
| 25 to 34 Years | 81 (6.8%) | 33 (6.0%) |
| 35 to 44 Years | 380 (28.1%) | 25 (3.8%) |
| 45 to 54 Years | 112 (11.0%) | 65 (10.9%) |
| 55 to 64 Years | 57 (10.6%) | 104 (15.1%) |
| 65 to 74 Years | 5 (1.2%) | 64 (10.0%) |
| 75 Years and over | 15 (4.8%) | 72 (18.3%) |
| Total | 1,126 (16.3%) | 550 (11.3%) |
Income Above Poverty by Sex and Age in West Feliciana Parish
According to the poverty statistics in West Feliciana Parish, males aged 15 years and females aged 16 and 17 years are the age groups that are most secure financially, with 100.0% of males and 100.0% of females in these age groups living above the poverty line.
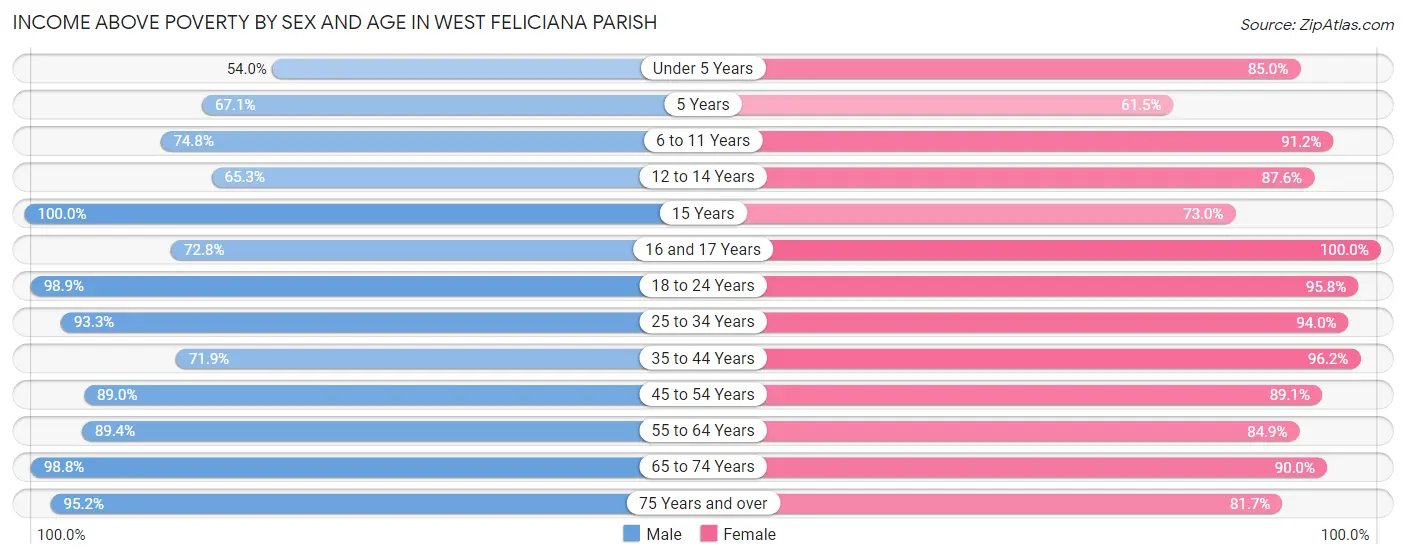
| Age Bracket | Male | Female |
| Under 5 Years | 198 (53.9%) | 199 (85.0%) |
| 5 Years | 55 (67.1%) | 104 (61.5%) |
| 6 to 11 Years | 320 (74.8%) | 302 (91.2%) |
| 12 to 14 Years | 188 (65.3%) | 92 (87.6%) |
| 15 Years | 70 (100.0%) | 84 (73.0%) |
| 16 and 17 Years | 174 (72.8%) | 48 (100.0%) |
| 18 to 24 Years | 607 (98.9%) | 320 (95.8%) |
| 25 to 34 Years | 1,119 (93.2%) | 521 (94.0%) |
| 35 to 44 Years | 973 (71.9%) | 635 (96.2%) |
| 45 to 54 Years | 903 (89.0%) | 530 (89.1%) |
| 55 to 64 Years | 479 (89.4%) | 585 (84.9%) |
| 65 to 74 Years | 417 (98.8%) | 578 (90.0%) |
| 75 Years and over | 295 (95.2%) | 322 (81.7%) |
| Total | 5,798 (83.7%) | 4,320 (88.7%) |
Income Below Poverty Among Married-Couple Families in West Feliciana Parish
The poverty statistics for married-couple families in West Feliciana Parish show that 2.7% or 53 of the total 1,964 families live below the poverty line. Families with 3 or 4 children have the highest poverty rate of 14.6%, comprising of 22 families. On the other hand, families with 1 or 2 children have the lowest poverty rate of 1.1%, which includes 7 families.
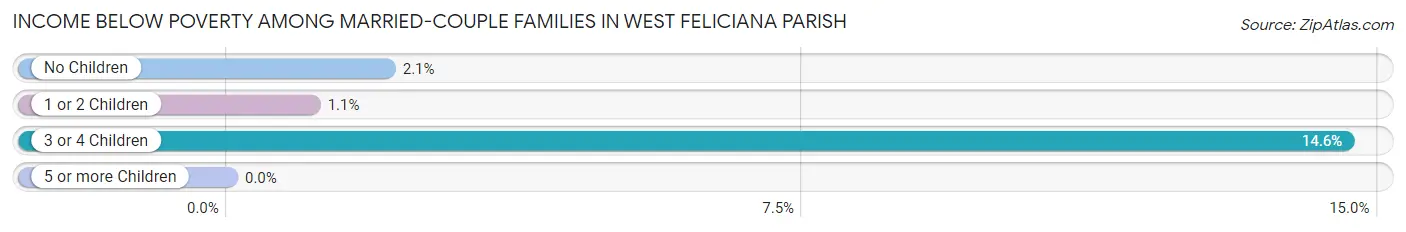
| Children | Above Poverty | Below Poverty |
| No Children | 1,143 (97.9%) | 24 (2.1%) |
| 1 or 2 Children | 639 (98.9%) | 7 (1.1%) |
| 3 or 4 Children | 129 (85.4%) | 22 (14.6%) |
| 5 or more Children | 0 (0.0%) | 0 (0.0%) |
| Total | 1,911 (97.3%) | 53 (2.7%) |
Income Below Poverty Among Single-Parent Households in West Feliciana Parish
According to the poverty data in West Feliciana Parish, 69.6% or 220 single-father households and 16.2% or 73 single-mother households are living below the poverty line. Among single-father households, those with 3 or 4 children have the highest poverty rate, with 175 households (94.6%) experiencing poverty. Likewise, among single-mother households, those with 5 or more children have the highest poverty rate, with 1 households (100.0%) falling below the poverty line.
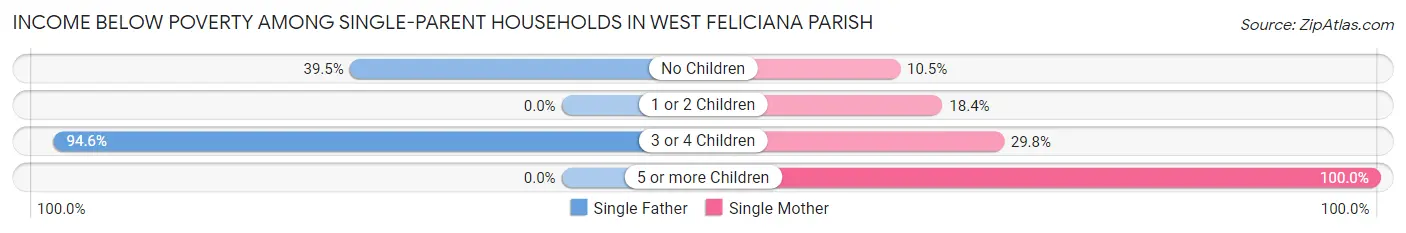
| Children | Single Father | Single Mother |
| No Children | 45 (39.5%) | 23 (10.5%) |
| 1 or 2 Children | 0 (0.0%) | 32 (18.4%) |
| 3 or 4 Children | 175 (94.6%) | 17 (29.8%) |
| 5 or more Children | 0 (0.0%) | 1 (100.0%) |
| Total | 220 (69.6%) | 73 (16.2%) |
Income Below Poverty Among Married-Couple vs Single-Parent Households in West Feliciana Parish
The poverty data for West Feliciana Parish shows that 53 of the married-couple family households (2.7%) and 293 of the single-parent households (38.2%) are living below the poverty level. Within the married-couple family households, those with 3 or 4 children have the highest poverty rate, with 22 households (14.6%) falling below the poverty line. Among the single-parent households, those with 5 or more children have the highest poverty rate, with 1 household (100.0%) living below poverty.
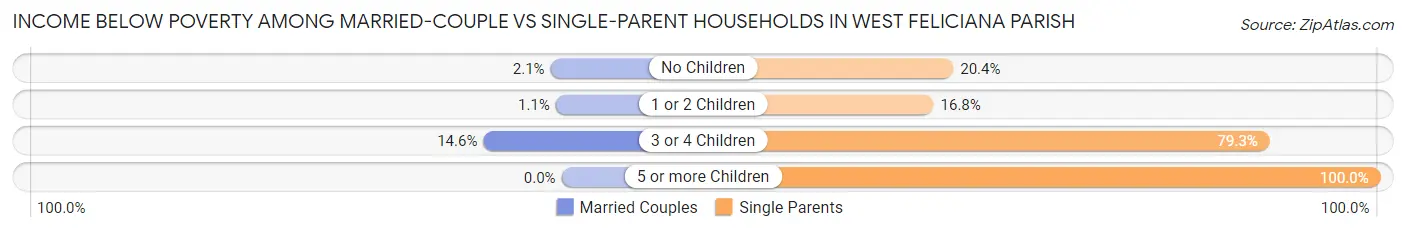
| Children | Married-Couple Families | Single-Parent Households |
| No Children | 24 (2.1%) | 68 (20.4%) |
| 1 or 2 Children | 7 (1.1%) | 32 (16.8%) |
| 3 or 4 Children | 22 (14.6%) | 192 (79.3%) |
| 5 or more Children | 0 (0.0%) | 1 (100.0%) |
| Total | 53 (2.7%) | 293 (38.2%) |
Race in West Feliciana Parish
The most populous races in West Feliciana Parish are White / Caucasian (8,048 | 52.4%), Black / African American (6,803 | 44.3%), and Two or more Races (370 | 2.4%).
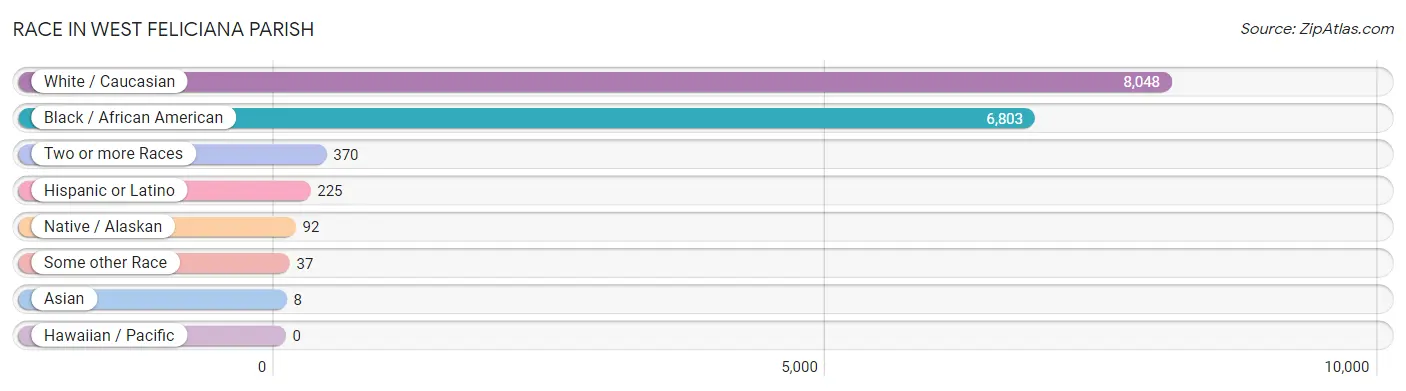
| Race | # Population | % Population |
| Asian | 8 | 0.1% |
| Black / African American | 6,803 | 44.3% |
| Hawaiian / Pacific | 0 | 0.0% |
| Hispanic or Latino | 225 | 1.5% |
| Native / Alaskan | 92 | 0.6% |
| White / Caucasian | 8,048 | 52.4% |
| Two or more Races | 370 | 2.4% |
| Some other Race | 37 | 0.2% |
| Total | 15,358 | 100.0% |
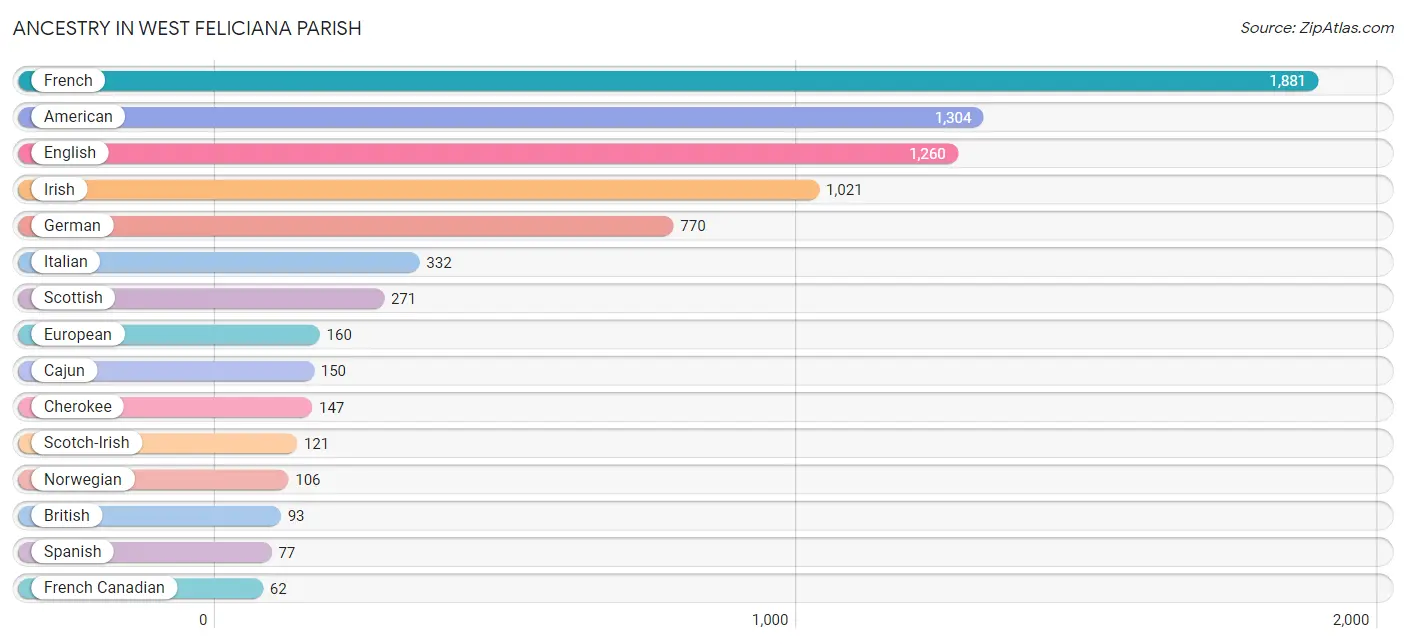
Ancestry in West Feliciana Parish
The most populous ancestries reported in West Feliciana Parish are French (1,881 | 12.2%), American (1,304 | 8.5%), English (1,260 | 8.2%), Irish (1,021 | 6.7%), and German (770 | 5.0%), together accounting for 40.6% of all West Feliciana Parish residents.
| Ancestry | # Population | % Population |
| African | 42 | 0.3% |
| American | 1,304 | 8.5% |
| Arab | 29 | 0.2% |
| Belgian | 13 | 0.1% |
| Blackfeet | 14 | 0.1% |
| British | 93 | 0.6% |
| Cajun | 150 | 1.0% |
| Canadian | 14 | 0.1% |
| Central American | 51 | 0.3% |
| Cherokee | 147 | 1.0% |
| Chickasaw | 4 | 0.0% |
| Choctaw | 9 | 0.1% |
| Creek | 11 | 0.1% |
| Cuban | 18 | 0.1% |
| Czech | 9 | 0.1% |
| Dominican | 4 | 0.0% |
| Dutch | 24 | 0.2% |
| Eastern European | 25 | 0.2% |
| English | 1,260 | 8.2% |
| European | 160 | 1.0% |
| Finnish | 3 | 0.0% |
| French | 1,881 | 12.2% |
| French Canadian | 62 | 0.4% |
| German | 770 | 5.0% |
| Greek | 4 | 0.0% |
| Haitian | 13 | 0.1% |
| Honduran | 16 | 0.1% |
| Houma | 49 | 0.3% |
| Indian (Asian) | 16 | 0.1% |
| Irish | 1,021 | 6.7% |
| Italian | 332 | 2.2% |
| Jamaican | 3 | 0.0% |
| Lebanese | 29 | 0.2% |
| Mexican | 17 | 0.1% |
| Northern European | 38 | 0.3% |
| Norwegian | 106 | 0.7% |
| Polish | 35 | 0.2% |
| Puerto Rican | 17 | 0.1% |
| Russian | 37 | 0.2% |
| Salvadoran | 35 | 0.2% |
| Scotch-Irish | 121 | 0.8% |
| Scottish | 271 | 1.8% |
| Sioux | 5 | 0.0% |
| Spaniard | 22 | 0.1% |
| Spanish | 77 | 0.5% |
| Subsaharan African | 47 | 0.3% |
| Ukrainian | 32 | 0.2% |
| Welsh | 4 | 0.0% |
| Yugoslavian | 5 | 0.0% | View All 49 Rows |
Immigrants in West Feliciana Parish
The most numerous immigrant groups reported in West Feliciana Parish came from Europe (102 | 0.7%), Africa (99 | 0.6%), South Africa (99 | 0.6%), Latin America (68 | 0.4%), and Eastern Europe (54 | 0.4%), together accounting for 2.7% of all West Feliciana Parish residents.
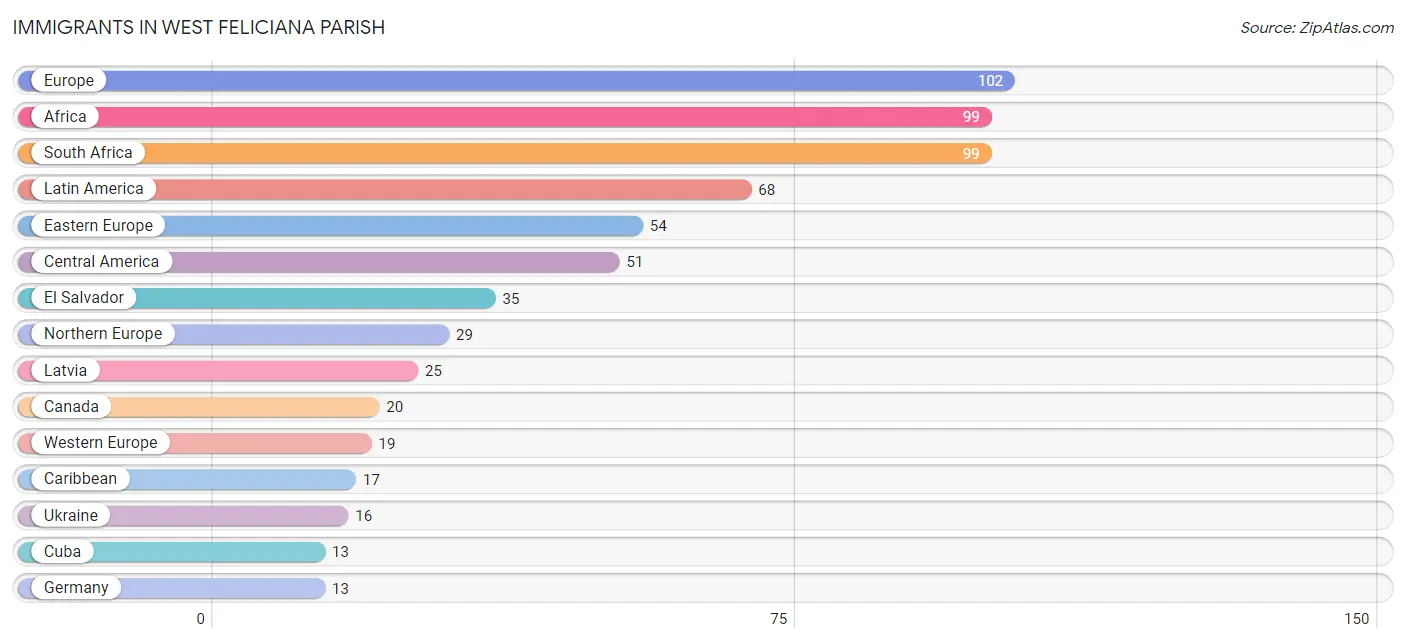
| Immigration Origin | # Population | % Population |
| Africa | 99 | 0.6% |
| Austria | 6 | 0.0% |
| Canada | 20 | 0.1% |
| Caribbean | 17 | 0.1% |
| Central America | 51 | 0.3% |
| Cuba | 13 | 0.1% |
| Dominican Republic | 4 | 0.0% |
| Eastern Europe | 54 | 0.4% |
| El Salvador | 35 | 0.2% |
| Europe | 102 | 0.7% |
| Germany | 13 | 0.1% |
| Honduras | 6 | 0.0% |
| Latin America | 68 | 0.4% |
| Latvia | 25 | 0.2% |
| Mexico | 10 | 0.1% |
| Northern Europe | 29 | 0.2% |
| Russia | 13 | 0.1% |
| South Africa | 99 | 0.6% |
| Ukraine | 16 | 0.1% |
| Western Europe | 19 | 0.1% | View All 20 Rows |
Sex and Age in West Feliciana Parish
Sex and Age in West Feliciana Parish
The most populous age groups in West Feliciana Parish are 30 to 34 Years (1,171 | 11.2%) for men and 35 to 39 Years (473 | 9.7%) for women.
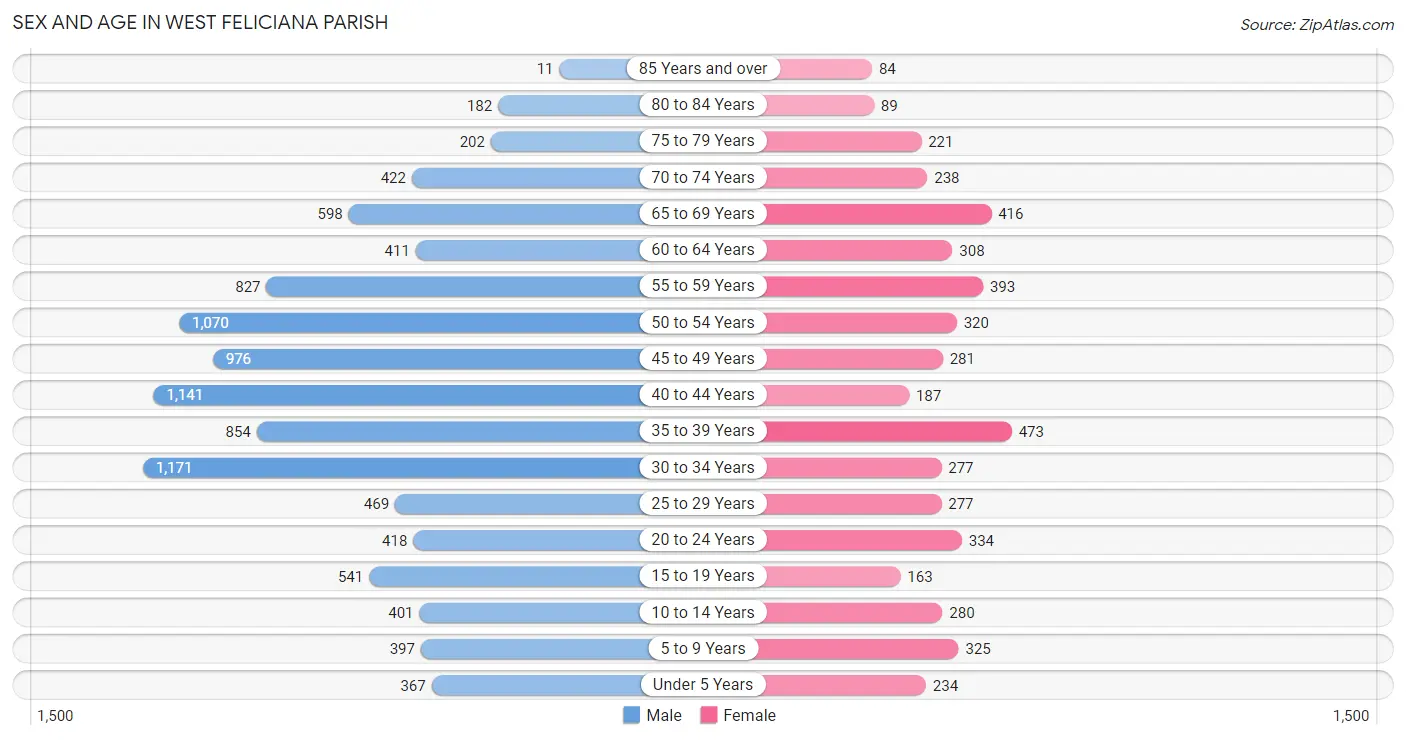
| Age Bracket | Male | Female |
| Under 5 Years | 367 (3.5%) | 234 (4.8%) |
| 5 to 9 Years | 397 (3.8%) | 325 (6.6%) |
| 10 to 14 Years | 401 (3.8%) | 280 (5.7%) |
| 15 to 19 Years | 541 (5.2%) | 163 (3.3%) |
| 20 to 24 Years | 418 (4.0%) | 334 (6.8%) |
| 25 to 29 Years | 469 (4.5%) | 277 (5.7%) |
| 30 to 34 Years | 1,171 (11.2%) | 277 (5.7%) |
| 35 to 39 Years | 854 (8.2%) | 473 (9.7%) |
| 40 to 44 Years | 1,141 (10.9%) | 187 (3.8%) |
| 45 to 49 Years | 976 (9.3%) | 281 (5.7%) |
| 50 to 54 Years | 1,070 (10.2%) | 320 (6.5%) |
| 55 to 59 Years | 827 (7.9%) | 393 (8.0%) |
| 60 to 64 Years | 411 (3.9%) | 308 (6.3%) |
| 65 to 69 Years | 598 (5.7%) | 416 (8.5%) |
| 70 to 74 Years | 422 (4.0%) | 238 (4.9%) |
| 75 to 79 Years | 202 (1.9%) | 221 (4.5%) |
| 80 to 84 Years | 182 (1.7%) | 89 (1.8%) |
| 85 Years and over | 11 (0.1%) | 84 (1.7%) |
| Total | 10,458 (100.0%) | 4,900 (100.0%) |
Families and Households in West Feliciana Parish
Median Family Size in West Feliciana Parish
The median family size in West Feliciana Parish is 3.84 persons per family, with single female/mother families (451 | 16.5%) accounting for the largest median family size of 5.22 persons per family. On the other hand, single male/father families (316 | 11.6%) represent the smallest median family size with 3.43 persons per family.
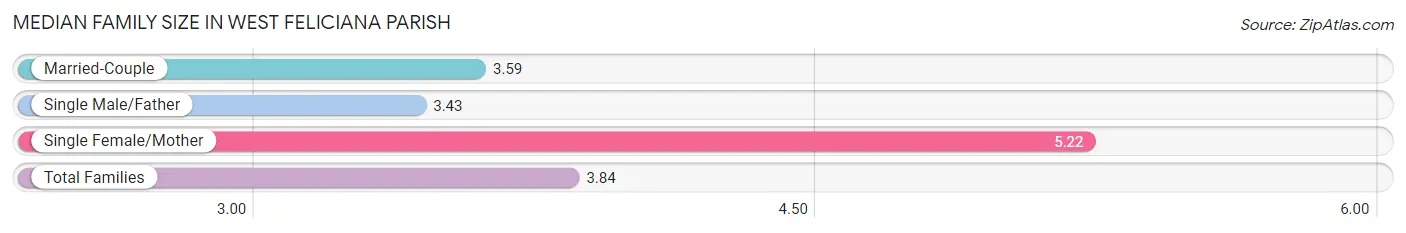
| Family Type | # Families | Family Size |
| Married-Couple | 1,964 (71.9%) | 3.59 |
| Single Male/Father | 316 (11.6%) | 3.43 |
| Single Female/Mother | 451 (16.5%) | 5.22 |
| Total Families | 2,731 (100.0%) | 3.84 |
Median Household Size in West Feliciana Parish
The median household size in West Feliciana Parish is 3.06 persons per household, with single female/mother households (451 | 11.8%) accounting for the largest median household size of 5.25 persons per household. non-family households (1,091 | 28.5%) represent the smallest median household size with 1.08 persons per household.
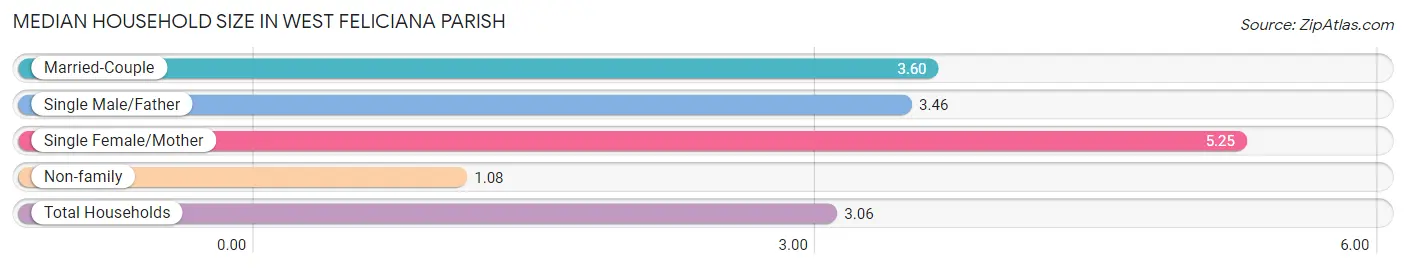
| Household Type | # Households | Household Size |
| Married-Couple | 1,964 (51.4%) | 3.60 |
| Single Male/Father | 316 (8.3%) | 3.46 |
| Single Female/Mother | 451 (11.8%) | 5.25 |
| Non-family | 1,091 (28.5%) | 1.08 |
| Total Households | 3,822 (100.0%) | 3.06 |
Household Size by Marriage Status in West Feliciana Parish
Out of a total of 3,822 households in West Feliciana Parish, 2,731 (71.5%) are family households, while 1,091 (28.5%) are nonfamily households. The most numerous type of family households are 2-person households, comprising 1,157, and the most common type of nonfamily households are 1-person households, comprising 1,026.
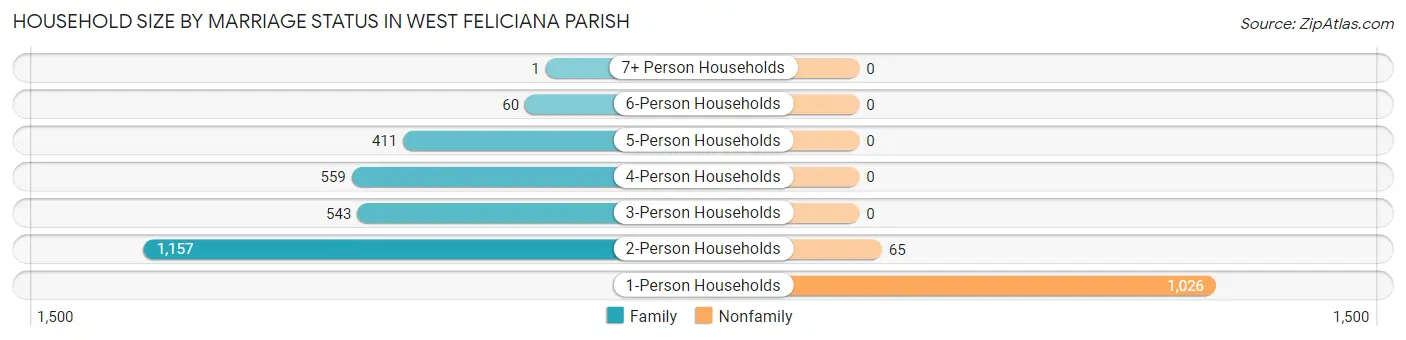
| Household Size | Family Households | Nonfamily Households |
| 1-Person Households | - | 1,026 (26.8%) |
| 2-Person Households | 1,157 (30.3%) | 65 (1.7%) |
| 3-Person Households | 543 (14.2%) | 0 (0.0%) |
| 4-Person Households | 559 (14.6%) | 0 (0.0%) |
| 5-Person Households | 411 (10.7%) | 0 (0.0%) |
| 6-Person Households | 60 (1.6%) | 0 (0.0%) |
| 7+ Person Households | 1 (0.0%) | 0 (0.0%) |
| Total | 2,731 (71.5%) | 1,091 (28.5%) |
Female Fertility in West Feliciana Parish
Fertility by Age in West Feliciana Parish
Average fertility rate in West Feliciana Parish is 57.0 births per 1,000 women. Women in the age bracket of 20 to 34 years have the highest fertility rate with 105.0 births per 1,000 women. Women in the age bracket of 20 to 34 years acount for 80.2% of all women with births.
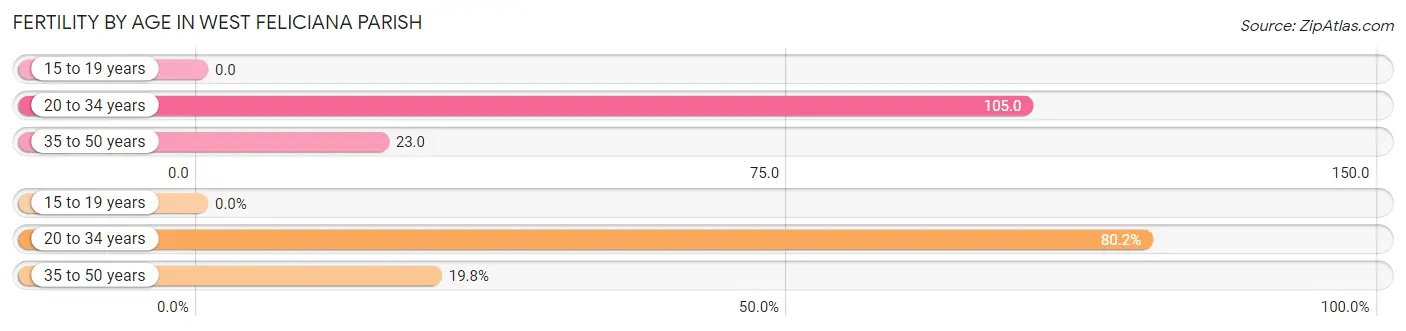
| Age Bracket | Women with Births | Births / 1,000 Women |
| 15 to 19 years | 0 (0.0%) | 0.0 |
| 20 to 34 years | 93 (80.2%) | 105.0 |
| 35 to 50 years | 23 (19.8%) | 23.0 |
| Total | 116 (100.0%) | 57.0 |
Fertility by Age by Marriage Status in West Feliciana Parish
71.6% of women with births (116) in West Feliciana Parish are married. The highest percentage of unmarried women with births falls into 20 to 34 years age bracket with 35.5% of them unmarried at the time of birth, while the lowest percentage of unmarried women with births belong to 35 to 50 years age bracket with 0.0% of them unmarried.
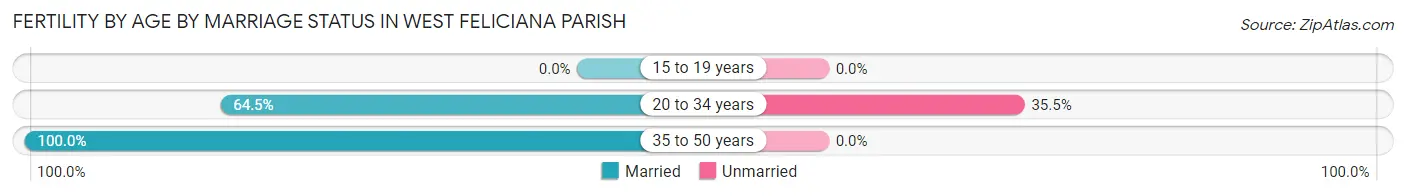
| Age Bracket | Married | Unmarried |
| 15 to 19 years | 0 (0.0%) | 0 (0.0%) |
| 20 to 34 years | 60 (64.5%) | 33 (35.5%) |
| 35 to 50 years | 23 (100.0%) | 0 (0.0%) |
| Total | 83 (71.6%) | 33 (28.4%) |
Fertility by Education in West Feliciana Parish
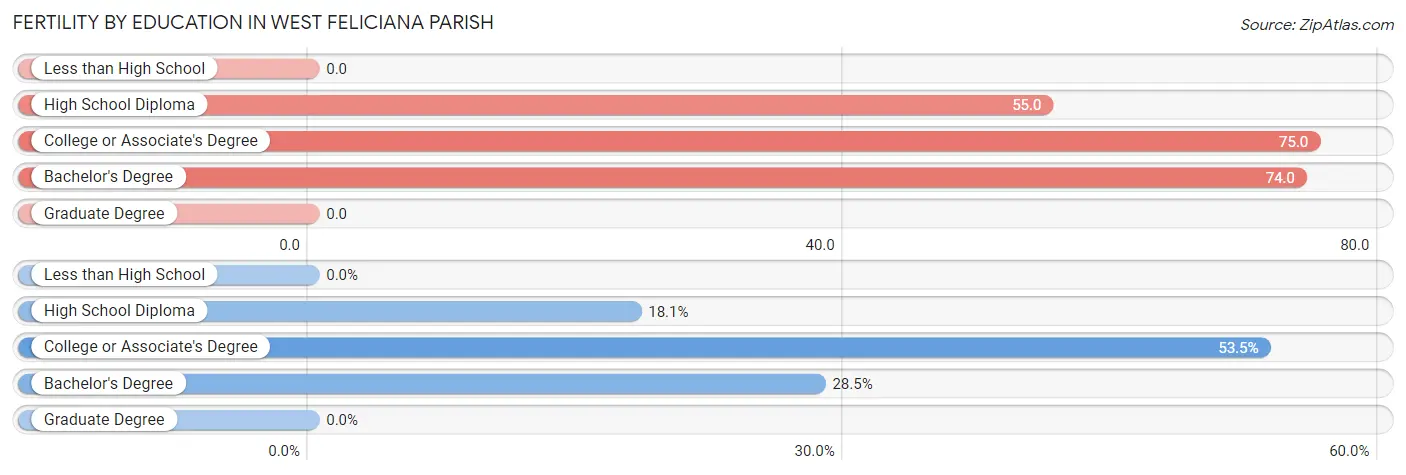
| Educational Attainment | Women with Births | Births / 1,000 Women |
| Less than High School | 0 (0.0%) | 0.0 |
| High School Diploma | 21 (18.1%) | 55.0 |
| College or Associate's Degree | 62 (53.4%) | 75.0 |
| Bachelor's Degree | 33 (28.4%) | 74.0 |
| Graduate Degree | 0 (0.0%) | 0.0 |
| Total | 116 (100.0%) | 57.0 |
Fertility by Education by Marriage Status in West Feliciana Parish
28.4% of women with births in West Feliciana Parish are unmarried. Women with the educational attainment of bachelor's degree are most likely to be married with 100.0% of them married at childbirth, while women with the educational attainment of college or associate's degree are least likely to be married with 46.8% of them unmarried at childbirth.
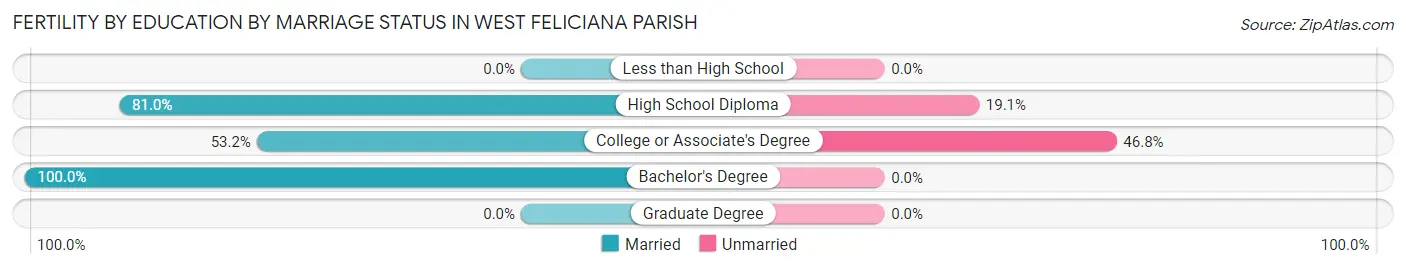
| Educational Attainment | Married | Unmarried |
| Less than High School | 0 (0.0%) | 0 (0.0%) |
| High School Diploma | 17 (80.9%) | 4 (19.1%) |
| College or Associate's Degree | 33 (53.2%) | 29 (46.8%) |
| Bachelor's Degree | 33 (100.0%) | 0 (0.0%) |
| Graduate Degree | 0 (0.0%) | 0 (0.0%) |
| Total | 83 (71.6%) | 33 (28.4%) |
Employment Characteristics in West Feliciana Parish
Employment by Class of Employer in West Feliciana Parish
Among the 5,572 employed individuals in West Feliciana Parish, private company employees (3,065 | 55.0%), state government employees (896 | 16.1%), and local government employees (542 | 9.7%) make up the most common classes of employment.
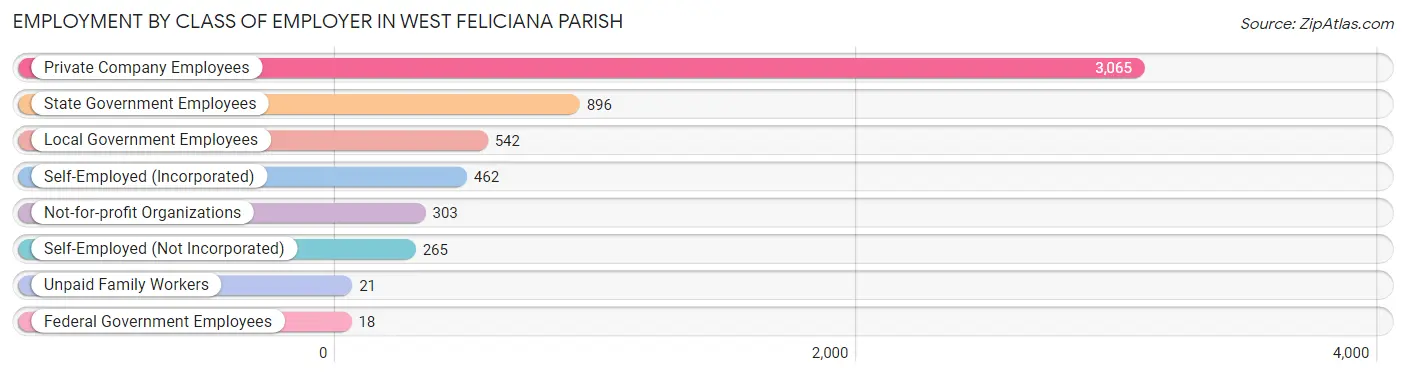
| Employer Class | # Employees | % Employees |
| Private Company Employees | 3,065 | 55.0% |
| Self-Employed (Incorporated) | 462 | 8.3% |
| Self-Employed (Not Incorporated) | 265 | 4.8% |
| Not-for-profit Organizations | 303 | 5.4% |
| Local Government Employees | 542 | 9.7% |
| State Government Employees | 896 | 16.1% |
| Federal Government Employees | 18 | 0.3% |
| Unpaid Family Workers | 21 | 0.4% |
| Total | 5,572 | 100.0% |
Employment Status by Age in West Feliciana Parish
According to the labor force statistics for West Feliciana Parish, out of the total population over 16 years of age (13,169), 47.0% or 6,189 individuals are in the labor force, with 8.9% or 551 of them unemployed. The age group with the highest labor force participation rate is 20 to 24 years, with 78.3% or 589 individuals in the labor force. Within the labor force, the 35 to 44 years age range has the highest percentage of unemployed individuals, with 17.5% or 267 of them being unemployed.
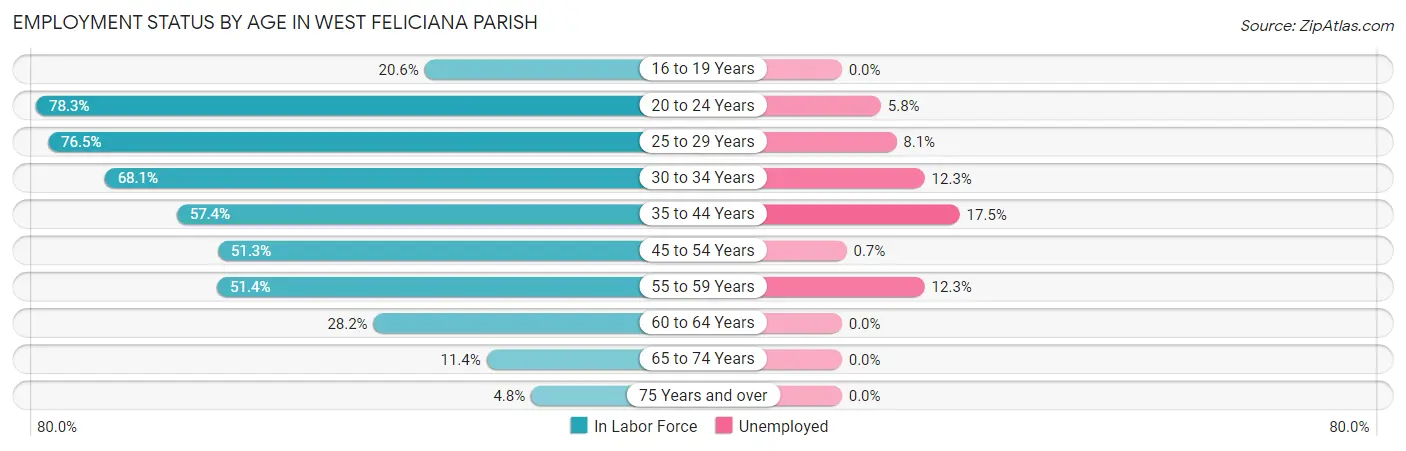
| Age Bracket | In Labor Force | Unemployed |
| 16 to 19 Years | 107 (20.6%) | 0 (0.0%) |
| 20 to 24 Years | 589 (78.3%) | 34 (5.8%) |
| 25 to 29 Years | 571 (76.5%) | 46 (8.1%) |
| 30 to 34 Years | 986 (68.1%) | 121 (12.3%) |
| 35 to 44 Years | 1,524 (57.4%) | 267 (17.5%) |
| 45 to 54 Years | 1,358 (51.3%) | 10 (0.7%) |
| 55 to 59 Years | 627 (51.4%) | 77 (12.3%) |
| 60 to 64 Years | 203 (28.2%) | 0 (0.0%) |
| 65 to 74 Years | 191 (11.4%) | 0 (0.0%) |
| 75 Years and over | 38 (4.8%) | 0 (0.0%) |
| Total | 6,189 (47.0%) | 551 (8.9%) |
Employment Status by Educational Attainment in West Feliciana Parish
According to labor force statistics for West Feliciana Parish, 55.9% of individuals (5,274) out of the total population between 25 and 64 years of age (9,435) are in the labor force, with 9.9% or 522 of them being unemployed. The group with the highest labor force participation rate are those with the educational attainment of bachelor's degree or higher, with 85.4% or 1,566 individuals in the labor force. Within the labor force, individuals with less than high school education have the highest percentage of unemployment, with 33.3% or 50 of them being unemployed.
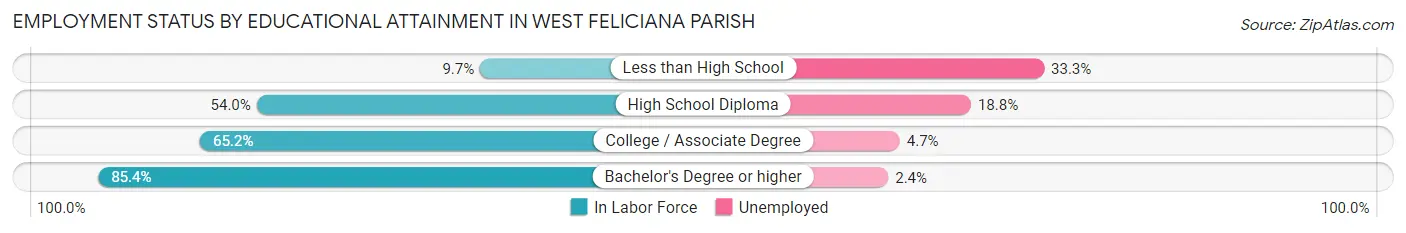
| Educational Attainment | In Labor Force | Unemployed |
| Less than High School | 150 (9.7%) | 515 (33.3%) |
| High School Diploma | 1,891 (54.0%) | 658 (18.8%) |
| College / Associate Degree | 1,665 (65.2%) | 120 (4.7%) |
| Bachelor's Degree or higher | 1,566 (85.4%) | 44 (2.4%) |
| Total | 5,274 (55.9%) | 934 (9.9%) |
Employment Occupations by Sex in West Feliciana Parish
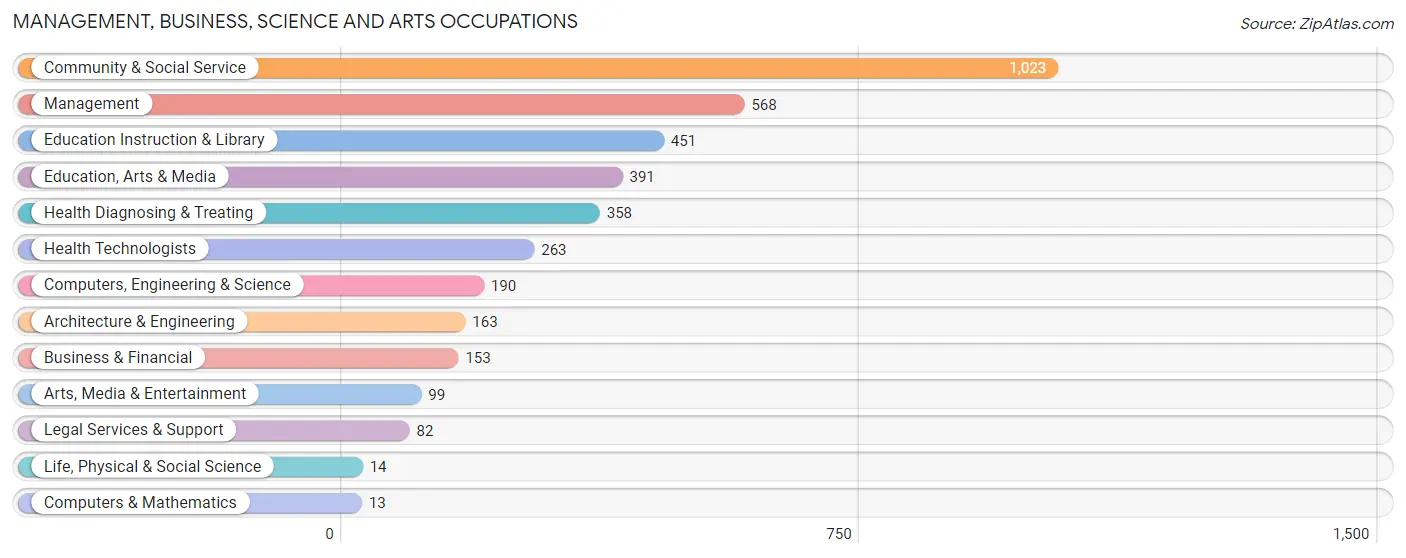
Management, Business, Science and Arts Occupations
The most common Management, Business, Science and Arts occupations in West Feliciana Parish are Community & Social Service (1,023 | 18.2%), Management (568 | 10.1%), Education Instruction & Library (451 | 8.0%), Education, Arts & Media (391 | 7.0%), and Health Diagnosing & Treating (358 | 6.4%).
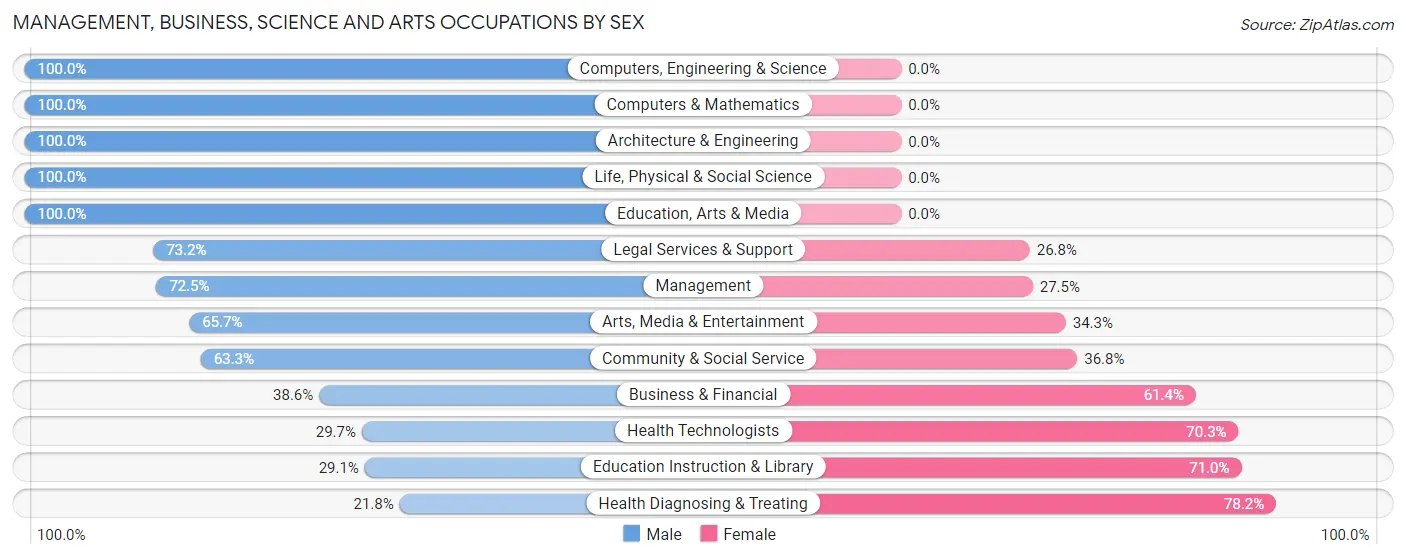
Management, Business, Science and Arts Occupations by Sex
Within the Management, Business, Science and Arts occupations in West Feliciana Parish, the most male-oriented occupations are Computers, Engineering & Science (100.0%), Computers & Mathematics (100.0%), and Architecture & Engineering (100.0%), while the most female-oriented occupations are Health Diagnosing & Treating (78.2%), Education Instruction & Library (71.0%), and Health Technologists (70.3%).
| Occupation | Male | Female |
| Management | 412 (72.5%) | 156 (27.5%) |
| Business & Financial | 59 (38.6%) | 94 (61.4%) |
| Computers, Engineering & Science | 190 (100.0%) | 0 (0.0%) |
| Computers & Mathematics | 13 (100.0%) | 0 (0.0%) |
| Architecture & Engineering | 163 (100.0%) | 0 (0.0%) |
| Life, Physical & Social Science | 14 (100.0%) | 0 (0.0%) |
| Community & Social Service | 647 (63.2%) | 376 (36.7%) |
| Education, Arts & Media | 391 (100.0%) | 0 (0.0%) |
| Legal Services & Support | 60 (73.2%) | 22 (26.8%) |
| Education Instruction & Library | 131 (29.0%) | 320 (71.0%) |
| Arts, Media & Entertainment | 65 (65.7%) | 34 (34.3%) |
| Health Diagnosing & Treating | 78 (21.8%) | 280 (78.2%) |
| Health Technologists | 78 (29.7%) | 185 (70.3%) |
| Total (Category) | 1,386 (60.5%) | 906 (39.5%) |
| Total (Overall) | 3,703 (65.8%) | 1,924 (34.2%) |
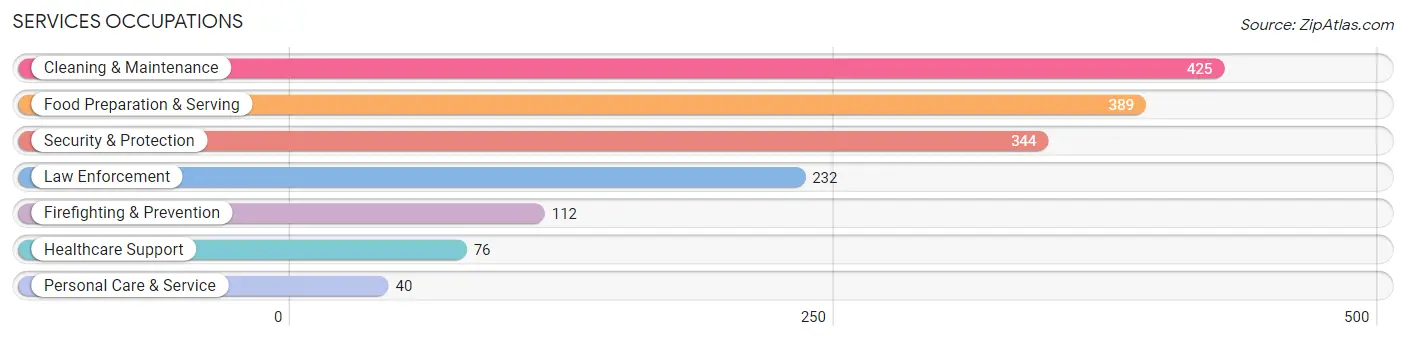
Services Occupations
The most common Services occupations in West Feliciana Parish are Cleaning & Maintenance (425 | 7.5%), Food Preparation & Serving (389 | 6.9%), Security & Protection (344 | 6.1%), Law Enforcement (232 | 4.1%), and Firefighting & Prevention (112 | 2.0%).
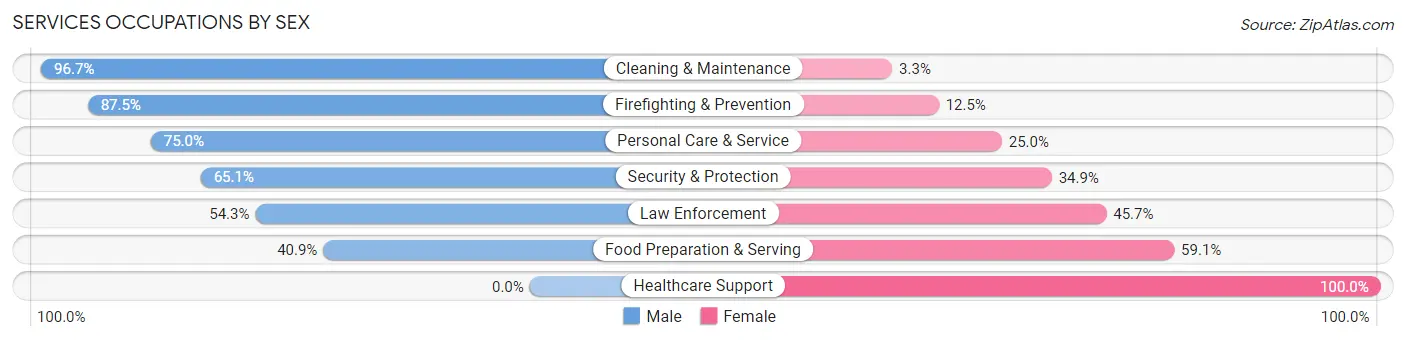
Services Occupations by Sex
Within the Services occupations in West Feliciana Parish, the most male-oriented occupations are Cleaning & Maintenance (96.7%), Firefighting & Prevention (87.5%), and Personal Care & Service (75.0%), while the most female-oriented occupations are Healthcare Support (100.0%), Food Preparation & Serving (59.1%), and Law Enforcement (45.7%).
| Occupation | Male | Female |
| Healthcare Support | 0 (0.0%) | 76 (100.0%) |
| Security & Protection | 224 (65.1%) | 120 (34.9%) |
| Firefighting & Prevention | 98 (87.5%) | 14 (12.5%) |
| Law Enforcement | 126 (54.3%) | 106 (45.7%) |
| Food Preparation & Serving | 159 (40.9%) | 230 (59.1%) |
| Cleaning & Maintenance | 411 (96.7%) | 14 (3.3%) |
| Personal Care & Service | 30 (75.0%) | 10 (25.0%) |
| Total (Category) | 824 (64.7%) | 450 (35.3%) |
| Total (Overall) | 3,703 (65.8%) | 1,924 (34.2%) |
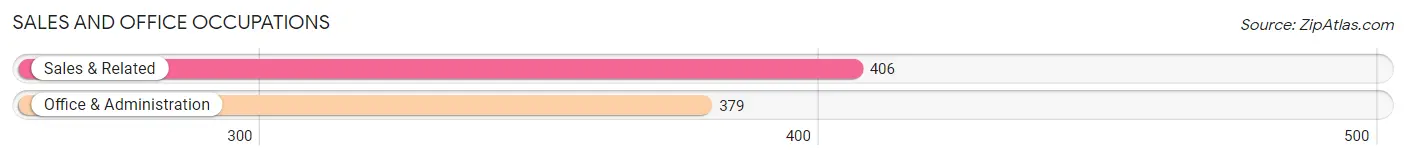
Sales and Office Occupations
The most common Sales and Office occupations in West Feliciana Parish are Sales & Related (406 | 7.2%), and Office & Administration (379 | 6.7%).
Sales and Office Occupations by Sex
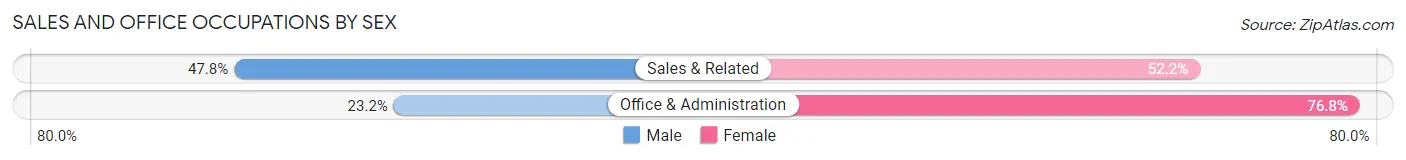
| Occupation | Male | Female |
| Sales & Related | 194 (47.8%) | 212 (52.2%) |
| Office & Administration | 88 (23.2%) | 291 (76.8%) |
| Total (Category) | 282 (35.9%) | 503 (64.1%) |
| Total (Overall) | 3,703 (65.8%) | 1,924 (34.2%) |
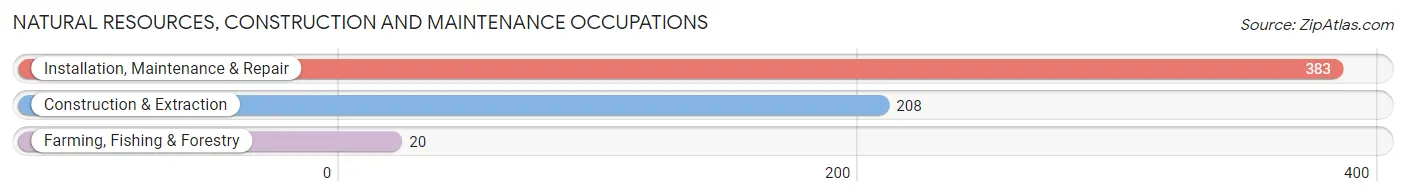
Natural Resources, Construction and Maintenance Occupations
The most common Natural Resources, Construction and Maintenance occupations in West Feliciana Parish are Installation, Maintenance & Repair (383 | 6.8%), Construction & Extraction (208 | 3.7%), and Farming, Fishing & Forestry (20 | 0.4%).
Natural Resources, Construction and Maintenance Occupations by Sex
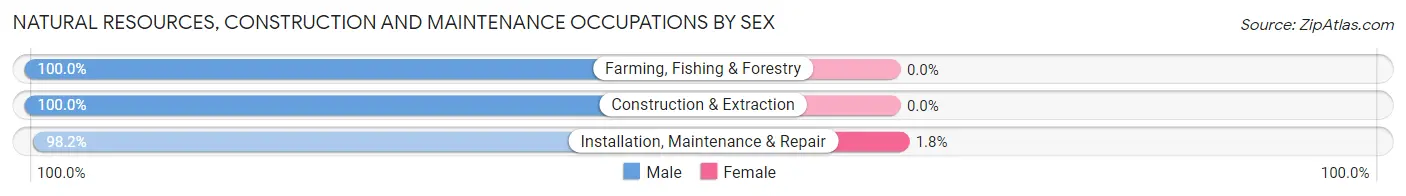
| Occupation | Male | Female |
| Farming, Fishing & Forestry | 20 (100.0%) | 0 (0.0%) |
| Construction & Extraction | 208 (100.0%) | 0 (0.0%) |
| Installation, Maintenance & Repair | 376 (98.2%) | 7 (1.8%) |
| Total (Category) | 604 (98.9%) | 7 (1.1%) |
| Total (Overall) | 3,703 (65.8%) | 1,924 (34.2%) |
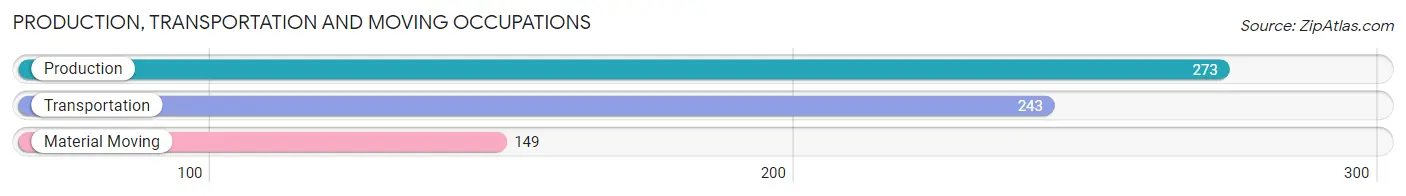
Production, Transportation and Moving Occupations
The most common Production, Transportation and Moving occupations in West Feliciana Parish are Production (273 | 4.9%), Transportation (243 | 4.3%), and Material Moving (149 | 2.6%).
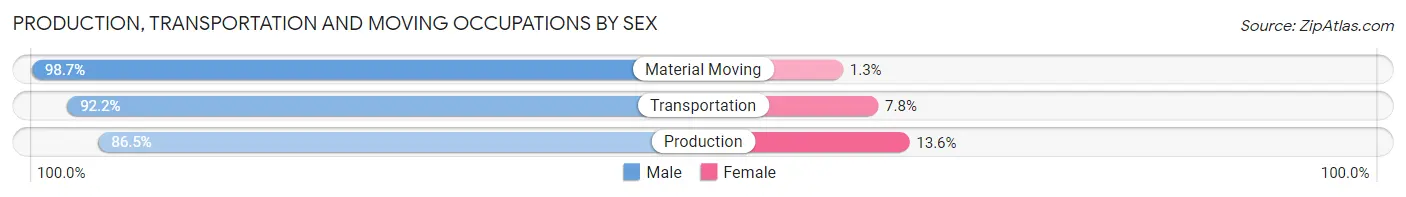
Production, Transportation and Moving Occupations by Sex
| Occupation | Male | Female |
| Production | 236 (86.5%) | 37 (13.6%) |
| Transportation | 224 (92.2%) | 19 (7.8%) |
| Material Moving | 147 (98.7%) | 2 (1.3%) |
| Total (Category) | 607 (91.3%) | 58 (8.7%) |
| Total (Overall) | 3,703 (65.8%) | 1,924 (34.2%) |
Employment Industries by Sex in West Feliciana Parish
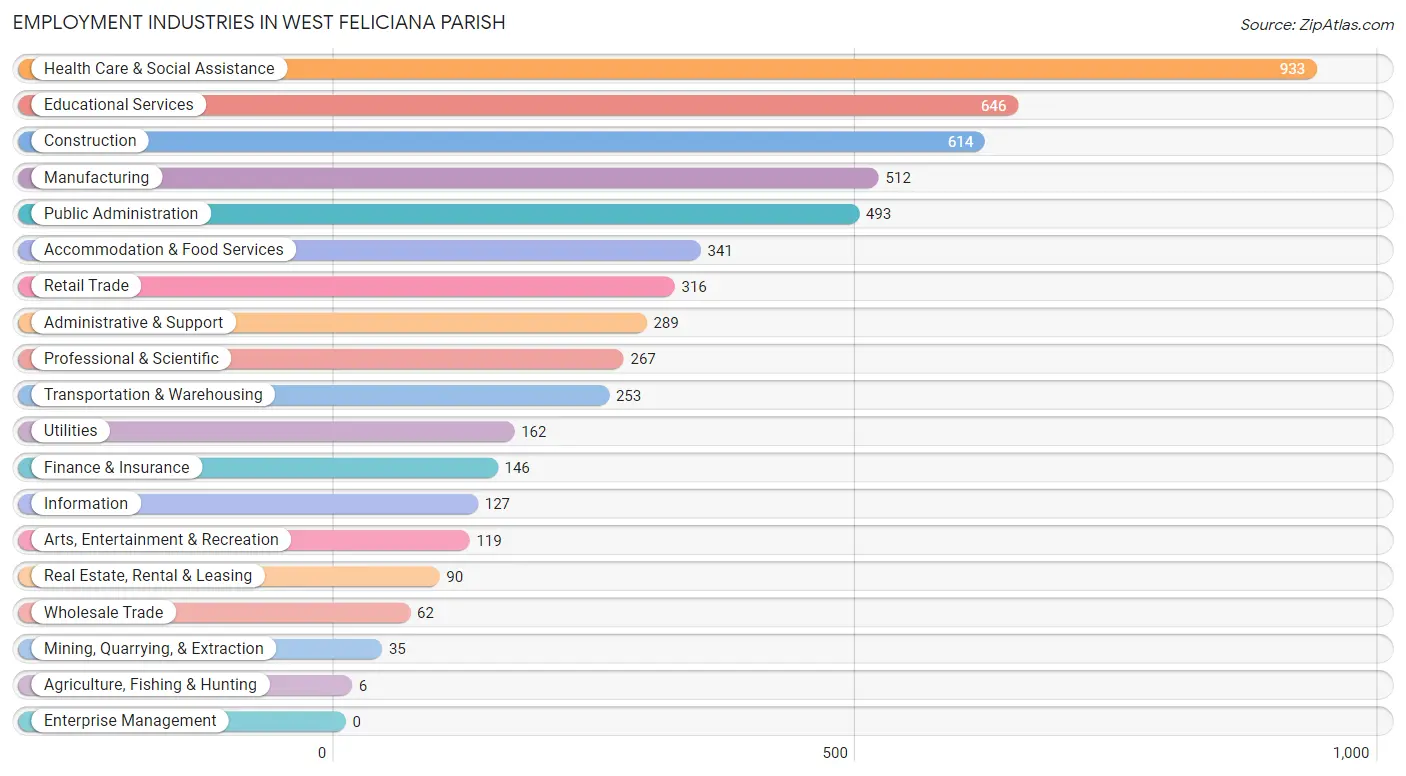
Employment Industries in West Feliciana Parish
The major employment industries in West Feliciana Parish include Health Care & Social Assistance (933 | 16.6%), Educational Services (646 | 11.5%), Construction (614 | 10.9%), Manufacturing (512 | 9.1%), and Public Administration (493 | 8.8%).
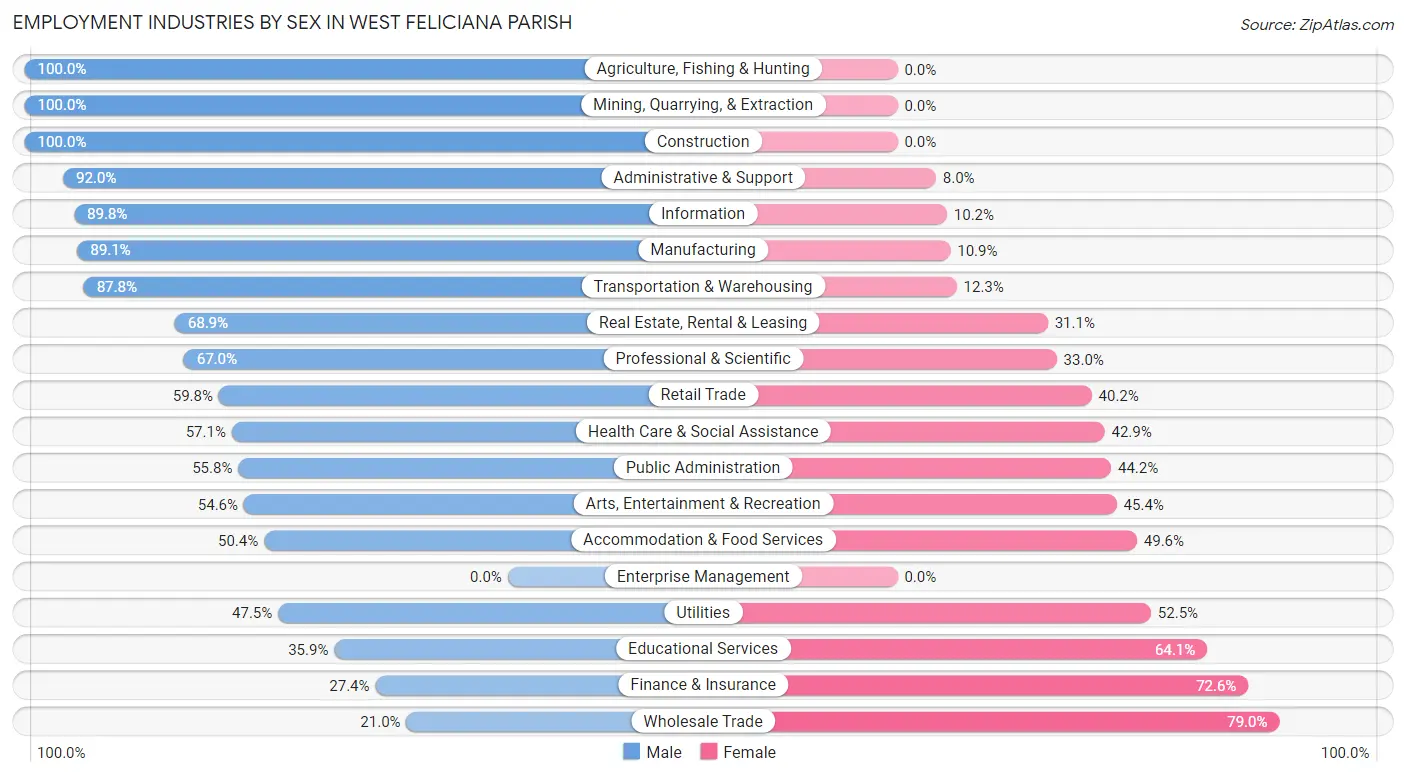
Employment Industries by Sex in West Feliciana Parish
The West Feliciana Parish industries that see more men than women are Agriculture, Fishing & Hunting (100.0%), Mining, Quarrying, & Extraction (100.0%), and Construction (100.0%), whereas the industries that tend to have a higher number of women are Wholesale Trade (79.0%), Finance & Insurance (72.6%), and Educational Services (64.1%).
| Industry | Male | Female |
| Agriculture, Fishing & Hunting | 6 (100.0%) | 0 (0.0%) |
| Mining, Quarrying, & Extraction | 35 (100.0%) | 0 (0.0%) |
| Construction | 614 (100.0%) | 0 (0.0%) |
| Manufacturing | 456 (89.1%) | 56 (10.9%) |
| Wholesale Trade | 13 (21.0%) | 49 (79.0%) |
| Retail Trade | 189 (59.8%) | 127 (40.2%) |
| Transportation & Warehousing | 222 (87.7%) | 31 (12.2%) |
| Utilities | 77 (47.5%) | 85 (52.5%) |
| Information | 114 (89.8%) | 13 (10.2%) |
| Finance & Insurance | 40 (27.4%) | 106 (72.6%) |
| Real Estate, Rental & Leasing | 62 (68.9%) | 28 (31.1%) |
| Professional & Scientific | 179 (67.0%) | 88 (33.0%) |
| Enterprise Management | 0 (0.0%) | 0 (0.0%) |
| Administrative & Support | 266 (92.0%) | 23 (8.0%) |
| Educational Services | 232 (35.9%) | 414 (64.1%) |
| Health Care & Social Assistance | 533 (57.1%) | 400 (42.9%) |
| Arts, Entertainment & Recreation | 65 (54.6%) | 54 (45.4%) |
| Accommodation & Food Services | 172 (50.4%) | 169 (49.6%) |
| Public Administration | 275 (55.8%) | 218 (44.2%) |
| Total | 3,703 (65.8%) | 1,924 (34.2%) |
Education in West Feliciana Parish
School Enrollment in West Feliciana Parish
The most common levels of schooling among the 2,638 students in West Feliciana Parish are high school (596 | 22.6%), middle school (584 | 22.1%), and college / undergraduate (533 | 20.2%).
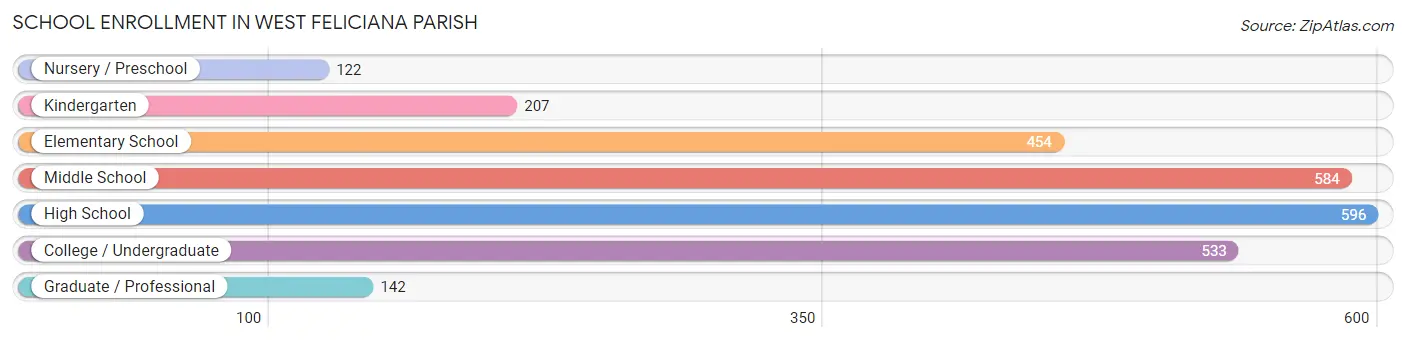
| School Level | # Students | % Students |
| Nursery / Preschool | 122 | 4.6% |
| Kindergarten | 207 | 7.9% |
| Elementary School | 454 | 17.2% |
| Middle School | 584 | 22.1% |
| High School | 596 | 22.6% |
| College / Undergraduate | 533 | 20.2% |
| Graduate / Professional | 142 | 5.4% |
| Total | 2,638 | 100.0% |
School Enrollment by Age by Funding Source in West Feliciana Parish
Out of a total of 2,638 students who are enrolled in schools in West Feliciana Parish, 385 (14.6%) attend a private institution, while the remaining 2,253 (85.4%) are enrolled in public schools. The age group of 3 to 4 year olds has the highest likelihood of being enrolled in private schools, with 43 (64.2% in the age bracket) enrolled. Conversely, the age group of 25 to 34 year olds has the lowest likelihood of being enrolled in a private school, with 160 (100.0% in the age bracket) attending a public institution.
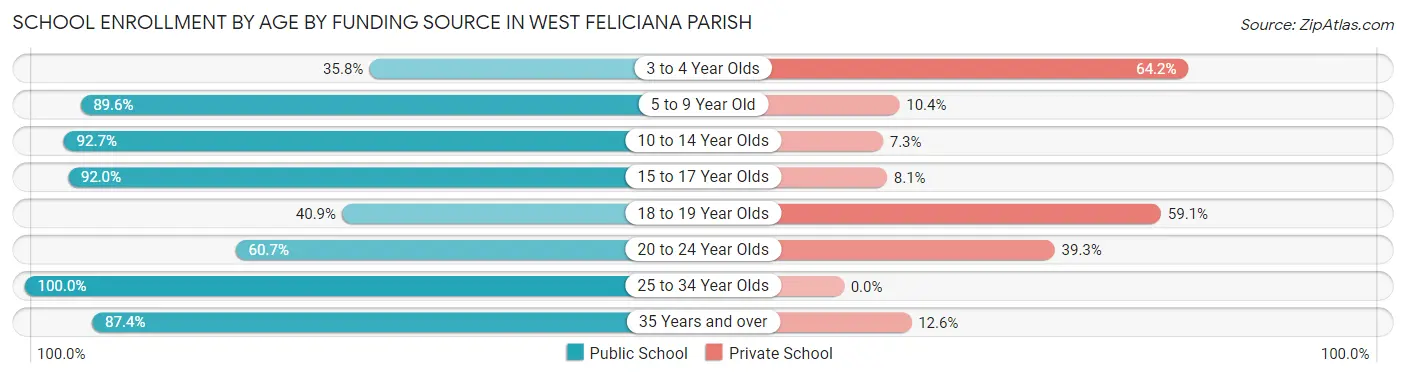
| Age Bracket | Public School | Private School |
| 3 to 4 Year Olds | 24 (35.8%) | 43 (64.2%) |
| 5 to 9 Year Old | 545 (89.6%) | 63 (10.4%) |
| 10 to 14 Year Olds | 624 (92.7%) | 49 (7.3%) |
| 15 to 17 Year Olds | 434 (91.9%) | 38 (8.1%) |
| 18 to 19 Year Olds | 36 (40.9%) | 52 (59.1%) |
| 20 to 24 Year Olds | 153 (60.7%) | 99 (39.3%) |
| 25 to 34 Year Olds | 160 (100.0%) | 0 (0.0%) |
| 35 Years and over | 278 (87.4%) | 40 (12.6%) |
| Total | 2,253 (85.4%) | 385 (14.6%) |
Educational Attainment by Field of Study in West Feliciana Parish
Business (473 | 18.0%), education (375 | 14.3%), psychology (328 | 12.5%), arts & humanities (281 | 10.7%), and liberal arts & history (272 | 10.3%) are the most common fields of study among 2,627 individuals in West Feliciana Parish who have obtained a bachelor's degree or higher.
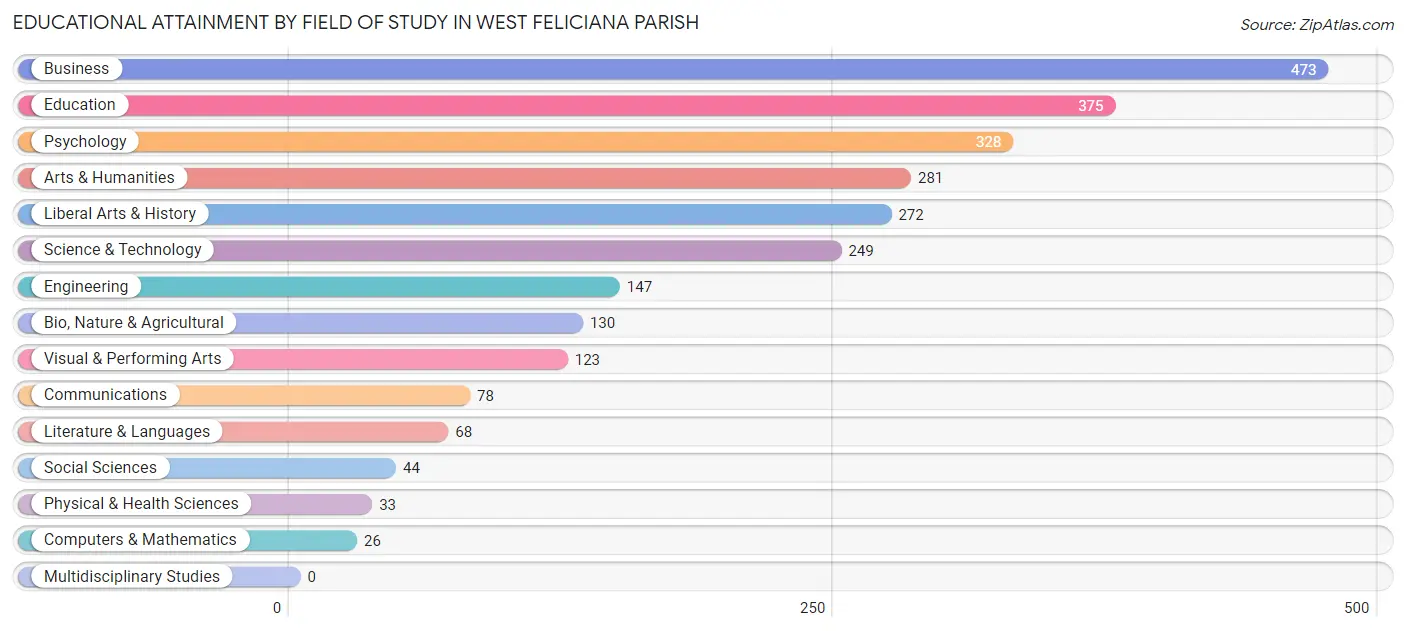
| Field of Study | # Graduates | % Graduates |
| Computers & Mathematics | 26 | 1.0% |
| Bio, Nature & Agricultural | 130 | 5.0% |
| Physical & Health Sciences | 33 | 1.3% |
| Psychology | 328 | 12.5% |
| Social Sciences | 44 | 1.7% |
| Engineering | 147 | 5.6% |
| Multidisciplinary Studies | 0 | 0.0% |
| Science & Technology | 249 | 9.5% |
| Business | 473 | 18.0% |
| Education | 375 | 14.3% |
| Literature & Languages | 68 | 2.6% |
| Liberal Arts & History | 272 | 10.3% |
| Visual & Performing Arts | 123 | 4.7% |
| Communications | 78 | 3.0% |
| Arts & Humanities | 281 | 10.7% |
| Total | 2,627 | 100.0% |
Transportation & Commute in West Feliciana Parish
Vehicle Availability by Sex in West Feliciana Parish
The most prevalent vehicle ownership categories in West Feliciana Parish are males with 2 vehicles (1,423, accounting for 38.4%) and females with 2 vehicles (606, making up 78.0%).
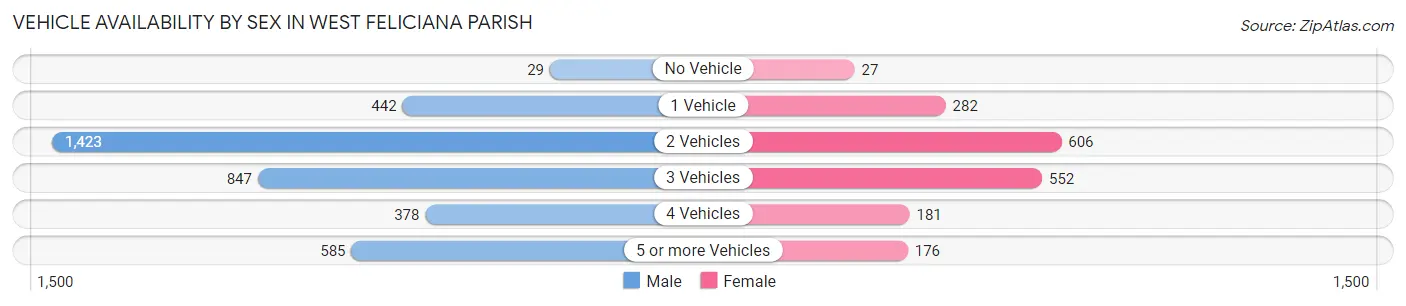
| Vehicles Available | Male | Female |
| No Vehicle | 29 (0.8%) | 27 (1.5%) |
| 1 Vehicle | 442 (11.9%) | 282 (15.5%) |
| 2 Vehicles | 1,423 (38.4%) | 606 (33.2%) |
| 3 Vehicles | 847 (22.9%) | 552 (30.3%) |
| 4 Vehicles | 378 (10.2%) | 181 (9.9%) |
| 5 or more Vehicles | 585 (15.8%) | 176 (9.7%) |
| Total | 3,704 (100.0%) | 1,824 (100.0%) |
Commute Time in West Feliciana Parish
The most frequently occuring commute durations in West Feliciana Parish are 45 to 59 minutes (953 commuters, 17.9%), 60 to 89 minutes (846 commuters, 15.9%), and 15 to 19 minutes (771 commuters, 14.4%).
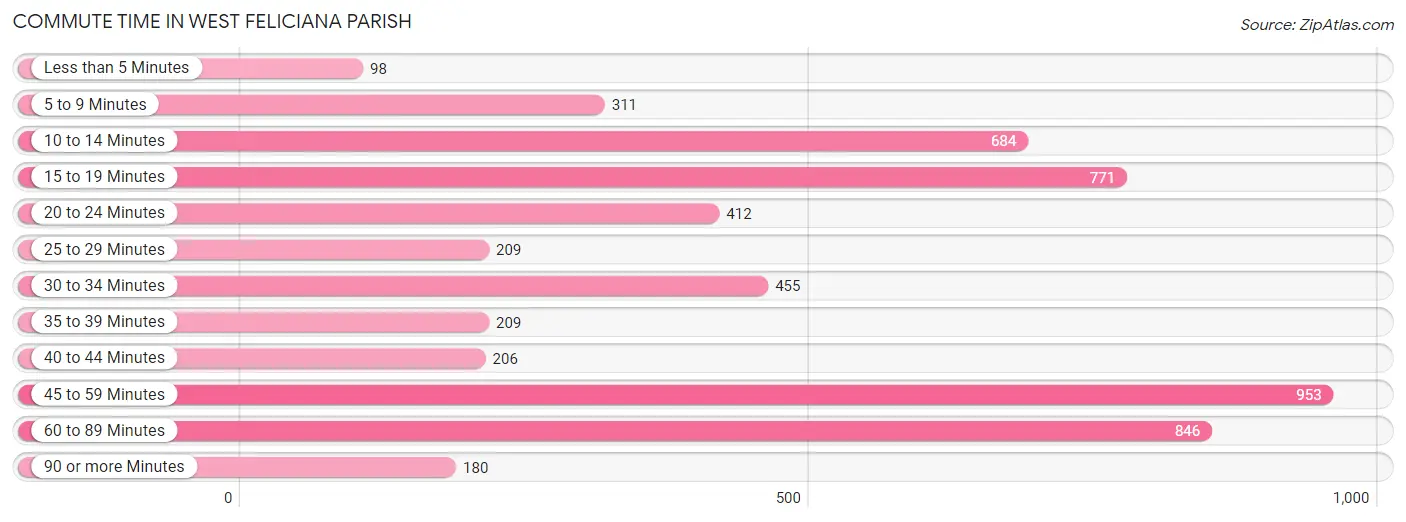
| Commute Time | # Commuters | % Commuters |
| Less than 5 Minutes | 98 | 1.8% |
| 5 to 9 Minutes | 311 | 5.8% |
| 10 to 14 Minutes | 684 | 12.8% |
| 15 to 19 Minutes | 771 | 14.4% |
| 20 to 24 Minutes | 412 | 7.7% |
| 25 to 29 Minutes | 209 | 3.9% |
| 30 to 34 Minutes | 455 | 8.5% |
| 35 to 39 Minutes | 209 | 3.9% |
| 40 to 44 Minutes | 206 | 3.9% |
| 45 to 59 Minutes | 953 | 17.9% |
| 60 to 89 Minutes | 846 | 15.9% |
| 90 or more Minutes | 180 | 3.4% |
Commute Time by Sex in West Feliciana Parish
The most common commute times in West Feliciana Parish are 60 to 89 minutes (732 commuters, 20.9%) for males and 10 to 14 minutes (400 commuters, 21.9%) for females.
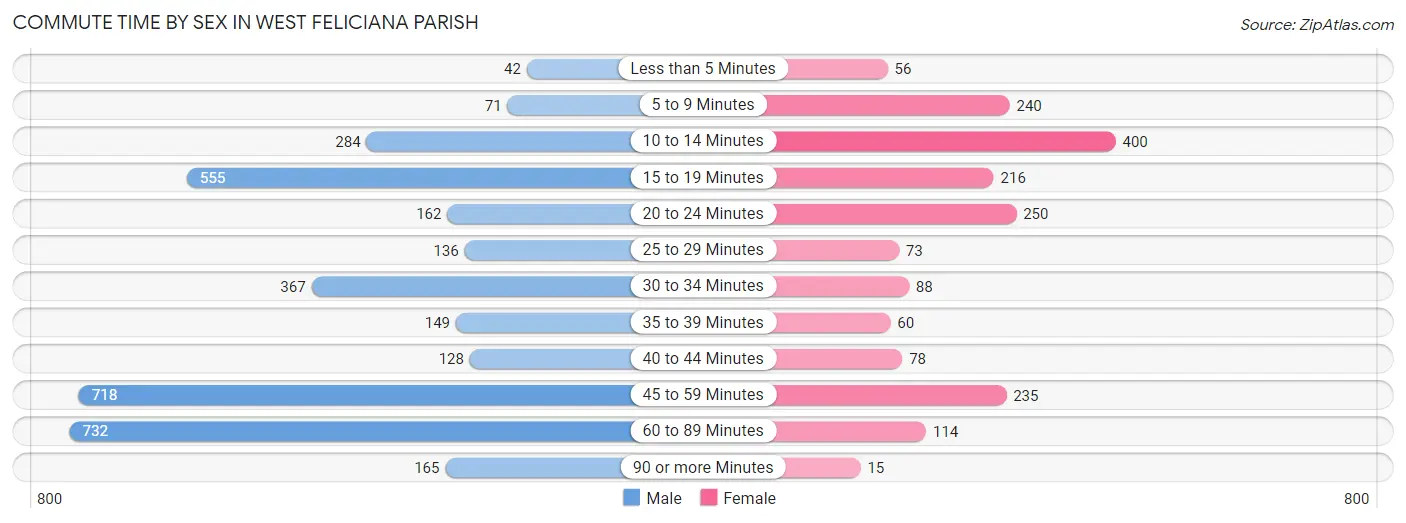
| Commute Time | Male | Female |
| Less than 5 Minutes | 42 (1.2%) | 56 (3.1%) |
| 5 to 9 Minutes | 71 (2.0%) | 240 (13.2%) |
| 10 to 14 Minutes | 284 (8.1%) | 400 (21.9%) |
| 15 to 19 Minutes | 555 (15.8%) | 216 (11.8%) |
| 20 to 24 Minutes | 162 (4.6%) | 250 (13.7%) |
| 25 to 29 Minutes | 136 (3.9%) | 73 (4.0%) |
| 30 to 34 Minutes | 367 (10.5%) | 88 (4.8%) |
| 35 to 39 Minutes | 149 (4.3%) | 60 (3.3%) |
| 40 to 44 Minutes | 128 (3.6%) | 78 (4.3%) |
| 45 to 59 Minutes | 718 (20.5%) | 235 (12.9%) |
| 60 to 89 Minutes | 732 (20.9%) | 114 (6.2%) |
| 90 or more Minutes | 165 (4.7%) | 15 (0.8%) |
Time of Departure to Work by Sex in West Feliciana Parish
The most frequent times of departure to work in West Feliciana Parish are 12:00 AM to 4:59 AM (633, 18.0%) for males and 7:30 AM to 7:59 AM (328, 18.0%) for females.
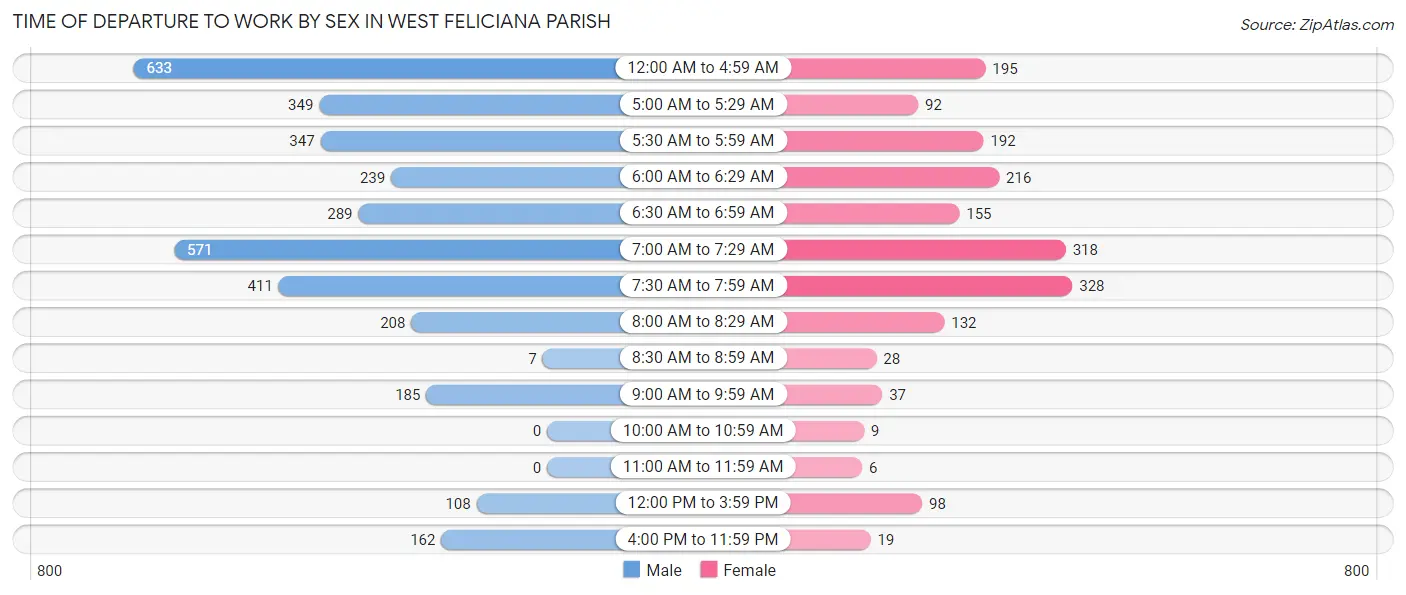
| Time of Departure | Male | Female |
| 12:00 AM to 4:59 AM | 633 (18.0%) | 195 (10.7%) |
| 5:00 AM to 5:29 AM | 349 (10.0%) | 92 (5.0%) |
| 5:30 AM to 5:59 AM | 347 (9.9%) | 192 (10.5%) |
| 6:00 AM to 6:29 AM | 239 (6.8%) | 216 (11.8%) |
| 6:30 AM to 6:59 AM | 289 (8.2%) | 155 (8.5%) |
| 7:00 AM to 7:29 AM | 571 (16.3%) | 318 (17.4%) |
| 7:30 AM to 7:59 AM | 411 (11.7%) | 328 (18.0%) |
| 8:00 AM to 8:29 AM | 208 (5.9%) | 132 (7.2%) |
| 8:30 AM to 8:59 AM | 7 (0.2%) | 28 (1.5%) |
| 9:00 AM to 9:59 AM | 185 (5.3%) | 37 (2.0%) |
| 10:00 AM to 10:59 AM | 0 (0.0%) | 9 (0.5%) |
| 11:00 AM to 11:59 AM | 0 (0.0%) | 6 (0.3%) |
| 12:00 PM to 3:59 PM | 108 (3.1%) | 98 (5.4%) |
| 4:00 PM to 11:59 PM | 162 (4.6%) | 19 (1.0%) |
| Total | 3,509 (100.0%) | 1,825 (100.0%) |
Housing Occupancy in West Feliciana Parish
Occupancy by Ownership in West Feliciana Parish
Of the total 3,822 dwellings in West Feliciana Parish, owner-occupied units account for 2,777 (72.7%), while renter-occupied units make up 1,045 (27.3%).
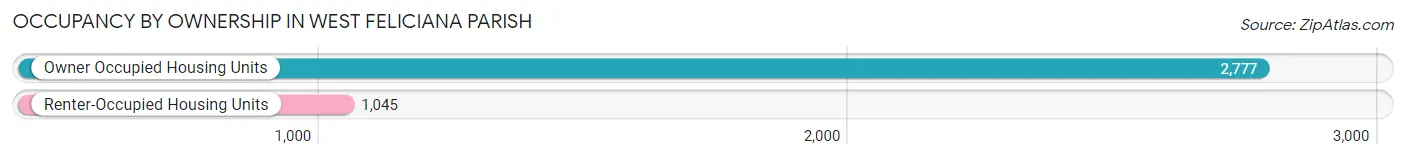
| Occupancy | # Housing Units | % Housing Units |
| Owner Occupied Housing Units | 2,777 | 72.7% |
| Renter-Occupied Housing Units | 1,045 | 27.3% |
| Total Occupied Housing Units | 3,822 | 100.0% |
Occupancy by Household Size in West Feliciana Parish
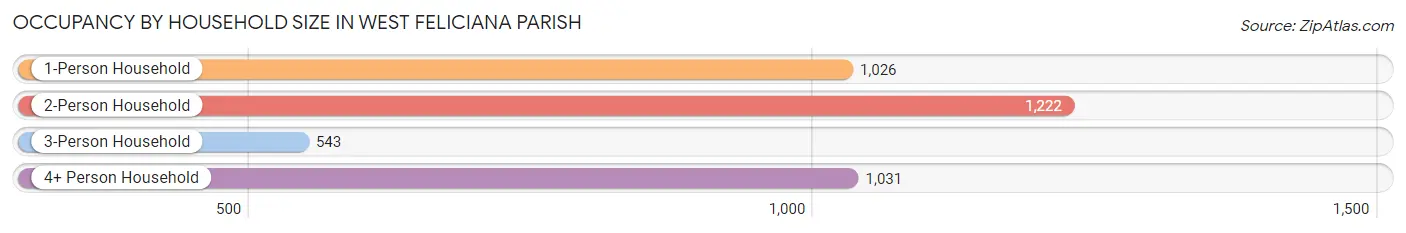
| Household Size | # Housing Units | % Housing Units |
| 1-Person Household | 1,026 | 26.8% |
| 2-Person Household | 1,222 | 32.0% |
| 3-Person Household | 543 | 14.2% |
| 4+ Person Household | 1,031 | 27.0% |
| Total Housing Units | 3,822 | 100.0% |
Occupancy by Ownership by Household Size in West Feliciana Parish
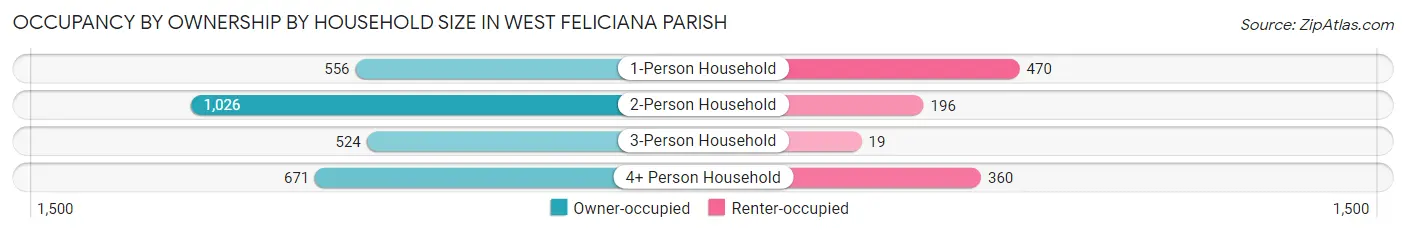
| Household Size | Owner-occupied | Renter-occupied |
| 1-Person Household | 556 (54.2%) | 470 (45.8%) |
| 2-Person Household | 1,026 (84.0%) | 196 (16.0%) |
| 3-Person Household | 524 (96.5%) | 19 (3.5%) |
| 4+ Person Household | 671 (65.1%) | 360 (34.9%) |
| Total Housing Units | 2,777 (72.7%) | 1,045 (27.3%) |
Occupancy by Educational Attainment in West Feliciana Parish
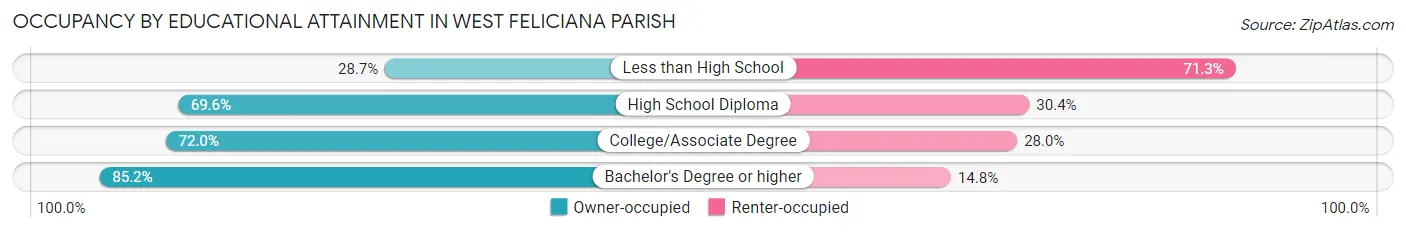
| Household Size | Owner-occupied | Renter-occupied |
| Less than High School | 50 (28.7%) | 124 (71.3%) |
| High School Diploma | 848 (69.6%) | 370 (30.4%) |
| College/Associate Degree | 1,046 (72.0%) | 406 (28.0%) |
| Bachelor's Degree or higher | 833 (85.2%) | 145 (14.8%) |
Occupancy by Age of Householder in West Feliciana Parish
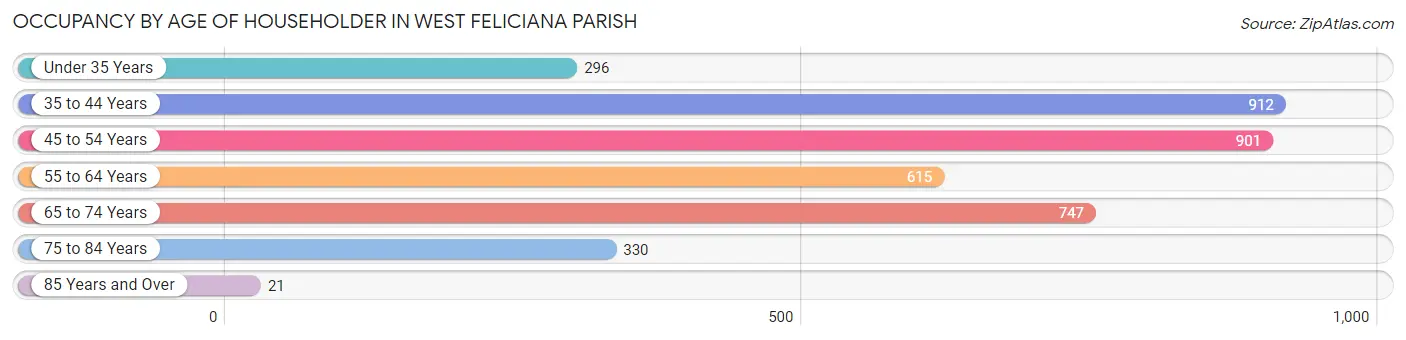
| Age Bracket | # Households | % Households |
| Under 35 Years | 296 | 7.7% |
| 35 to 44 Years | 912 | 23.9% |
| 45 to 54 Years | 901 | 23.6% |
| 55 to 64 Years | 615 | 16.1% |
| 65 to 74 Years | 747 | 19.5% |
| 75 to 84 Years | 330 | 8.6% |
| 85 Years and Over | 21 | 0.5% |
| Total | 3,822 | 100.0% |
Housing Finances in West Feliciana Parish
Median Income by Occupancy in West Feliciana Parish
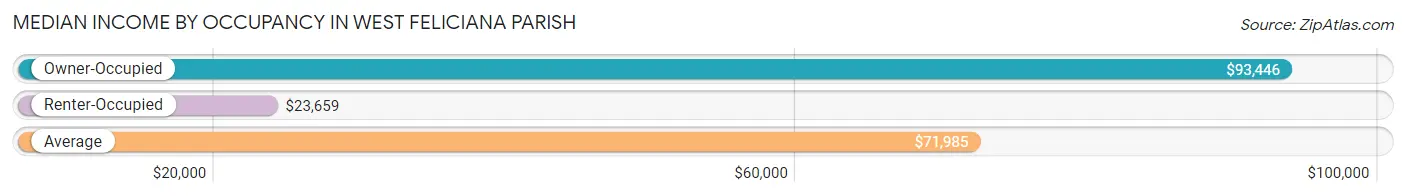
| Occupancy Type | # Households | Median Income |
| Owner-Occupied | 2,777 (72.7%) | $93,446 |
| Renter-Occupied | 1,045 (27.3%) | $23,659 |
| Average | 3,822 (100.0%) | $71,985 |
Occupancy by Householder Income Bracket in West Feliciana Parish
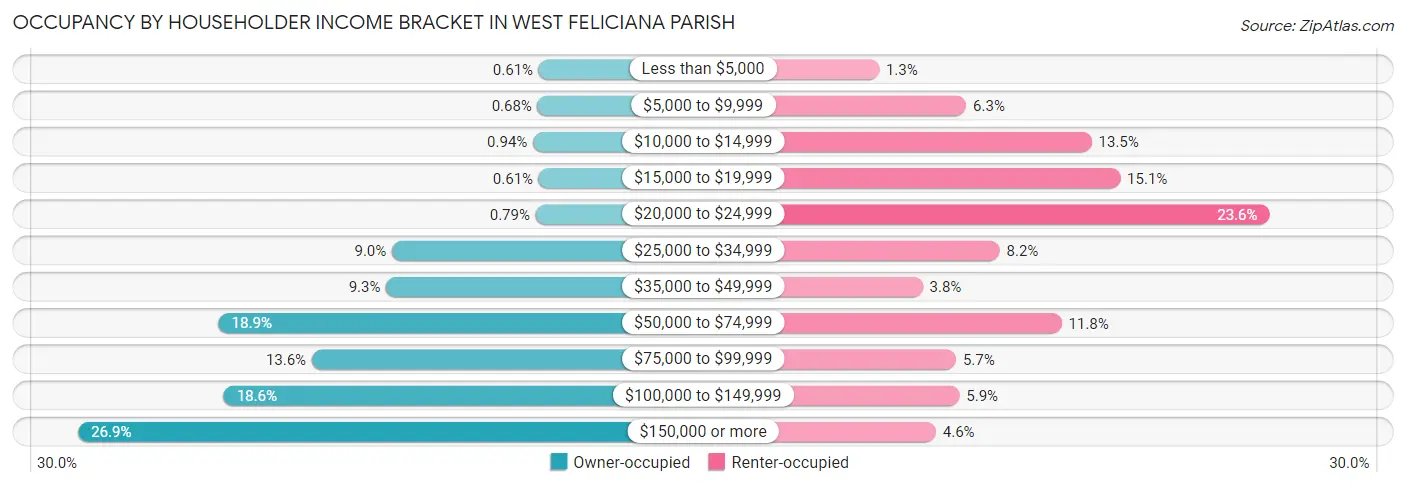
| Income Bracket | Owner-occupied | Renter-occupied |
| Less than $5,000 | 17 (0.6%) | 14 (1.3%) |
| $5,000 to $9,999 | 19 (0.7%) | 66 (6.3%) |
| $10,000 to $14,999 | 26 (0.9%) | 141 (13.5%) |
| $15,000 to $19,999 | 17 (0.6%) | 158 (15.1%) |
| $20,000 to $24,999 | 22 (0.8%) | 247 (23.6%) |
| $25,000 to $34,999 | 250 (9.0%) | 86 (8.2%) |
| $35,000 to $49,999 | 259 (9.3%) | 40 (3.8%) |
| $50,000 to $74,999 | 525 (18.9%) | 123 (11.8%) |
| $75,000 to $99,999 | 377 (13.6%) | 60 (5.7%) |
| $100,000 to $149,999 | 517 (18.6%) | 62 (5.9%) |
| $150,000 or more | 748 (26.9%) | 48 (4.6%) |
| Total | 2,777 (100.0%) | 1,045 (100.0%) |
Monthly Housing Cost Tiers in West Feliciana Parish
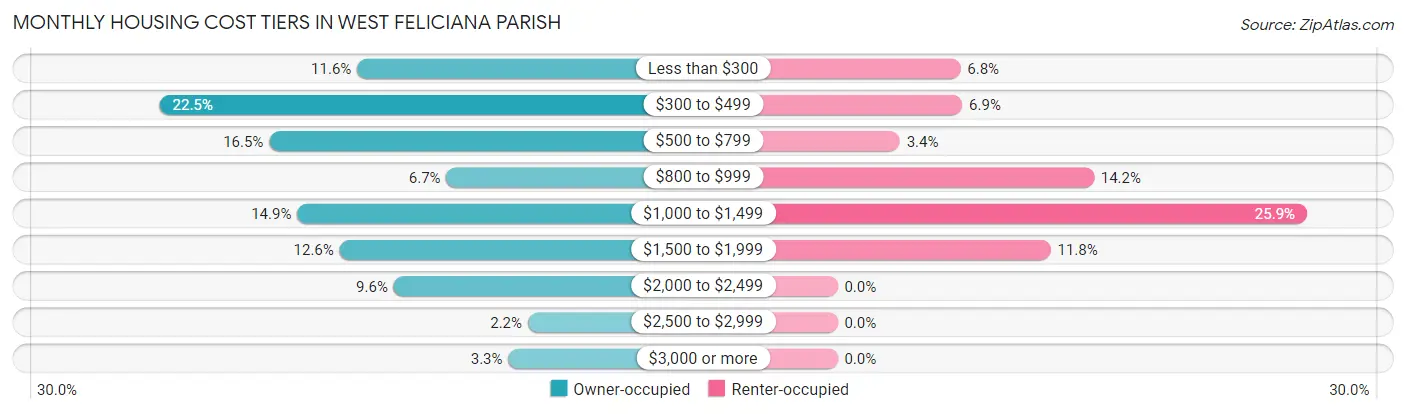
| Monthly Cost | Owner-occupied | Renter-occupied |
| Less than $300 | 323 (11.6%) | 71 (6.8%) |
| $300 to $499 | 626 (22.5%) | 72 (6.9%) |
| $500 to $799 | 458 (16.5%) | 36 (3.4%) |
| $800 to $999 | 186 (6.7%) | 148 (14.2%) |
| $1,000 to $1,499 | 415 (14.9%) | 271 (25.9%) |
| $1,500 to $1,999 | 350 (12.6%) | 123 (11.8%) |
| $2,000 to $2,499 | 267 (9.6%) | 0 (0.0%) |
| $2,500 to $2,999 | 61 (2.2%) | 0 (0.0%) |
| $3,000 or more | 91 (3.3%) | 0 (0.0%) |
| Total | 2,777 (100.0%) | 1,045 (100.0%) |
Physical Housing Characteristics in West Feliciana Parish
Housing Structures in West Feliciana Parish
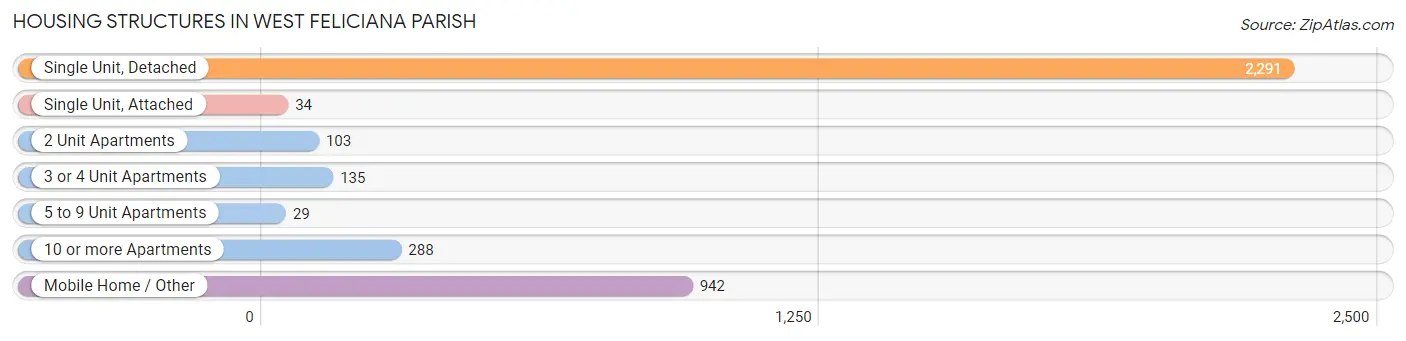
| Structure Type | # Housing Units | % Housing Units |
| Single Unit, Detached | 2,291 | 59.9% |
| Single Unit, Attached | 34 | 0.9% |
| 2 Unit Apartments | 103 | 2.7% |
| 3 or 4 Unit Apartments | 135 | 3.5% |
| 5 to 9 Unit Apartments | 29 | 0.8% |
| 10 or more Apartments | 288 | 7.5% |
| Mobile Home / Other | 942 | 24.6% |
| Total | 3,822 | 100.0% |
Housing Structures by Occupancy in West Feliciana Parish
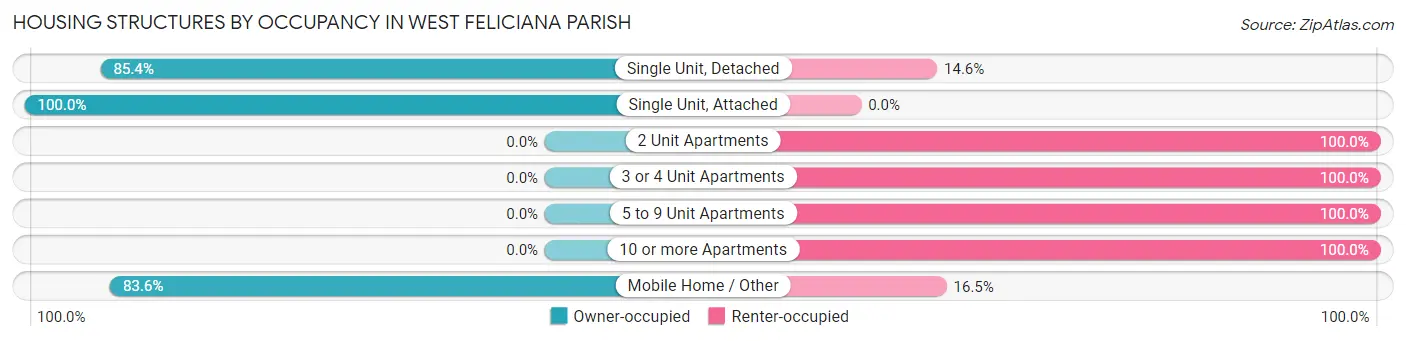
| Structure Type | Owner-occupied | Renter-occupied |
| Single Unit, Detached | 1,956 (85.4%) | 335 (14.6%) |
| Single Unit, Attached | 34 (100.0%) | 0 (0.0%) |
| 2 Unit Apartments | 0 (0.0%) | 103 (100.0%) |
| 3 or 4 Unit Apartments | 0 (0.0%) | 135 (100.0%) |
| 5 to 9 Unit Apartments | 0 (0.0%) | 29 (100.0%) |
| 10 or more Apartments | 0 (0.0%) | 288 (100.0%) |
| Mobile Home / Other | 787 (83.6%) | 155 (16.5%) |
| Total | 2,777 (72.7%) | 1,045 (27.3%) |
Housing Structures by Number of Rooms in West Feliciana Parish
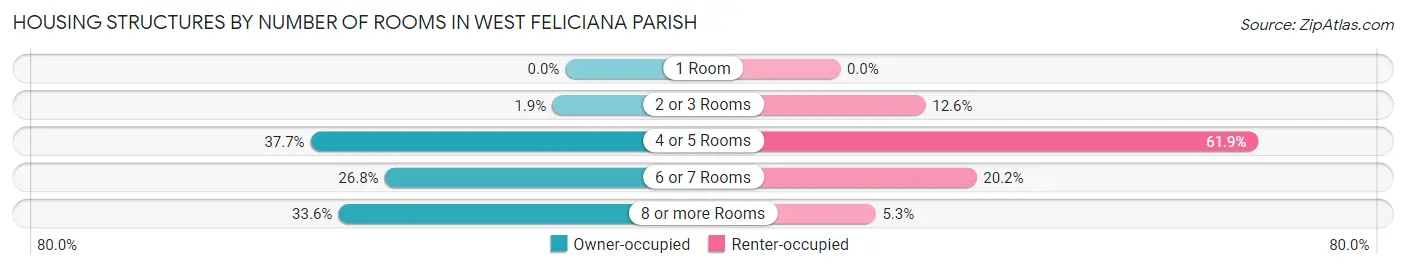
| Number of Rooms | Owner-occupied | Renter-occupied |
| 1 Room | 0 (0.0%) | 0 (0.0%) |
| 2 or 3 Rooms | 54 (1.9%) | 132 (12.6%) |
| 4 or 5 Rooms | 1,047 (37.7%) | 647 (61.9%) |
| 6 or 7 Rooms | 743 (26.8%) | 211 (20.2%) |
| 8 or more Rooms | 933 (33.6%) | 55 (5.3%) |
| Total | 2,777 (100.0%) | 1,045 (100.0%) |
Housing Structure by Heating Type in West Feliciana Parish
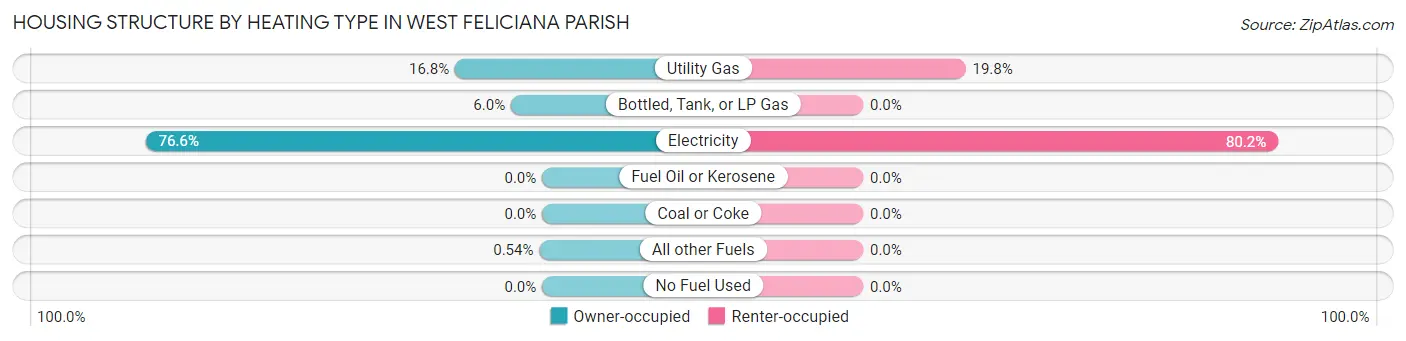
| Heating Type | Owner-occupied | Renter-occupied |
| Utility Gas | 467 (16.8%) | 207 (19.8%) |
| Bottled, Tank, or LP Gas | 167 (6.0%) | 0 (0.0%) |
| Electricity | 2,128 (76.6%) | 838 (80.2%) |
| Fuel Oil or Kerosene | 0 (0.0%) | 0 (0.0%) |
| Coal or Coke | 0 (0.0%) | 0 (0.0%) |
| All other Fuels | 15 (0.5%) | 0 (0.0%) |
| No Fuel Used | 0 (0.0%) | 0 (0.0%) |
| Total | 2,777 (100.0%) | 1,045 (100.0%) |
Household Vehicle Usage in West Feliciana Parish
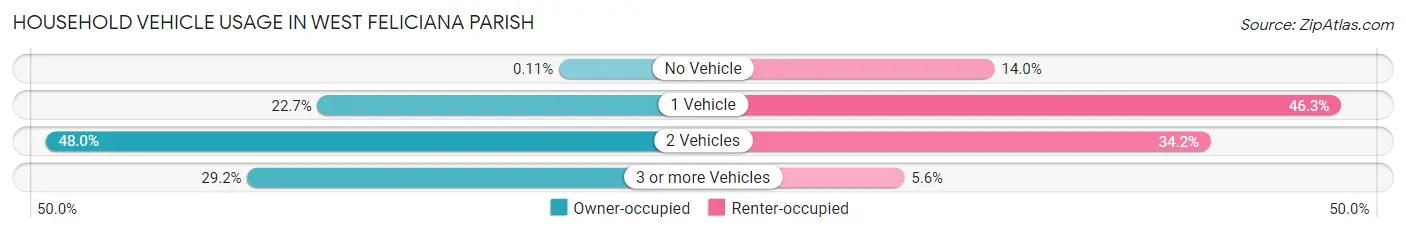
| Vehicles per Household | Owner-occupied | Renter-occupied |
| No Vehicle | 3 (0.1%) | 146 (14.0%) |
| 1 Vehicle | 629 (22.7%) | 484 (46.3%) |
| 2 Vehicles | 1,334 (48.0%) | 357 (34.2%) |
| 3 or more Vehicles | 811 (29.2%) | 58 (5.6%) |
| Total | 2,777 (100.0%) | 1,045 (100.0%) |
Real Estate & Mortgages in West Feliciana Parish
Real Estate and Mortgage Overview in West Feliciana Parish
| Characteristic | Without Mortgage | With Mortgage |
| Housing Units | 1,426 | 1,351 |
| Median Property Value | $173,200 | $283,400 |
| Median Household Income | $74,194 | $479 |
| Monthly Housing Costs | $410 | $91 |
| Real Estate Taxes | $978 | $262 |
Property Value by Mortgage Status in West Feliciana Parish
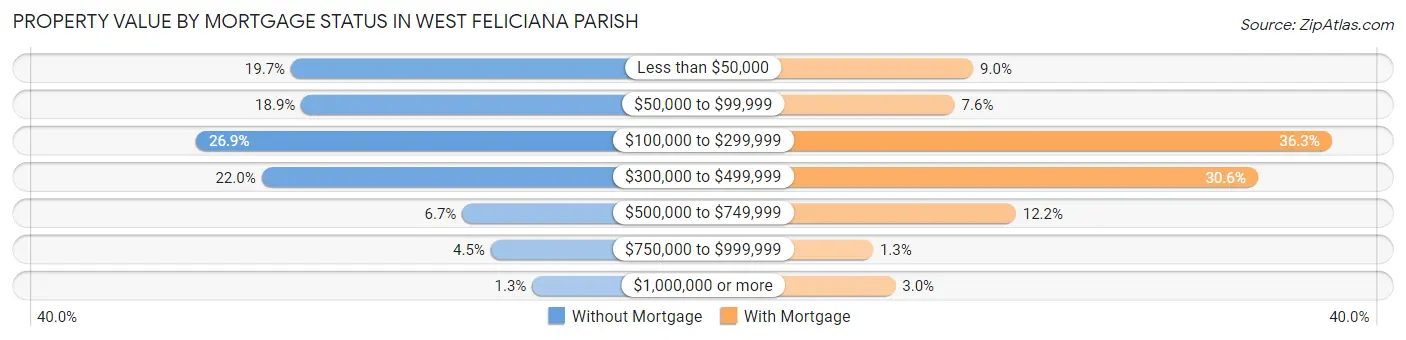
| Property Value | Without Mortgage | With Mortgage |
| Less than $50,000 | 281 (19.7%) | 121 (9.0%) |
| $50,000 to $99,999 | 270 (18.9%) | 102 (7.5%) |
| $100,000 to $299,999 | 384 (26.9%) | 490 (36.3%) |
| $300,000 to $499,999 | 313 (22.0%) | 414 (30.6%) |
| $500,000 to $749,999 | 95 (6.7%) | 165 (12.2%) |
| $750,000 to $999,999 | 64 (4.5%) | 18 (1.3%) |
| $1,000,000 or more | 19 (1.3%) | 41 (3.0%) |
| Total | 1,426 (100.0%) | 1,351 (100.0%) |
Household Income by Mortgage Status in West Feliciana Parish
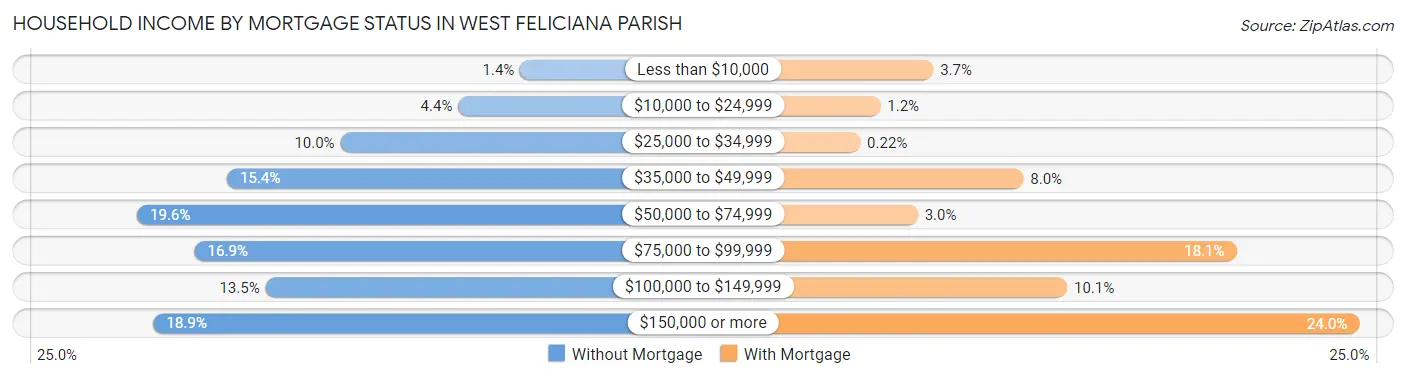
| Household Income | Without Mortgage | With Mortgage |
| Less than $10,000 | 20 (1.4%) | 50 (3.7%) |
| $10,000 to $24,999 | 62 (4.3%) | 16 (1.2%) |
| $25,000 to $34,999 | 142 (10.0%) | 3 (0.2%) |
| $35,000 to $49,999 | 219 (15.4%) | 108 (8.0%) |
| $50,000 to $74,999 | 280 (19.6%) | 40 (3.0%) |
| $75,000 to $99,999 | 241 (16.9%) | 245 (18.1%) |
| $100,000 to $149,999 | 193 (13.5%) | 136 (10.1%) |
| $150,000 or more | 269 (18.9%) | 324 (24.0%) |
| Total | 1,426 (100.0%) | 1,351 (100.0%) |
Property Value to Household Income Ratio in West Feliciana Parish
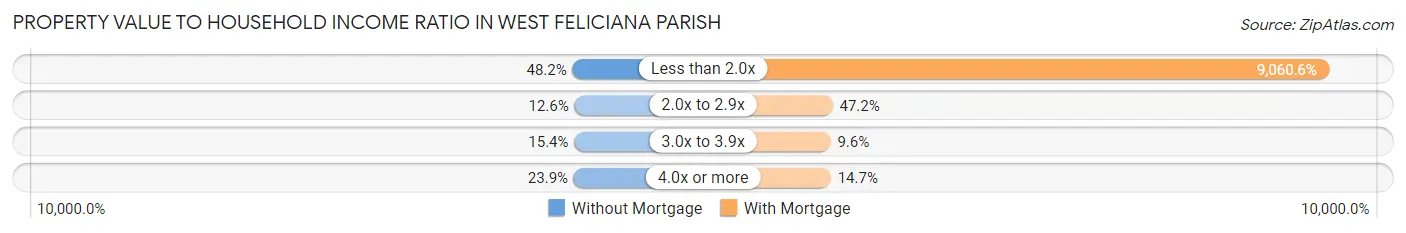
| Value-to-Income Ratio | Without Mortgage | With Mortgage |
| Less than 2.0x | 687 (48.2%) | 122,409 (9,060.6%) |
| 2.0x to 2.9x | 179 (12.6%) | 638 (47.2%) |
| 3.0x to 3.9x | 219 (15.4%) | 129 (9.6%) |
| 4.0x or more | 341 (23.9%) | 198 (14.7%) |
| Total | 1,426 (100.0%) | 1,351 (100.0%) |
Real Estate Taxes by Mortgage Status in West Feliciana Parish
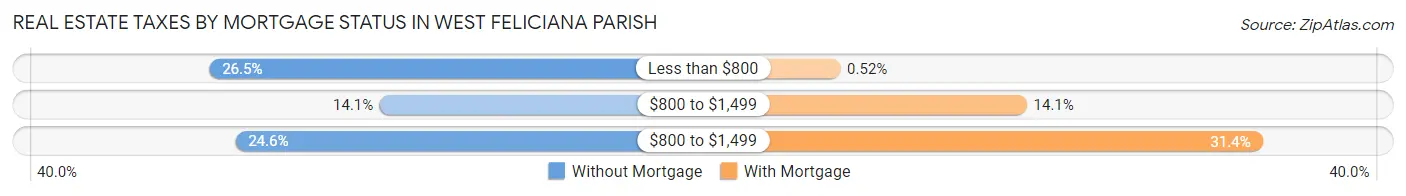
| Property Taxes | Without Mortgage | With Mortgage |
| Less than $800 | 378 (26.5%) | 7 (0.5%) |
| $800 to $1,499 | 201 (14.1%) | 191 (14.1%) |
| $800 to $1,499 | 351 (24.6%) | 424 (31.4%) |
| Total | 1,426 (100.0%) | 1,351 (100.0%) |
Health & Disability in West Feliciana Parish
Health Insurance Coverage by Age in West Feliciana Parish
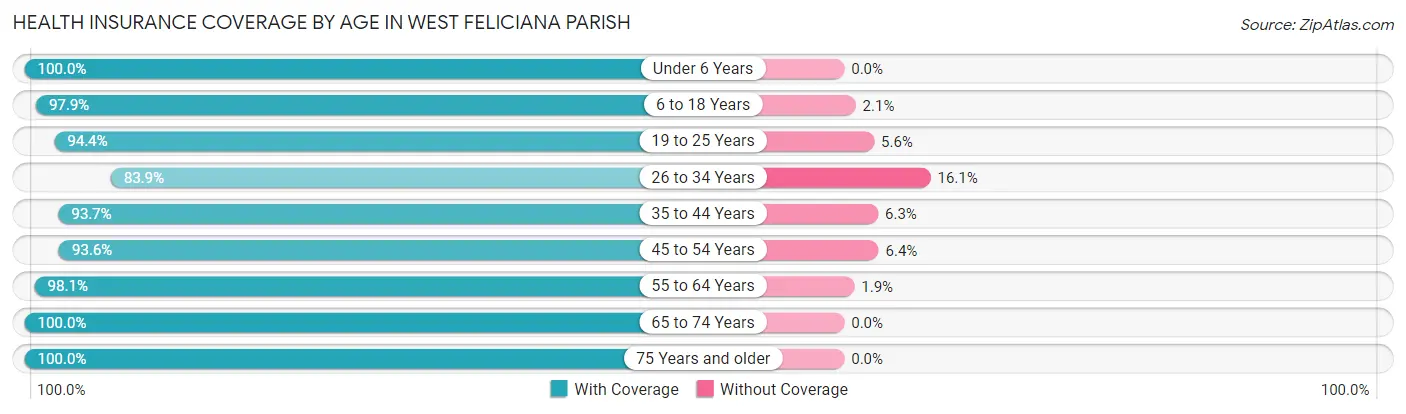
| Age Bracket | With Coverage | Without Coverage |
| Under 6 Years | 852 (100.0%) | 0 (0.0%) |
| 6 to 18 Years | 1,757 (97.9%) | 38 (2.1%) |
| 19 to 25 Years | 816 (94.4%) | 48 (5.6%) |
| 26 to 34 Years | 1,399 (83.9%) | 268 (16.1%) |
| 35 to 44 Years | 1,873 (93.7%) | 126 (6.3%) |
| 45 to 54 Years | 1,507 (93.6%) | 103 (6.4%) |
| 55 to 64 Years | 1,202 (98.1%) | 23 (1.9%) |
| 65 to 74 Years | 1,064 (100.0%) | 0 (0.0%) |
| 75 Years and older | 704 (100.0%) | 0 (0.0%) |
| Total | 11,174 (94.9%) | 606 (5.1%) |
Health Insurance Coverage by Citizenship Status in West Feliciana Parish
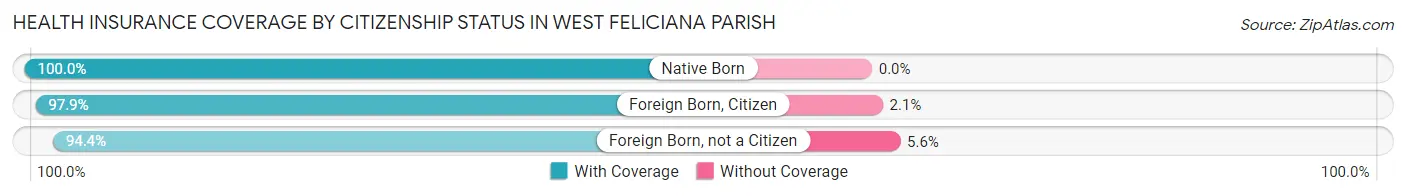
| Citizenship Status | With Coverage | Without Coverage |
| Native Born | 852 (100.0%) | 0 (0.0%) |
| Foreign Born, Citizen | 1,757 (97.9%) | 38 (2.1%) |
| Foreign Born, not a Citizen | 816 (94.4%) | 48 (5.6%) |
Health Insurance Coverage by Household Income in West Feliciana Parish
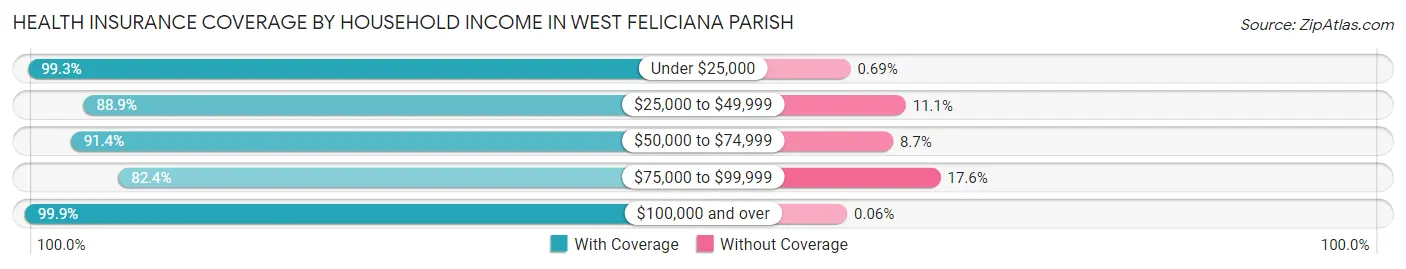
| Household Income | With Coverage | Without Coverage |
| Under $25,000 | 1,577 (99.3%) | 11 (0.7%) |
| $25,000 to $49,999 | 1,262 (88.9%) | 157 (11.1%) |
| $50,000 to $74,999 | 2,016 (91.3%) | 191 (8.6%) |
| $75,000 to $99,999 | 1,108 (82.4%) | 236 (17.6%) |
| $100,000 and over | 5,124 (99.9%) | 3 (0.1%) |
Public vs Private Health Insurance Coverage by Age in West Feliciana Parish
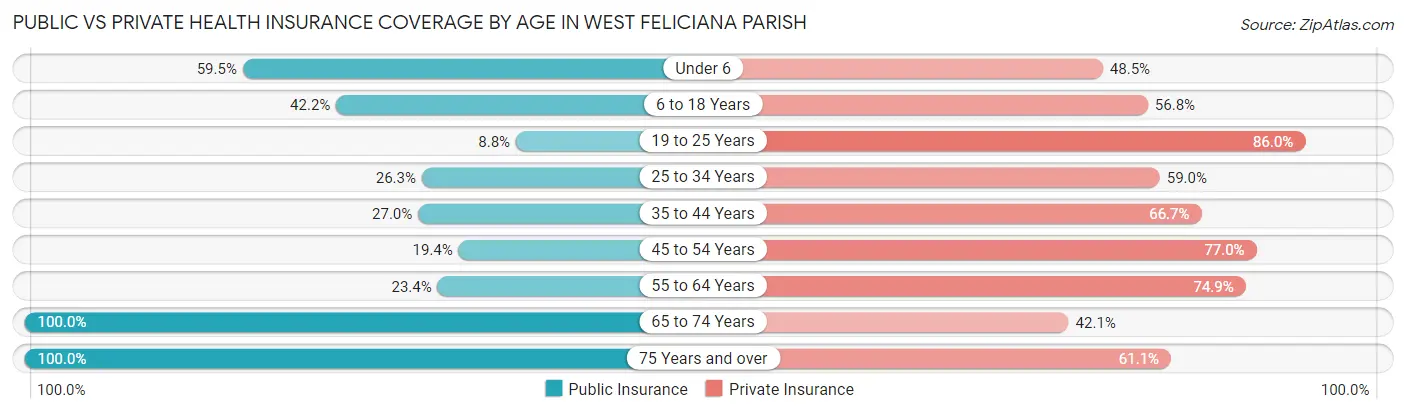
| Age Bracket | Public Insurance | Private Insurance |
| Under 6 | 507 (59.5%) | 413 (48.5%) |
| 6 to 18 Years | 757 (42.2%) | 1,020 (56.8%) |
| 19 to 25 Years | 76 (8.8%) | 743 (86.0%) |
| 25 to 34 Years | 438 (26.3%) | 984 (59.0%) |
| 35 to 44 Years | 539 (27.0%) | 1,334 (66.7%) |
| 45 to 54 Years | 313 (19.4%) | 1,239 (77.0%) |
| 55 to 64 Years | 286 (23.4%) | 918 (74.9%) |
| 65 to 74 Years | 1,064 (100.0%) | 448 (42.1%) |
| 75 Years and over | 704 (100.0%) | 430 (61.1%) |
| Total | 4,684 (39.8%) | 7,529 (63.9%) |
Disability Status by Sex by Age in West Feliciana Parish
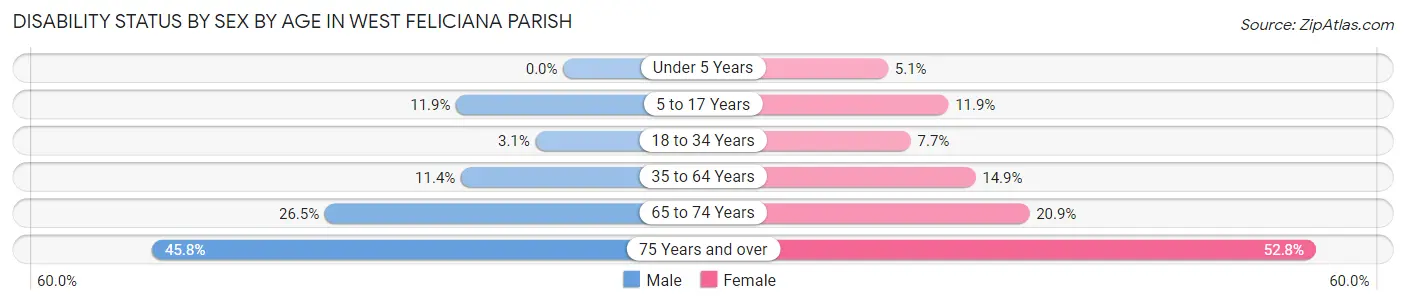
| Age Bracket | Male | Female |
| Under 5 Years | 0 (0.0%) | 12 (5.1%) |
| 5 to 17 Years | 132 (11.9%) | 91 (11.8%) |
| 18 to 34 Years | 56 (3.1%) | 68 (7.7%) |
| 35 to 64 Years | 329 (11.4%) | 289 (14.9%) |
| 65 to 74 Years | 112 (26.5%) | 134 (20.9%) |
| 75 Years and over | 142 (45.8%) | 208 (52.8%) |
Disability Class by Sex by Age in West Feliciana Parish
Disability Class: Hearing Difficulty
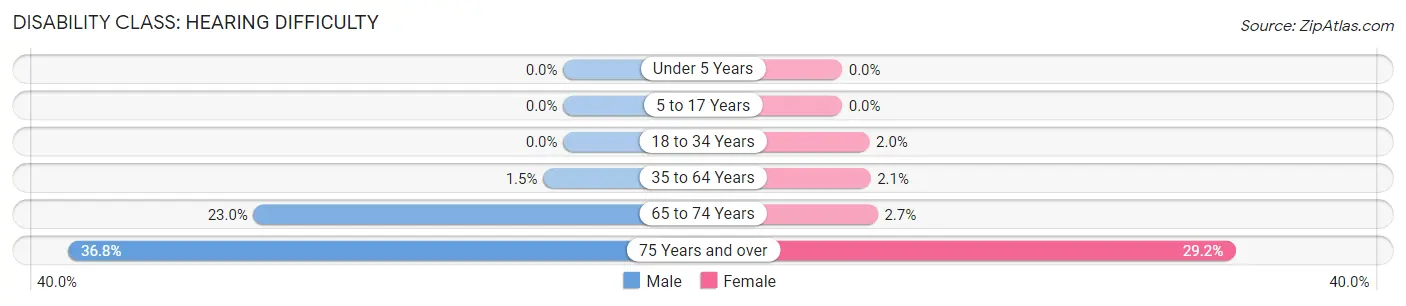
| Age Bracket | Male | Female |
| Under 5 Years | 0 (0.0%) | 0 (0.0%) |
| 5 to 17 Years | 0 (0.0%) | 0 (0.0%) |
| 18 to 34 Years | 0 (0.0%) | 18 (2.0%) |
| 35 to 64 Years | 43 (1.5%) | 41 (2.1%) |
| 65 to 74 Years | 97 (23.0%) | 17 (2.6%) |
| 75 Years and over | 114 (36.8%) | 115 (29.2%) |
Disability Class: Vision Difficulty
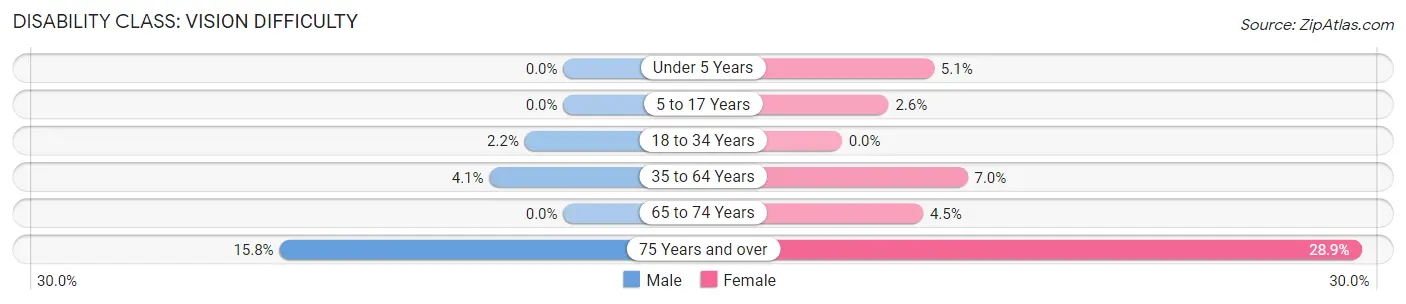
| Age Bracket | Male | Female |
| Under 5 Years | 0 (0.0%) | 12 (5.1%) |
| 5 to 17 Years | 0 (0.0%) | 20 (2.6%) |
| 18 to 34 Years | 39 (2.1%) | 0 (0.0%) |
| 35 to 64 Years | 119 (4.1%) | 136 (7.0%) |
| 65 to 74 Years | 0 (0.0%) | 29 (4.5%) |
| 75 Years and over | 49 (15.8%) | 114 (28.9%) |
Disability Class: Cognitive Difficulty
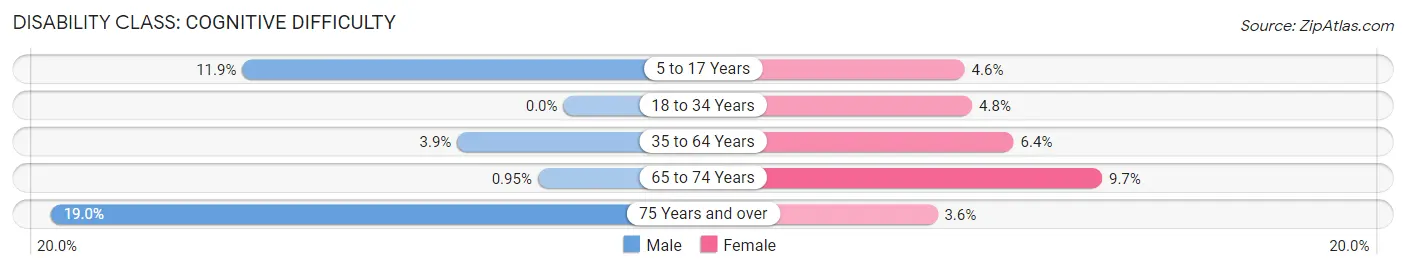
| Age Bracket | Male | Female |
| 5 to 17 Years | 132 (11.9%) | 35 (4.6%) |
| 18 to 34 Years | 0 (0.0%) | 43 (4.8%) |
| 35 to 64 Years | 114 (3.9%) | 124 (6.4%) |
| 65 to 74 Years | 4 (0.9%) | 62 (9.7%) |
| 75 Years and over | 59 (19.0%) | 14 (3.5%) |
Disability Class: Ambulatory Difficulty
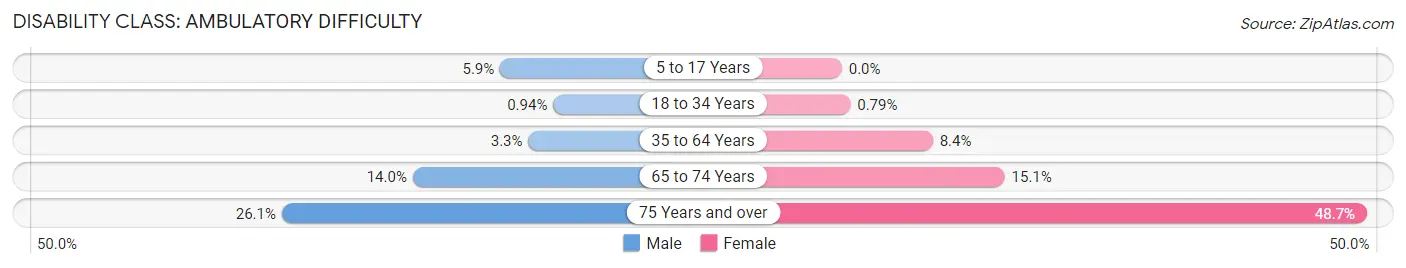
| Age Bracket | Male | Female |
| 5 to 17 Years | 65 (5.9%) | 0 (0.0%) |
| 18 to 34 Years | 17 (0.9%) | 7 (0.8%) |
| 35 to 64 Years | 94 (3.3%) | 164 (8.4%) |
| 65 to 74 Years | 59 (14.0%) | 97 (15.1%) |
| 75 Years and over | 81 (26.1%) | 192 (48.7%) |
Disability Class: Self-Care Difficulty
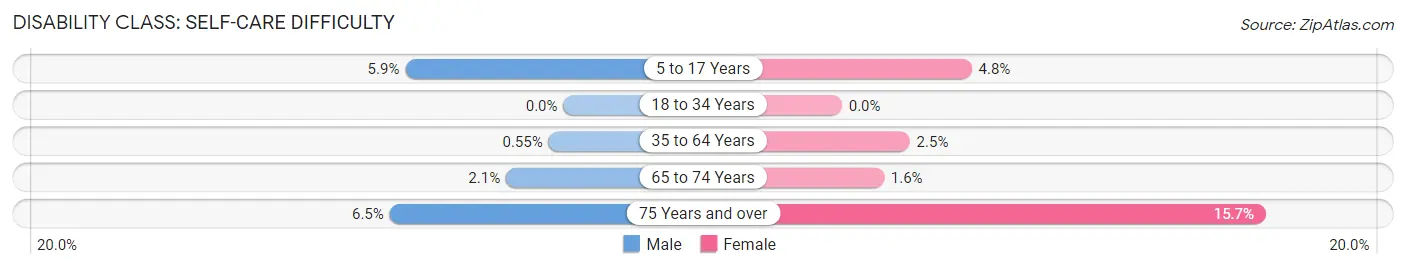
| Age Bracket | Male | Female |
| 5 to 17 Years | 65 (5.9%) | 37 (4.8%) |
| 18 to 34 Years | 0 (0.0%) | 0 (0.0%) |
| 35 to 64 Years | 16 (0.5%) | 49 (2.5%) |
| 65 to 74 Years | 9 (2.1%) | 10 (1.6%) |
| 75 Years and over | 20 (6.5%) | 62 (15.7%) |
Technology Access in West Feliciana Parish
Computing Device Access in West Feliciana Parish
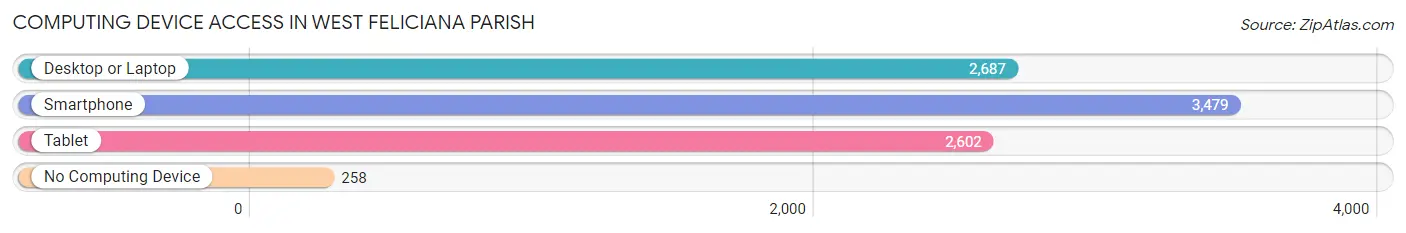
| Device Type | # Households | % Households |
| Desktop or Laptop | 2,687 | 70.3% |
| Smartphone | 3,479 | 91.0% |
| Tablet | 2,602 | 68.1% |
| No Computing Device | 258 | 6.8% |
| Total | 3,822 | 100.0% |
Internet Access in West Feliciana Parish
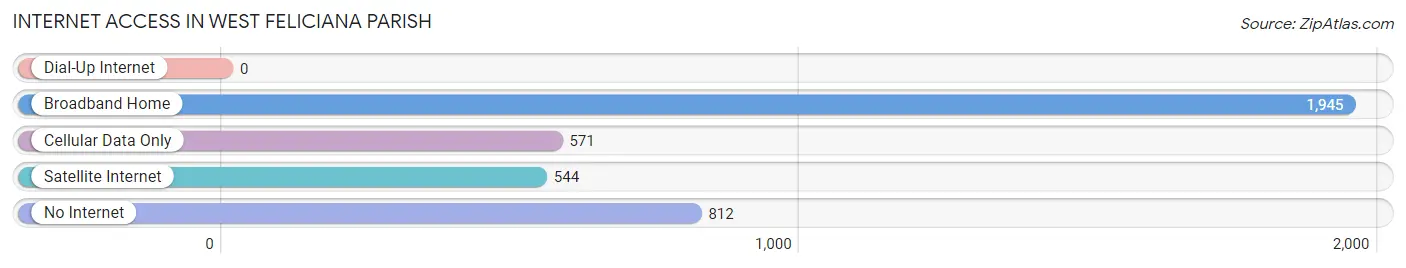
| Internet Type | # Households | % Households |
| Dial-Up Internet | 0 | 0.0% |
| Broadband Home | 1,945 | 50.9% |
| Cellular Data Only | 571 | 14.9% |
| Satellite Internet | 544 | 14.2% |
| No Internet | 812 | 21.2% |
| Total | 3,822 | 100.0% |
West Feliciana Parish Summary
History
Located in the southeastern corner of Louisiana, West Feliciana Parish is a rural parish with a rich history. The parish was established in 1824 and was named after Felicite de St. Maxent, the wife of Spanish Governor Esteban Rodríguez Miró. The parish was originally part of the Feliciana District, which was created in 1810. The district was divided into East and West Feliciana Parishes in 1824.
The parish has a long history of agriculture, with cotton and sugar cane being the primary crops. The parish was also home to several plantations, including the historic Rosedown Plantation, which was built in 1835 and is now a state historic site.
The parish was also home to several Civil War battles, including the Battle of St. Francisville in 1863. The parish was also the site of the Battle of Thompson's Creek in 1864.
Geography
West Feliciana Parish is located in the southeastern corner of Louisiana, and is bordered by East Feliciana Parish to the east, East Baton Rouge Parish to the south, and Wilkinson County, Mississippi to the west. The parish has a total area of 441 square miles, of which 437 square miles is land and 4 square miles is water.
The parish is located in the Mississippi River Delta region, and is mostly flat with some rolling hills. The parish is drained by the Mississippi River and its tributaries, including Thompson's Creek, Bayou Sara, and the Tickfaw River.
Economy
West Feliciana Parish has a largely agricultural economy, with cotton and sugar cane being the primary crops. The parish is also home to several manufacturing companies, including a paper mill and a chemical plant.
The parish is also home to several tourist attractions, including the historic Rosedown Plantation and the Tunica Hills Wildlife Management Area.
Demographics
As of the 2010 census, West Feliciana Parish had a population of 15,625. The racial makeup of the parish was 79.3% White, 18.3% African American, 0.4% Native American, 0.3% Asian, 0.2% Pacific Islander, 0.7% from other races, and 0.9% from two or more races. Hispanic or Latino of any race were 2.2% of the population.
The median household income in the parish was $45,813, and the median family income was $54,813. The per capita income was $22,813. About 14.3% of the population was below the poverty line.
Common Questions
What is Per Capita Income in West Feliciana Parish?
Per Capita income in West Feliciana Parish is $30,055.
What is the Median Family Income in West Feliciana Parish?
Median Family Income in West Feliciana Parish is $84,426.
What is the Median Household income in West Feliciana Parish?
Median Household Income in West Feliciana Parish is $71,985.
What is Income or Wage Gap in West Feliciana Parish?
Income or Wage Gap in West Feliciana Parish is 24.9%.
Women in West Feliciana Parish earn 75.1 cents for every dollar earned by a man.
What is Family Income Deficit in West Feliciana Parish?
Family Income Deficit in West Feliciana Parish is $9,747.
Families that are below poverty line in West Feliciana Parish earn $9,747 less on average than the poverty threshold level.
What is Inequality or Gini Index in West Feliciana Parish?
Inequality or Gini Index in West Feliciana Parish is 0.48.
What is the Total Population of West Feliciana Parish?
Total Population of West Feliciana Parish is 15,358.
What is the Total Male Population of West Feliciana Parish?
Total Male Population of West Feliciana Parish is 10,458.
What is the Total Female Population of West Feliciana Parish?
Total Female Population of West Feliciana Parish is 4,900.
What is the Ratio of Males per 100 Females in West Feliciana Parish?
There are 213.43 Males per 100 Females in West Feliciana Parish.
What is the Ratio of Females per 100 Males in West Feliciana Parish?
There are 46.85 Females per 100 Males in West Feliciana Parish.
What is the Median Population Age in West Feliciana Parish?
Median Population Age in West Feliciana Parish is 42.6 Years.
What is the Average Family Size in West Feliciana Parish
Average Family Size in West Feliciana Parish is 3.8 People.
What is the Average Household Size in West Feliciana Parish
Average Household Size in West Feliciana Parish is 3.1 People.
How Large is the Labor Force in West Feliciana Parish?
There are 6,189 People in the Labor Forcein in West Feliciana Parish.
What is the Percentage of People in the Labor Force in West Feliciana Parish?
47.0% of People are in the Labor Force in West Feliciana Parish.
What is the Unemployment Rate in West Feliciana Parish?
Unemployment Rate in West Feliciana Parish is 8.9%.