Union Parish, LA Map & Demographics
Union Parish Map
Union Parish Overview
$28,575
PER CAPITA INCOME
$59,891
AVG FAMILY INCOME
$47,068
AVG HOUSEHOLD INCOME
32.2%
WAGE / INCOME GAP [ % ]
67.8¢/ $1
WAGE / INCOME GAP [ $ ]
$12,192
FAMILY INCOME DEFICIT
0.51
INEQUALITY / GINI INDEX
21,049
TOTAL POPULATION
10,450
MALE POPULATION
10,599
FEMALE POPULATION
98.59
MALES / 100 FEMALES
101.43
FEMALES / 100 MALES
42.5
MEDIAN AGE
3.2
AVG FAMILY SIZE
2.5
AVG HOUSEHOLD SIZE
8,483
LABOR FORCE [ PEOPLE ]
49.7%
PERCENT IN LABOR FORCE
5.4%
UNEMPLOYMENT RATE
Union Parish Area Codes
Income in Union Parish
Income Overview in Union Parish
Per Capita Income in Union Parish is $28,575, while median incomes of families and households are $59,891 and $47,068 respectively.
| Characteristic | Number | Measure |
| Per Capita Income | 21,049 | $28,575 |
| Median Family Income | 5,330 | $59,891 |
| Mean Family Income | 5,330 | $82,134 |
| Median Household Income | 8,172 | $47,068 |
| Mean Household Income | 8,172 | $67,629 |
| Income Deficit | 5,330 | $12,192 |
| Wage / Income Gap (%) | 21,049 | 32.16% |
| Wage / Income Gap ($) | 21,049 | 67.84¢ per $1 |
| Gini / Inequality Index | 21,049 | 0.51 |
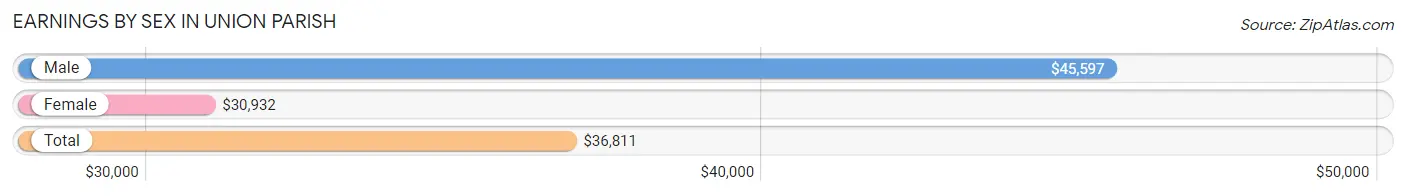
Earnings by Sex in Union Parish
Average Earnings in Union Parish are $36,811, $45,597 for men and $30,932 for women, a difference of 32.2%.
| Sex | Number | Average Earnings |
| Male | 4,630 (53.9%) | $45,597 |
| Female | 3,956 (46.1%) | $30,932 |
| Total | 8,586 (100.0%) | $36,811 |
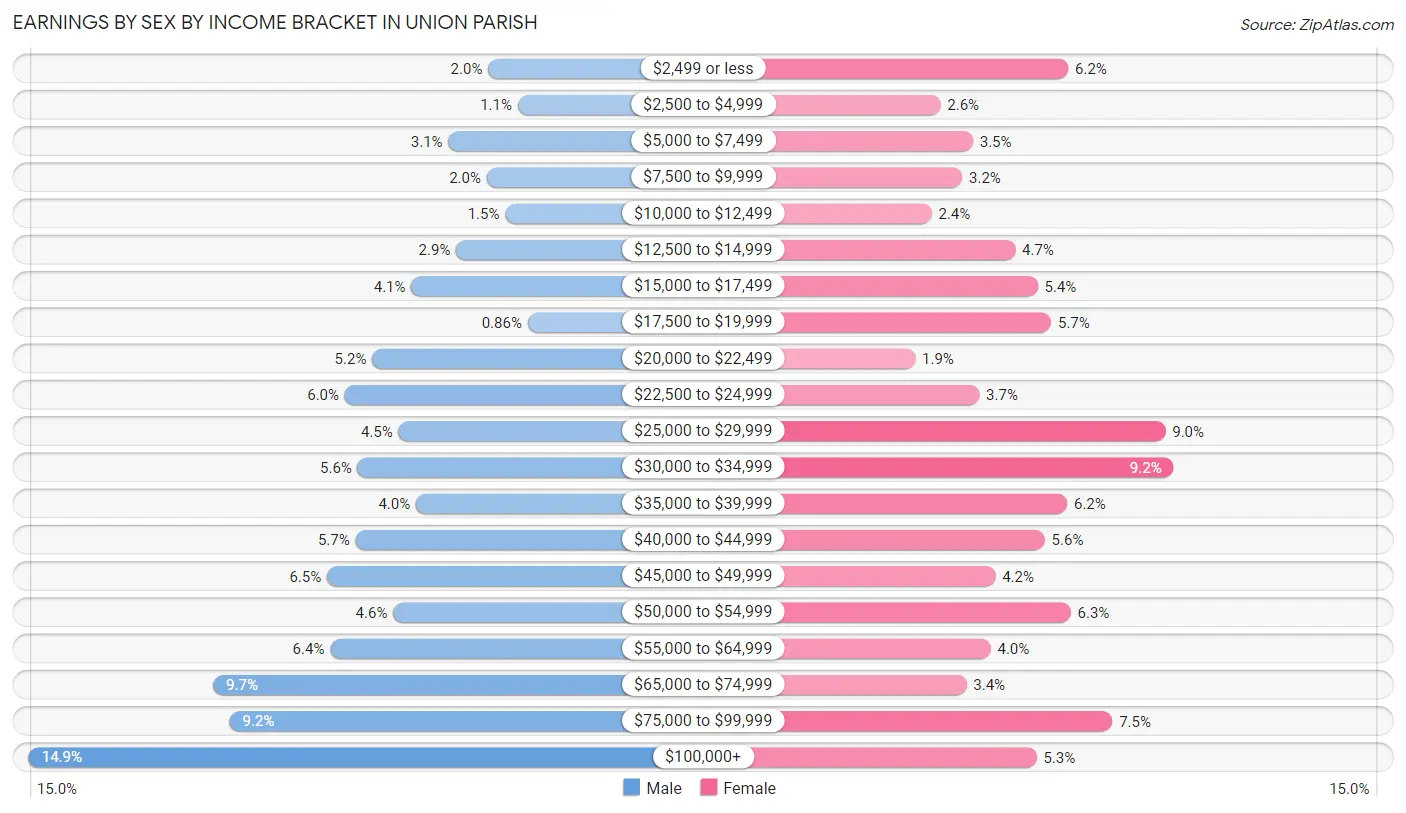
Earnings by Sex by Income Bracket in Union Parish
The most common earnings brackets in Union Parish are $100,000+ for men (689 | 14.9%) and $30,000 to $34,999 for women (363 | 9.2%).
| Income | Male | Female |
| $2,499 or less | 91 (2.0%) | 246 (6.2%) |
| $2,500 to $4,999 | 53 (1.1%) | 104 (2.6%) |
| $5,000 to $7,499 | 143 (3.1%) | 140 (3.5%) |
| $7,500 to $9,999 | 93 (2.0%) | 128 (3.2%) |
| $10,000 to $12,499 | 69 (1.5%) | 94 (2.4%) |
| $12,500 to $14,999 | 133 (2.9%) | 187 (4.7%) |
| $15,000 to $17,499 | 191 (4.1%) | 212 (5.4%) |
| $17,500 to $19,999 | 40 (0.9%) | 227 (5.7%) |
| $20,000 to $22,499 | 242 (5.2%) | 76 (1.9%) |
| $22,500 to $24,999 | 278 (6.0%) | 147 (3.7%) |
| $25,000 to $29,999 | 208 (4.5%) | 354 (8.9%) |
| $30,000 to $34,999 | 261 (5.6%) | 363 (9.2%) |
| $35,000 to $39,999 | 185 (4.0%) | 245 (6.2%) |
| $40,000 to $44,999 | 264 (5.7%) | 220 (5.6%) |
| $45,000 to $49,999 | 301 (6.5%) | 165 (4.2%) |
| $50,000 to $54,999 | 215 (4.6%) | 249 (6.3%) |
| $55,000 to $64,999 | 297 (6.4%) | 160 (4.0%) |
| $65,000 to $74,999 | 449 (9.7%) | 133 (3.4%) |
| $75,000 to $99,999 | 428 (9.2%) | 295 (7.5%) |
| $100,000+ | 689 (14.9%) | 211 (5.3%) |
| Total | 4,630 (100.0%) | 3,956 (100.0%) |
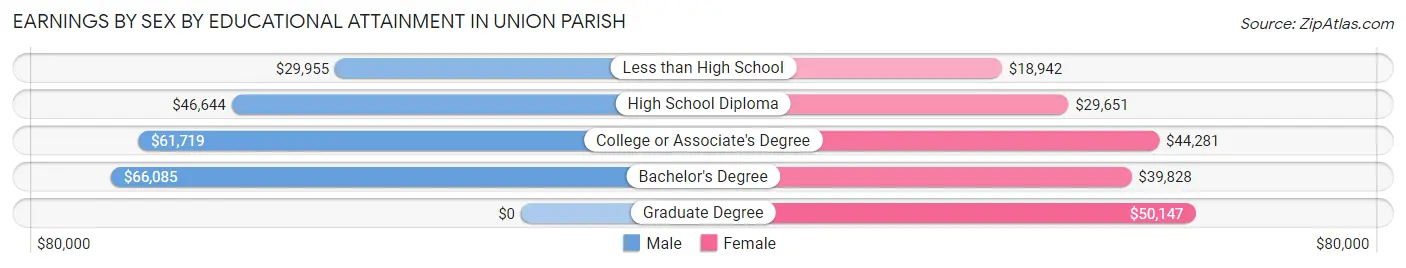
Earnings by Sex by Educational Attainment in Union Parish
Average earnings in Union Parish are $50,224 for men and $33,834 for women, a difference of 32.6%. Men with an educational attainment of bachelor's degree enjoy the highest average annual earnings of $66,085, while those with less than high school education earn the least with $29,955. Women with an educational attainment of graduate degree earn the most with the average annual earnings of $50,147, while those with less than high school education have the smallest earnings of $18,942.
| Educational Attainment | Male Income | Female Income |
| Less than High School | $29,955 | $18,942 |
| High School Diploma | $46,644 | $29,651 |
| College or Associate's Degree | $61,719 | $44,281 |
| Bachelor's Degree | $66,085 | $39,828 |
| Graduate Degree | - | - |
| Total | $50,224 | $33,834 |
Family Income in Union Parish
Family Income Brackets in Union Parish
According to the Union Parish family income data, there are 986 families falling into the $50,000 to $74,999 income range, which is the most common income bracket and makes up 18.5% of all families. Conversely, the $10,000 to $14,999 income bracket is the least frequent group with only 187 families (3.5%) belonging to this category.
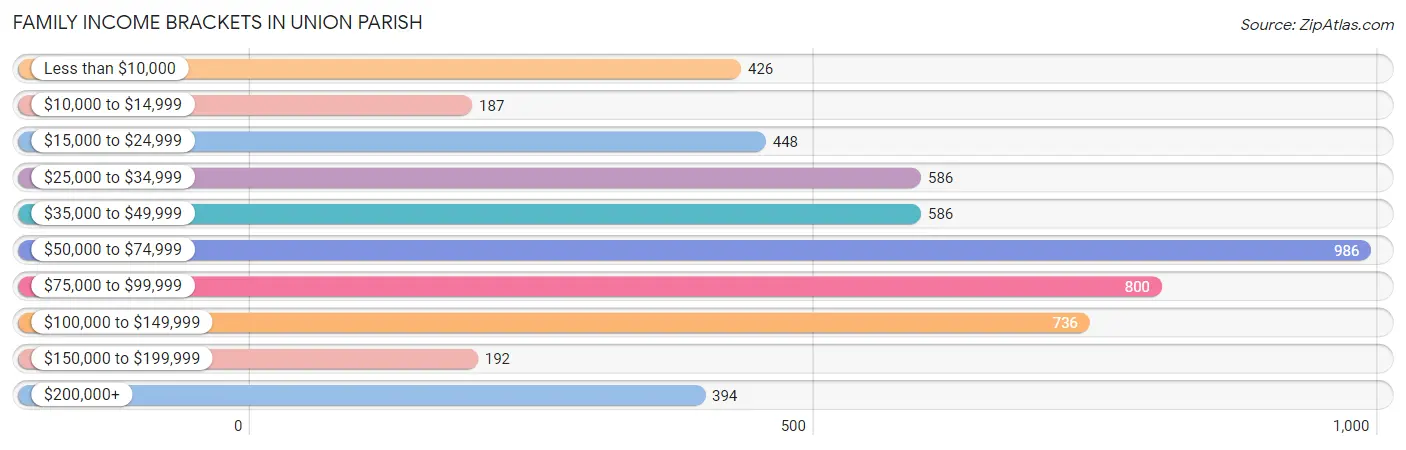
| Income Bracket | # Families | % Families |
| Less than $10,000 | 426 | 8.0% |
| $10,000 to $14,999 | 187 | 3.5% |
| $15,000 to $24,999 | 448 | 8.4% |
| $25,000 to $34,999 | 586 | 11.0% |
| $35,000 to $49,999 | 586 | 11.0% |
| $50,000 to $74,999 | 986 | 18.5% |
| $75,000 to $99,999 | 800 | 15.0% |
| $100,000 to $149,999 | 736 | 13.8% |
| $150,000 to $199,999 | 192 | 3.6% |
| $200,000+ | 394 | 7.4% |
Family Income by Famaliy Size in Union Parish
4-person families (679 | 12.7%) account for the highest median family income in Union Parish with $72,171 per family, while 2-person families (2,879 | 54.0%) have the highest median income of $30,102 per family member.
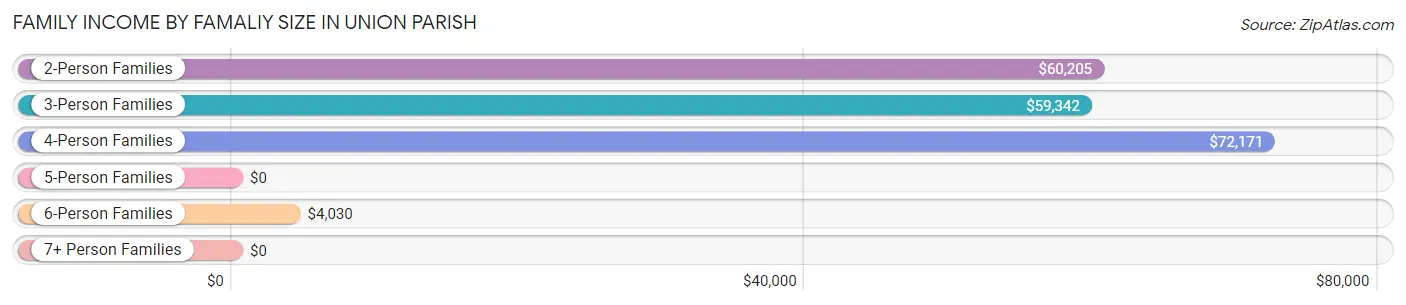
| Income Bracket | # Families | Median Income |
| 2-Person Families | 2,879 (54.0%) | $60,205 |
| 3-Person Families | 1,204 (22.6%) | $59,342 |
| 4-Person Families | 679 (12.7%) | $72,171 |
| 5-Person Families | 323 (6.1%) | $0 |
| 6-Person Families | 131 (2.5%) | $4,030 |
| 7+ Person Families | 114 (2.1%) | $0 |
| Total | 5,330 (100.0%) | $59,891 |
Family Income by Number of Earners in Union Parish
The median family income in Union Parish is $59,891, with families comprising 3+ earners (296) having the highest median family income of $176,471, while families with no earners (1,341) have the lowest median family income of $34,295, accounting for 5.6% and 25.2% of families, respectively.
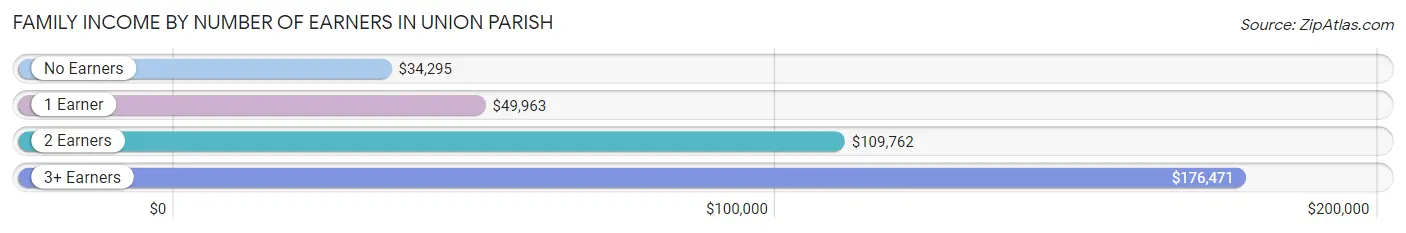
| Number of Earners | # Families | Median Income |
| No Earners | 1,341 (25.2%) | $34,295 |
| 1 Earner | 2,269 (42.6%) | $49,963 |
| 2 Earners | 1,424 (26.7%) | $109,762 |
| 3+ Earners | 296 (5.6%) | $176,471 |
| Total | 5,330 (100.0%) | $59,891 |
Household Income in Union Parish
Household Income Brackets in Union Parish
With 1,373 households falling in the category, the $50,000 to $74,999 income range is the most frequent in Union Parish, accounting for 16.8% of all households. In contrast, only 229 households (2.8%) fall into the $150,000 to $199,999 income bracket, making it the least populous group.
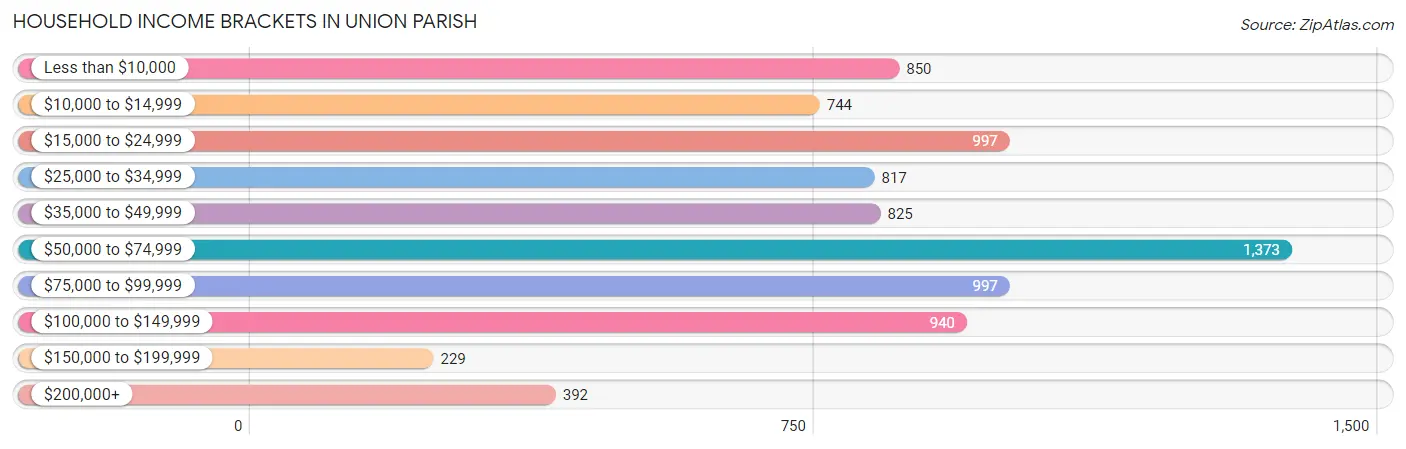
| Income Bracket | # Households | % Households |
| Less than $10,000 | 850 | 10.4% |
| $10,000 to $14,999 | 744 | 9.1% |
| $15,000 to $24,999 | 997 | 12.2% |
| $25,000 to $34,999 | 817 | 10.0% |
| $35,000 to $49,999 | 825 | 10.1% |
| $50,000 to $74,999 | 1,373 | 16.8% |
| $75,000 to $99,999 | 997 | 12.2% |
| $100,000 to $149,999 | 940 | 11.5% |
| $150,000 to $199,999 | 229 | 2.8% |
| $200,000+ | 392 | 4.8% |
Household Income by Householder Age in Union Parish
The median household income in Union Parish is $47,068, with the highest median household income of $63,983 found in the 45 to 64 years age bracket for the primary householder. A total of 3,104 households (38.0%) fall into this category. Meanwhile, the 15 to 24 years age bracket for the primary householder has the lowest median household income of $32,232, with 186 households (2.3%) in this group.
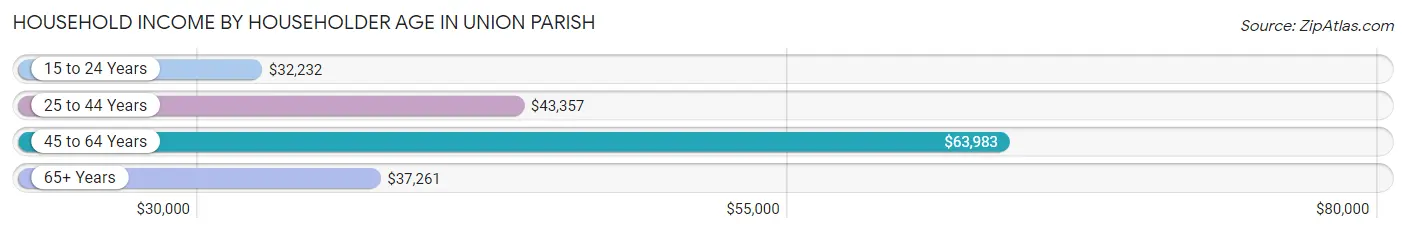
| Income Bracket | # Households | Median Income |
| 15 to 24 Years | 186 (2.3%) | $32,232 |
| 25 to 44 Years | 2,243 (27.5%) | $43,357 |
| 45 to 64 Years | 3,104 (38.0%) | $63,983 |
| 65+ Years | 2,639 (32.3%) | $37,261 |
| Total | 8,172 (100.0%) | $47,068 |
Poverty in Union Parish
Income Below Poverty by Sex and Age in Union Parish
With 23.7% poverty level for males and 29.8% for females among the residents of Union Parish, 12 to 14 year old males and under 5 year old females are the most vulnerable to poverty, with 233 males (64.0%) and 347 females (52.8%) in their respective age groups living below the poverty level.
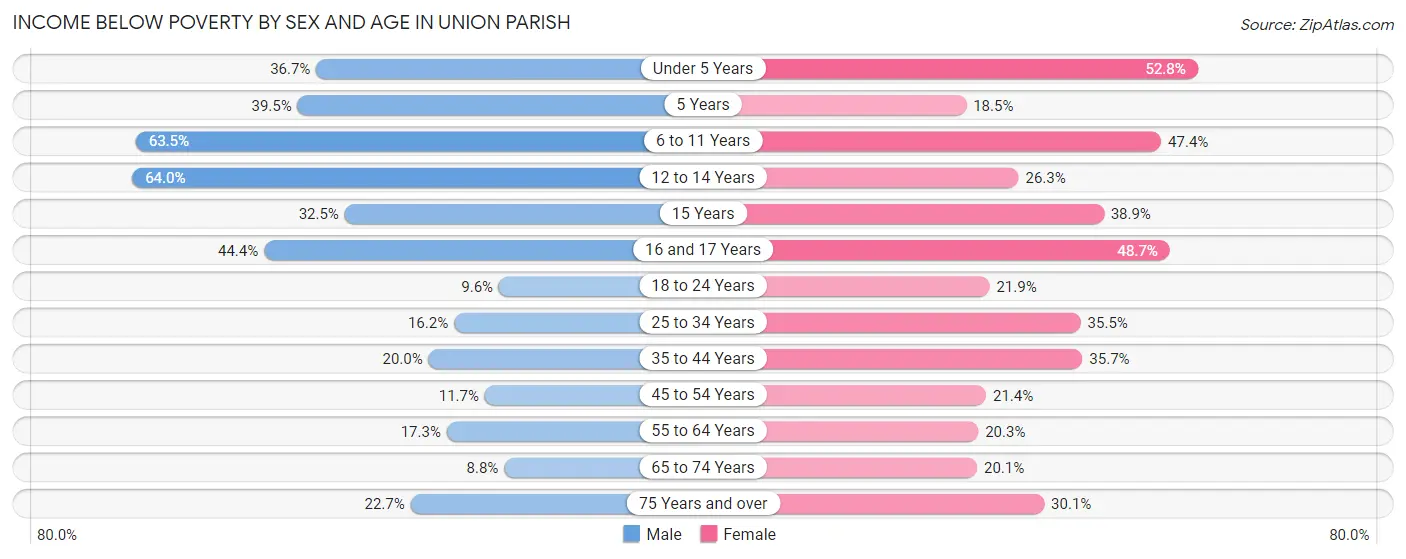
| Age Bracket | Male | Female |
| Under 5 Years | 200 (36.7%) | 347 (52.8%) |
| 5 Years | 30 (39.5%) | 17 (18.5%) |
| 6 to 11 Years | 551 (63.5%) | 358 (47.4%) |
| 12 to 14 Years | 233 (64.0%) | 89 (26.3%) |
| 15 Years | 75 (32.5%) | 21 (38.9%) |
| 16 and 17 Years | 140 (44.4%) | 129 (48.7%) |
| 18 to 24 Years | 73 (9.6%) | 182 (21.9%) |
| 25 to 34 Years | 178 (16.2%) | 404 (35.5%) |
| 35 to 44 Years | 228 (20.0%) | 422 (35.7%) |
| 45 to 54 Years | 133 (11.7%) | 259 (21.4%) |
| 55 to 64 Years | 259 (17.3%) | 332 (20.3%) |
| 65 to 74 Years | 112 (8.8%) | 259 (20.1%) |
| 75 Years and over | 174 (22.7%) | 302 (30.0%) |
| Total | 2,386 (23.7%) | 3,121 (29.8%) |
Income Above Poverty by Sex and Age in Union Parish
According to the poverty statistics in Union Parish, males aged 65 to 74 years and females aged 5 years are the age groups that are most secure financially, with 91.2% of males and 81.5% of females in these age groups living above the poverty line.
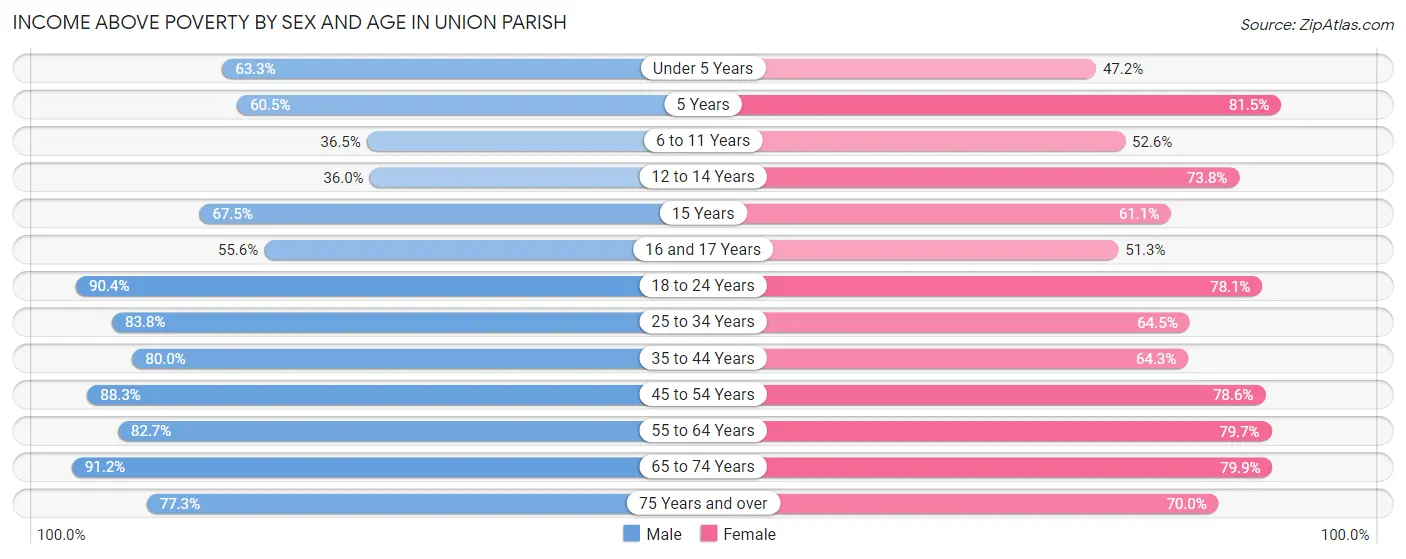
| Age Bracket | Male | Female |
| Under 5 Years | 345 (63.3%) | 310 (47.2%) |
| 5 Years | 46 (60.5%) | 75 (81.5%) |
| 6 to 11 Years | 317 (36.5%) | 397 (52.6%) |
| 12 to 14 Years | 131 (36.0%) | 250 (73.8%) |
| 15 Years | 156 (67.5%) | 33 (61.1%) |
| 16 and 17 Years | 175 (55.6%) | 136 (51.3%) |
| 18 to 24 Years | 690 (90.4%) | 648 (78.1%) |
| 25 to 34 Years | 918 (83.8%) | 735 (64.5%) |
| 35 to 44 Years | 911 (80.0%) | 759 (64.3%) |
| 45 to 54 Years | 1,008 (88.3%) | 950 (78.6%) |
| 55 to 64 Years | 1,236 (82.7%) | 1,307 (79.7%) |
| 65 to 74 Years | 1,162 (91.2%) | 1,031 (79.9%) |
| 75 Years and over | 593 (77.3%) | 703 (70.0%) |
| Total | 7,688 (76.3%) | 7,334 (70.2%) |
Income Below Poverty Among Married-Couple Families in Union Parish
The poverty statistics for married-couple families in Union Parish show that 11.9% or 477 of the total 4,006 families live below the poverty line. Families with 5 or more children have the highest poverty rate of 100.0%, comprising of 85 families. On the other hand, families with 1 or 2 children have the lowest poverty rate of 6.1%, which includes 66 families.
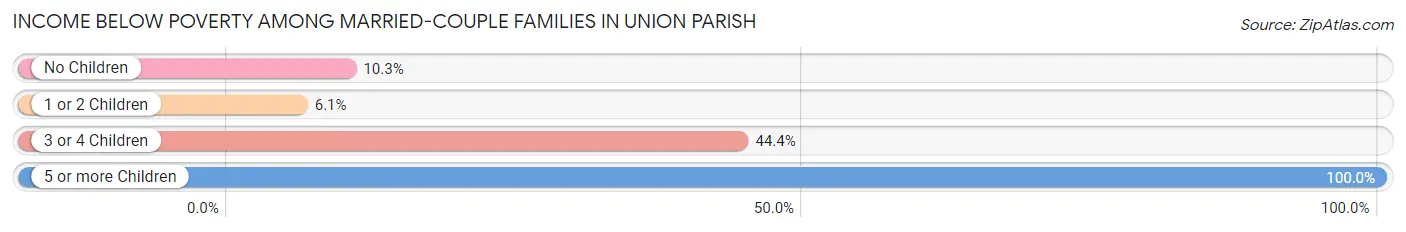
| Children | Above Poverty | Below Poverty |
| No Children | 2,453 (89.7%) | 282 (10.3%) |
| 1 or 2 Children | 1,021 (93.9%) | 66 (6.1%) |
| 3 or 4 Children | 55 (55.6%) | 44 (44.4%) |
| 5 or more Children | 0 (0.0%) | 85 (100.0%) |
| Total | 3,529 (88.1%) | 477 (11.9%) |
Income Below Poverty Among Single-Parent Households in Union Parish
According to the poverty data in Union Parish, 22.4% or 45 single-father households and 53.3% or 599 single-mother households are living below the poverty line. Among single-father households, those with 1 or 2 children have the highest poverty rate, with 45 households (69.2%) experiencing poverty. Likewise, among single-mother households, those with 3 or 4 children have the highest poverty rate, with 66 households (100.0%) falling below the poverty line.
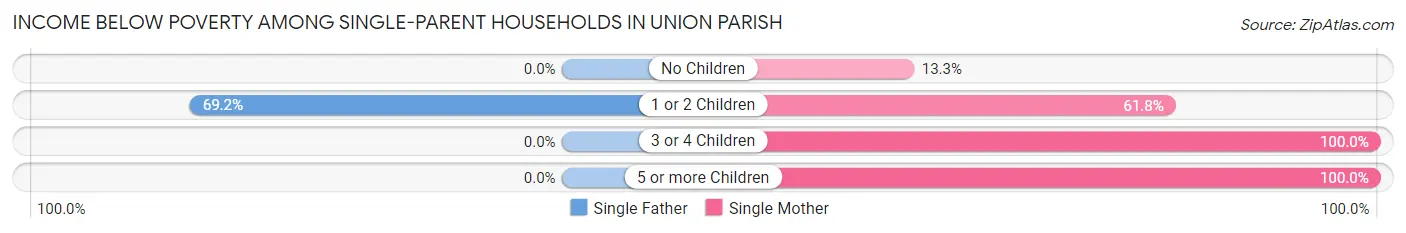
| Children | Single Father | Single Mother |
| No Children | 0 (0.0%) | 44 (13.3%) |
| 1 or 2 Children | 45 (69.2%) | 382 (61.8%) |
| 3 or 4 Children | 0 (0.0%) | 66 (100.0%) |
| 5 or more Children | 0 (0.0%) | 107 (100.0%) |
| Total | 45 (22.4%) | 599 (53.3%) |
Income Below Poverty Among Married-Couple vs Single-Parent Households in Union Parish
The poverty data for Union Parish shows that 477 of the married-couple family households (11.9%) and 644 of the single-parent households (48.6%) are living below the poverty level. Within the married-couple family households, those with 5 or more children have the highest poverty rate, with 85 households (100.0%) falling below the poverty line. Among the single-parent households, those with 3 or 4 children have the highest poverty rate, with 66 household (100.0%) living below poverty.
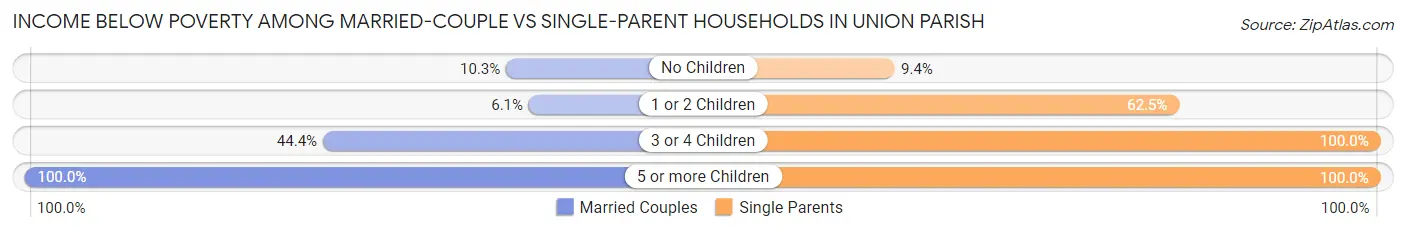
| Children | Married-Couple Families | Single-Parent Households |
| No Children | 282 (10.3%) | 44 (9.4%) |
| 1 or 2 Children | 66 (6.1%) | 427 (62.5%) |
| 3 or 4 Children | 44 (44.4%) | 66 (100.0%) |
| 5 or more Children | 85 (100.0%) | 107 (100.0%) |
| Total | 477 (11.9%) | 644 (48.6%) |
Race in Union Parish
The most populous races in Union Parish are White / Caucasian (14,805 | 70.3%), Black / African American (5,080 | 24.1%), and Hispanic or Latino (1,099 | 5.2%).
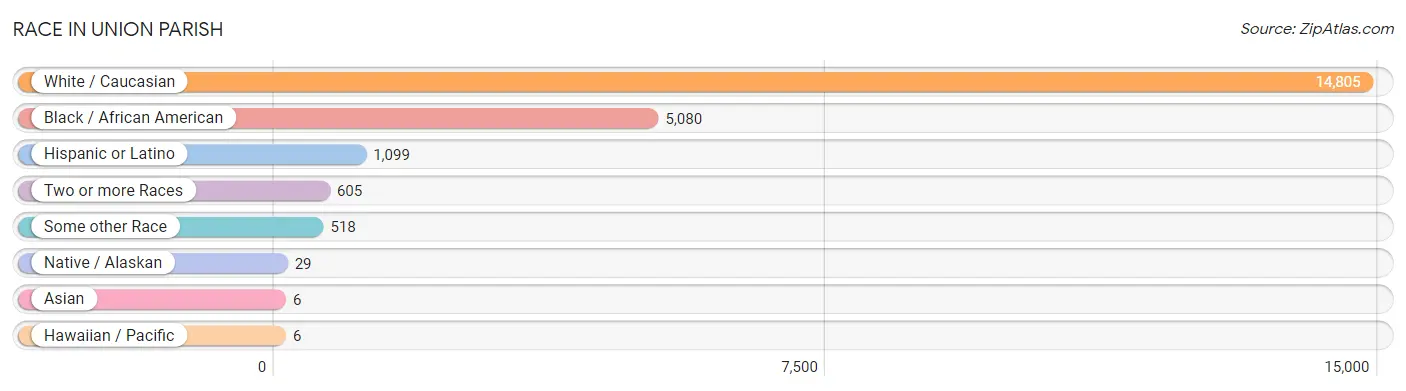
| Race | # Population | % Population |
| Asian | 6 | 0.0% |
| Black / African American | 5,080 | 24.1% |
| Hawaiian / Pacific | 6 | 0.0% |
| Hispanic or Latino | 1,099 | 5.2% |
| Native / Alaskan | 29 | 0.1% |
| White / Caucasian | 14,805 | 70.3% |
| Two or more Races | 605 | 2.9% |
| Some other Race | 518 | 2.5% |
| Total | 21,049 | 100.0% |
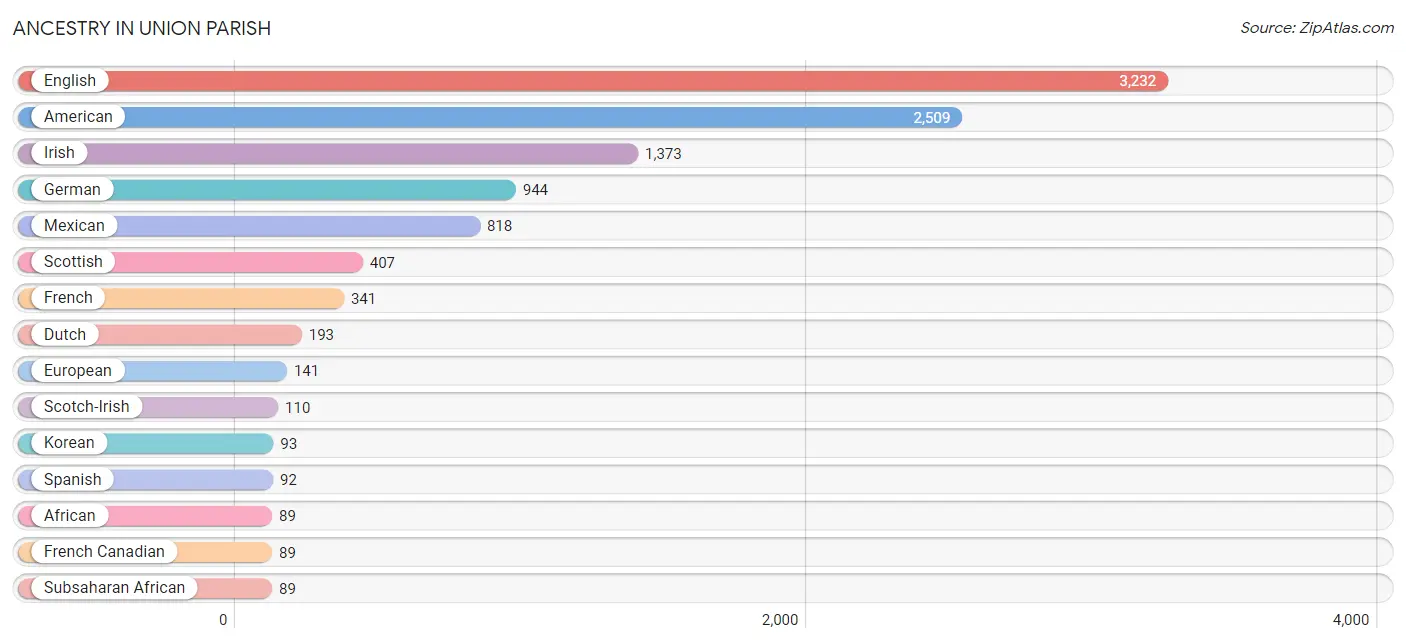
Ancestry in Union Parish
The most populous ancestries reported in Union Parish are English (3,232 | 15.3%), American (2,509 | 11.9%), Irish (1,373 | 6.5%), German (944 | 4.5%), and Mexican (818 | 3.9%), together accounting for 42.2% of all Union Parish residents.
| Ancestry | # Population | % Population |
| African | 89 | 0.4% |
| American | 2,509 | 11.9% |
| Arab | 46 | 0.2% |
| British | 25 | 0.1% |
| Burmese | 47 | 0.2% |
| Cajun | 17 | 0.1% |
| Canadian | 11 | 0.1% |
| Cherokee | 81 | 0.4% |
| Colombian | 7 | 0.0% |
| Cuban | 11 | 0.1% |
| Dutch | 193 | 0.9% |
| English | 3,232 | 15.3% |
| European | 141 | 0.7% |
| Finnish | 28 | 0.1% |
| French | 341 | 1.6% |
| French American Indian | 32 | 0.2% |
| French Canadian | 89 | 0.4% |
| German | 944 | 4.5% |
| Hungarian | 1 | 0.0% |
| Icelander | 11 | 0.1% |
| Indian (Asian) | 35 | 0.2% |
| Irish | 1,373 | 6.5% |
| Italian | 81 | 0.4% |
| Korean | 93 | 0.4% |
| Mexican | 818 | 3.9% |
| Native Hawaiian | 22 | 0.1% |
| Northern European | 15 | 0.1% |
| Norwegian | 10 | 0.1% |
| Polish | 41 | 0.2% |
| Puerto Rican | 10 | 0.1% |
| Samoan | 21 | 0.1% |
| Scandinavian | 15 | 0.1% |
| Scotch-Irish | 110 | 0.5% |
| Scottish | 407 | 1.9% |
| South American | 7 | 0.0% |
| Spaniard | 10 | 0.1% |
| Spanish | 92 | 0.4% |
| Sri Lankan | 5 | 0.0% |
| Subsaharan African | 89 | 0.4% |
| Swedish | 3 | 0.0% |
| Welsh | 47 | 0.2% | View All 41 Rows |
Immigrants in Union Parish
The most numerous immigrant groups reported in Union Parish came from Latin America (422 | 2.0%), Central America (408 | 1.9%), Mexico (399 | 1.9%), Europe (11 | 0.1%), and Germany (10 | 0.1%), together accounting for 5.9% of all Union Parish residents.
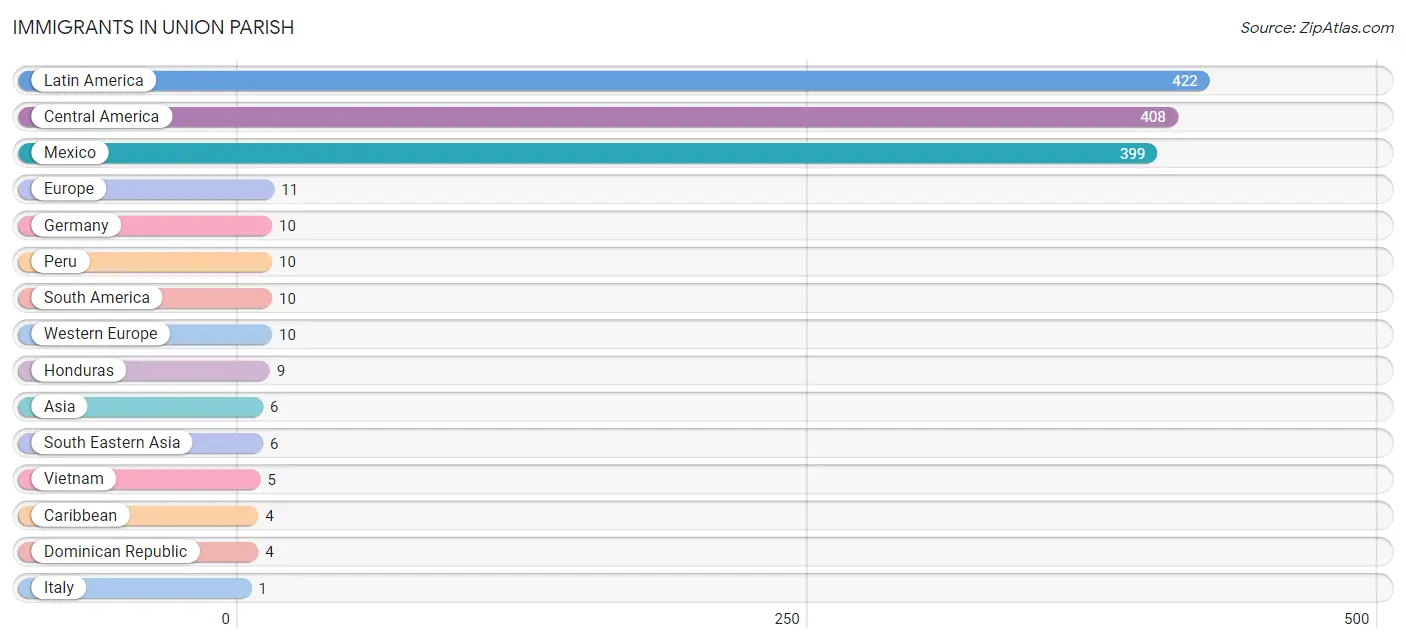
| Immigration Origin | # Population | % Population |
| Asia | 6 | 0.0% |
| Caribbean | 4 | 0.0% |
| Central America | 408 | 1.9% |
| Dominican Republic | 4 | 0.0% |
| Europe | 11 | 0.1% |
| Germany | 10 | 0.1% |
| Honduras | 9 | 0.0% |
| Italy | 1 | 0.0% |
| Latin America | 422 | 2.0% |
| Mexico | 399 | 1.9% |
| Peru | 10 | 0.1% |
| Philippines | 1 | 0.0% |
| South America | 10 | 0.1% |
| South Eastern Asia | 6 | 0.0% |
| Southern Europe | 1 | 0.0% |
| Vietnam | 5 | 0.0% |
| Western Europe | 10 | 0.1% | View All 17 Rows |
Sex and Age in Union Parish
Sex and Age in Union Parish
The most populous age groups in Union Parish are 15 to 19 Years (838 | 8.0%) for men and 60 to 64 Years (859 | 8.1%) for women.
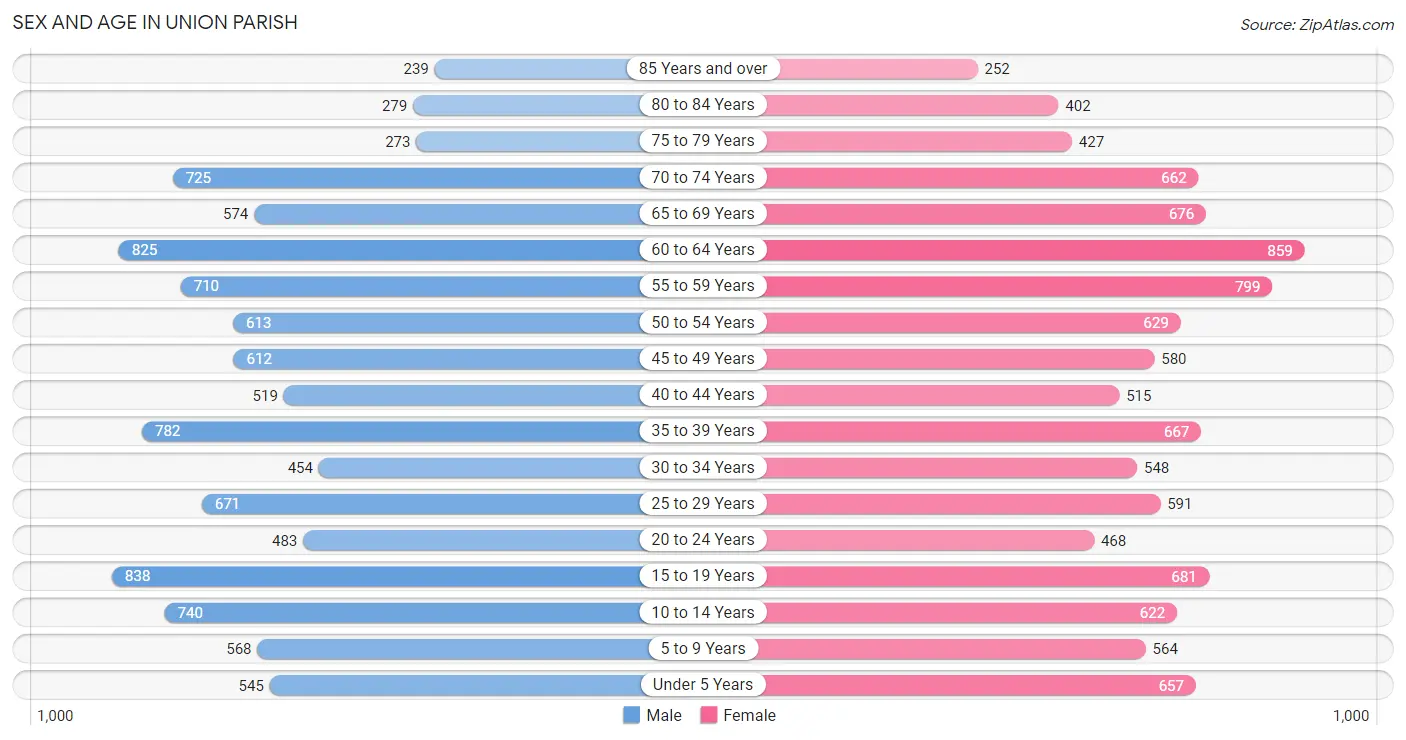
| Age Bracket | Male | Female |
| Under 5 Years | 545 (5.2%) | 657 (6.2%) |
| 5 to 9 Years | 568 (5.4%) | 564 (5.3%) |
| 10 to 14 Years | 740 (7.1%) | 622 (5.9%) |
| 15 to 19 Years | 838 (8.0%) | 681 (6.4%) |
| 20 to 24 Years | 483 (4.6%) | 468 (4.4%) |
| 25 to 29 Years | 671 (6.4%) | 591 (5.6%) |
| 30 to 34 Years | 454 (4.3%) | 548 (5.2%) |
| 35 to 39 Years | 782 (7.5%) | 667 (6.3%) |
| 40 to 44 Years | 519 (5.0%) | 515 (4.9%) |
| 45 to 49 Years | 612 (5.9%) | 580 (5.5%) |
| 50 to 54 Years | 613 (5.9%) | 629 (5.9%) |
| 55 to 59 Years | 710 (6.8%) | 799 (7.5%) |
| 60 to 64 Years | 825 (7.9%) | 859 (8.1%) |
| 65 to 69 Years | 574 (5.5%) | 676 (6.4%) |
| 70 to 74 Years | 725 (6.9%) | 662 (6.2%) |
| 75 to 79 Years | 273 (2.6%) | 427 (4.0%) |
| 80 to 84 Years | 279 (2.7%) | 402 (3.8%) |
| 85 Years and over | 239 (2.3%) | 252 (2.4%) |
| Total | 10,450 (100.0%) | 10,599 (100.0%) |
Families and Households in Union Parish
Median Family Size in Union Parish
The median family size in Union Parish is 3.22 persons per family, with single female/mother families (1,123 | 21.1%) accounting for the largest median family size of 3.8 persons per family. On the other hand, married-couple families (4,006 | 75.2%) represent the smallest median family size with 3.04 persons per family.
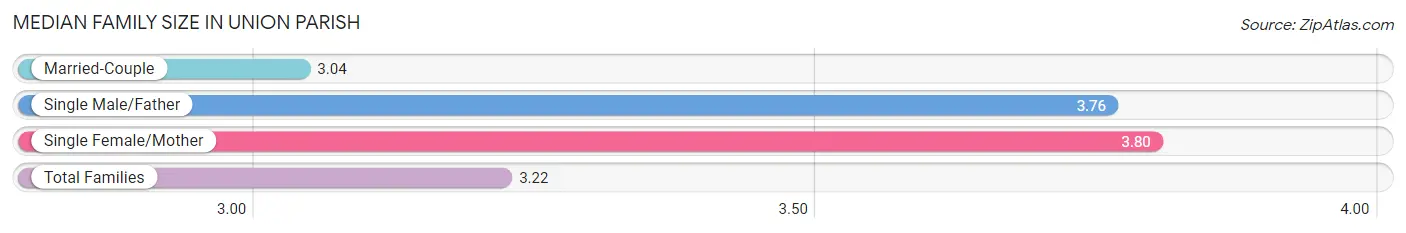
| Family Type | # Families | Family Size |
| Married-Couple | 4,006 (75.2%) | 3.04 |
| Single Male/Father | 201 (3.8%) | 3.76 |
| Single Female/Mother | 1,123 (21.1%) | 3.80 |
| Total Families | 5,330 (100.0%) | 3.22 |
Median Household Size in Union Parish
The median household size in Union Parish is 2.51 persons per household, with single male/father households (201 | 2.5%) accounting for the largest median household size of 4.07 persons per household. non-family households (2,842 | 34.8%) represent the smallest median household size with 1.06 persons per household.
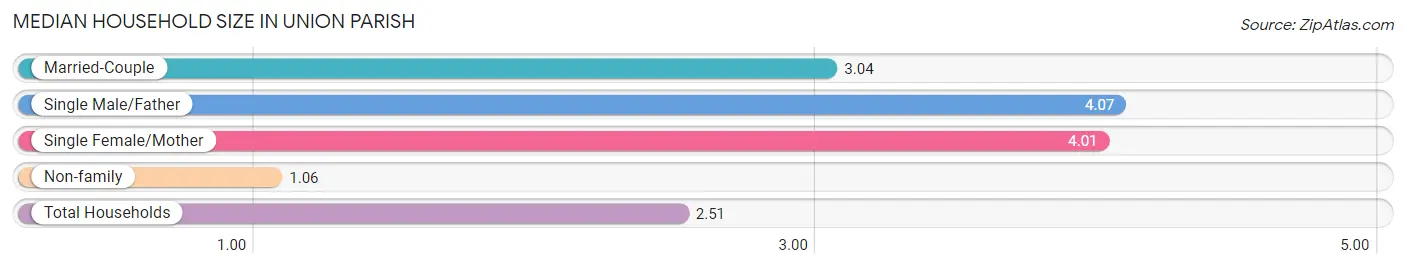
| Household Type | # Households | Household Size |
| Married-Couple | 4,006 (49.0%) | 3.04 |
| Single Male/Father | 201 (2.5%) | 4.07 |
| Single Female/Mother | 1,123 (13.7%) | 4.01 |
| Non-family | 2,842 (34.8%) | 1.06 |
| Total Households | 8,172 (100.0%) | 2.51 |
Household Size by Marriage Status in Union Parish
Out of a total of 8,172 households in Union Parish, 5,330 (65.2%) are family households, while 2,842 (34.8%) are nonfamily households. The most numerous type of family households are 2-person households, comprising 2,807, and the most common type of nonfamily households are 1-person households, comprising 2,692.
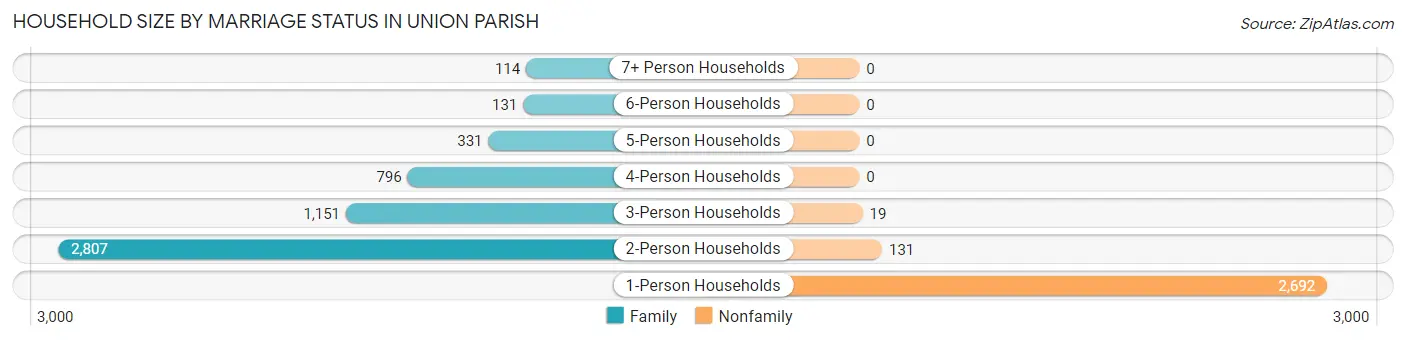
| Household Size | Family Households | Nonfamily Households |
| 1-Person Households | - | 2,692 (32.9%) |
| 2-Person Households | 2,807 (34.4%) | 131 (1.6%) |
| 3-Person Households | 1,151 (14.1%) | 19 (0.2%) |
| 4-Person Households | 796 (9.7%) | 0 (0.0%) |
| 5-Person Households | 331 (4.1%) | 0 (0.0%) |
| 6-Person Households | 131 (1.6%) | 0 (0.0%) |
| 7+ Person Households | 114 (1.4%) | 0 (0.0%) |
| Total | 5,330 (65.2%) | 2,842 (34.8%) |
Female Fertility in Union Parish
Fertility by Age in Union Parish
Average fertility rate in Union Parish is 59.0 births per 1,000 women. Women in the age bracket of 20 to 34 years have the highest fertility rate with 79.0 births per 1,000 women. Women in the age bracket of 20 to 34 years acount for 52.0% of all women with births.
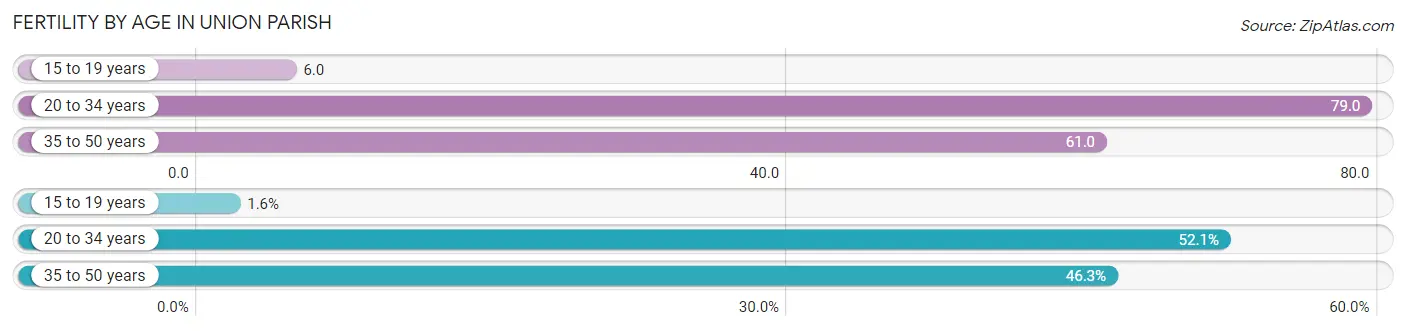
| Age Bracket | Women with Births | Births / 1,000 Women |
| 15 to 19 years | 4 (1.6%) | 6.0 |
| 20 to 34 years | 127 (52.0%) | 79.0 |
| 35 to 50 years | 113 (46.3%) | 61.0 |
| Total | 244 (100.0%) | 59.0 |
Fertility by Age by Marriage Status in Union Parish
74.2% of women with births (244) in Union Parish are married. The highest percentage of unmarried women with births falls into 15 to 19 years age bracket with 100.0% of them unmarried at the time of birth, while the lowest percentage of unmarried women with births belong to 35 to 50 years age bracket with 0.0% of them unmarried.
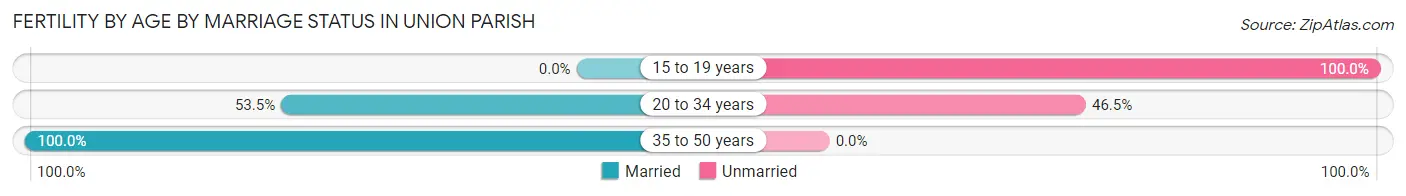
| Age Bracket | Married | Unmarried |
| 15 to 19 years | 0 (0.0%) | 4 (100.0%) |
| 20 to 34 years | 68 (53.5%) | 59 (46.5%) |
| 35 to 50 years | 113 (100.0%) | 0 (0.0%) |
| Total | 181 (74.2%) | 63 (25.8%) |
Fertility by Education in Union Parish
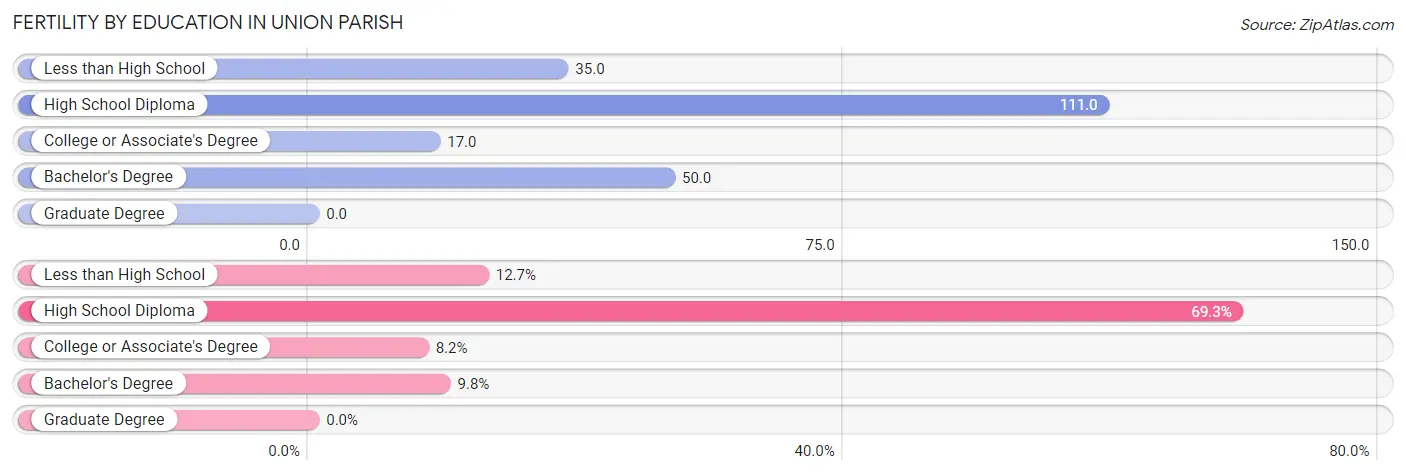
| Educational Attainment | Women with Births | Births / 1,000 Women |
| Less than High School | 31 (12.7%) | 35.0 |
| High School Diploma | 169 (69.3%) | 111.0 |
| College or Associate's Degree | 20 (8.2%) | 17.0 |
| Bachelor's Degree | 24 (9.8%) | 50.0 |
| Graduate Degree | 0 (0.0%) | 0.0 |
| Total | 244 (100.0%) | 59.0 |
Fertility by Education by Marriage Status in Union Parish
25.8% of women with births in Union Parish are unmarried. Women with the educational attainment of bachelor's degree are most likely to be married with 100.0% of them married at childbirth, while women with the educational attainment of less than high school are least likely to be married with 100.0% of them unmarried at childbirth.
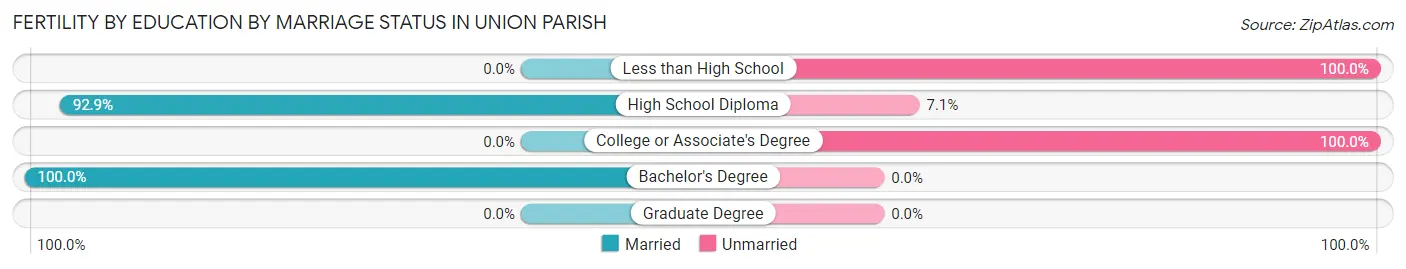
| Educational Attainment | Married | Unmarried |
| Less than High School | 0 (0.0%) | 31 (100.0%) |
| High School Diploma | 157 (92.9%) | 12 (7.1%) |
| College or Associate's Degree | 0 (0.0%) | 20 (100.0%) |
| Bachelor's Degree | 24 (100.0%) | 0 (0.0%) |
| Graduate Degree | 0 (0.0%) | 0 (0.0%) |
| Total | 181 (74.2%) | 63 (25.8%) |
Employment Characteristics in Union Parish
Employment by Class of Employer in Union Parish
Among the 7,984 employed individuals in Union Parish, private company employees (5,826 | 73.0%), self-employed (incorporated) (497 | 6.2%), and not-for-profit organizations (428 | 5.4%) make up the most common classes of employment.
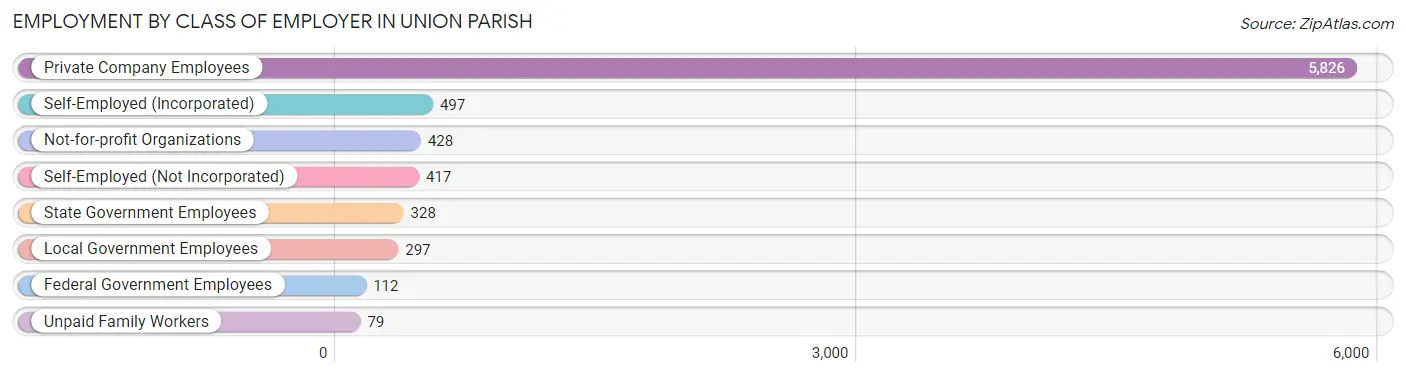
| Employer Class | # Employees | % Employees |
| Private Company Employees | 5,826 | 73.0% |
| Self-Employed (Incorporated) | 497 | 6.2% |
| Self-Employed (Not Incorporated) | 417 | 5.2% |
| Not-for-profit Organizations | 428 | 5.4% |
| Local Government Employees | 297 | 3.7% |
| State Government Employees | 328 | 4.1% |
| Federal Government Employees | 112 | 1.4% |
| Unpaid Family Workers | 79 | 1.0% |
| Total | 7,984 | 100.0% |
Employment Status by Age in Union Parish
According to the labor force statistics for Union Parish, out of the total population over 16 years of age (17,068), 49.7% or 8,483 individuals are in the labor force, with 5.4% or 458 of them unemployed. The age group with the highest labor force participation rate is 30 to 34 years, with 81.3% or 815 individuals in the labor force. Within the labor force, the 16 to 19 years age range has the highest percentage of unemployed individuals, with 33.2% or 126 of them being unemployed.
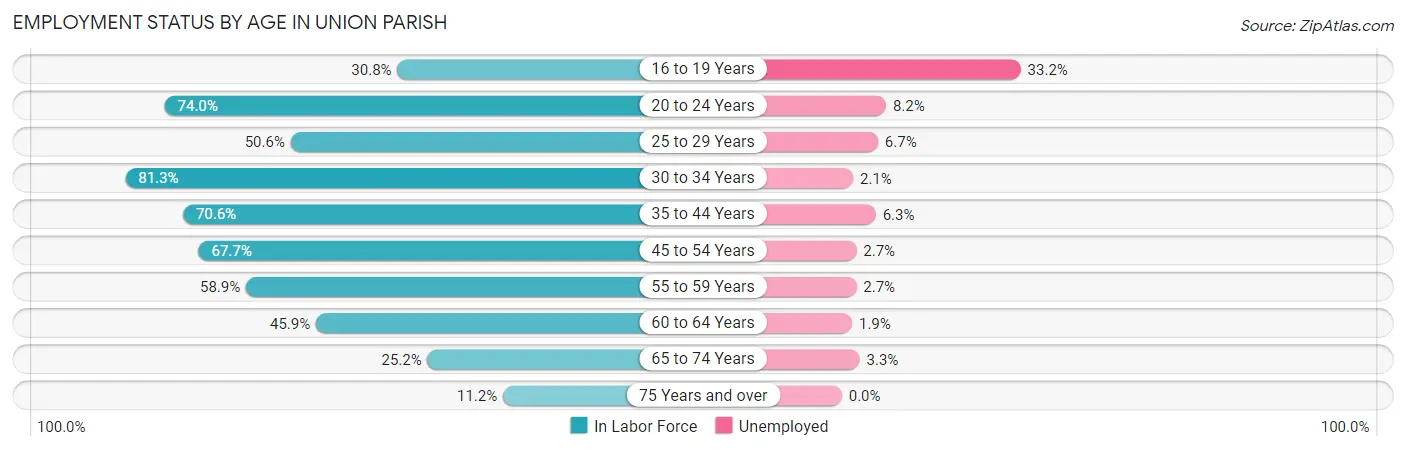
| Age Bracket | In Labor Force | Unemployed |
| 16 to 19 Years | 380 (30.8%) | 126 (33.2%) |
| 20 to 24 Years | 704 (74.0%) | 58 (8.2%) |
| 25 to 29 Years | 639 (50.6%) | 43 (6.7%) |
| 30 to 34 Years | 815 (81.3%) | 17 (2.1%) |
| 35 to 44 Years | 1,753 (70.6%) | 110 (6.3%) |
| 45 to 54 Years | 1,648 (67.7%) | 44 (2.7%) |
| 55 to 59 Years | 889 (58.9%) | 24 (2.7%) |
| 60 to 64 Years | 773 (45.9%) | 15 (1.9%) |
| 65 to 74 Years | 665 (25.2%) | 22 (3.3%) |
| 75 Years and over | 210 (11.2%) | 0 (0.0%) |
| Total | 8,483 (49.7%) | 458 (5.4%) |
Employment Status by Educational Attainment in Union Parish
According to labor force statistics for Union Parish, 62.8% of individuals (6,515) out of the total population between 25 and 64 years of age (10,374) are in the labor force, with 3.9% or 254 of them being unemployed. The group with the highest labor force participation rate are those with the educational attainment of bachelor's degree or higher, with 75.9% or 1,425 individuals in the labor force. Within the labor force, individuals with high school diploma education have the highest percentage of unemployment, with 4.9% or 124 of them being unemployed.
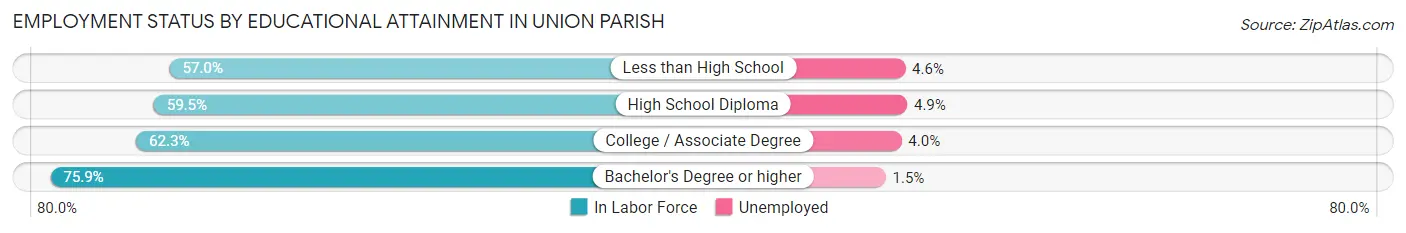
| Educational Attainment | In Labor Force | Unemployed |
| Less than High School | 882 (57.0%) | 71 (4.6%) |
| High School Diploma | 2,531 (59.5%) | 208 (4.9%) |
| College / Associate Degree | 1,680 (62.3%) | 108 (4.0%) |
| Bachelor's Degree or higher | 1,425 (75.9%) | 28 (1.5%) |
| Total | 6,515 (62.8%) | 405 (3.9%) |
Employment Occupations by Sex in Union Parish
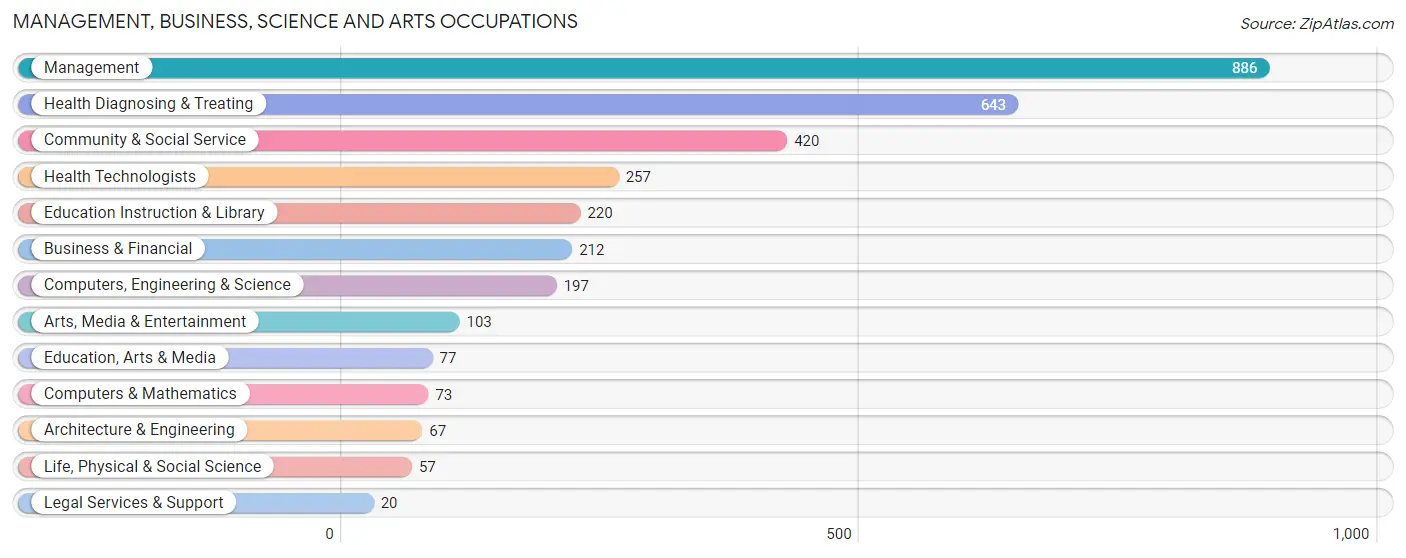
Management, Business, Science and Arts Occupations
The most common Management, Business, Science and Arts occupations in Union Parish are Management (886 | 11.1%), Health Diagnosing & Treating (643 | 8.0%), Community & Social Service (420 | 5.2%), Health Technologists (257 | 3.2%), and Education Instruction & Library (220 | 2.7%).
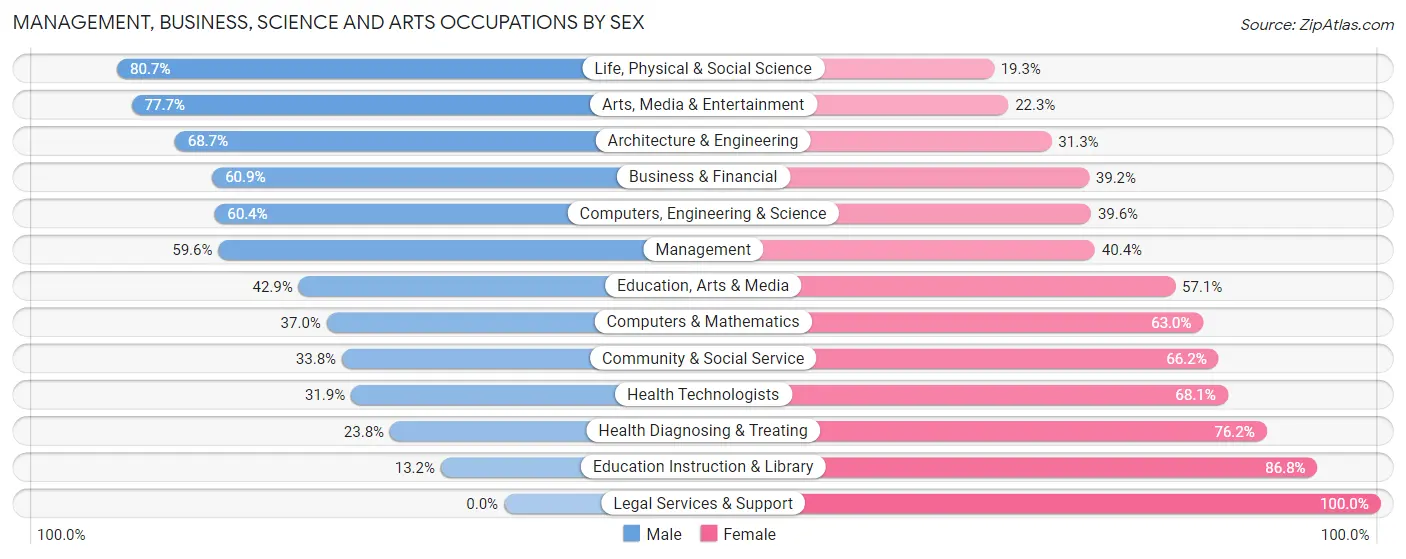
Management, Business, Science and Arts Occupations by Sex
Within the Management, Business, Science and Arts occupations in Union Parish, the most male-oriented occupations are Life, Physical & Social Science (80.7%), Arts, Media & Entertainment (77.7%), and Architecture & Engineering (68.7%), while the most female-oriented occupations are Legal Services & Support (100.0%), Education Instruction & Library (86.8%), and Health Diagnosing & Treating (76.2%).
| Occupation | Male | Female |
| Management | 528 (59.6%) | 358 (40.4%) |
| Business & Financial | 129 (60.9%) | 83 (39.2%) |
| Computers, Engineering & Science | 119 (60.4%) | 78 (39.6%) |
| Computers & Mathematics | 27 (37.0%) | 46 (63.0%) |
| Architecture & Engineering | 46 (68.7%) | 21 (31.3%) |
| Life, Physical & Social Science | 46 (80.7%) | 11 (19.3%) |
| Community & Social Service | 142 (33.8%) | 278 (66.2%) |
| Education, Arts & Media | 33 (42.9%) | 44 (57.1%) |
| Legal Services & Support | 0 (0.0%) | 20 (100.0%) |
| Education Instruction & Library | 29 (13.2%) | 191 (86.8%) |
| Arts, Media & Entertainment | 80 (77.7%) | 23 (22.3%) |
| Health Diagnosing & Treating | 153 (23.8%) | 490 (76.2%) |
| Health Technologists | 82 (31.9%) | 175 (68.1%) |
| Total (Category) | 1,071 (45.4%) | 1,287 (54.6%) |
| Total (Overall) | 4,274 (53.3%) | 3,742 (46.7%) |
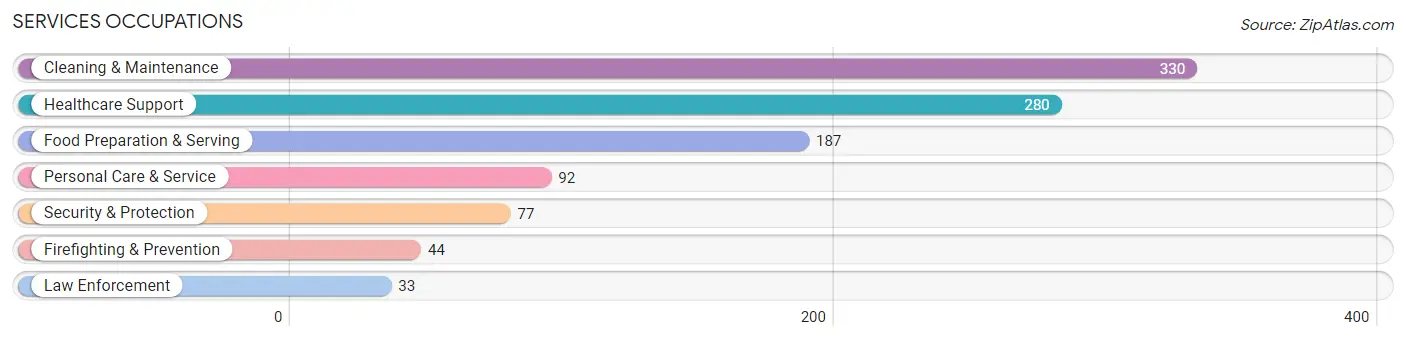
Services Occupations
The most common Services occupations in Union Parish are Cleaning & Maintenance (330 | 4.1%), Healthcare Support (280 | 3.5%), Food Preparation & Serving (187 | 2.3%), Personal Care & Service (92 | 1.1%), and Security & Protection (77 | 1.0%).
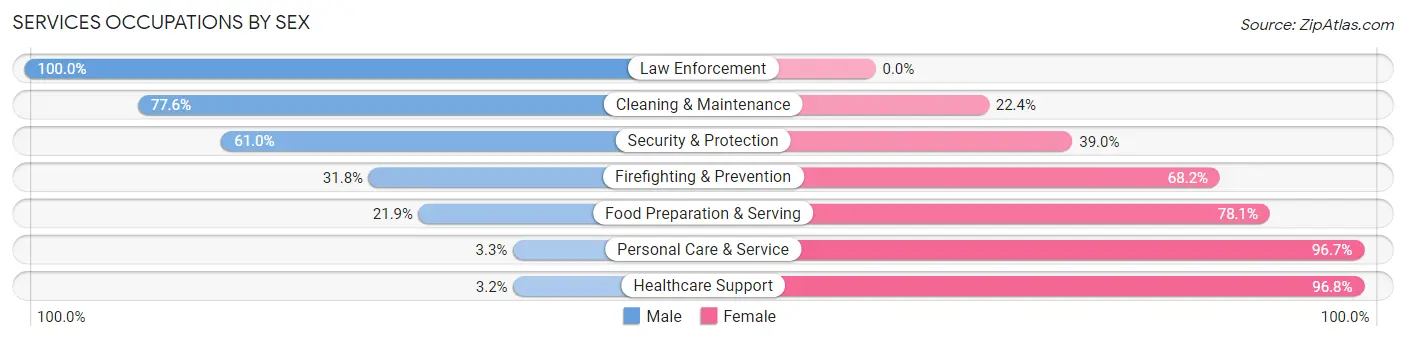
Services Occupations by Sex
Within the Services occupations in Union Parish, the most male-oriented occupations are Law Enforcement (100.0%), Cleaning & Maintenance (77.6%), and Security & Protection (61.0%), while the most female-oriented occupations are Healthcare Support (96.8%), Personal Care & Service (96.7%), and Food Preparation & Serving (78.1%).
| Occupation | Male | Female |
| Healthcare Support | 9 (3.2%) | 271 (96.8%) |
| Security & Protection | 47 (61.0%) | 30 (39.0%) |
| Firefighting & Prevention | 14 (31.8%) | 30 (68.2%) |
| Law Enforcement | 33 (100.0%) | 0 (0.0%) |
| Food Preparation & Serving | 41 (21.9%) | 146 (78.1%) |
| Cleaning & Maintenance | 256 (77.6%) | 74 (22.4%) |
| Personal Care & Service | 3 (3.3%) | 89 (96.7%) |
| Total (Category) | 356 (36.8%) | 610 (63.1%) |
| Total (Overall) | 4,274 (53.3%) | 3,742 (46.7%) |
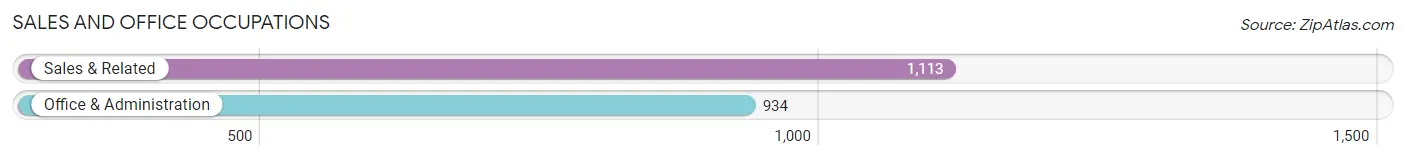
Sales and Office Occupations
The most common Sales and Office occupations in Union Parish are Sales & Related (1,113 | 13.9%), and Office & Administration (934 | 11.7%).
Sales and Office Occupations by Sex
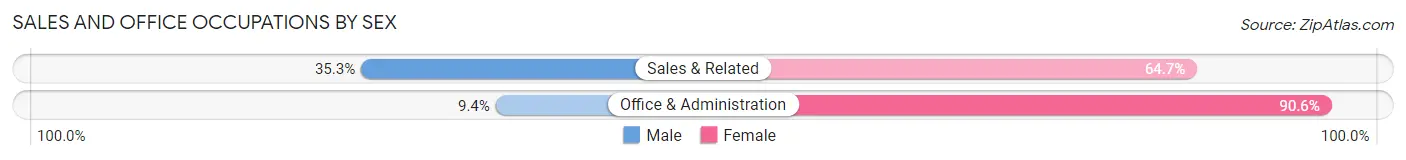
| Occupation | Male | Female |
| Sales & Related | 393 (35.3%) | 720 (64.7%) |
| Office & Administration | 88 (9.4%) | 846 (90.6%) |
| Total (Category) | 481 (23.5%) | 1,566 (76.5%) |
| Total (Overall) | 4,274 (53.3%) | 3,742 (46.7%) |
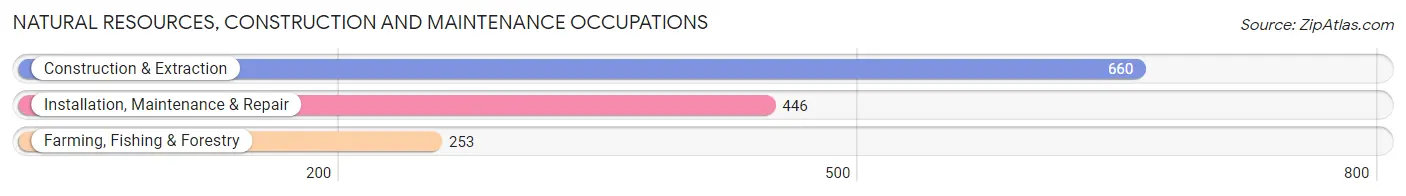
Natural Resources, Construction and Maintenance Occupations
The most common Natural Resources, Construction and Maintenance occupations in Union Parish are Construction & Extraction (660 | 8.2%), Installation, Maintenance & Repair (446 | 5.6%), and Farming, Fishing & Forestry (253 | 3.2%).
Natural Resources, Construction and Maintenance Occupations by Sex
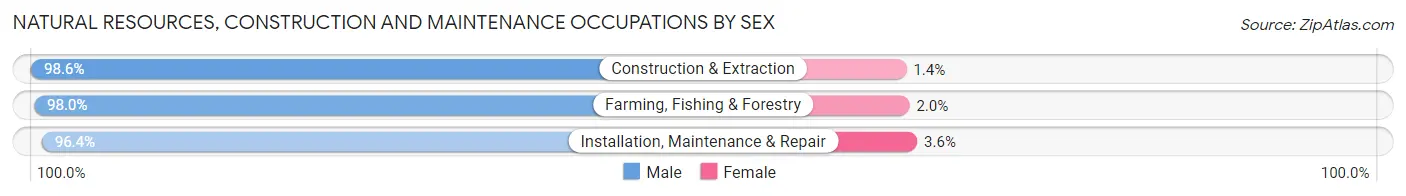
| Occupation | Male | Female |
| Farming, Fishing & Forestry | 248 (98.0%) | 5 (2.0%) |
| Construction & Extraction | 651 (98.6%) | 9 (1.4%) |
| Installation, Maintenance & Repair | 430 (96.4%) | 16 (3.6%) |
| Total (Category) | 1,329 (97.8%) | 30 (2.2%) |
| Total (Overall) | 4,274 (53.3%) | 3,742 (46.7%) |
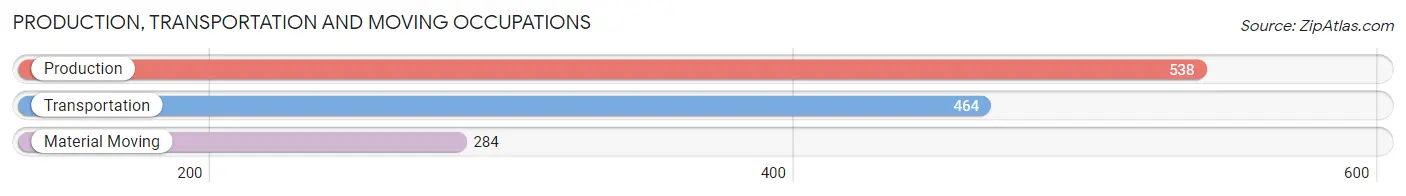
Production, Transportation and Moving Occupations
The most common Production, Transportation and Moving occupations in Union Parish are Production (538 | 6.7%), Transportation (464 | 5.8%), and Material Moving (284 | 3.5%).
Production, Transportation and Moving Occupations by Sex
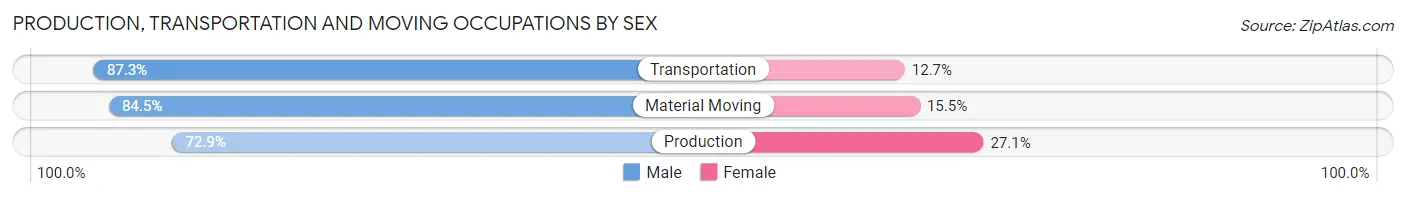
| Occupation | Male | Female |
| Production | 392 (72.9%) | 146 (27.1%) |
| Transportation | 405 (87.3%) | 59 (12.7%) |
| Material Moving | 240 (84.5%) | 44 (15.5%) |
| Total (Category) | 1,037 (80.6%) | 249 (19.4%) |
| Total (Overall) | 4,274 (53.3%) | 3,742 (46.7%) |
Employment Industries by Sex in Union Parish
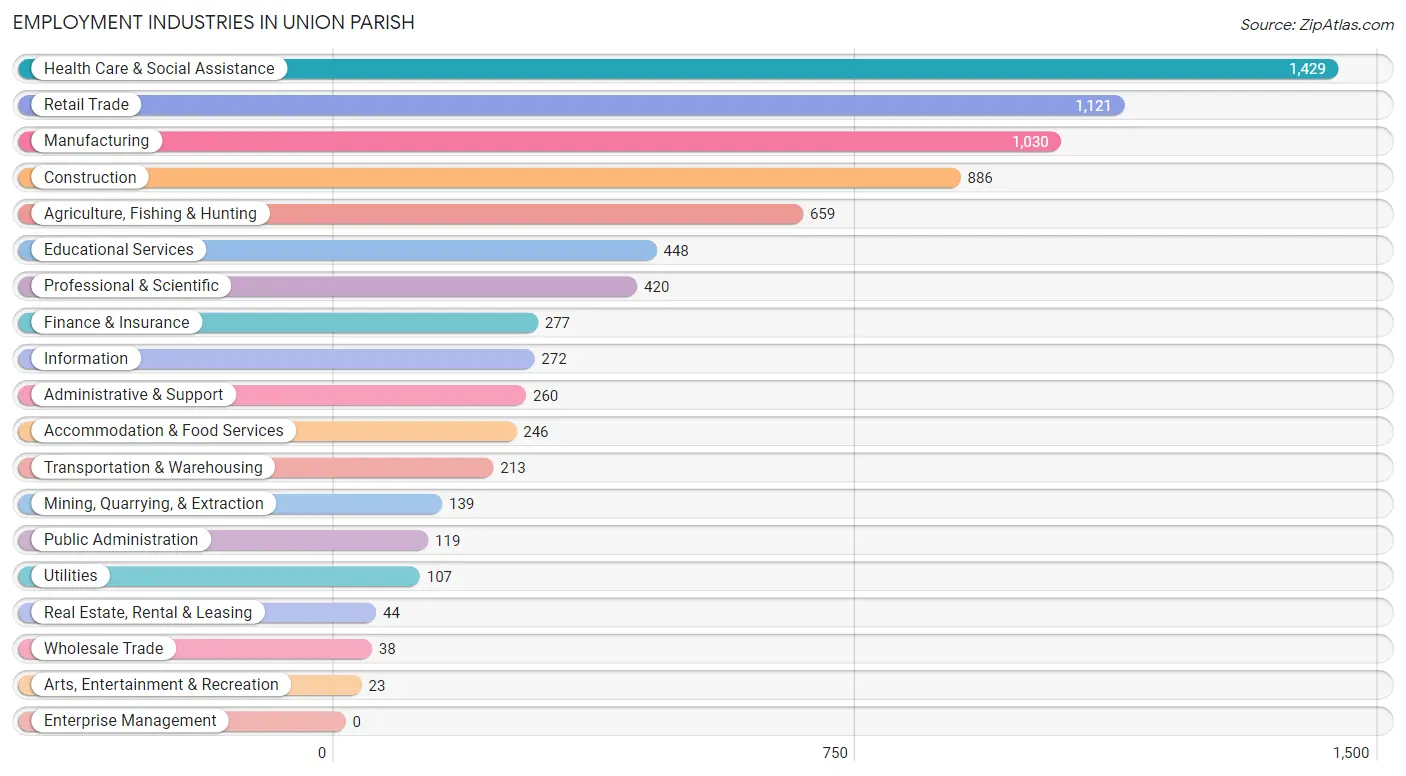
Employment Industries in Union Parish
The major employment industries in Union Parish include Health Care & Social Assistance (1,429 | 17.8%), Retail Trade (1,121 | 14.0%), Manufacturing (1,030 | 12.9%), Construction (886 | 11.1%), and Agriculture, Fishing & Hunting (659 | 8.2%).
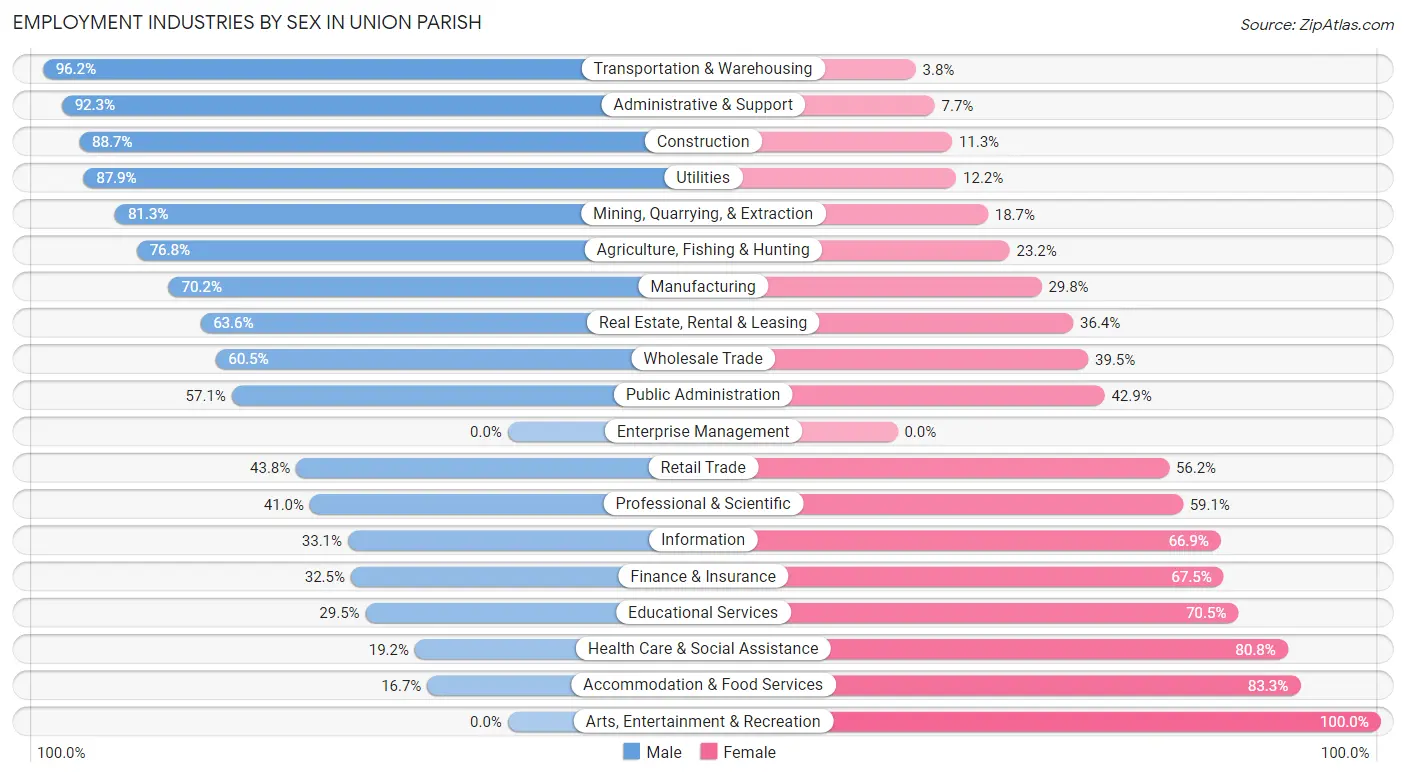
Employment Industries by Sex in Union Parish
The Union Parish industries that see more men than women are Transportation & Warehousing (96.2%), Administrative & Support (92.3%), and Construction (88.7%), whereas the industries that tend to have a higher number of women are Arts, Entertainment & Recreation (100.0%), Accommodation & Food Services (83.3%), and Health Care & Social Assistance (80.8%).
| Industry | Male | Female |
| Agriculture, Fishing & Hunting | 506 (76.8%) | 153 (23.2%) |
| Mining, Quarrying, & Extraction | 113 (81.3%) | 26 (18.7%) |
| Construction | 786 (88.7%) | 100 (11.3%) |
| Manufacturing | 723 (70.2%) | 307 (29.8%) |
| Wholesale Trade | 23 (60.5%) | 15 (39.5%) |
| Retail Trade | 491 (43.8%) | 630 (56.2%) |
| Transportation & Warehousing | 205 (96.2%) | 8 (3.8%) |
| Utilities | 94 (87.8%) | 13 (12.1%) |
| Information | 90 (33.1%) | 182 (66.9%) |
| Finance & Insurance | 90 (32.5%) | 187 (67.5%) |
| Real Estate, Rental & Leasing | 28 (63.6%) | 16 (36.4%) |
| Professional & Scientific | 172 (40.9%) | 248 (59.1%) |
| Enterprise Management | 0 (0.0%) | 0 (0.0%) |
| Administrative & Support | 240 (92.3%) | 20 (7.7%) |
| Educational Services | 132 (29.5%) | 316 (70.5%) |
| Health Care & Social Assistance | 275 (19.2%) | 1,154 (80.8%) |
| Arts, Entertainment & Recreation | 0 (0.0%) | 23 (100.0%) |
| Accommodation & Food Services | 41 (16.7%) | 205 (83.3%) |
| Public Administration | 68 (57.1%) | 51 (42.9%) |
| Total | 4,274 (53.3%) | 3,742 (46.7%) |
Education in Union Parish
School Enrollment in Union Parish
The most common levels of schooling among the 4,210 students in Union Parish are high school (1,183 | 28.1%), middle school (1,140 | 27.1%), and elementary school (755 | 17.9%).
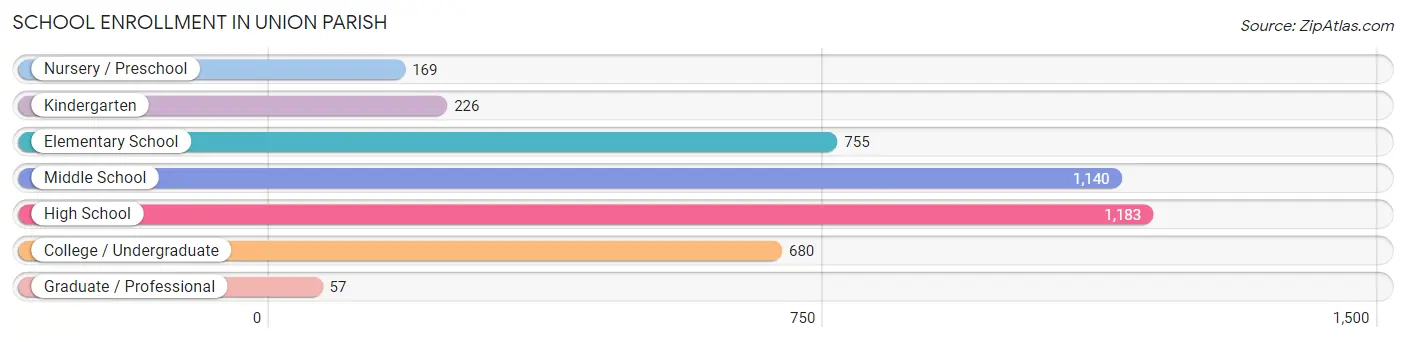
| School Level | # Students | % Students |
| Nursery / Preschool | 169 | 4.0% |
| Kindergarten | 226 | 5.4% |
| Elementary School | 755 | 17.9% |
| Middle School | 1,140 | 27.1% |
| High School | 1,183 | 28.1% |
| College / Undergraduate | 680 | 16.2% |
| Graduate / Professional | 57 | 1.3% |
| Total | 4,210 | 100.0% |
School Enrollment by Age by Funding Source in Union Parish
Out of a total of 4,210 students who are enrolled in schools in Union Parish, 467 (11.1%) attend a private institution, while the remaining 3,743 (88.9%) are enrolled in public schools. The age group of 35 years and over has the highest likelihood of being enrolled in private schools, with 93 (43.7% in the age bracket) enrolled. Conversely, the age group of 25 to 34 year olds has the lowest likelihood of being enrolled in a private school, with 112 (100.0% in the age bracket) attending a public institution.
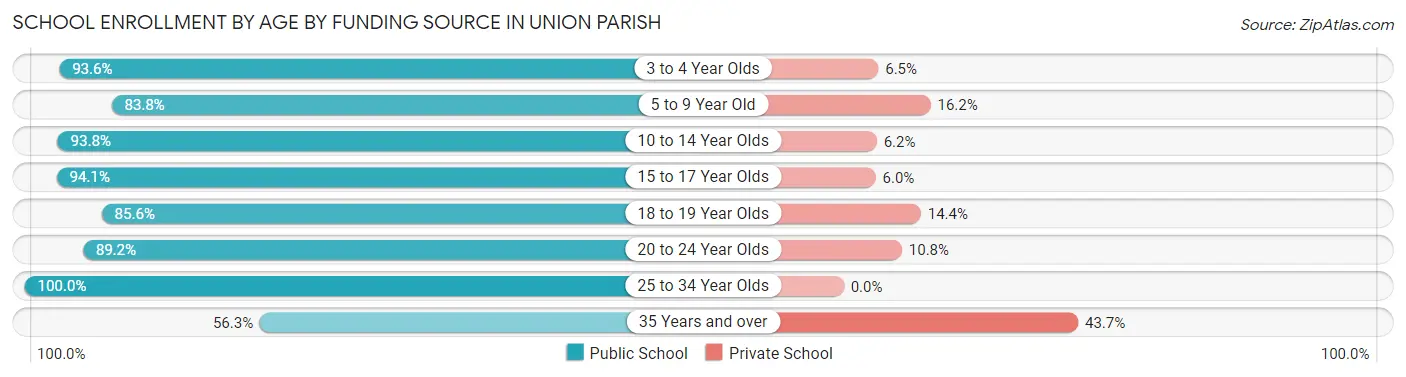
| Age Bracket | Public School | Private School |
| 3 to 4 Year Olds | 145 (93.5%) | 10 (6.5%) |
| 5 to 9 Year Old | 777 (83.8%) | 150 (16.2%) |
| 10 to 14 Year Olds | 1,250 (93.8%) | 82 (6.2%) |
| 15 to 17 Year Olds | 774 (94.1%) | 49 (5.9%) |
| 18 to 19 Year Olds | 310 (85.6%) | 52 (14.4%) |
| 20 to 24 Year Olds | 255 (89.2%) | 31 (10.8%) |
| 25 to 34 Year Olds | 112 (100.0%) | 0 (0.0%) |
| 35 Years and over | 120 (56.3%) | 93 (43.7%) |
| Total | 3,743 (88.9%) | 467 (11.1%) |
Educational Attainment by Field of Study in Union Parish
Education (518 | 19.3%), business (483 | 18.0%), science & technology (331 | 12.3%), bio, nature & agricultural (292 | 10.9%), and arts & humanities (238 | 8.8%) are the most common fields of study among 2,688 individuals in Union Parish who have obtained a bachelor's degree or higher.
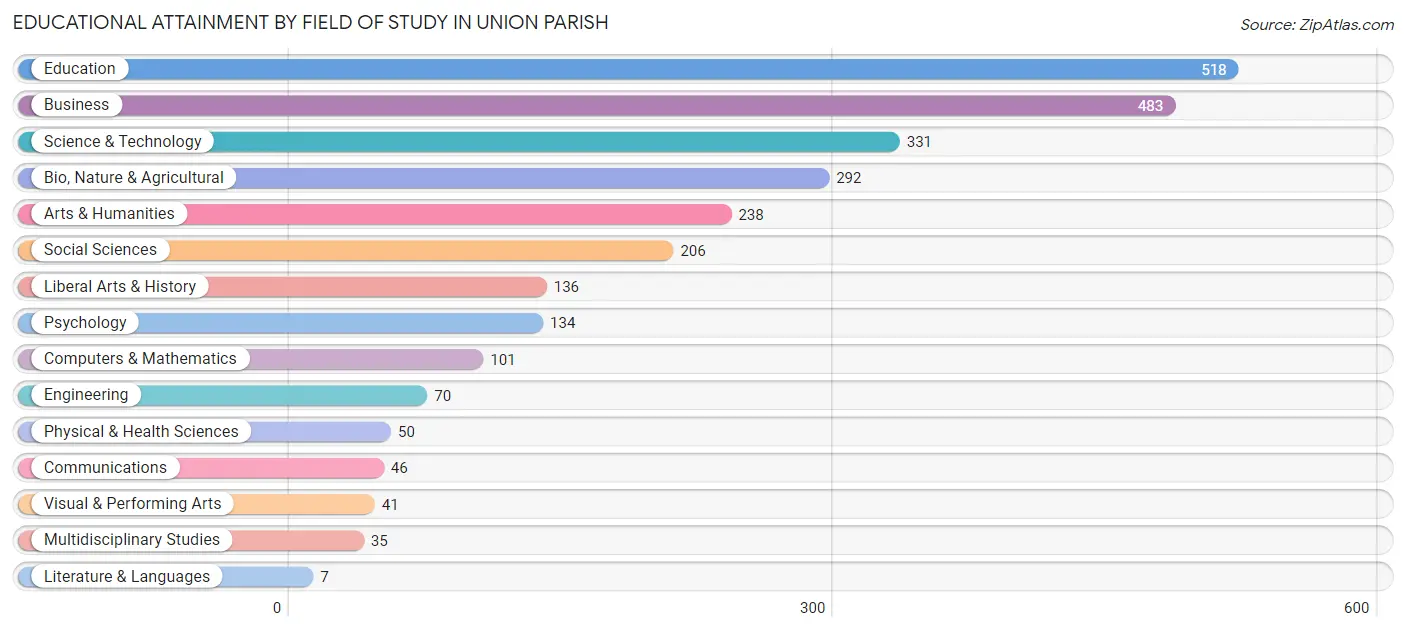
| Field of Study | # Graduates | % Graduates |
| Computers & Mathematics | 101 | 3.8% |
| Bio, Nature & Agricultural | 292 | 10.9% |
| Physical & Health Sciences | 50 | 1.9% |
| Psychology | 134 | 5.0% |
| Social Sciences | 206 | 7.7% |
| Engineering | 70 | 2.6% |
| Multidisciplinary Studies | 35 | 1.3% |
| Science & Technology | 331 | 12.3% |
| Business | 483 | 18.0% |
| Education | 518 | 19.3% |
| Literature & Languages | 7 | 0.3% |
| Liberal Arts & History | 136 | 5.1% |
| Visual & Performing Arts | 41 | 1.5% |
| Communications | 46 | 1.7% |
| Arts & Humanities | 238 | 8.8% |
| Total | 2,688 | 100.0% |
Transportation & Commute in Union Parish
Vehicle Availability by Sex in Union Parish
The most prevalent vehicle ownership categories in Union Parish are males with 2 vehicles (1,644, accounting for 38.7%) and females with 2 vehicles (1,583, making up 44.0%).
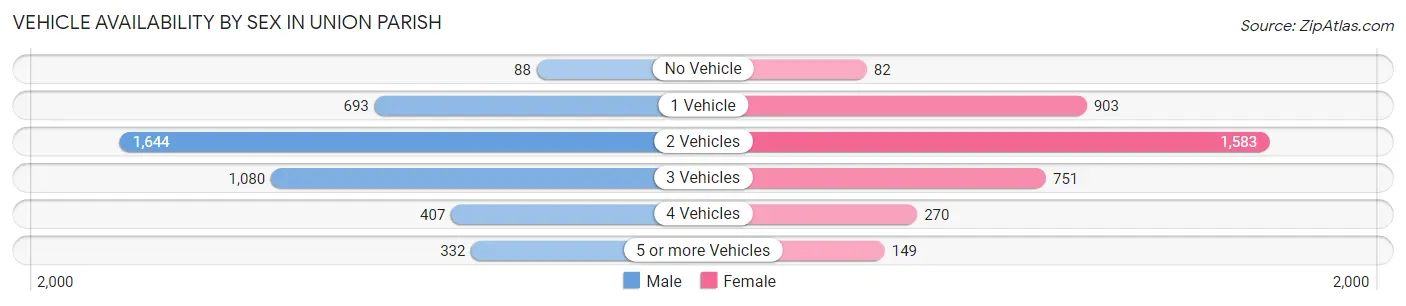
| Vehicles Available | Male | Female |
| No Vehicle | 88 (2.1%) | 82 (2.2%) |
| 1 Vehicle | 693 (16.3%) | 903 (24.2%) |
| 2 Vehicles | 1,644 (38.7%) | 1,583 (42.3%) |
| 3 Vehicles | 1,080 (25.5%) | 751 (20.1%) |
| 4 Vehicles | 407 (9.6%) | 270 (7.2%) |
| 5 or more Vehicles | 332 (7.8%) | 149 (4.0%) |
| Total | 4,244 (100.0%) | 3,738 (100.0%) |
Commute Time in Union Parish
The most frequently occuring commute durations in Union Parish are 30 to 34 minutes (1,525 commuters, 19.7%), 45 to 59 minutes (948 commuters, 12.2%), and 25 to 29 minutes (843 commuters, 10.9%).
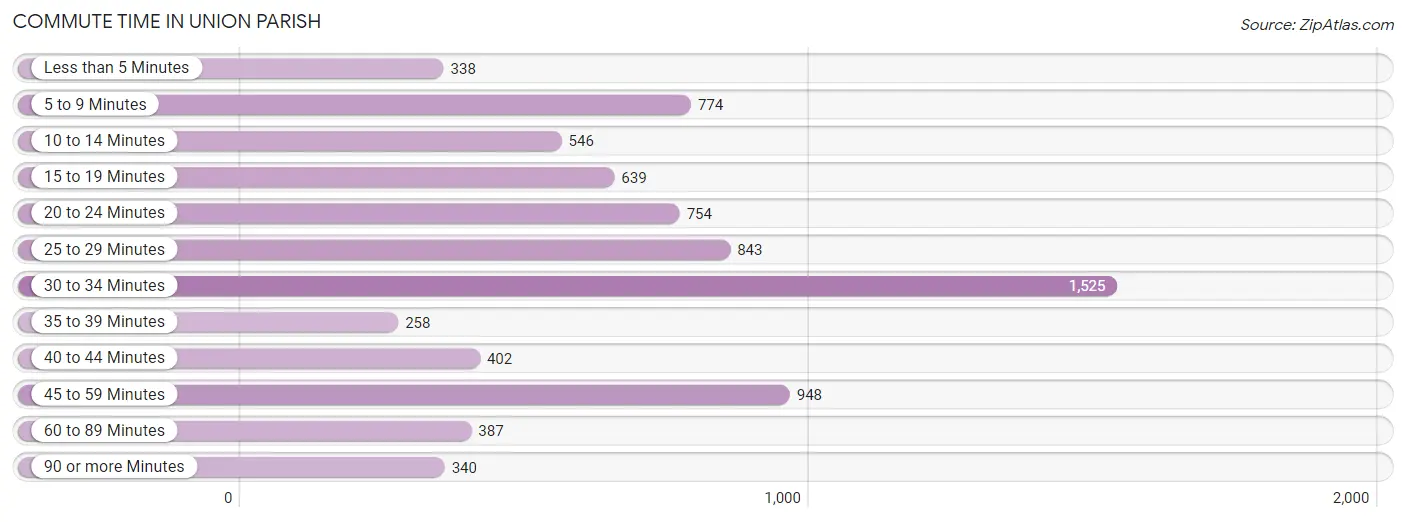
| Commute Time | # Commuters | % Commuters |
| Less than 5 Minutes | 338 | 4.4% |
| 5 to 9 Minutes | 774 | 10.0% |
| 10 to 14 Minutes | 546 | 7.0% |
| 15 to 19 Minutes | 639 | 8.2% |
| 20 to 24 Minutes | 754 | 9.7% |
| 25 to 29 Minutes | 843 | 10.9% |
| 30 to 34 Minutes | 1,525 | 19.7% |
| 35 to 39 Minutes | 258 | 3.3% |
| 40 to 44 Minutes | 402 | 5.2% |
| 45 to 59 Minutes | 948 | 12.2% |
| 60 to 89 Minutes | 387 | 5.0% |
| 90 or more Minutes | 340 | 4.4% |
Commute Time by Sex in Union Parish
The most common commute times in Union Parish are 30 to 34 minutes (723 commuters, 17.4%) for males and 30 to 34 minutes (802 commuters, 22.3%) for females.
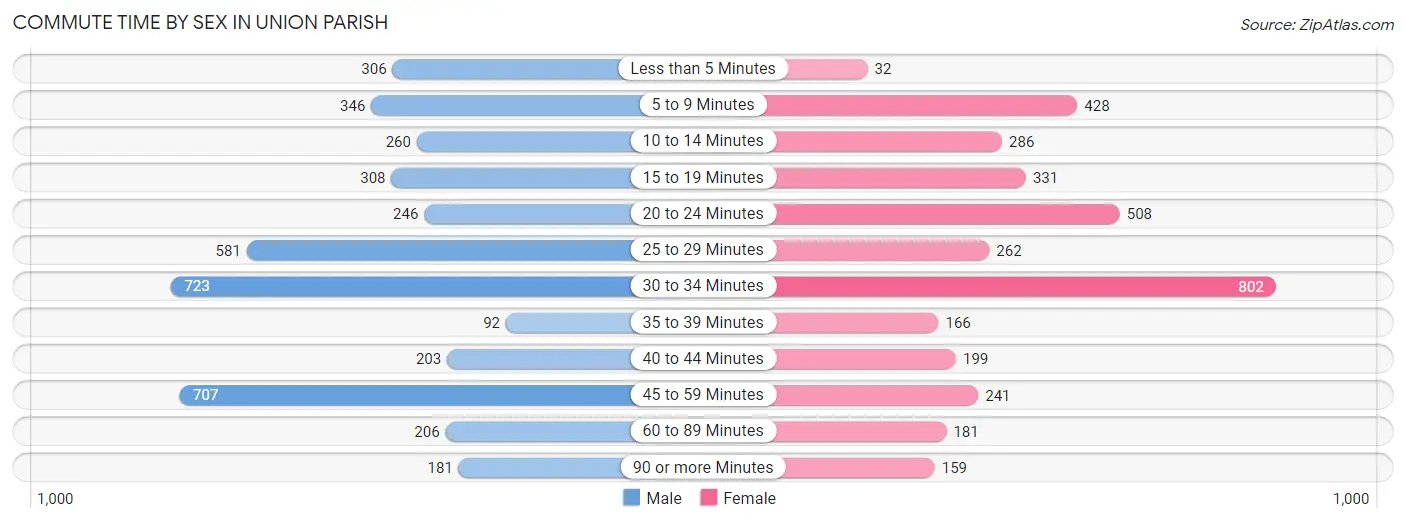
| Commute Time | Male | Female |
| Less than 5 Minutes | 306 (7.4%) | 32 (0.9%) |
| 5 to 9 Minutes | 346 (8.3%) | 428 (11.9%) |
| 10 to 14 Minutes | 260 (6.2%) | 286 (8.0%) |
| 15 to 19 Minutes | 308 (7.4%) | 331 (9.2%) |
| 20 to 24 Minutes | 246 (5.9%) | 508 (14.1%) |
| 25 to 29 Minutes | 581 (14.0%) | 262 (7.3%) |
| 30 to 34 Minutes | 723 (17.4%) | 802 (22.3%) |
| 35 to 39 Minutes | 92 (2.2%) | 166 (4.6%) |
| 40 to 44 Minutes | 203 (4.9%) | 199 (5.5%) |
| 45 to 59 Minutes | 707 (17.0%) | 241 (6.7%) |
| 60 to 89 Minutes | 206 (5.0%) | 181 (5.0%) |
| 90 or more Minutes | 181 (4.3%) | 159 (4.4%) |
Time of Departure to Work by Sex in Union Parish
The most frequent times of departure to work in Union Parish are 7:00 AM to 7:29 AM (693, 16.7%) for males and 7:00 AM to 7:29 AM (689, 19.2%) for females.
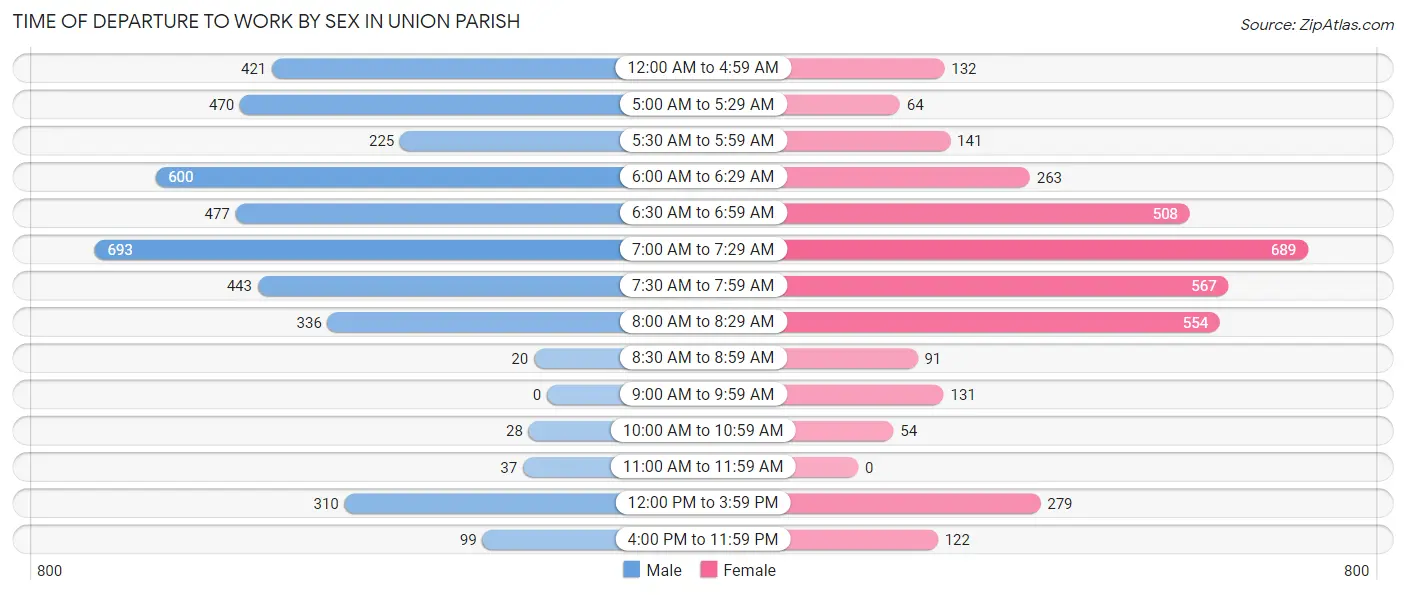
| Time of Departure | Male | Female |
| 12:00 AM to 4:59 AM | 421 (10.1%) | 132 (3.7%) |
| 5:00 AM to 5:29 AM | 470 (11.3%) | 64 (1.8%) |
| 5:30 AM to 5:59 AM | 225 (5.4%) | 141 (3.9%) |
| 6:00 AM to 6:29 AM | 600 (14.4%) | 263 (7.3%) |
| 6:30 AM to 6:59 AM | 477 (11.5%) | 508 (14.1%) |
| 7:00 AM to 7:29 AM | 693 (16.7%) | 689 (19.2%) |
| 7:30 AM to 7:59 AM | 443 (10.6%) | 567 (15.8%) |
| 8:00 AM to 8:29 AM | 336 (8.1%) | 554 (15.4%) |
| 8:30 AM to 8:59 AM | 20 (0.5%) | 91 (2.5%) |
| 9:00 AM to 9:59 AM | 0 (0.0%) | 131 (3.6%) |
| 10:00 AM to 10:59 AM | 28 (0.7%) | 54 (1.5%) |
| 11:00 AM to 11:59 AM | 37 (0.9%) | 0 (0.0%) |
| 12:00 PM to 3:59 PM | 310 (7.4%) | 279 (7.8%) |
| 4:00 PM to 11:59 PM | 99 (2.4%) | 122 (3.4%) |
| Total | 4,159 (100.0%) | 3,595 (100.0%) |
Housing Occupancy in Union Parish
Occupancy by Ownership in Union Parish
Of the total 8,172 dwellings in Union Parish, owner-occupied units account for 6,327 (77.4%), while renter-occupied units make up 1,845 (22.6%).
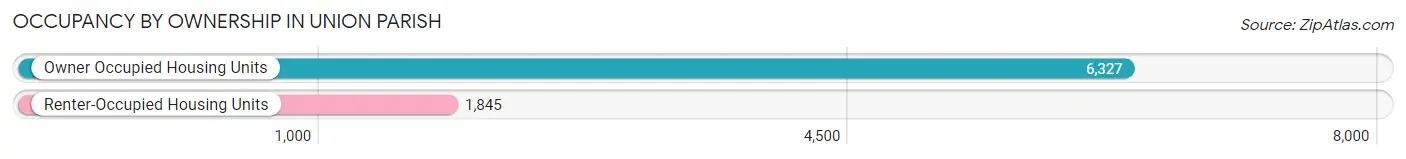
| Occupancy | # Housing Units | % Housing Units |
| Owner Occupied Housing Units | 6,327 | 77.4% |
| Renter-Occupied Housing Units | 1,845 | 22.6% |
| Total Occupied Housing Units | 8,172 | 100.0% |
Occupancy by Household Size in Union Parish
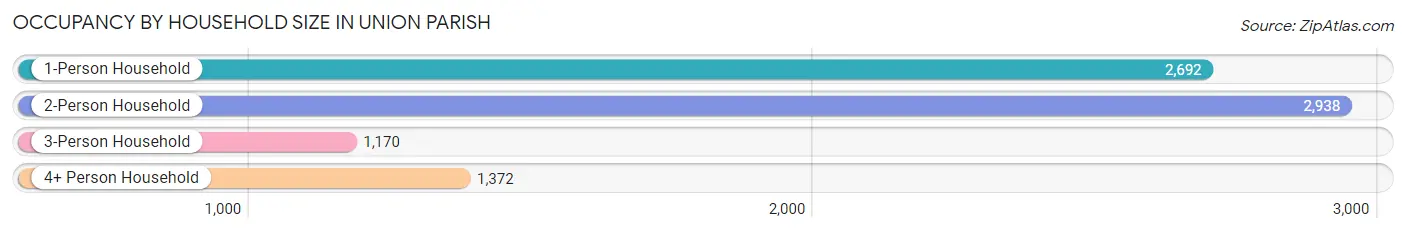
| Household Size | # Housing Units | % Housing Units |
| 1-Person Household | 2,692 | 32.9% |
| 2-Person Household | 2,938 | 35.9% |
| 3-Person Household | 1,170 | 14.3% |
| 4+ Person Household | 1,372 | 16.8% |
| Total Housing Units | 8,172 | 100.0% |
Occupancy by Ownership by Household Size in Union Parish
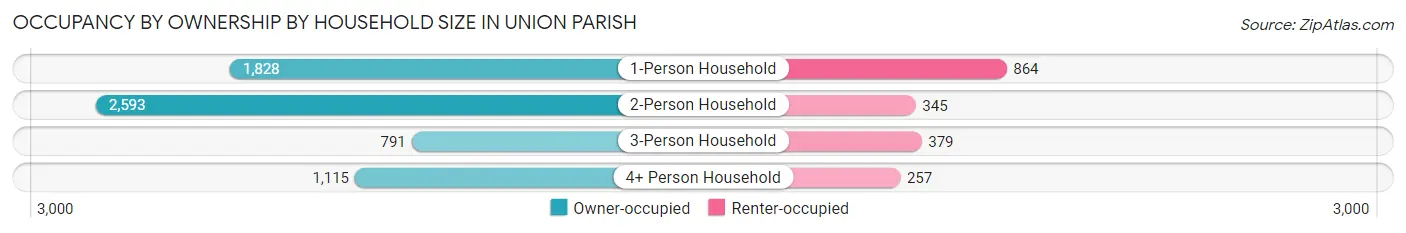
| Household Size | Owner-occupied | Renter-occupied |
| 1-Person Household | 1,828 (67.9%) | 864 (32.1%) |
| 2-Person Household | 2,593 (88.3%) | 345 (11.7%) |
| 3-Person Household | 791 (67.6%) | 379 (32.4%) |
| 4+ Person Household | 1,115 (81.3%) | 257 (18.7%) |
| Total Housing Units | 6,327 (77.4%) | 1,845 (22.6%) |
Occupancy by Educational Attainment in Union Parish
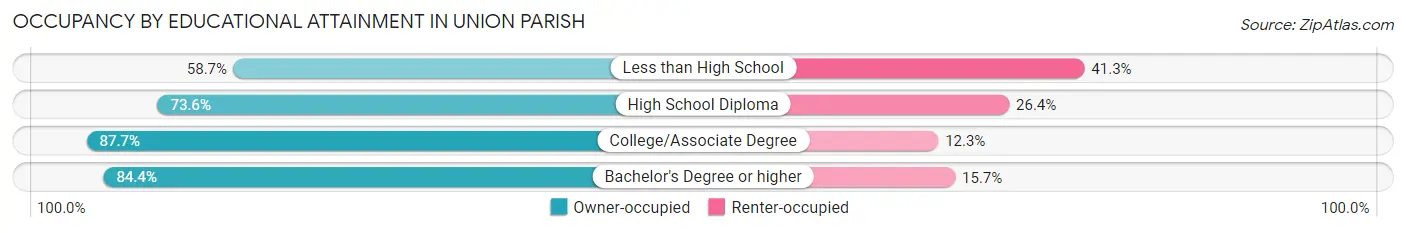
| Household Size | Owner-occupied | Renter-occupied |
| Less than High School | 657 (58.7%) | 462 (41.3%) |
| High School Diploma | 2,475 (73.6%) | 886 (26.4%) |
| College/Associate Degree | 2,117 (87.7%) | 297 (12.3%) |
| Bachelor's Degree or higher | 1,078 (84.4%) | 200 (15.7%) |
Occupancy by Age of Householder in Union Parish
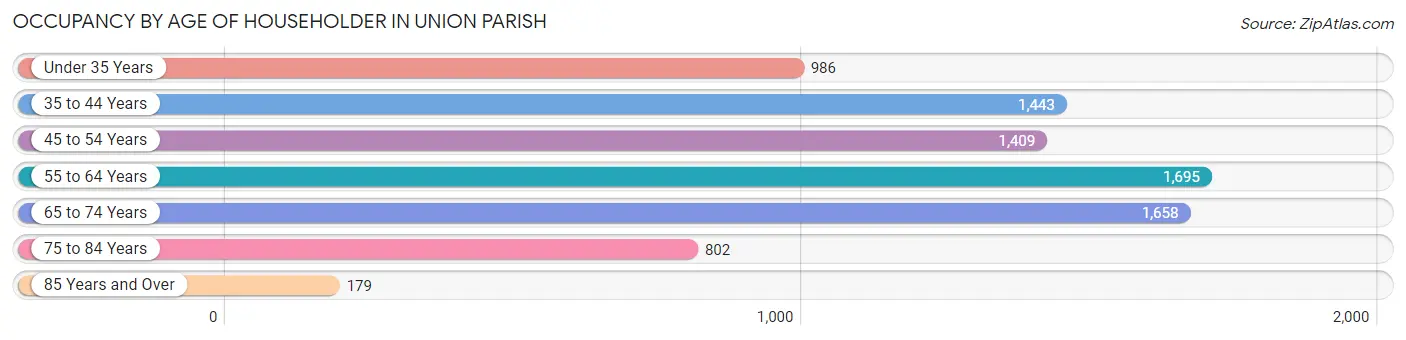
| Age Bracket | # Households | % Households |
| Under 35 Years | 986 | 12.1% |
| 35 to 44 Years | 1,443 | 17.7% |
| 45 to 54 Years | 1,409 | 17.2% |
| 55 to 64 Years | 1,695 | 20.7% |
| 65 to 74 Years | 1,658 | 20.3% |
| 75 to 84 Years | 802 | 9.8% |
| 85 Years and Over | 179 | 2.2% |
| Total | 8,172 | 100.0% |
Housing Finances in Union Parish
Median Income by Occupancy in Union Parish
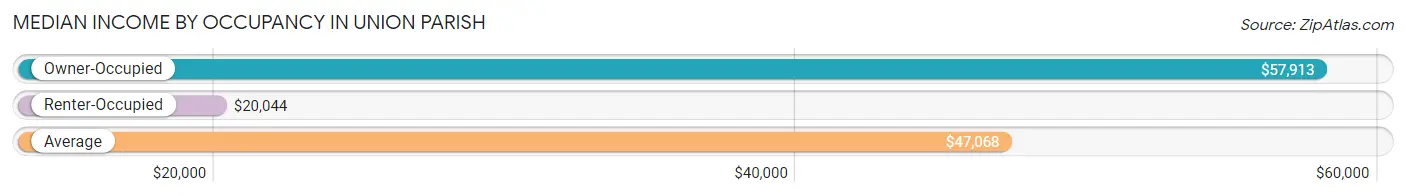
| Occupancy Type | # Households | Median Income |
| Owner-Occupied | 6,327 (77.4%) | $57,913 |
| Renter-Occupied | 1,845 (22.6%) | $20,044 |
| Average | 8,172 (100.0%) | $47,068 |
Occupancy by Householder Income Bracket in Union Parish
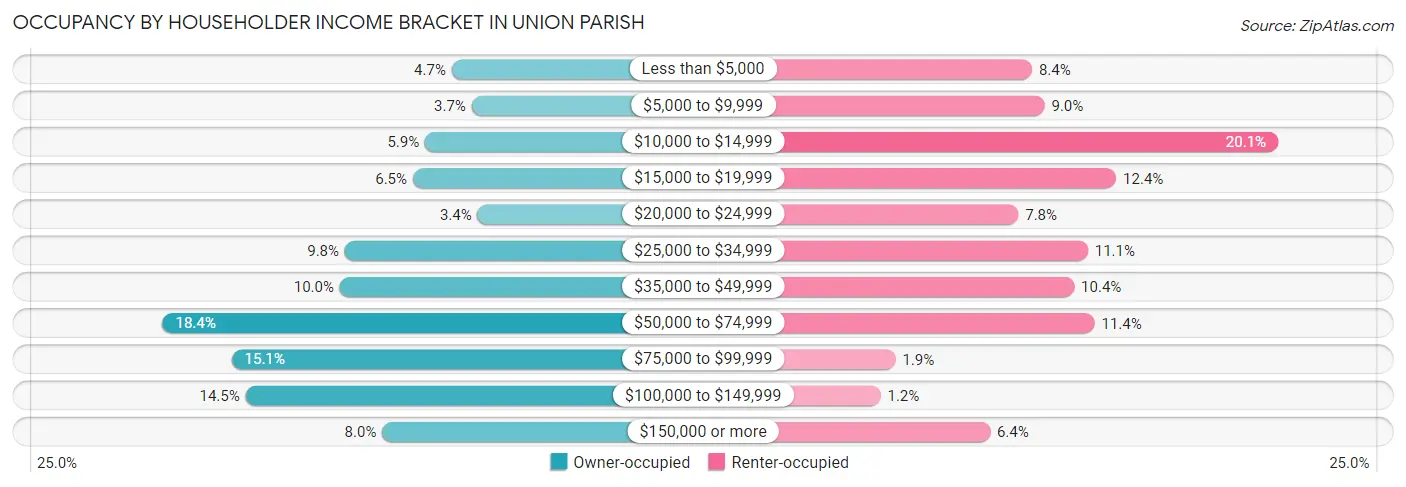
| Income Bracket | Owner-occupied | Renter-occupied |
| Less than $5,000 | 295 (4.7%) | 155 (8.4%) |
| $5,000 to $9,999 | 235 (3.7%) | 166 (9.0%) |
| $10,000 to $14,999 | 375 (5.9%) | 371 (20.1%) |
| $15,000 to $19,999 | 412 (6.5%) | 229 (12.4%) |
| $20,000 to $24,999 | 217 (3.4%) | 143 (7.7%) |
| $25,000 to $34,999 | 617 (9.8%) | 204 (11.1%) |
| $35,000 to $49,999 | 632 (10.0%) | 192 (10.4%) |
| $50,000 to $74,999 | 1,166 (18.4%) | 210 (11.4%) |
| $75,000 to $99,999 | 958 (15.1%) | 35 (1.9%) |
| $100,000 to $149,999 | 916 (14.5%) | 22 (1.2%) |
| $150,000 or more | 504 (8.0%) | 118 (6.4%) |
| Total | 6,327 (100.0%) | 1,845 (100.0%) |
Monthly Housing Cost Tiers in Union Parish
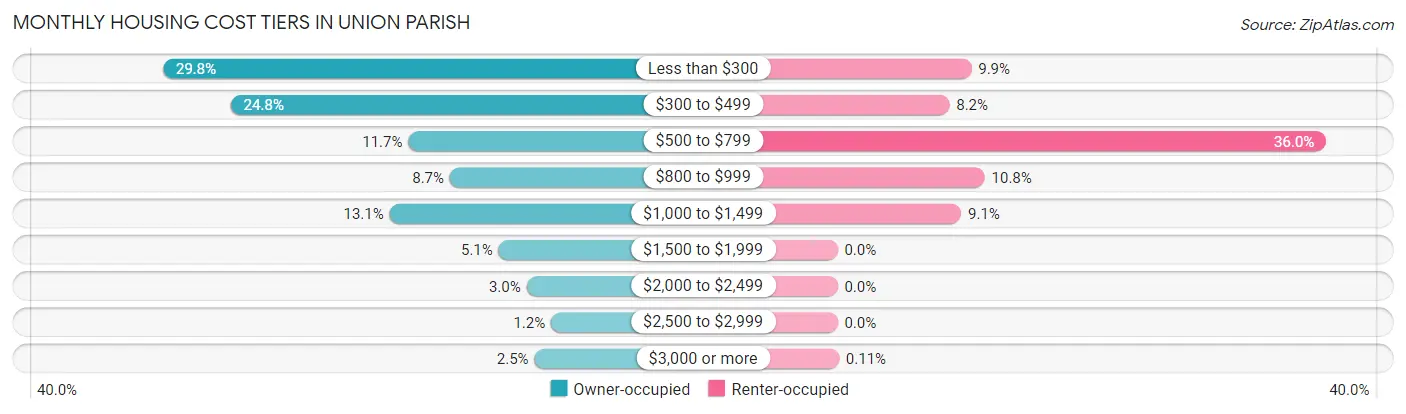
| Monthly Cost | Owner-occupied | Renter-occupied |
| Less than $300 | 1,887 (29.8%) | 182 (9.9%) |
| $300 to $499 | 1,571 (24.8%) | 152 (8.2%) |
| $500 to $799 | 743 (11.7%) | 664 (36.0%) |
| $800 to $999 | 549 (8.7%) | 200 (10.8%) |
| $1,000 to $1,499 | 830 (13.1%) | 168 (9.1%) |
| $1,500 to $1,999 | 322 (5.1%) | 0 (0.0%) |
| $2,000 to $2,499 | 192 (3.0%) | 0 (0.0%) |
| $2,500 to $2,999 | 78 (1.2%) | 0 (0.0%) |
| $3,000 or more | 155 (2.5%) | 2 (0.1%) |
| Total | 6,327 (100.0%) | 1,845 (100.0%) |
Physical Housing Characteristics in Union Parish
Housing Structures in Union Parish
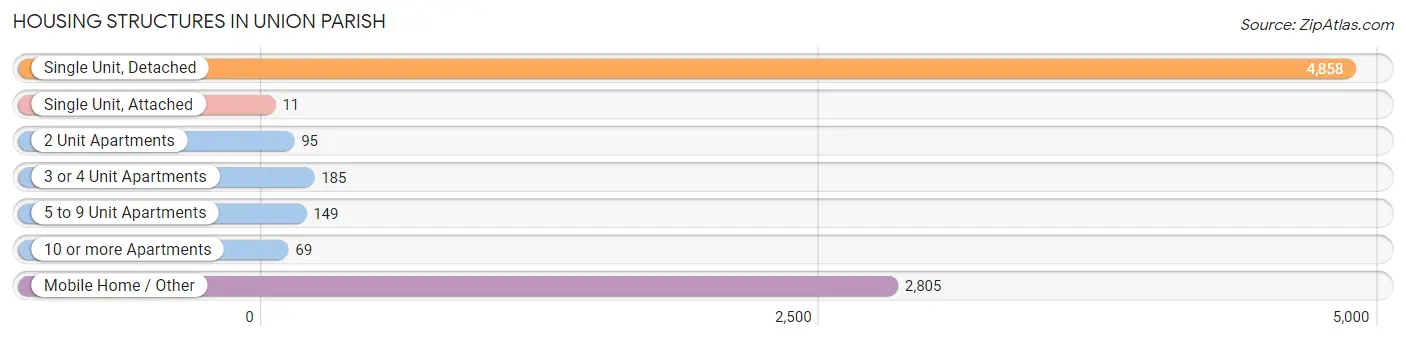
| Structure Type | # Housing Units | % Housing Units |
| Single Unit, Detached | 4,858 | 59.5% |
| Single Unit, Attached | 11 | 0.1% |
| 2 Unit Apartments | 95 | 1.2% |
| 3 or 4 Unit Apartments | 185 | 2.3% |
| 5 to 9 Unit Apartments | 149 | 1.8% |
| 10 or more Apartments | 69 | 0.8% |
| Mobile Home / Other | 2,805 | 34.3% |
| Total | 8,172 | 100.0% |
Housing Structures by Occupancy in Union Parish
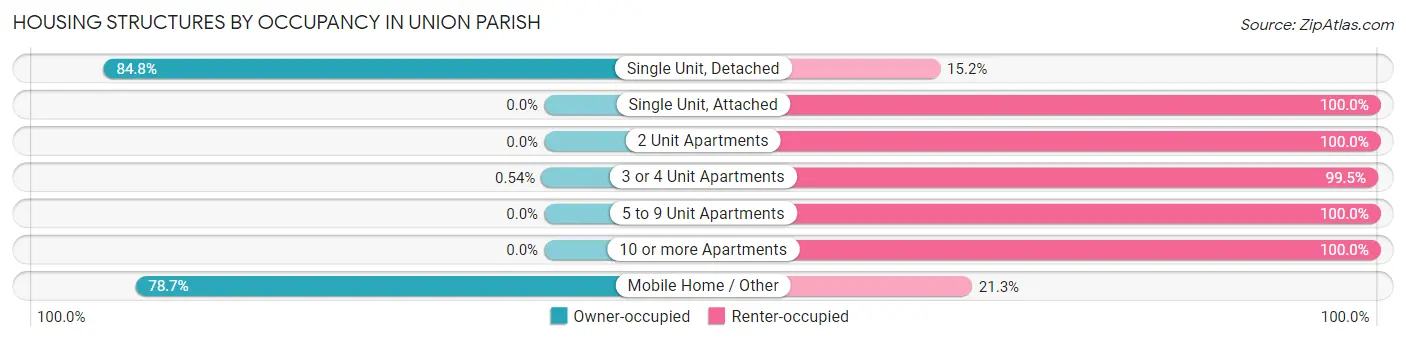
| Structure Type | Owner-occupied | Renter-occupied |
| Single Unit, Detached | 4,119 (84.8%) | 739 (15.2%) |
| Single Unit, Attached | 0 (0.0%) | 11 (100.0%) |
| 2 Unit Apartments | 0 (0.0%) | 95 (100.0%) |
| 3 or 4 Unit Apartments | 1 (0.5%) | 184 (99.5%) |
| 5 to 9 Unit Apartments | 0 (0.0%) | 149 (100.0%) |
| 10 or more Apartments | 0 (0.0%) | 69 (100.0%) |
| Mobile Home / Other | 2,207 (78.7%) | 598 (21.3%) |
| Total | 6,327 (77.4%) | 1,845 (22.6%) |
Housing Structures by Number of Rooms in Union Parish
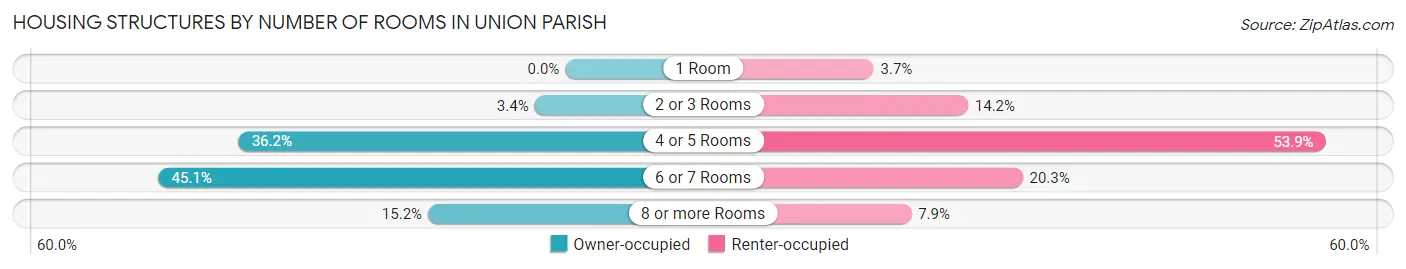
| Number of Rooms | Owner-occupied | Renter-occupied |
| 1 Room | 0 (0.0%) | 69 (3.7%) |
| 2 or 3 Rooms | 216 (3.4%) | 262 (14.2%) |
| 4 or 5 Rooms | 2,292 (36.2%) | 994 (53.9%) |
| 6 or 7 Rooms | 2,855 (45.1%) | 374 (20.3%) |
| 8 or more Rooms | 964 (15.2%) | 146 (7.9%) |
| Total | 6,327 (100.0%) | 1,845 (100.0%) |
Housing Structure by Heating Type in Union Parish
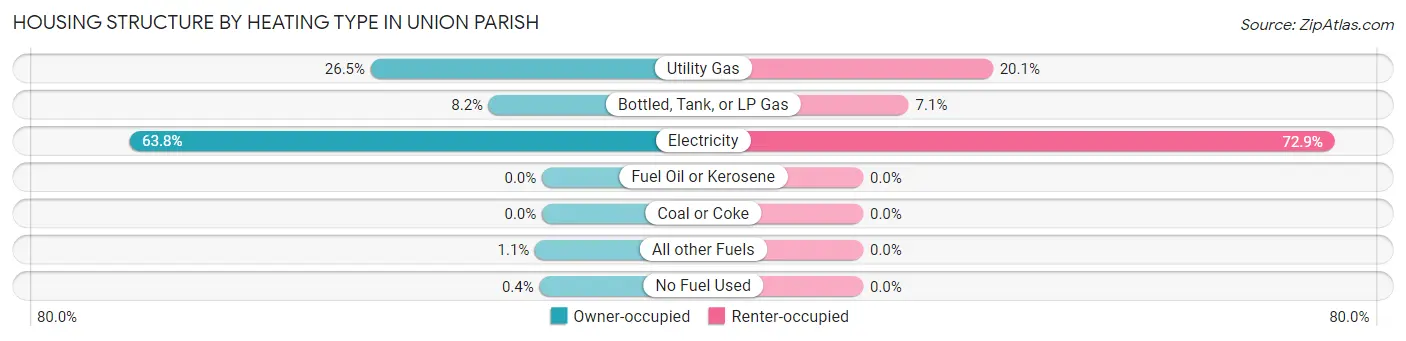
| Heating Type | Owner-occupied | Renter-occupied |
| Utility Gas | 1,675 (26.5%) | 370 (20.1%) |
| Bottled, Tank, or LP Gas | 520 (8.2%) | 130 (7.0%) |
| Electricity | 4,039 (63.8%) | 1,345 (72.9%) |
| Fuel Oil or Kerosene | 0 (0.0%) | 0 (0.0%) |
| Coal or Coke | 0 (0.0%) | 0 (0.0%) |
| All other Fuels | 68 (1.1%) | 0 (0.0%) |
| No Fuel Used | 25 (0.4%) | 0 (0.0%) |
| Total | 6,327 (100.0%) | 1,845 (100.0%) |
Household Vehicle Usage in Union Parish
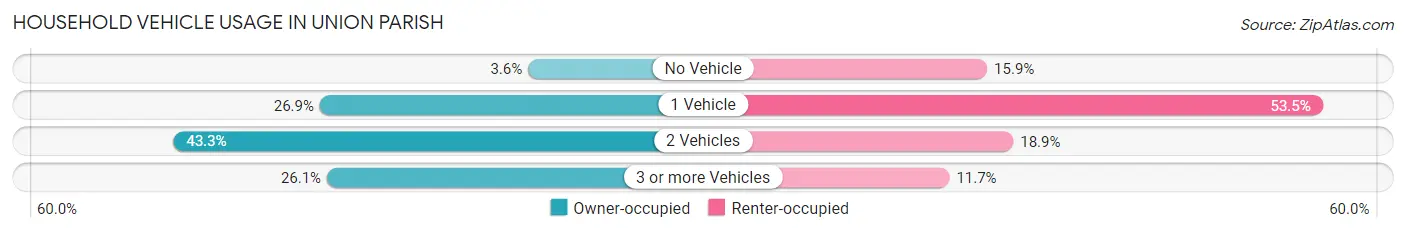
| Vehicles per Household | Owner-occupied | Renter-occupied |
| No Vehicle | 228 (3.6%) | 294 (15.9%) |
| 1 Vehicle | 1,704 (26.9%) | 987 (53.5%) |
| 2 Vehicles | 2,742 (43.3%) | 348 (18.9%) |
| 3 or more Vehicles | 1,653 (26.1%) | 216 (11.7%) |
| Total | 6,327 (100.0%) | 1,845 (100.0%) |
Real Estate & Mortgages in Union Parish
Real Estate and Mortgage Overview in Union Parish
| Characteristic | Without Mortgage | With Mortgage |
| Housing Units | 4,181 | 2,146 |
| Median Property Value | $82,500 | $188,400 |
| Median Household Income | $42,132 | $365 |
| Monthly Housing Costs | $319 | $43 |
| Real Estate Taxes | $296 | $475 |
Property Value by Mortgage Status in Union Parish
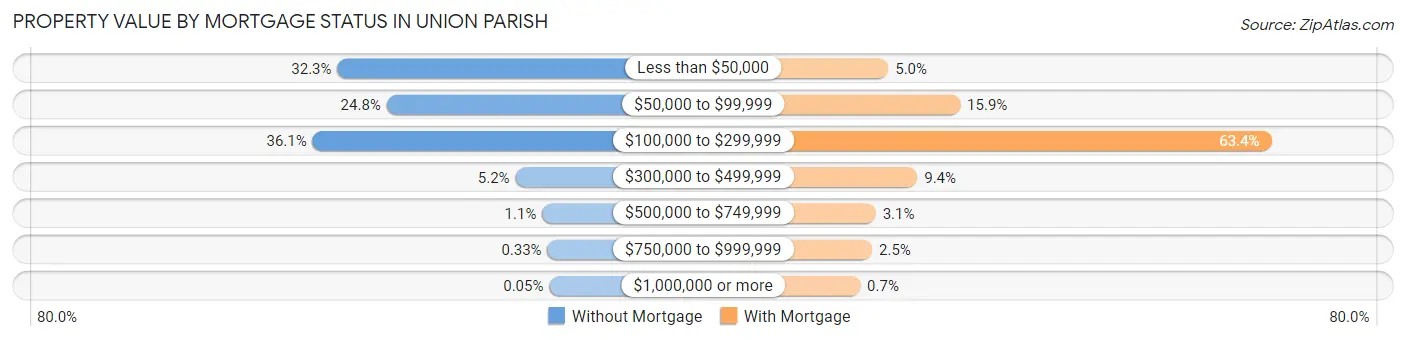
| Property Value | Without Mortgage | With Mortgage |
| Less than $50,000 | 1,352 (32.3%) | 107 (5.0%) |
| $50,000 to $99,999 | 1,038 (24.8%) | 342 (15.9%) |
| $100,000 to $299,999 | 1,510 (36.1%) | 1,360 (63.4%) |
| $300,000 to $499,999 | 218 (5.2%) | 202 (9.4%) |
| $500,000 to $749,999 | 47 (1.1%) | 66 (3.1%) |
| $750,000 to $999,999 | 14 (0.3%) | 54 (2.5%) |
| $1,000,000 or more | 2 (0.1%) | 15 (0.7%) |
| Total | 4,181 (100.0%) | 2,146 (100.0%) |
Household Income by Mortgage Status in Union Parish
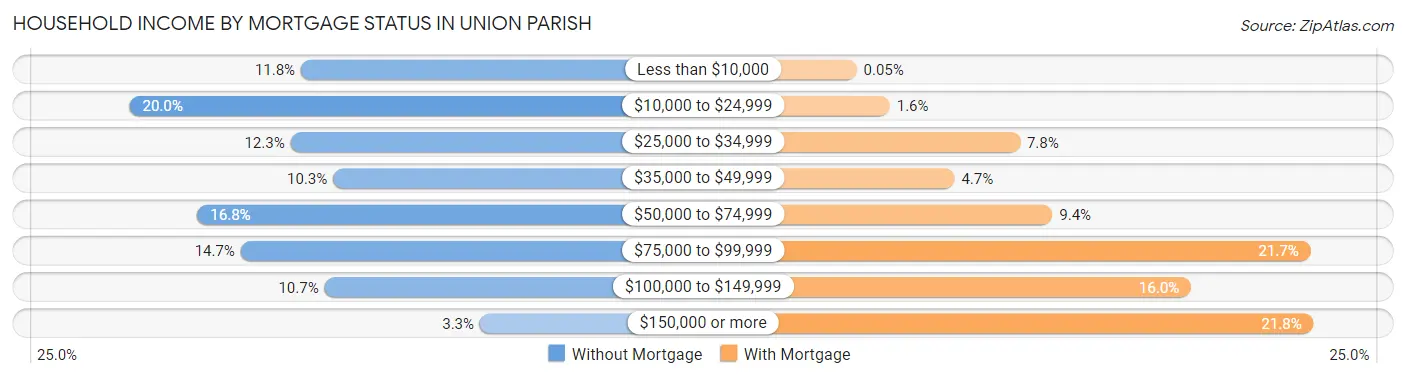
| Household Income | Without Mortgage | With Mortgage |
| Less than $10,000 | 495 (11.8%) | 1 (0.1%) |
| $10,000 to $24,999 | 836 (20.0%) | 35 (1.6%) |
| $25,000 to $34,999 | 516 (12.3%) | 168 (7.8%) |
| $35,000 to $49,999 | 431 (10.3%) | 101 (4.7%) |
| $50,000 to $74,999 | 701 (16.8%) | 201 (9.4%) |
| $75,000 to $99,999 | 615 (14.7%) | 465 (21.7%) |
| $100,000 to $149,999 | 448 (10.7%) | 343 (16.0%) |
| $150,000 or more | 139 (3.3%) | 468 (21.8%) |
| Total | 4,181 (100.0%) | 2,146 (100.0%) |
Property Value to Household Income Ratio in Union Parish
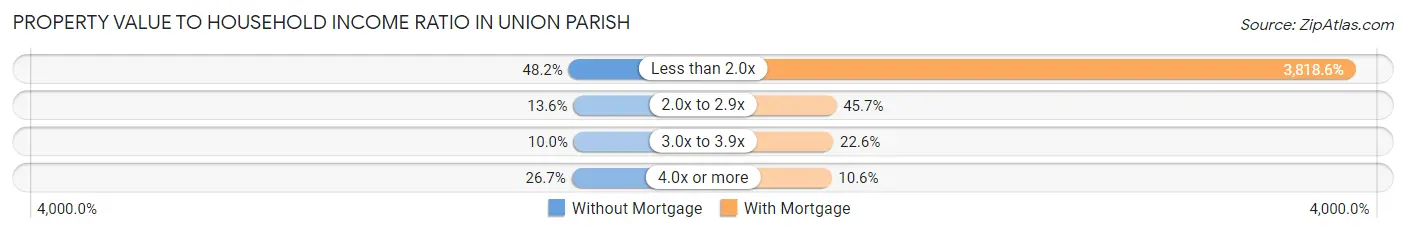
| Value-to-Income Ratio | Without Mortgage | With Mortgage |
| Less than 2.0x | 2,016 (48.2%) | 81,947 (3,818.6%) |
| 2.0x to 2.9x | 567 (13.6%) | 981 (45.7%) |
| 3.0x to 3.9x | 417 (10.0%) | 485 (22.6%) |
| 4.0x or more | 1,115 (26.7%) | 227 (10.6%) |
| Total | 4,181 (100.0%) | 2,146 (100.0%) |
Real Estate Taxes by Mortgage Status in Union Parish
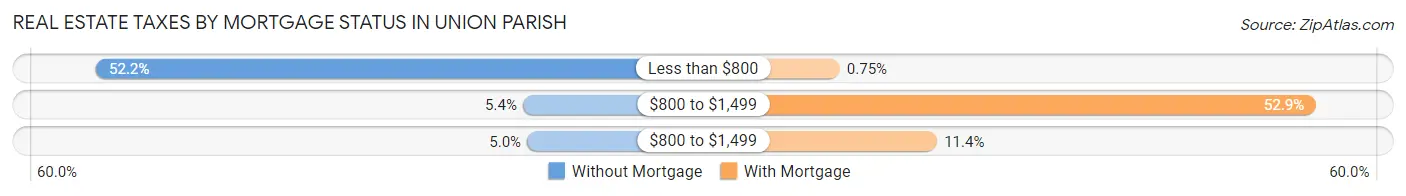
| Property Taxes | Without Mortgage | With Mortgage |
| Less than $800 | 2,181 (52.2%) | 16 (0.7%) |
| $800 to $1,499 | 226 (5.4%) | 1,136 (52.9%) |
| $800 to $1,499 | 207 (5.0%) | 245 (11.4%) |
| Total | 4,181 (100.0%) | 2,146 (100.0%) |
Health & Disability in Union Parish
Health Insurance Coverage by Age in Union Parish
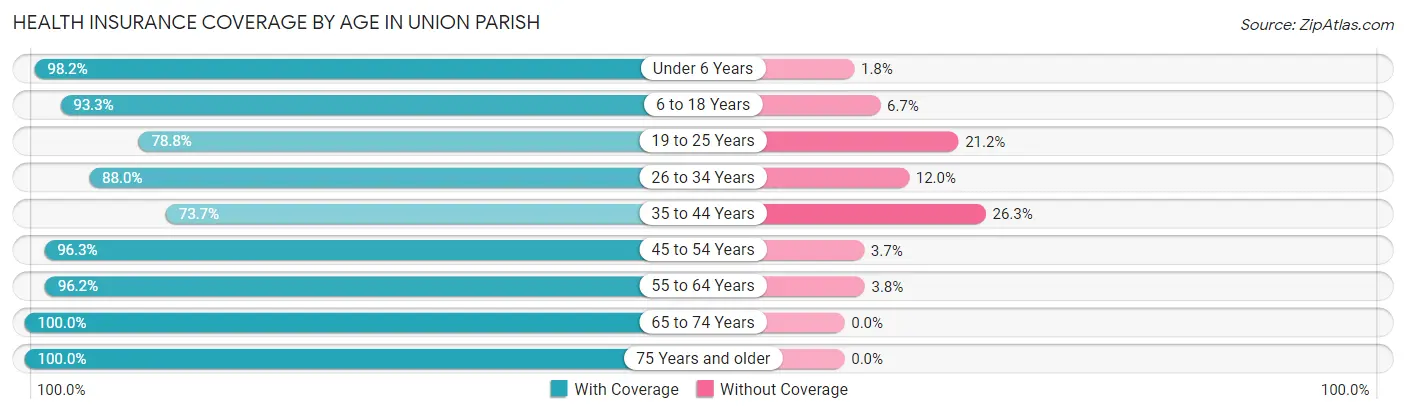
| Age Bracket | With Coverage | Without Coverage |
| Under 6 Years | 1,345 (98.2%) | 25 (1.8%) |
| 6 to 18 Years | 3,235 (93.3%) | 231 (6.7%) |
| 19 to 25 Years | 1,376 (78.8%) | 371 (21.2%) |
| 26 to 34 Years | 1,589 (88.0%) | 217 (12.0%) |
| 35 to 44 Years | 1,709 (73.7%) | 611 (26.3%) |
| 45 to 54 Years | 2,264 (96.3%) | 86 (3.7%) |
| 55 to 64 Years | 3,016 (96.2%) | 118 (3.8%) |
| 65 to 74 Years | 2,564 (100.0%) | 0 (0.0%) |
| 75 Years and older | 1,772 (100.0%) | 0 (0.0%) |
| Total | 18,870 (91.9%) | 1,659 (8.1%) |
Health Insurance Coverage by Citizenship Status in Union Parish
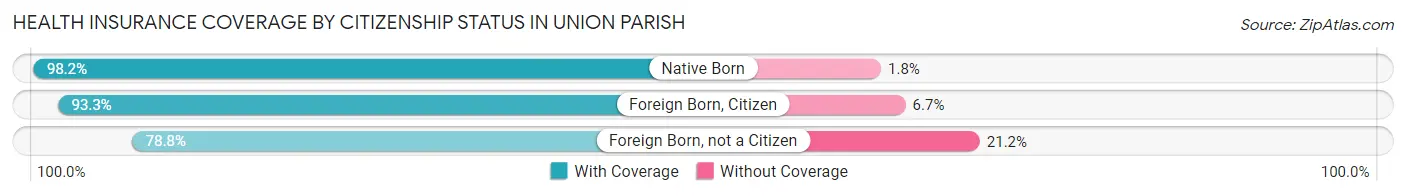
| Citizenship Status | With Coverage | Without Coverage |
| Native Born | 1,345 (98.2%) | 25 (1.8%) |
| Foreign Born, Citizen | 3,235 (93.3%) | 231 (6.7%) |
| Foreign Born, not a Citizen | 1,376 (78.8%) | 371 (21.2%) |
Health Insurance Coverage by Household Income in Union Parish
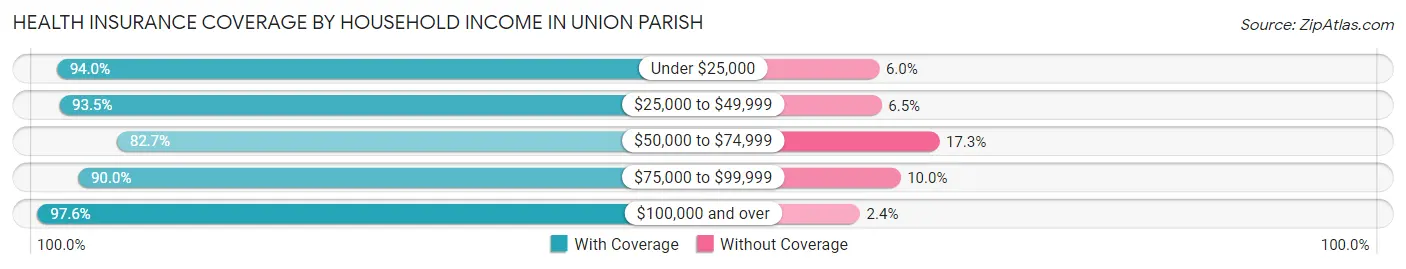
| Household Income | With Coverage | Without Coverage |
| Under $25,000 | 4,819 (94.0%) | 309 (6.0%) |
| $25,000 to $49,999 | 4,005 (93.5%) | 277 (6.5%) |
| $50,000 to $74,999 | 3,505 (82.7%) | 732 (17.3%) |
| $75,000 to $99,999 | 2,076 (90.0%) | 231 (10.0%) |
| $100,000 and over | 4,458 (97.6%) | 110 (2.4%) |
Public vs Private Health Insurance Coverage by Age in Union Parish
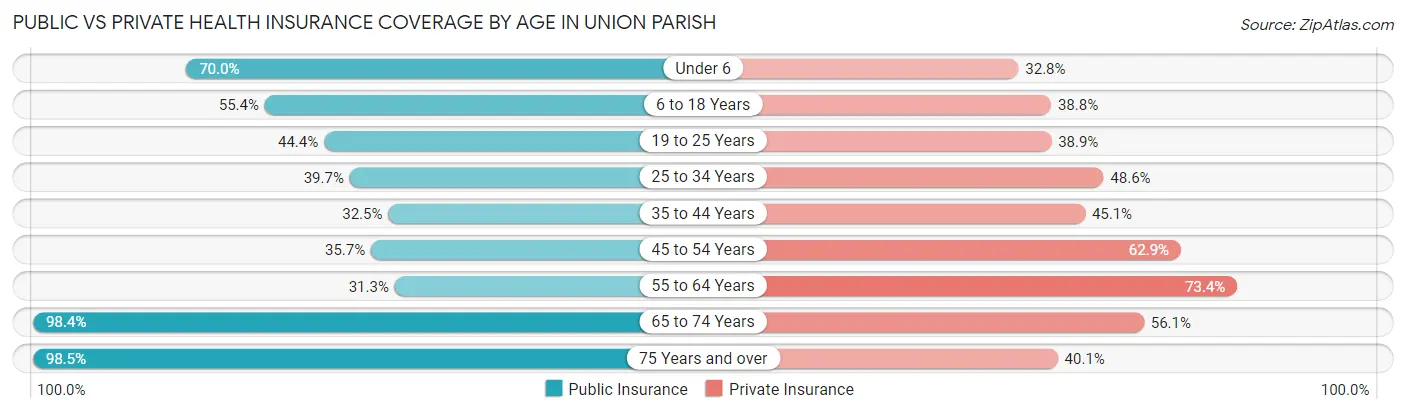
| Age Bracket | Public Insurance | Private Insurance |
| Under 6 | 959 (70.0%) | 449 (32.8%) |
| 6 to 18 Years | 1,921 (55.4%) | 1,346 (38.8%) |
| 19 to 25 Years | 776 (44.4%) | 679 (38.9%) |
| 25 to 34 Years | 716 (39.7%) | 877 (48.6%) |
| 35 to 44 Years | 754 (32.5%) | 1,047 (45.1%) |
| 45 to 54 Years | 839 (35.7%) | 1,479 (62.9%) |
| 55 to 64 Years | 981 (31.3%) | 2,300 (73.4%) |
| 65 to 74 Years | 2,524 (98.4%) | 1,437 (56.0%) |
| 75 Years and over | 1,745 (98.5%) | 710 (40.1%) |
| Total | 11,215 (54.6%) | 10,324 (50.3%) |
Disability Status by Sex by Age in Union Parish
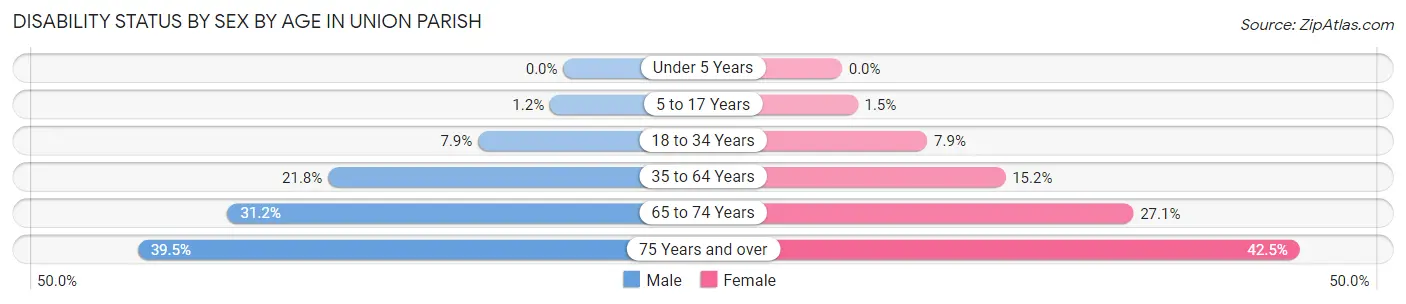
| Age Bracket | Male | Female |
| Under 5 Years | 0 (0.0%) | 0 (0.0%) |
| 5 to 17 Years | 23 (1.2%) | 22 (1.5%) |
| 18 to 34 Years | 147 (7.9%) | 156 (7.9%) |
| 35 to 64 Years | 824 (21.8%) | 611 (15.2%) |
| 65 to 74 Years | 397 (31.2%) | 349 (27.1%) |
| 75 Years and over | 303 (39.5%) | 427 (42.5%) |
Disability Class by Sex by Age in Union Parish
Disability Class: Hearing Difficulty
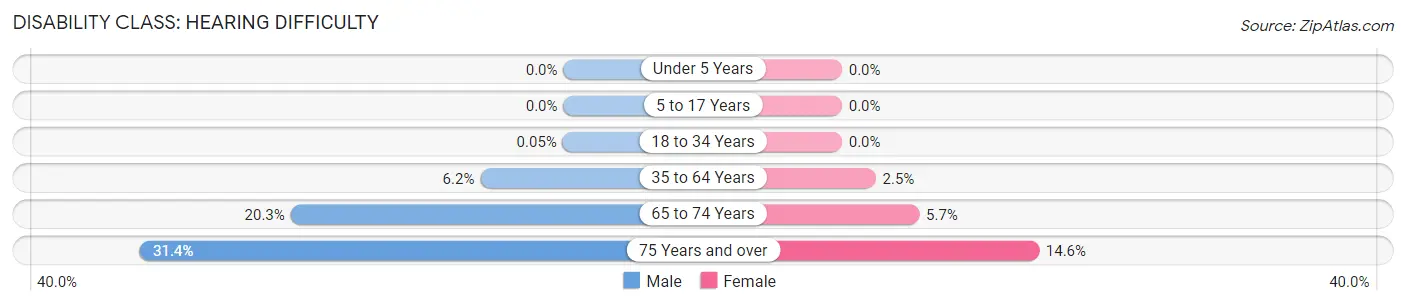
| Age Bracket | Male | Female |
| Under 5 Years | 0 (0.0%) | 0 (0.0%) |
| 5 to 17 Years | 0 (0.0%) | 0 (0.0%) |
| 18 to 34 Years | 1 (0.1%) | 0 (0.0%) |
| 35 to 64 Years | 233 (6.2%) | 101 (2.5%) |
| 65 to 74 Years | 258 (20.3%) | 74 (5.7%) |
| 75 Years and over | 241 (31.4%) | 147 (14.6%) |
Disability Class: Vision Difficulty
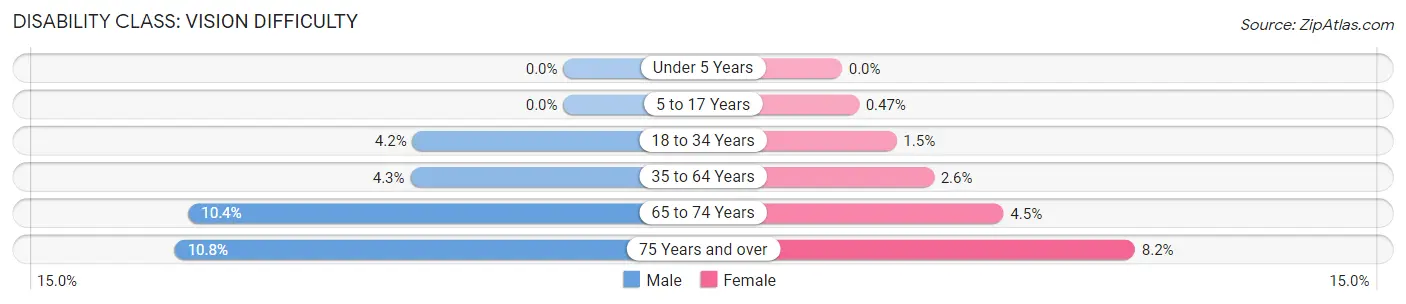
| Age Bracket | Male | Female |
| Under 5 Years | 0 (0.0%) | 0 (0.0%) |
| 5 to 17 Years | 0 (0.0%) | 7 (0.5%) |
| 18 to 34 Years | 78 (4.2%) | 30 (1.5%) |
| 35 to 64 Years | 161 (4.3%) | 103 (2.6%) |
| 65 to 74 Years | 133 (10.4%) | 58 (4.5%) |
| 75 Years and over | 83 (10.8%) | 82 (8.2%) |
Disability Class: Cognitive Difficulty
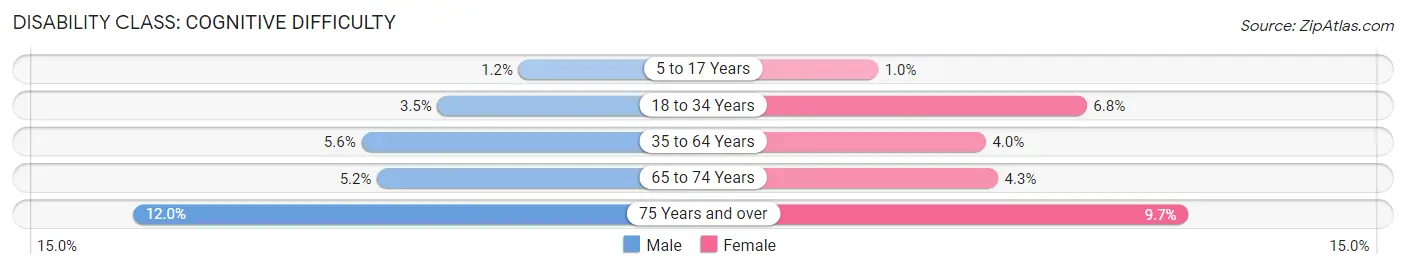
| Age Bracket | Male | Female |
| 5 to 17 Years | 23 (1.2%) | 15 (1.0%) |
| 18 to 34 Years | 65 (3.5%) | 134 (6.8%) |
| 35 to 64 Years | 212 (5.6%) | 161 (4.0%) |
| 65 to 74 Years | 66 (5.2%) | 56 (4.3%) |
| 75 Years and over | 92 (12.0%) | 97 (9.7%) |
Disability Class: Ambulatory Difficulty
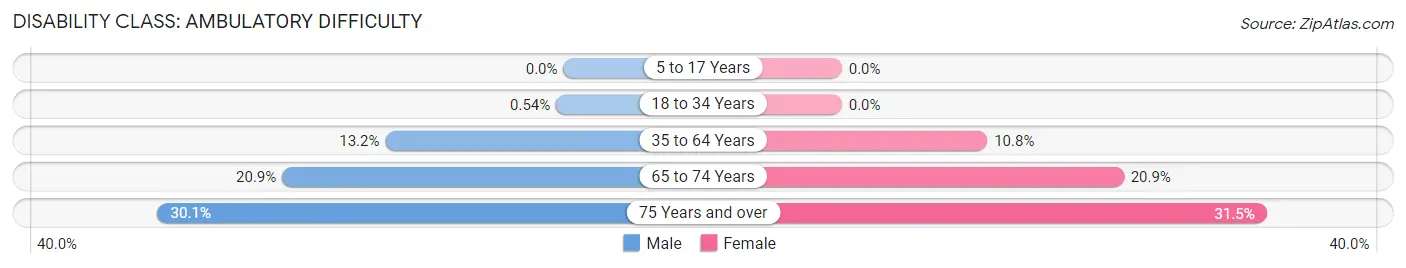
| Age Bracket | Male | Female |
| 5 to 17 Years | 0 (0.0%) | 0 (0.0%) |
| 18 to 34 Years | 10 (0.5%) | 0 (0.0%) |
| 35 to 64 Years | 499 (13.2%) | 435 (10.8%) |
| 65 to 74 Years | 266 (20.9%) | 270 (20.9%) |
| 75 Years and over | 231 (30.1%) | 317 (31.5%) |
Disability Class: Self-Care Difficulty
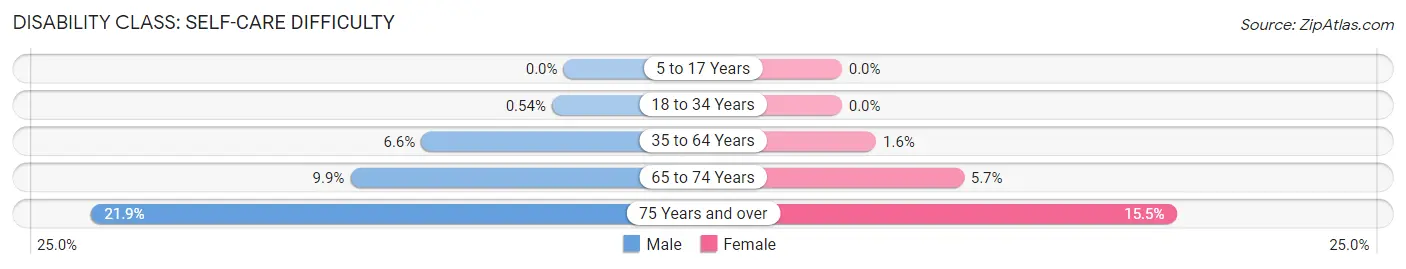
| Age Bracket | Male | Female |
| 5 to 17 Years | 0 (0.0%) | 0 (0.0%) |
| 18 to 34 Years | 10 (0.5%) | 0 (0.0%) |
| 35 to 64 Years | 249 (6.6%) | 64 (1.6%) |
| 65 to 74 Years | 126 (9.9%) | 73 (5.7%) |
| 75 Years and over | 168 (21.9%) | 156 (15.5%) |
Technology Access in Union Parish
Computing Device Access in Union Parish
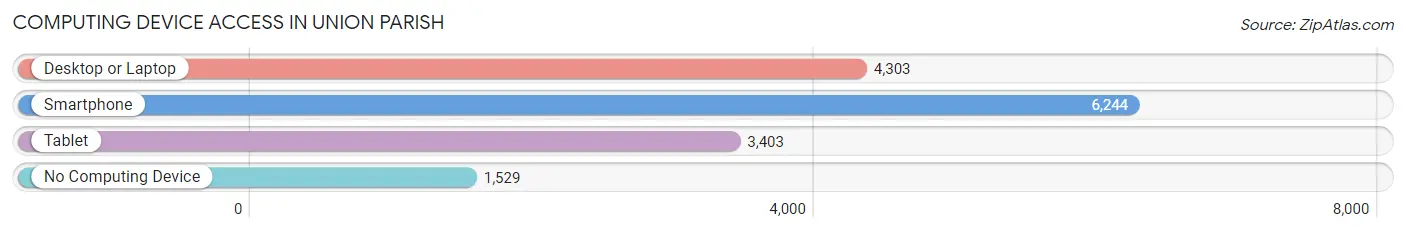
| Device Type | # Households | % Households |
| Desktop or Laptop | 4,303 | 52.7% |
| Smartphone | 6,244 | 76.4% |
| Tablet | 3,403 | 41.6% |
| No Computing Device | 1,529 | 18.7% |
| Total | 8,172 | 100.0% |
Internet Access in Union Parish
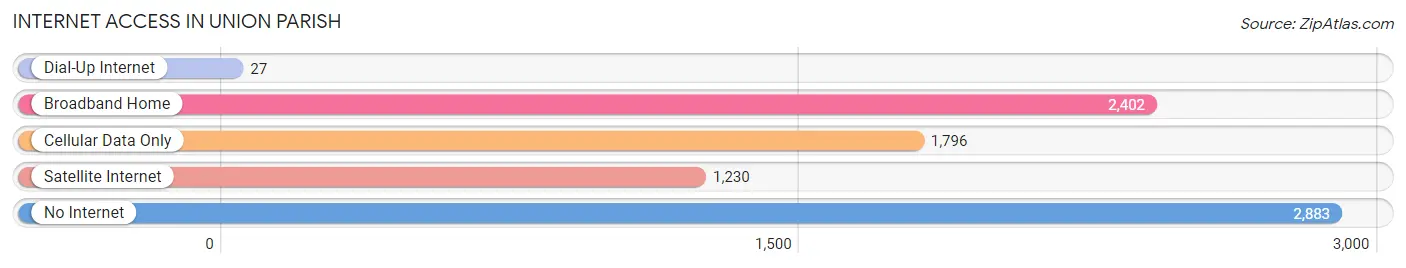
| Internet Type | # Households | % Households |
| Dial-Up Internet | 27 | 0.3% |
| Broadband Home | 2,402 | 29.4% |
| Cellular Data Only | 1,796 | 22.0% |
| Satellite Internet | 1,230 | 15.0% |
| No Internet | 2,883 | 35.3% |
| Total | 8,172 | 100.0% |
Union Parish Summary
Parish History
Union Parish is located in the northern part of Louisiana and is part of the Ark-La-Tex region. The parish was created in 1839 from the parishes of Ouachita and Claiborne. It was named for the union of the two parishes. The parish seat is Farmerville.
The first settlers in the area were Native Americans, including the Choctaw, Chickasaw, and Caddo tribes. The first European settlers were French and Spanish, who arrived in the late 1700s. The area was part of the Louisiana Purchase in 1803.
The parish was an important center for cotton production during the antebellum period. The economy was based on the production of cotton, corn, and livestock. The parish was also home to several plantations, including the historic Oakley Plantation.
During the Civil War, Union Parish was the site of several battles, including the Battle of Bayou Macon in 1863. After the war, the economy shifted to timber and lumber production. The parish was also home to several sawmills and turpentine stills.
Geography
Union Parish is located in the northern part of Louisiana and is part of the Ark-La-Tex region. The parish is bordered by Ouachita Parish to the north, Lincoln Parish to the east, Jackson Parish to the south, and Claiborne Parish to the west.
The parish has a total area of 845 square miles, of which 843 square miles is land and 2 square miles is water. The parish is mostly flat, with some rolling hills in the northern part. The highest point in the parish is the summit of Mount Zion, which has an elevation of 545 feet.
The parish is drained by the Ouachita River and its tributaries, including Bayou D'Arbonne, Bayou Macon, and Bayou Desiard. The parish is also home to several lakes, including Lake D'Arbonne, Lake Claiborne, and Lake D'Arbonne State Park.
Economy
The economy of Union Parish is largely based on agriculture and forestry. The main crops grown in the parish are cotton, corn, soybeans, and wheat. Livestock production is also important, with cattle, hogs, and poultry being the main animals raised.
The parish is also home to several timber and lumber companies, which produce lumber, plywood, and other wood products. The parish is also home to several manufacturing companies, including a paper mill and a furniture factory.
The parish is home to several tourist attractions, including Lake D'Arbonne State Park, the historic Oakley Plantation, and the Union Parish Museum. The parish is also home to several festivals, including the Union Parish Fair and the Union Parish Watermelon Festival.
Demographics
As of the 2010 census, the population of Union Parish was 22,721. The racial makeup of the parish was 79.3% White, 18.2% African American, 0.5% Native American, 0.3% Asian, 0.2% Pacific Islander, 0.7% from other races, and 1.0% from two or more races. Hispanic or Latino of any race were 2.2% of the population.
The median household income in the parish was $35,945, and the median family income was $44,813. The per capita income was $17,945. About 17.2% of the population was below the poverty line.
The largest employers in the parish are the Union Parish School District, the Union Parish Sheriff's Office, and the Union Parish Hospital. Other major employers include the Union Parish Forestry Commission, the Union Parish Water District, and the Union Parish Economic Development Commission.
Common Questions
What is Per Capita Income in Union Parish?
Per Capita income in Union Parish is $28,575.
What is the Median Family Income in Union Parish?
Median Family Income in Union Parish is $59,891.
What is the Median Household income in Union Parish?
Median Household Income in Union Parish is $47,068.
What is Income or Wage Gap in Union Parish?
Income or Wage Gap in Union Parish is 32.2%.
Women in Union Parish earn 67.8 cents for every dollar earned by a man.
What is Family Income Deficit in Union Parish?
Family Income Deficit in Union Parish is $12,192.
Families that are below poverty line in Union Parish earn $12,192 less on average than the poverty threshold level.
What is Inequality or Gini Index in Union Parish?
Inequality or Gini Index in Union Parish is 0.51.
What is the Total Population of Union Parish?
Total Population of Union Parish is 21,049.
What is the Total Male Population of Union Parish?
Total Male Population of Union Parish is 10,450.
What is the Total Female Population of Union Parish?
Total Female Population of Union Parish is 10,599.
What is the Ratio of Males per 100 Females in Union Parish?
There are 98.59 Males per 100 Females in Union Parish.
What is the Ratio of Females per 100 Males in Union Parish?
There are 101.43 Females per 100 Males in Union Parish.
What is the Median Population Age in Union Parish?
Median Population Age in Union Parish is 42.5 Years.
What is the Average Family Size in Union Parish
Average Family Size in Union Parish is 3.2 People.
What is the Average Household Size in Union Parish
Average Household Size in Union Parish is 2.5 People.
How Large is the Labor Force in Union Parish?
There are 8,483 People in the Labor Forcein in Union Parish.
What is the Percentage of People in the Labor Force in Union Parish?
49.7% of People are in the Labor Force in Union Parish.
What is the Unemployment Rate in Union Parish?
Unemployment Rate in Union Parish is 5.4%.