St. James Parish, LA Map & Demographics
St. James Parish Map
St. James Parish Overview
$33,616
PER CAPITA INCOME
$84,091
AVG FAMILY INCOME
$62,946
AVG HOUSEHOLD INCOME
45.1%
WAGE / INCOME GAP [ % ]
54.9¢/ $1
WAGE / INCOME GAP [ $ ]
0.43
INEQUALITY / GINI INDEX
20,090
TOTAL POPULATION
9,716
MALE POPULATION
10,374
FEMALE POPULATION
93.66
MALES / 100 FEMALES
106.77
FEMALES / 100 MALES
40.4
MEDIAN AGE
3.2
AVG FAMILY SIZE
2.7
AVG HOUSEHOLD SIZE
9,358
LABOR FORCE [ PEOPLE ]
57.9%
PERCENT IN LABOR FORCE
3.6%
UNEMPLOYMENT RATE
Income in St. James Parish
Income Overview in St. James Parish
Per Capita Income in St. James Parish is $33,616, while median incomes of families and households are $84,091 and $62,946 respectively.
| Characteristic | Number | Measure |
| Per Capita Income | 20,090 | $33,616 |
| Median Family Income | 5,562 | $84,091 |
| Mean Family Income | 5,562 | $99,092 |
| Median Household Income | 7,498 | $62,946 |
| Mean Household Income | 7,498 | $85,748 |
| Income Deficit | 5,562 | $0 |
| Wage / Income Gap (%) | 20,090 | 45.11% |
| Wage / Income Gap ($) | 20,090 | 54.89¢ per $1 |
| Gini / Inequality Index | 20,090 | 0.43 |
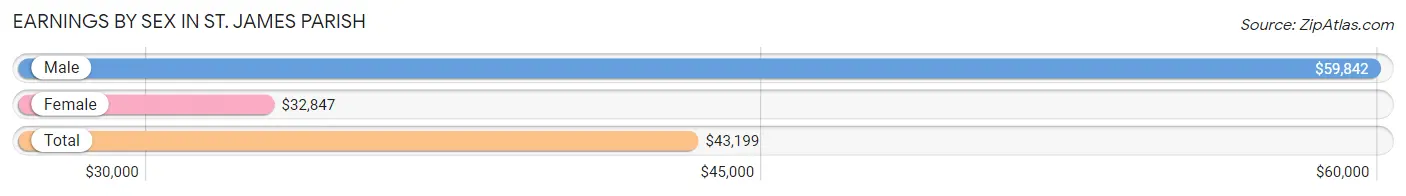
Earnings by Sex in St. James Parish
Average Earnings in St. James Parish are $43,199, $59,842 for men and $32,847 for women, a difference of 45.1%.
| Sex | Number | Average Earnings |
| Male | 4,670 (49.6%) | $59,842 |
| Female | 4,738 (50.4%) | $32,847 |
| Total | 9,408 (100.0%) | $43,199 |
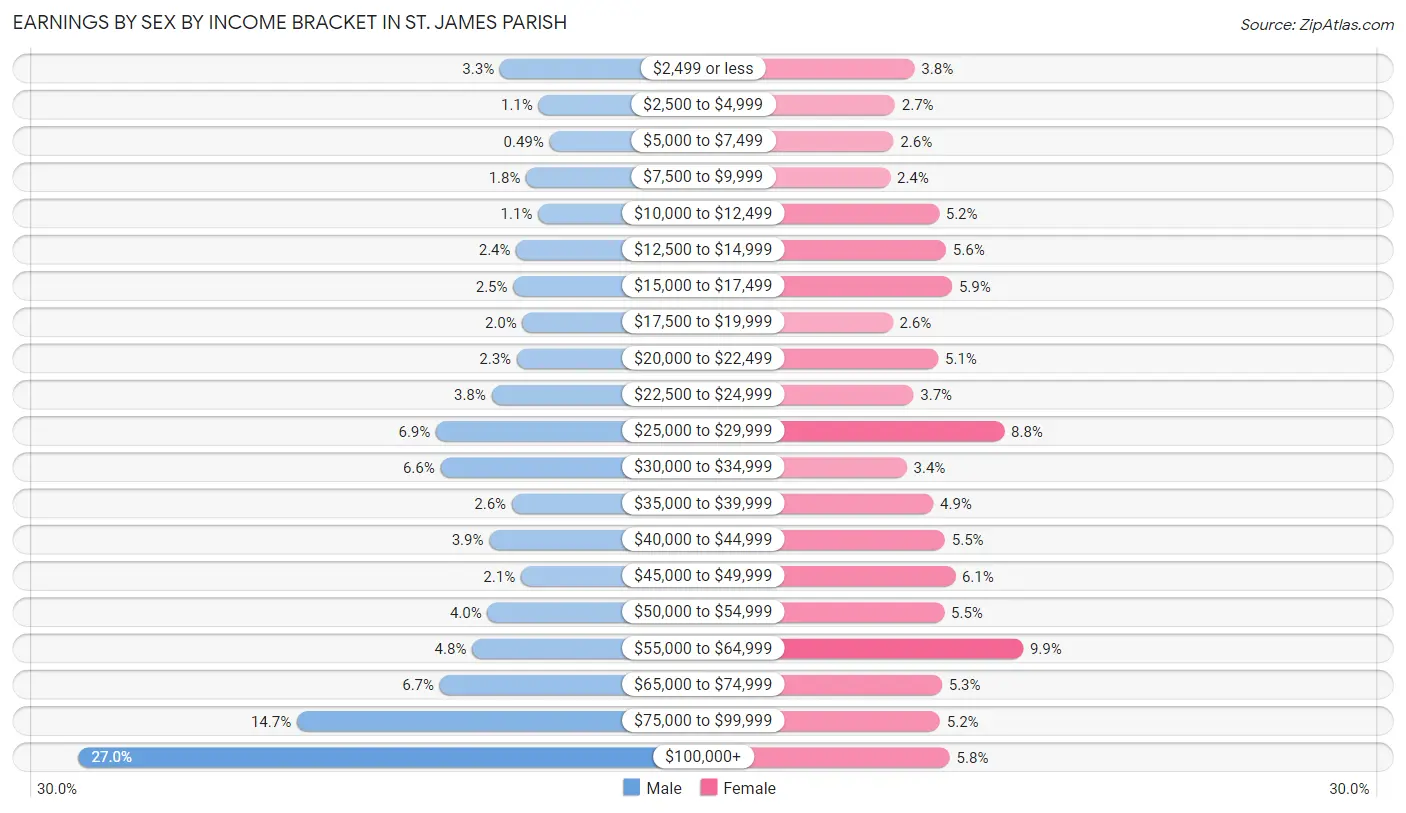
Earnings by Sex by Income Bracket in St. James Parish
The most common earnings brackets in St. James Parish are $100,000+ for men (1,259 | 27.0%) and $55,000 to $64,999 for women (469 | 9.9%).
| Income | Male | Female |
| $2,499 or less | 153 (3.3%) | 180 (3.8%) |
| $2,500 to $4,999 | 52 (1.1%) | 128 (2.7%) |
| $5,000 to $7,499 | 23 (0.5%) | 124 (2.6%) |
| $7,500 to $9,999 | 84 (1.8%) | 115 (2.4%) |
| $10,000 to $12,499 | 53 (1.1%) | 245 (5.2%) |
| $12,500 to $14,999 | 110 (2.4%) | 264 (5.6%) |
| $15,000 to $17,499 | 118 (2.5%) | 280 (5.9%) |
| $17,500 to $19,999 | 94 (2.0%) | 122 (2.6%) |
| $20,000 to $22,499 | 109 (2.3%) | 243 (5.1%) |
| $22,500 to $24,999 | 175 (3.7%) | 177 (3.7%) |
| $25,000 to $29,999 | 321 (6.9%) | 419 (8.8%) |
| $30,000 to $34,999 | 309 (6.6%) | 159 (3.4%) |
| $35,000 to $39,999 | 122 (2.6%) | 230 (4.9%) |
| $40,000 to $44,999 | 181 (3.9%) | 261 (5.5%) |
| $45,000 to $49,999 | 98 (2.1%) | 288 (6.1%) |
| $50,000 to $54,999 | 186 (4.0%) | 259 (5.5%) |
| $55,000 to $64,999 | 226 (4.8%) | 469 (9.9%) |
| $65,000 to $74,999 | 311 (6.7%) | 253 (5.3%) |
| $75,000 to $99,999 | 686 (14.7%) | 248 (5.2%) |
| $100,000+ | 1,259 (27.0%) | 274 (5.8%) |
| Total | 4,670 (100.0%) | 4,738 (100.0%) |
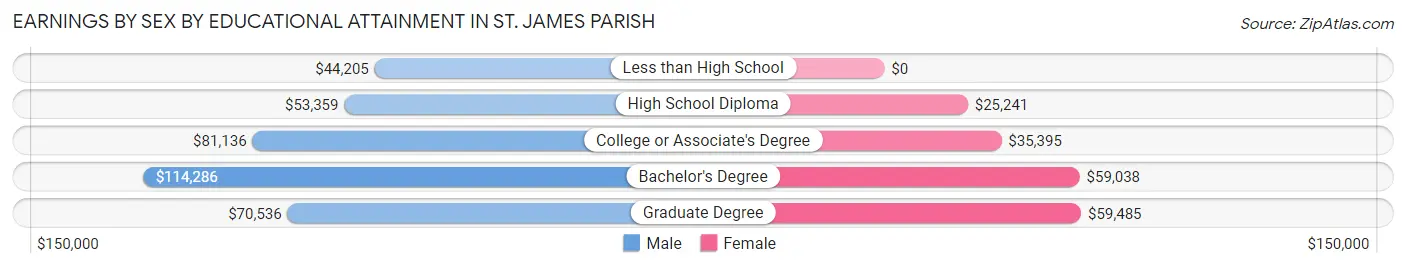
Earnings by Sex by Educational Attainment in St. James Parish
Average earnings in St. James Parish are $70,618 for men and $37,234 for women, a difference of 47.3%. Men with an educational attainment of bachelor's degree enjoy the highest average annual earnings of $114,286, while those with less than high school education earn the least with $44,205. Women with an educational attainment of graduate degree earn the most with the average annual earnings of $59,485, while those with high school diploma education have the smallest earnings of $25,241.
| Educational Attainment | Male Income | Female Income |
| Less than High School | $44,205 | $0 |
| High School Diploma | $53,359 | $25,241 |
| College or Associate's Degree | $81,136 | $35,395 |
| Bachelor's Degree | $114,286 | $59,038 |
| Graduate Degree | $70,536 | $59,485 |
| Total | $70,618 | $37,234 |
Family Income in St. James Parish
Family Income Brackets in St. James Parish
According to the St. James Parish family income data, there are 1,118 families falling into the $100,000 to $149,999 income range, which is the most common income bracket and makes up 20.1% of all families. Conversely, the less than $10,000 income bracket is the least frequent group with only 44 families (0.8%) belonging to this category.
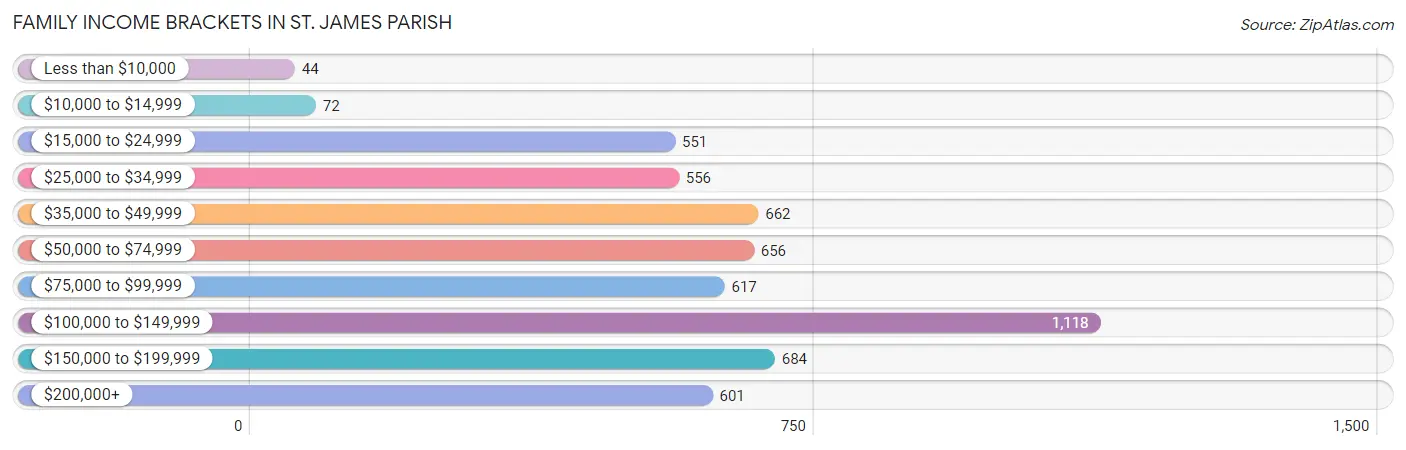
| Income Bracket | # Families | % Families |
| Less than $10,000 | 44 | 0.8% |
| $10,000 to $14,999 | 72 | 1.3% |
| $15,000 to $24,999 | 551 | 9.9% |
| $25,000 to $34,999 | 556 | 10.0% |
| $35,000 to $49,999 | 662 | 11.9% |
| $50,000 to $74,999 | 656 | 11.8% |
| $75,000 to $99,999 | 617 | 11.1% |
| $100,000 to $149,999 | 1,118 | 20.1% |
| $150,000 to $199,999 | 684 | 12.3% |
| $200,000+ | 601 | 10.8% |
Family Income by Famaliy Size in St. James Parish
7+ person families (55 | 1.0%) account for the highest median family income in St. James Parish with $222,629 per family, while 2-person families (2,466 | 44.3%) have the highest median income of $36,594 per family member.
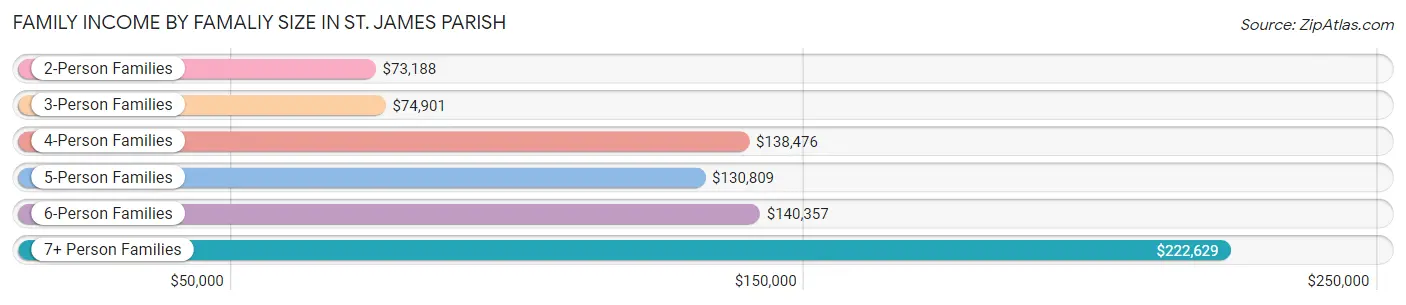
| Income Bracket | # Families | Median Income |
| 2-Person Families | 2,466 (44.3%) | $73,188 |
| 3-Person Families | 1,513 (27.2%) | $74,901 |
| 4-Person Families | 1,049 (18.9%) | $138,476 |
| 5-Person Families | 429 (7.7%) | $130,809 |
| 6-Person Families | 50 (0.9%) | $140,357 |
| 7+ Person Families | 55 (1.0%) | $222,629 |
| Total | 5,562 (100.0%) | $84,091 |
Family Income by Number of Earners in St. James Parish
The median family income in St. James Parish is $84,091, with families comprising 3+ earners (644) having the highest median family income of $157,264, while families with no earners (1,179) have the lowest median family income of $38,087, accounting for 11.6% and 21.2% of families, respectively.
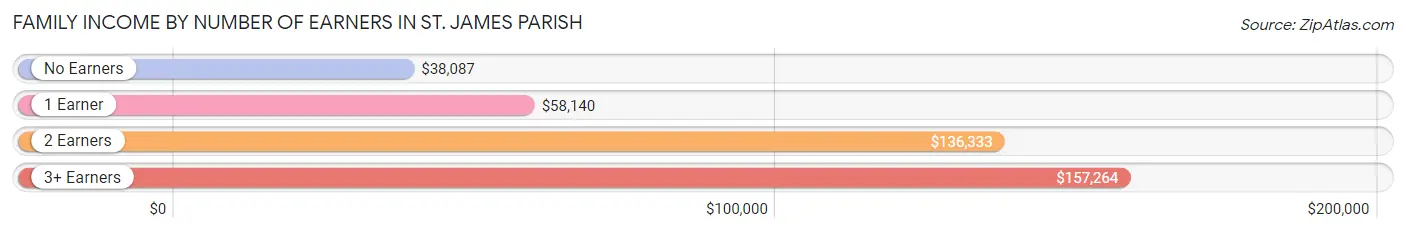
| Number of Earners | # Families | Median Income |
| No Earners | 1,179 (21.2%) | $38,087 |
| 1 Earner | 1,883 (33.9%) | $58,140 |
| 2 Earners | 1,856 (33.4%) | $136,333 |
| 3+ Earners | 644 (11.6%) | $157,264 |
| Total | 5,562 (100.0%) | $84,091 |
Household Income in St. James Parish
Household Income Brackets in St. James Parish
With 1,305 households falling in the category, the $100,000 to $149,999 income range is the most frequent in St. James Parish, accounting for 17.4% of all households. In contrast, only 195 households (2.6%) fall into the less than $10,000 income bracket, making it the least populous group.
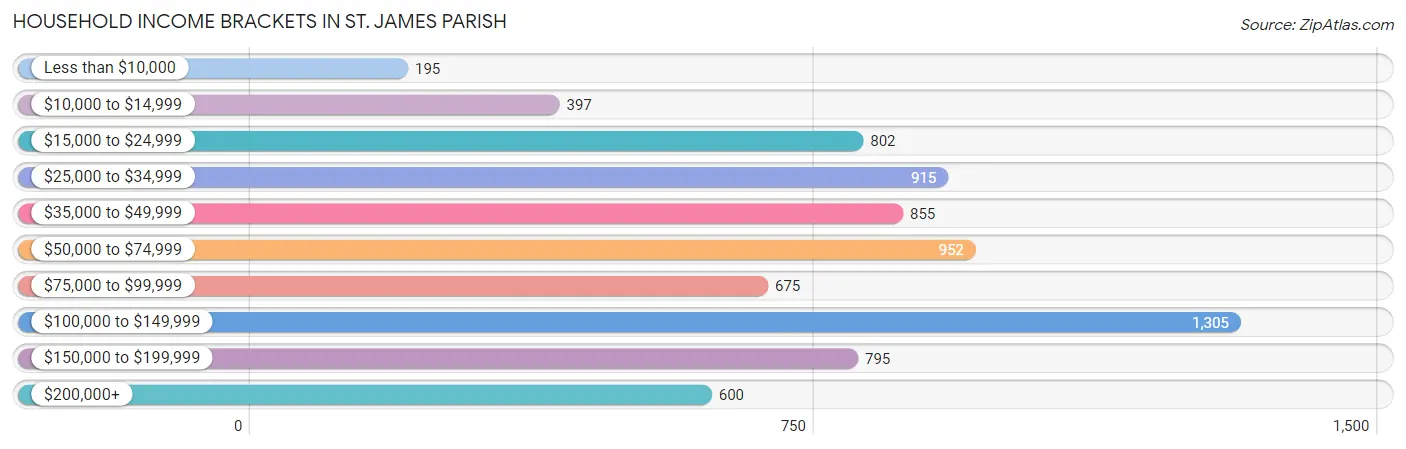
| Income Bracket | # Households | % Households |
| Less than $10,000 | 195 | 2.6% |
| $10,000 to $14,999 | 397 | 5.3% |
| $15,000 to $24,999 | 802 | 10.7% |
| $25,000 to $34,999 | 915 | 12.2% |
| $35,000 to $49,999 | 855 | 11.4% |
| $50,000 to $74,999 | 952 | 12.7% |
| $75,000 to $99,999 | 675 | 9.0% |
| $100,000 to $149,999 | 1,305 | 17.4% |
| $150,000 to $199,999 | 795 | 10.6% |
| $200,000+ | 600 | 8.0% |
Household Income by Householder Age in St. James Parish
The median household income in St. James Parish is $62,946, with the highest median household income of $104,333 found in the 25 to 44 years age bracket for the primary householder. A total of 2,060 households (27.5%) fall into this category. Meanwhile, the 15 to 24 years age bracket for the primary householder has the lowest median household income of $0, with 150 households (2.0%) in this group.
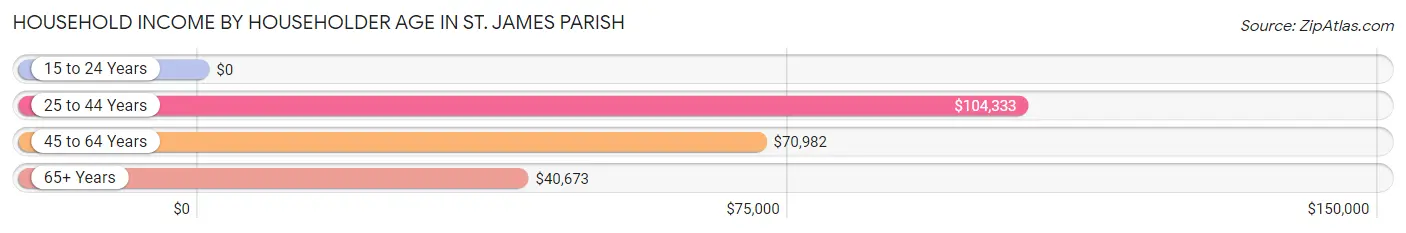
| Income Bracket | # Households | Median Income |
| 15 to 24 Years | 150 (2.0%) | $0 |
| 25 to 44 Years | 2,060 (27.5%) | $104,333 |
| 45 to 64 Years | 2,978 (39.7%) | $70,982 |
| 65+ Years | 2,310 (30.8%) | $40,673 |
| Total | 7,498 (100.0%) | $62,946 |
Poverty in St. James Parish
Income Below Poverty by Sex and Age in St. James Parish
With 9.8% poverty level for males and 13.0% for females among the residents of St. James Parish, under 5 year old males and 12 to 14 year old females are the most vulnerable to poverty, with 187 males (31.2%) and 72 females (20.6%) in their respective age groups living below the poverty level.
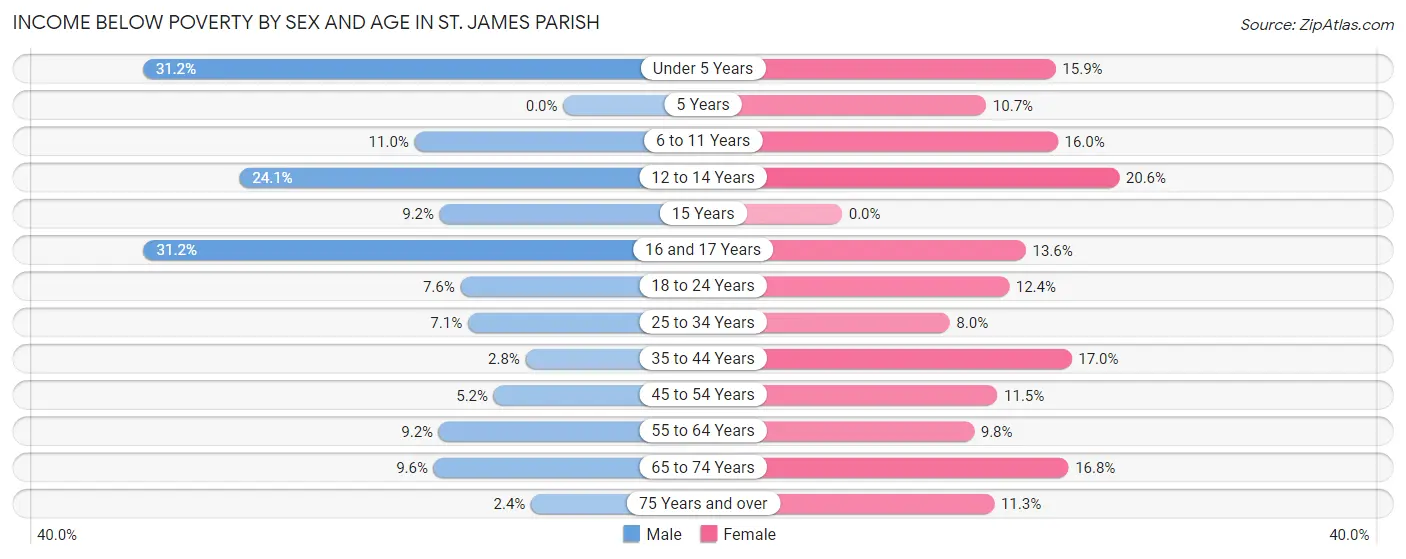
| Age Bracket | Male | Female |
| Under 5 Years | 187 (31.2%) | 89 (15.9%) |
| 5 Years | 0 (0.0%) | 20 (10.7%) |
| 6 to 11 Years | 87 (11.0%) | 108 (16.0%) |
| 12 to 14 Years | 95 (24.0%) | 72 (20.6%) |
| 15 Years | 11 (9.2%) | 0 (0.0%) |
| 16 and 17 Years | 86 (31.2%) | 36 (13.6%) |
| 18 to 24 Years | 60 (7.6%) | 97 (12.4%) |
| 25 to 34 Years | 74 (7.1%) | 88 (8.0%) |
| 35 to 44 Years | 39 (2.8%) | 252 (17.0%) |
| 45 to 54 Years | 55 (5.2%) | 140 (11.5%) |
| 55 to 64 Years | 134 (9.2%) | 146 (9.8%) |
| 65 to 74 Years | 99 (9.6%) | 195 (16.8%) |
| 75 Years and over | 14 (2.4%) | 98 (11.3%) |
| Total | 941 (9.8%) | 1,341 (13.0%) |
Income Above Poverty by Sex and Age in St. James Parish
According to the poverty statistics in St. James Parish, males aged 5 years and females aged 15 years are the age groups that are most secure financially, with 100.0% of males and 100.0% of females in these age groups living above the poverty line.
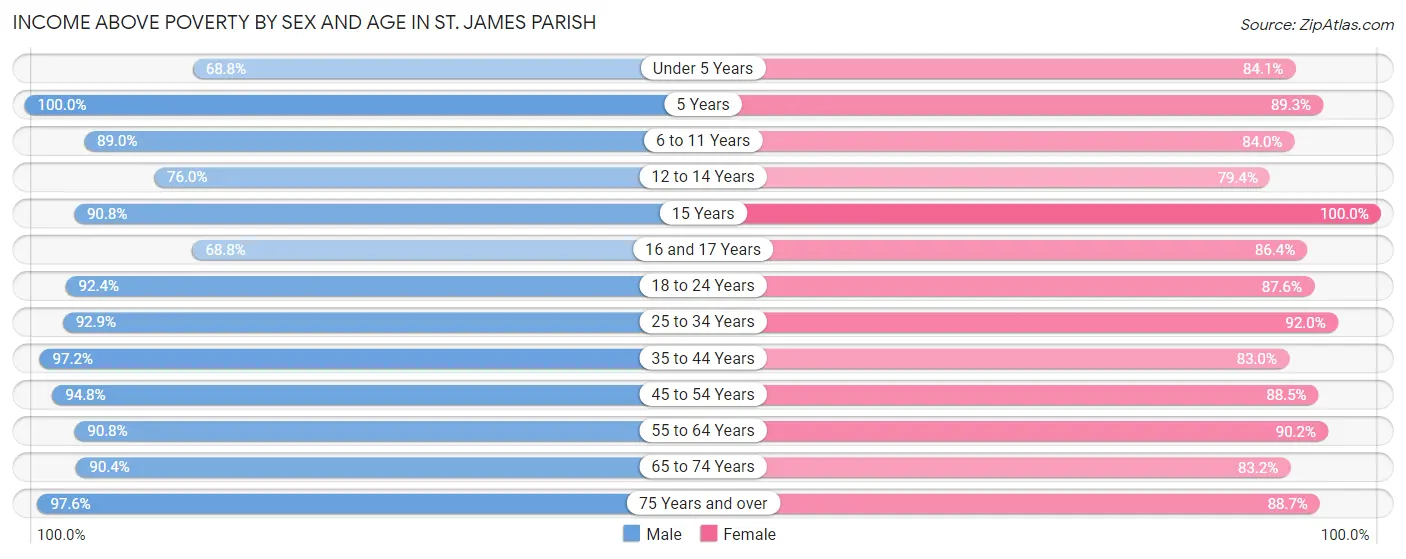
| Age Bracket | Male | Female |
| Under 5 Years | 412 (68.8%) | 472 (84.1%) |
| 5 Years | 56 (100.0%) | 167 (89.3%) |
| 6 to 11 Years | 701 (89.0%) | 566 (84.0%) |
| 12 to 14 Years | 300 (75.9%) | 278 (79.4%) |
| 15 Years | 109 (90.8%) | 187 (100.0%) |
| 16 and 17 Years | 190 (68.8%) | 228 (86.4%) |
| 18 to 24 Years | 726 (92.4%) | 685 (87.6%) |
| 25 to 34 Years | 971 (92.9%) | 1,014 (92.0%) |
| 35 to 44 Years | 1,354 (97.2%) | 1,227 (83.0%) |
| 45 to 54 Years | 1,010 (94.8%) | 1,074 (88.5%) |
| 55 to 64 Years | 1,317 (90.8%) | 1,344 (90.2%) |
| 65 to 74 Years | 930 (90.4%) | 965 (83.2%) |
| 75 Years and over | 573 (97.6%) | 769 (88.7%) |
| Total | 8,649 (90.2%) | 8,976 (87.0%) |
Income Below Poverty Among Married-Couple Families in St. James Parish
The poverty statistics for married-couple families in St. James Parish show that 2.2% or 84 of the total 3,783 families live below the poverty line. Families with no children have the highest poverty rate of 2.4%, comprising of 54 families. On the other hand, families with 3 or 4 children have the lowest poverty rate of 1.8%, which includes 5 families.
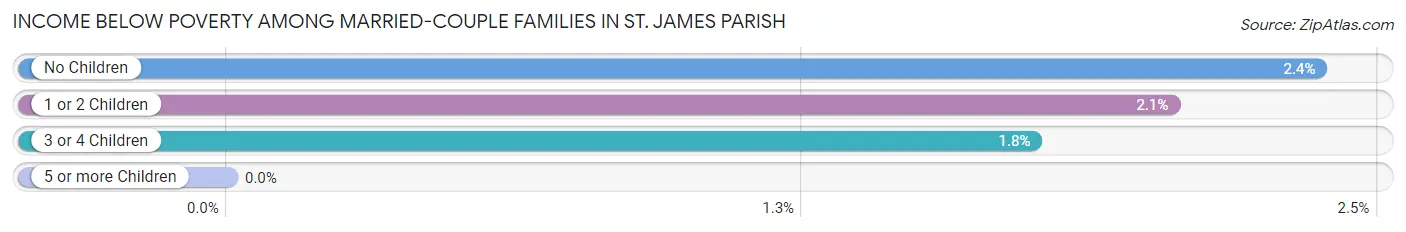
| Children | Above Poverty | Below Poverty |
| No Children | 2,225 (97.6%) | 54 (2.4%) |
| 1 or 2 Children | 1,193 (98.0%) | 25 (2.1%) |
| 3 or 4 Children | 281 (98.3%) | 5 (1.8%) |
| 5 or more Children | 0 (0.0%) | 0 (0.0%) |
| Total | 3,699 (97.8%) | 84 (2.2%) |
Income Below Poverty Among Single-Parent Households in St. James Parish
According to the poverty data in St. James Parish, 4.1% or 14 single-father households and 24.7% or 354 single-mother households are living below the poverty line. Among single-father households, those with 1 or 2 children have the highest poverty rate, with 14 households (10.0%) experiencing poverty. Likewise, among single-mother households, those with 3 or 4 children have the highest poverty rate, with 111 households (54.1%) falling below the poverty line.
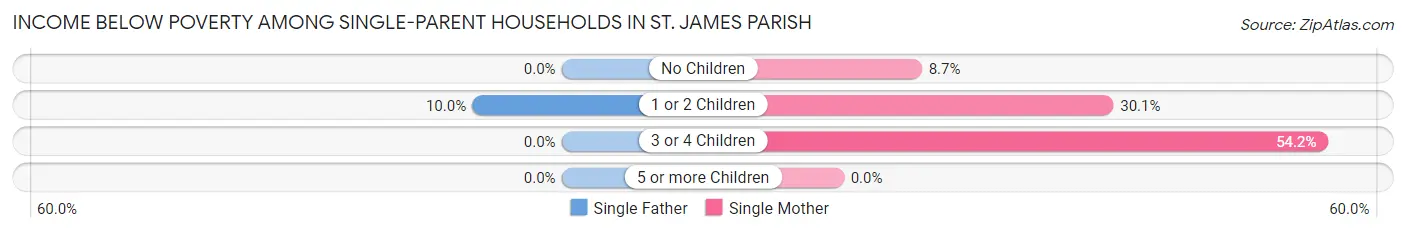
| Children | Single Father | Single Mother |
| No Children | 0 (0.0%) | 52 (8.7%) |
| 1 or 2 Children | 14 (10.0%) | 191 (30.1%) |
| 3 or 4 Children | 0 (0.0%) | 111 (54.1%) |
| 5 or more Children | 0 (0.0%) | 0 (0.0%) |
| Total | 14 (4.1%) | 354 (24.7%) |
Income Below Poverty Among Married-Couple vs Single-Parent Households in St. James Parish
The poverty data for St. James Parish shows that 84 of the married-couple family households (2.2%) and 368 of the single-parent households (20.7%) are living below the poverty level. Within the married-couple family households, those with no children have the highest poverty rate, with 54 households (2.4%) falling below the poverty line. Among the single-parent households, those with 3 or 4 children have the highest poverty rate, with 111 household (51.1%) living below poverty.
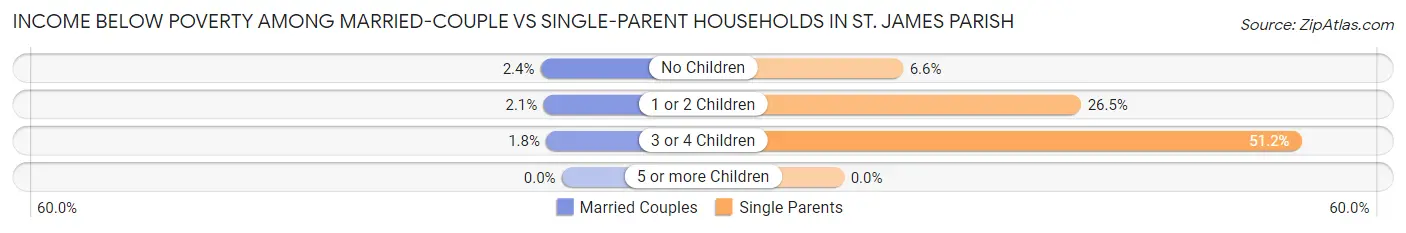
| Children | Married-Couple Families | Single-Parent Households |
| No Children | 54 (2.4%) | 52 (6.6%) |
| 1 or 2 Children | 25 (2.1%) | 205 (26.5%) |
| 3 or 4 Children | 5 (1.8%) | 111 (51.1%) |
| 5 or more Children | 0 (0.0%) | 0 (0.0%) |
| Total | 84 (2.2%) | 368 (20.7%) |
Race in St. James Parish
The most populous races in St. James Parish are White / Caucasian (9,938 | 49.5%), Black / African American (9,732 | 48.4%), and Hispanic or Latino (371 | 1.8%).
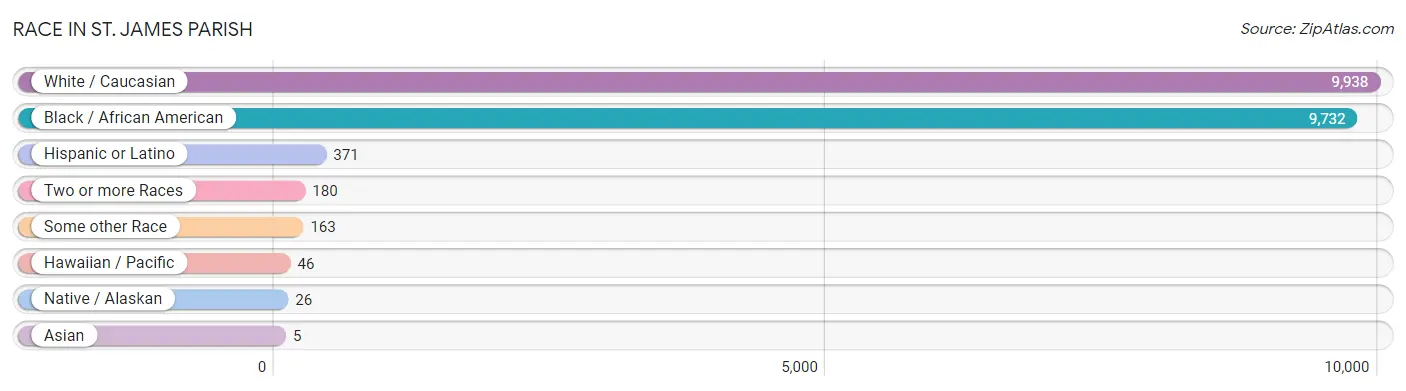
| Race | # Population | % Population |
| Asian | 5 | 0.0% |
| Black / African American | 9,732 | 48.4% |
| Hawaiian / Pacific | 46 | 0.2% |
| Hispanic or Latino | 371 | 1.8% |
| Native / Alaskan | 26 | 0.1% |
| White / Caucasian | 9,938 | 49.5% |
| Two or more Races | 180 | 0.9% |
| Some other Race | 163 | 0.8% |
| Total | 20,090 | 100.0% |
Ancestry in St. James Parish
The most populous ancestries reported in St. James Parish are American (3,151 | 15.7%), French (2,268 | 11.3%), German (1,251 | 6.2%), English (506 | 2.5%), and French Canadian (290 | 1.4%), together accounting for 37.2% of all St. James Parish residents.
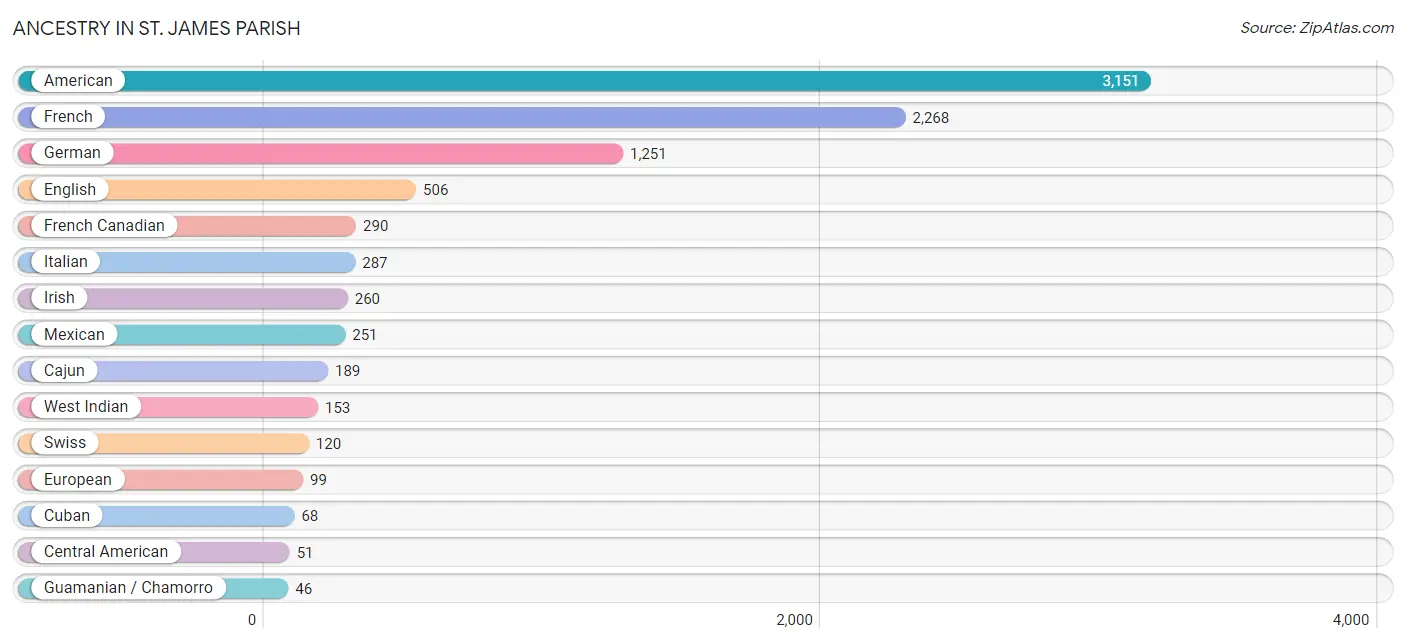
| Ancestry | # Population | % Population |
| African | 13 | 0.1% |
| American | 3,151 | 15.7% |
| Belizean | 12 | 0.1% |
| Cajun | 189 | 0.9% |
| Canadian | 27 | 0.1% |
| Central American | 51 | 0.3% |
| Choctaw | 8 | 0.0% |
| Cuban | 68 | 0.3% |
| Czech | 10 | 0.1% |
| Czechoslovakian | 18 | 0.1% |
| Dutch | 6 | 0.0% |
| English | 506 | 2.5% |
| European | 99 | 0.5% |
| French | 2,268 | 11.3% |
| French Canadian | 290 | 1.4% |
| German | 1,251 | 6.2% |
| Greek | 15 | 0.1% |
| Guamanian / Chamorro | 46 | 0.2% |
| Hungarian | 5 | 0.0% |
| Indian (Asian) | 18 | 0.1% |
| Irish | 260 | 1.3% |
| Italian | 287 | 1.4% |
| Korean | 5 | 0.0% |
| Mexican | 251 | 1.3% |
| Nicaraguan | 34 | 0.2% |
| Panamanian | 17 | 0.1% |
| Polish | 37 | 0.2% |
| Portuguese | 23 | 0.1% |
| Scotch-Irish | 6 | 0.0% |
| Scottish | 17 | 0.1% |
| Sierra Leonean | 4 | 0.0% |
| Spanish | 1 | 0.0% |
| Subsaharan African | 31 | 0.2% |
| Swiss | 120 | 0.6% |
| Welsh | 7 | 0.0% |
| West Indian | 153 | 0.8% | View All 36 Rows |
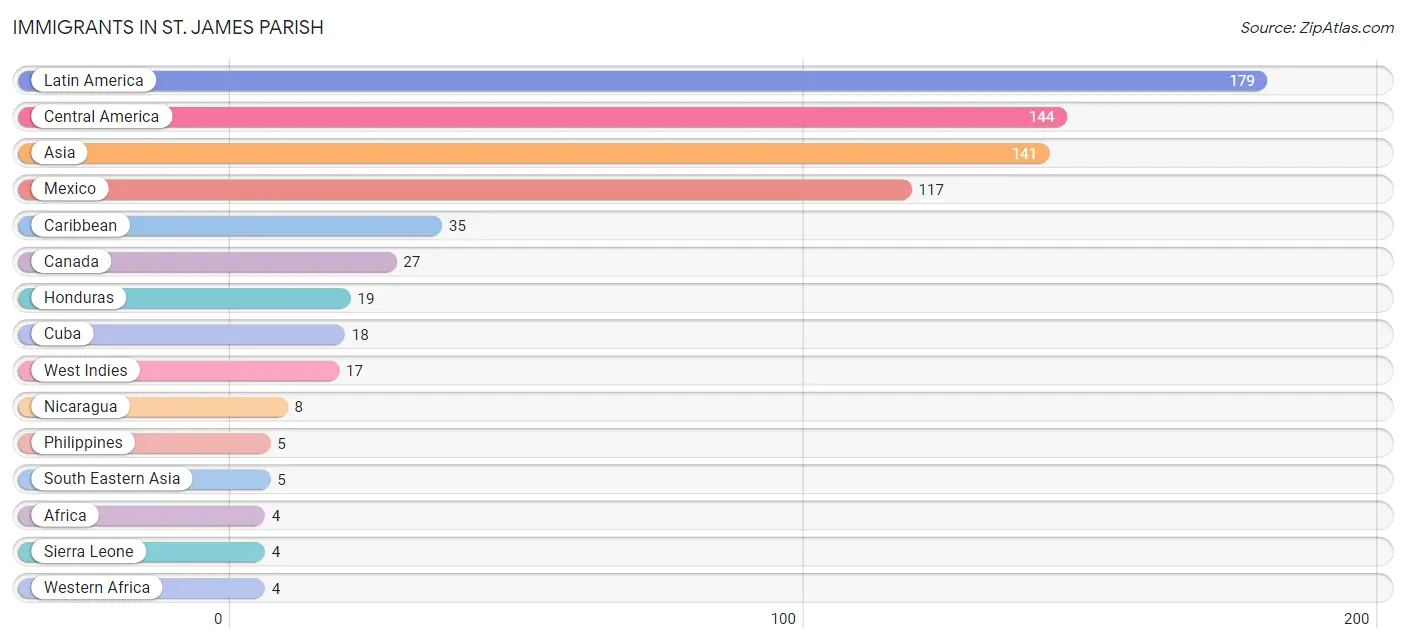
Immigrants in St. James Parish
The most numerous immigrant groups reported in St. James Parish came from Latin America (179 | 0.9%), Central America (144 | 0.7%), Asia (141 | 0.7%), Mexico (117 | 0.6%), and Caribbean (35 | 0.2%), together accounting for 3.1% of all St. James Parish residents.
| Immigration Origin | # Population | % Population |
| Africa | 4 | 0.0% |
| Asia | 141 | 0.7% |
| Canada | 27 | 0.1% |
| Caribbean | 35 | 0.2% |
| Central America | 144 | 0.7% |
| Cuba | 18 | 0.1% |
| Honduras | 19 | 0.1% |
| Latin America | 179 | 0.9% |
| Mexico | 117 | 0.6% |
| Nicaragua | 8 | 0.0% |
| Philippines | 5 | 0.0% |
| Sierra Leone | 4 | 0.0% |
| South Eastern Asia | 5 | 0.0% |
| West Indies | 17 | 0.1% |
| Western Africa | 4 | 0.0% | View All 15 Rows |
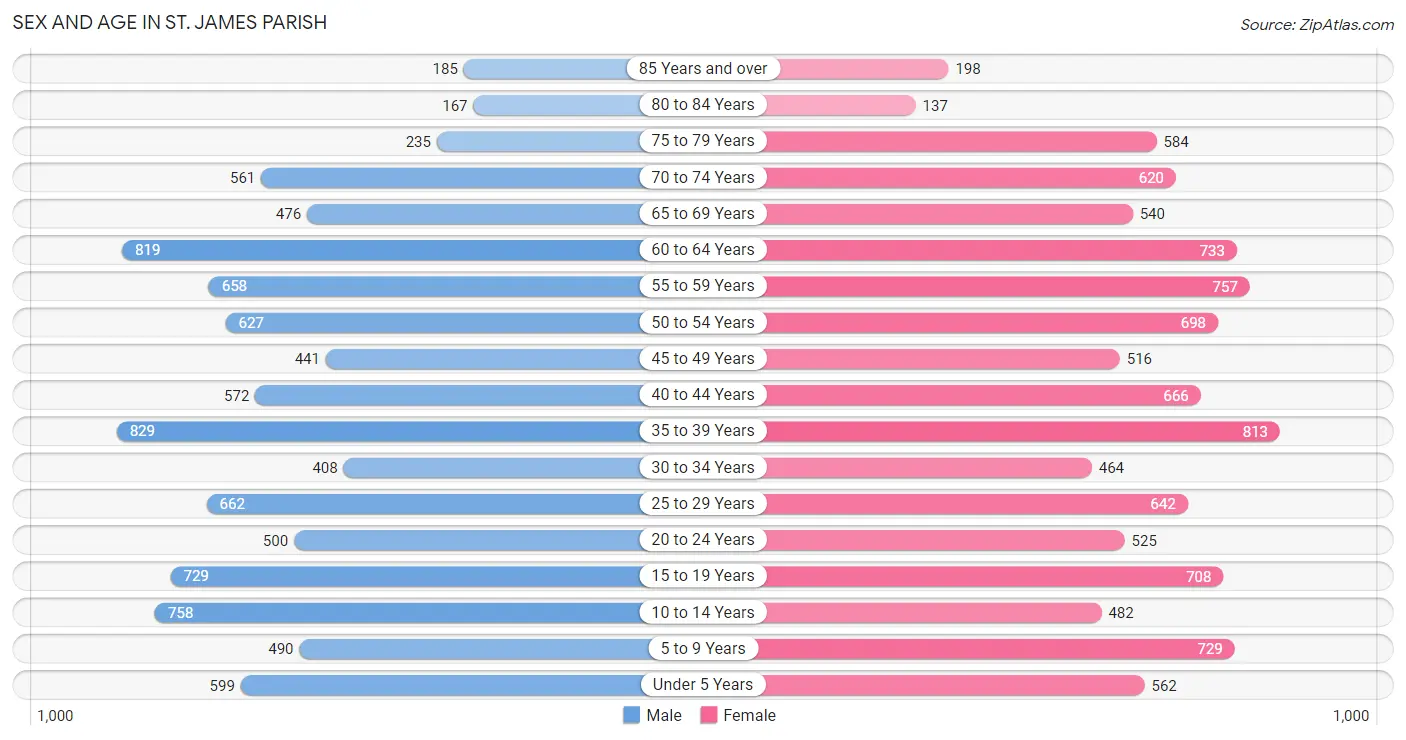
Sex and Age in St. James Parish
Sex and Age in St. James Parish
The most populous age groups in St. James Parish are 35 to 39 Years (829 | 8.5%) for men and 35 to 39 Years (813 | 7.8%) for women.
| Age Bracket | Male | Female |
| Under 5 Years | 599 (6.2%) | 562 (5.4%) |
| 5 to 9 Years | 490 (5.0%) | 729 (7.0%) |
| 10 to 14 Years | 758 (7.8%) | 482 (4.6%) |
| 15 to 19 Years | 729 (7.5%) | 708 (6.8%) |
| 20 to 24 Years | 500 (5.1%) | 525 (5.1%) |
| 25 to 29 Years | 662 (6.8%) | 642 (6.2%) |
| 30 to 34 Years | 408 (4.2%) | 464 (4.5%) |
| 35 to 39 Years | 829 (8.5%) | 813 (7.8%) |
| 40 to 44 Years | 572 (5.9%) | 666 (6.4%) |
| 45 to 49 Years | 441 (4.5%) | 516 (5.0%) |
| 50 to 54 Years | 627 (6.5%) | 698 (6.7%) |
| 55 to 59 Years | 658 (6.8%) | 757 (7.3%) |
| 60 to 64 Years | 819 (8.4%) | 733 (7.1%) |
| 65 to 69 Years | 476 (4.9%) | 540 (5.2%) |
| 70 to 74 Years | 561 (5.8%) | 620 (6.0%) |
| 75 to 79 Years | 235 (2.4%) | 584 (5.6%) |
| 80 to 84 Years | 167 (1.7%) | 137 (1.3%) |
| 85 Years and over | 185 (1.9%) | 198 (1.9%) |
| Total | 9,716 (100.0%) | 10,374 (100.0%) |
Families and Households in St. James Parish
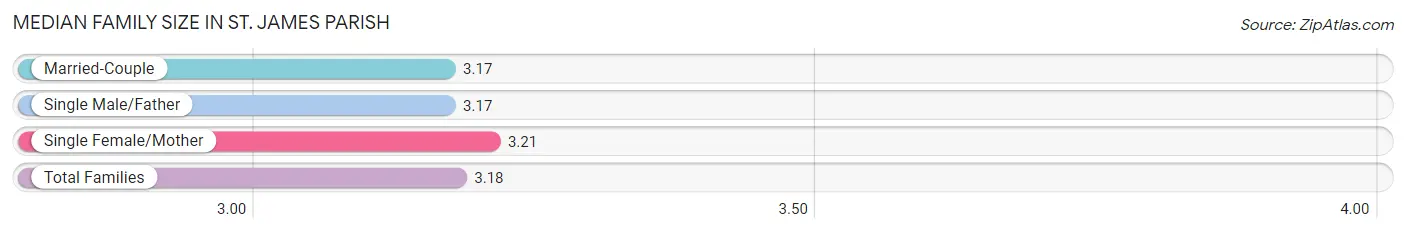
Median Family Size in St. James Parish
The median family size in St. James Parish is 3.18 persons per family, with single female/mother families (1,435 | 25.8%) accounting for the largest median family size of 3.21 persons per family. On the other hand, married-couple families (3,783 | 68.0%) represent the smallest median family size with 3.17 persons per family.
| Family Type | # Families | Family Size |
| Married-Couple | 3,783 (68.0%) | 3.17 |
| Single Male/Father | 344 (6.2%) | 3.17 |
| Single Female/Mother | 1,435 (25.8%) | 3.21 |
| Total Families | 5,562 (100.0%) | 3.18 |
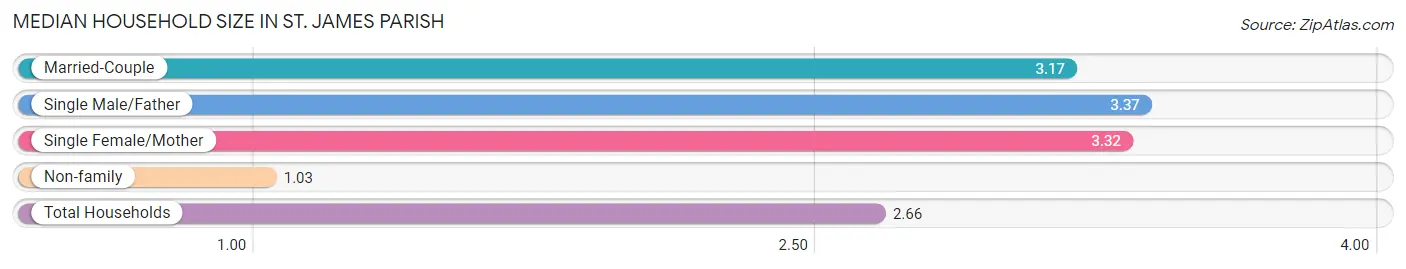
Median Household Size in St. James Parish
The median household size in St. James Parish is 2.66 persons per household, with single male/father households (344 | 4.6%) accounting for the largest median household size of 3.37 persons per household. non-family households (1,936 | 25.8%) represent the smallest median household size with 1.03 persons per household.
| Household Type | # Households | Household Size |
| Married-Couple | 3,783 (50.4%) | 3.17 |
| Single Male/Father | 344 (4.6%) | 3.37 |
| Single Female/Mother | 1,435 (19.1%) | 3.32 |
| Non-family | 1,936 (25.8%) | 1.03 |
| Total Households | 7,498 (100.0%) | 2.66 |
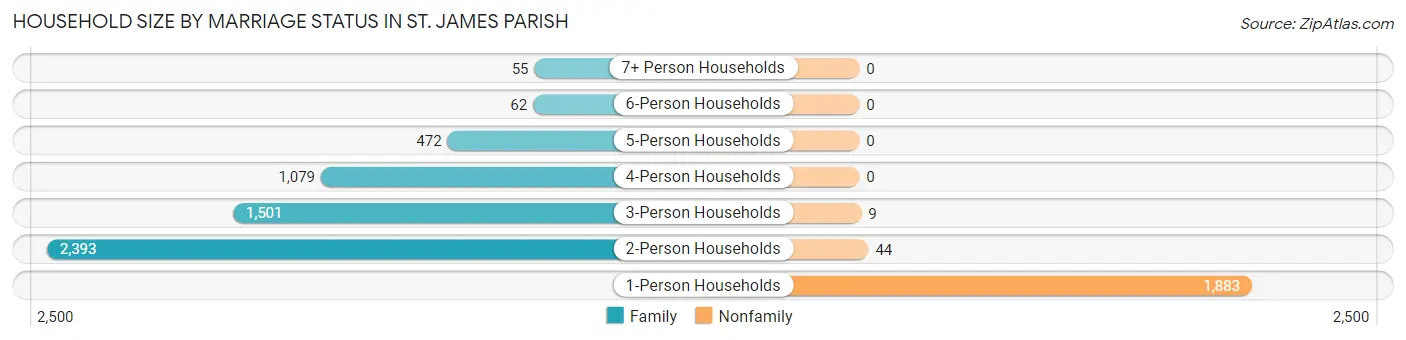
Household Size by Marriage Status in St. James Parish
Out of a total of 7,498 households in St. James Parish, 5,562 (74.2%) are family households, while 1,936 (25.8%) are nonfamily households. The most numerous type of family households are 2-person households, comprising 2,393, and the most common type of nonfamily households are 1-person households, comprising 1,883.
| Household Size | Family Households | Nonfamily Households |
| 1-Person Households | - | 1,883 (25.1%) |
| 2-Person Households | 2,393 (31.9%) | 44 (0.6%) |
| 3-Person Households | 1,501 (20.0%) | 9 (0.1%) |
| 4-Person Households | 1,079 (14.4%) | 0 (0.0%) |
| 5-Person Households | 472 (6.3%) | 0 (0.0%) |
| 6-Person Households | 62 (0.8%) | 0 (0.0%) |
| 7+ Person Households | 55 (0.7%) | 0 (0.0%) |
| Total | 5,562 (74.2%) | 1,936 (25.8%) |
Female Fertility in St. James Parish
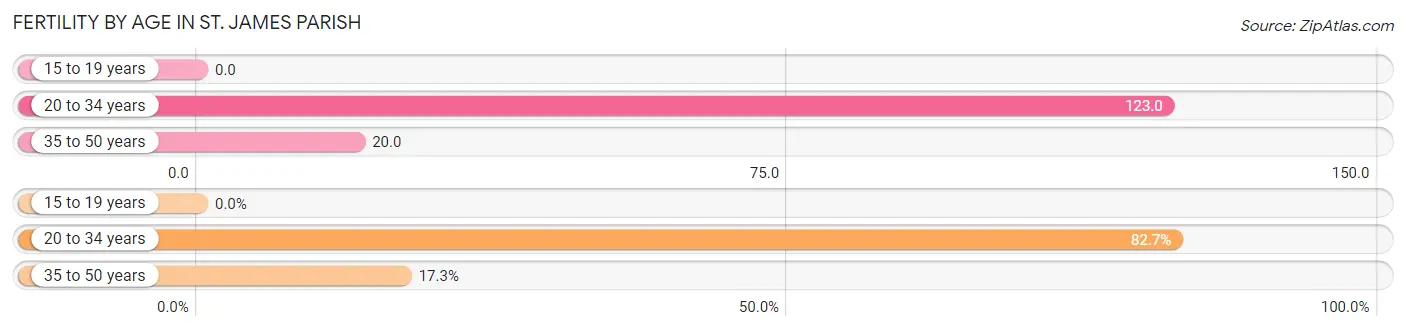
Fertility by Age in St. James Parish
Average fertility rate in St. James Parish is 55.0 births per 1,000 women. Women in the age bracket of 20 to 34 years have the highest fertility rate with 123.0 births per 1,000 women. Women in the age bracket of 20 to 34 years acount for 82.7% of all women with births.
| Age Bracket | Women with Births | Births / 1,000 Women |
| 15 to 19 years | 0 (0.0%) | 0.0 |
| 20 to 34 years | 201 (82.7%) | 123.0 |
| 35 to 50 years | 42 (17.3%) | 20.0 |
| Total | 243 (100.0%) | 55.0 |
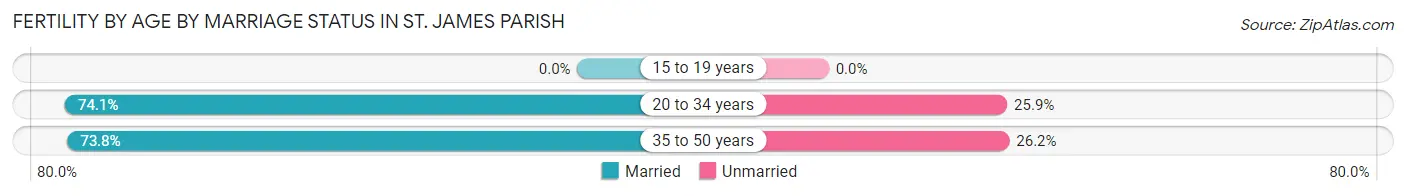
Fertility by Age by Marriage Status in St. James Parish
74.1% of women with births (243) in St. James Parish are married. The highest percentage of unmarried women with births falls into 35 to 50 years age bracket with 26.2% of them unmarried at the time of birth, while the lowest percentage of unmarried women with births belong to 20 to 34 years age bracket with 25.9% of them unmarried.
| Age Bracket | Married | Unmarried |
| 15 to 19 years | 0 (0.0%) | 0 (0.0%) |
| 20 to 34 years | 149 (74.1%) | 52 (25.9%) |
| 35 to 50 years | 31 (73.8%) | 11 (26.2%) |
| Total | 180 (74.1%) | 63 (25.9%) |
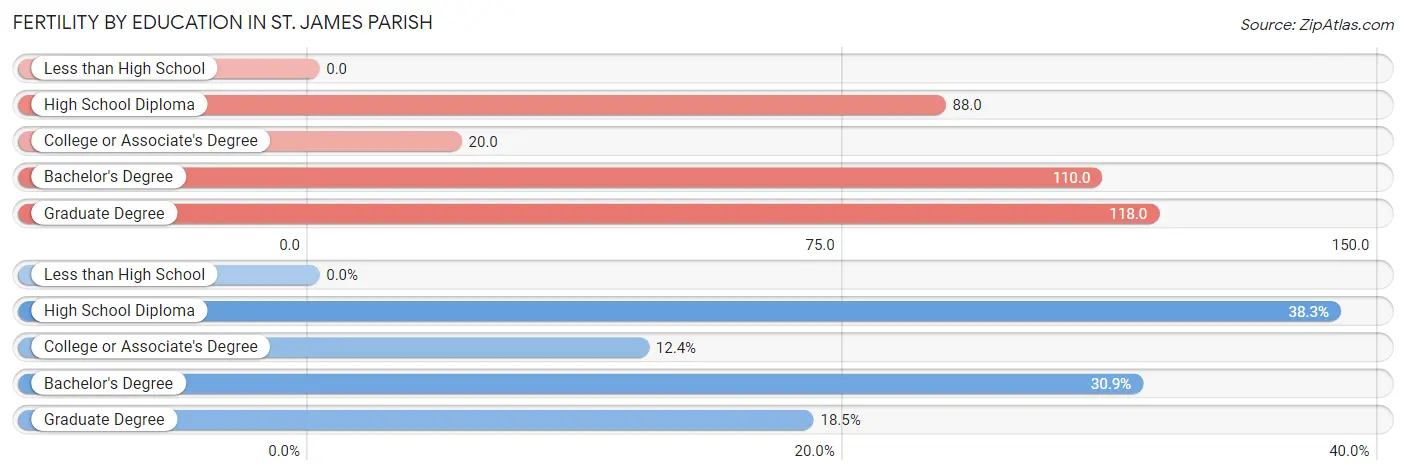
Fertility by Education in St. James Parish
| Educational Attainment | Women with Births | Births / 1,000 Women |
| Less than High School | 0 (0.0%) | 0.0 |
| High School Diploma | 93 (38.3%) | 88.0 |
| College or Associate's Degree | 30 (12.3%) | 20.0 |
| Bachelor's Degree | 75 (30.9%) | 110.0 |
| Graduate Degree | 45 (18.5%) | 118.0 |
| Total | 243 (100.0%) | 55.0 |
Fertility by Education by Marriage Status in St. James Parish
25.9% of women with births in St. James Parish are unmarried. Women with the educational attainment of college or associate's degree are most likely to be married with 100.0% of them married at childbirth, while women with the educational attainment of high school diploma are least likely to be married with 55.9% of them unmarried at childbirth.
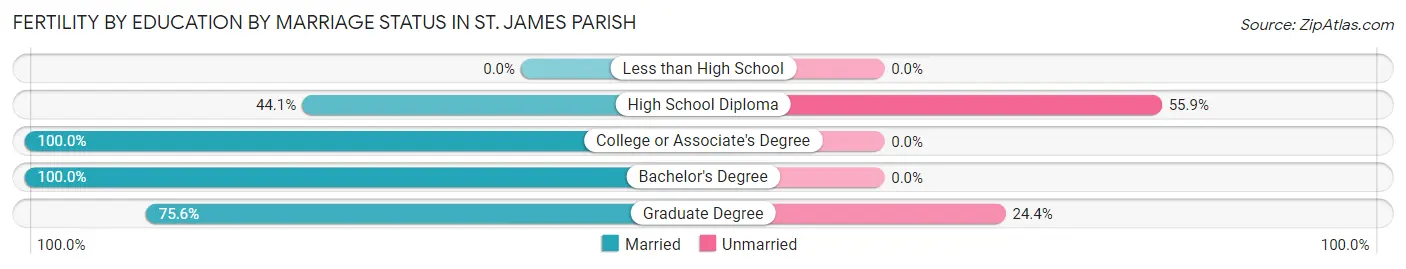
| Educational Attainment | Married | Unmarried |
| Less than High School | 0 (0.0%) | 0 (0.0%) |
| High School Diploma | 41 (44.1%) | 52 (55.9%) |
| College or Associate's Degree | 30 (100.0%) | 0 (0.0%) |
| Bachelor's Degree | 75 (100.0%) | 0 (0.0%) |
| Graduate Degree | 34 (75.6%) | 11 (24.4%) |
| Total | 180 (74.1%) | 63 (25.9%) |
Employment Characteristics in St. James Parish
Employment by Class of Employer in St. James Parish
Among the 8,729 employed individuals in St. James Parish, private company employees (6,600 | 75.6%), local government employees (790 | 9.0%), and self-employed (not incorporated) (359 | 4.1%) make up the most common classes of employment.
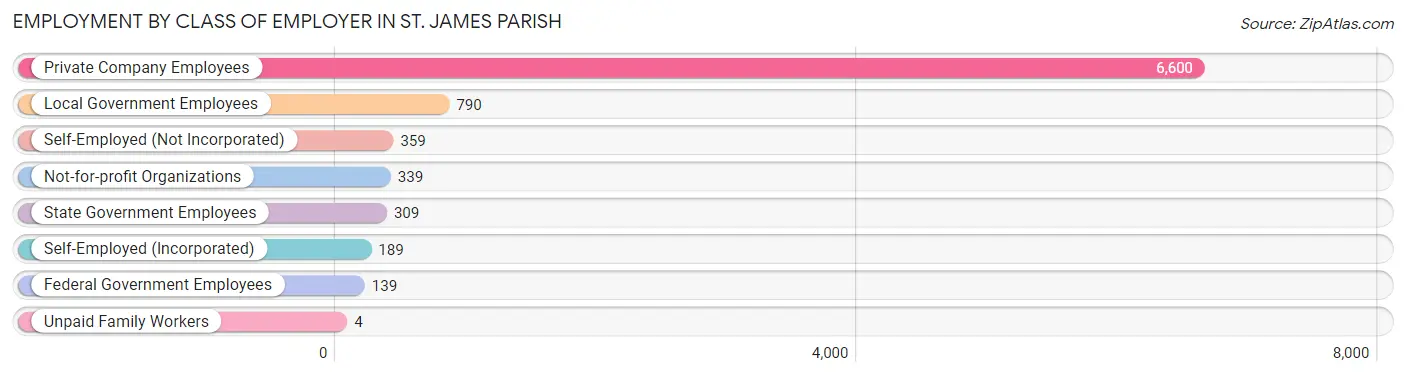
| Employer Class | # Employees | % Employees |
| Private Company Employees | 6,600 | 75.6% |
| Self-Employed (Incorporated) | 189 | 2.2% |
| Self-Employed (Not Incorporated) | 359 | 4.1% |
| Not-for-profit Organizations | 339 | 3.9% |
| Local Government Employees | 790 | 9.0% |
| State Government Employees | 309 | 3.5% |
| Federal Government Employees | 139 | 1.6% |
| Unpaid Family Workers | 4 | 0.1% |
| Total | 8,729 | 100.0% |
Employment Status by Age in St. James Parish
According to the labor force statistics for St. James Parish, out of the total population over 16 years of age (16,163), 57.9% or 9,358 individuals are in the labor force, with 3.6% or 337 of them unemployed. The age group with the highest labor force participation rate is 30 to 34 years, with 95.5% or 833 individuals in the labor force. Within the labor force, the 16 to 19 years age range has the highest percentage of unemployed individuals, with 10.5% or 49 of them being unemployed.
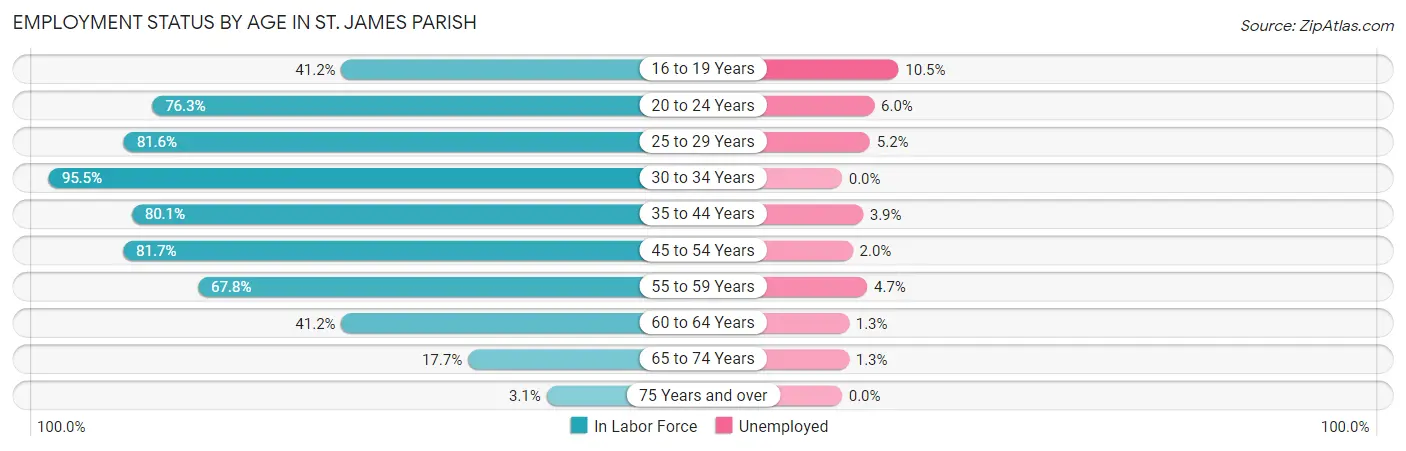
| Age Bracket | In Labor Force | Unemployed |
| 16 to 19 Years | 466 (41.2%) | 49 (10.5%) |
| 20 to 24 Years | 782 (76.3%) | 47 (6.0%) |
| 25 to 29 Years | 1,064 (81.6%) | 55 (5.2%) |
| 30 to 34 Years | 833 (95.5%) | 0 (0.0%) |
| 35 to 44 Years | 2,307 (80.1%) | 90 (3.9%) |
| 45 to 54 Years | 1,864 (81.7%) | 37 (2.0%) |
| 55 to 59 Years | 959 (67.8%) | 45 (4.7%) |
| 60 to 64 Years | 639 (41.2%) | 8 (1.3%) |
| 65 to 74 Years | 389 (17.7%) | 5 (1.3%) |
| 75 Years and over | 47 (3.1%) | 0 (0.0%) |
| Total | 9,358 (57.9%) | 337 (3.6%) |
Employment Status by Educational Attainment in St. James Parish
According to labor force statistics for St. James Parish, 74.4% of individuals (7,667) out of the total population between 25 and 64 years of age (10,305) are in the labor force, with 3.1% or 238 of them being unemployed. The group with the highest labor force participation rate are those with the educational attainment of bachelor's degree or higher, with 86.2% or 1,793 individuals in the labor force. Within the labor force, individuals with less than high school education have the highest percentage of unemployment, with 16.4% or 66 of them being unemployed.
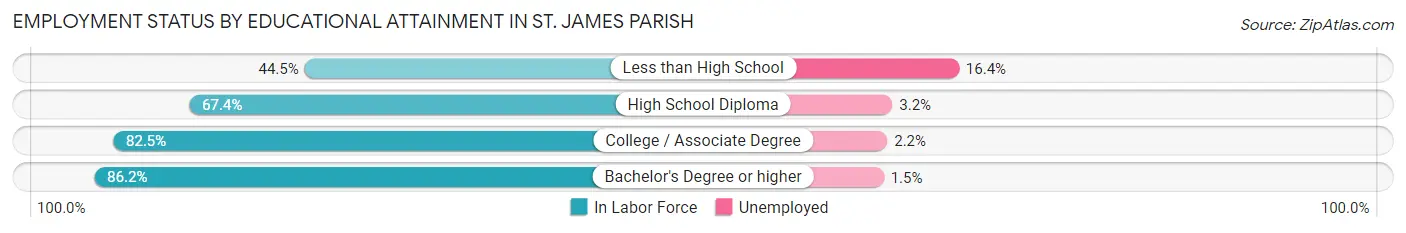
| Educational Attainment | In Labor Force | Unemployed |
| Less than High School | 403 (44.5%) | 149 (16.4%) |
| High School Diploma | 2,515 (67.4%) | 119 (3.2%) |
| College / Associate Degree | 2,960 (82.5%) | 79 (2.2%) |
| Bachelor's Degree or higher | 1,793 (86.2%) | 31 (1.5%) |
| Total | 7,667 (74.4%) | 319 (3.1%) |
Employment Occupations by Sex in St. James Parish
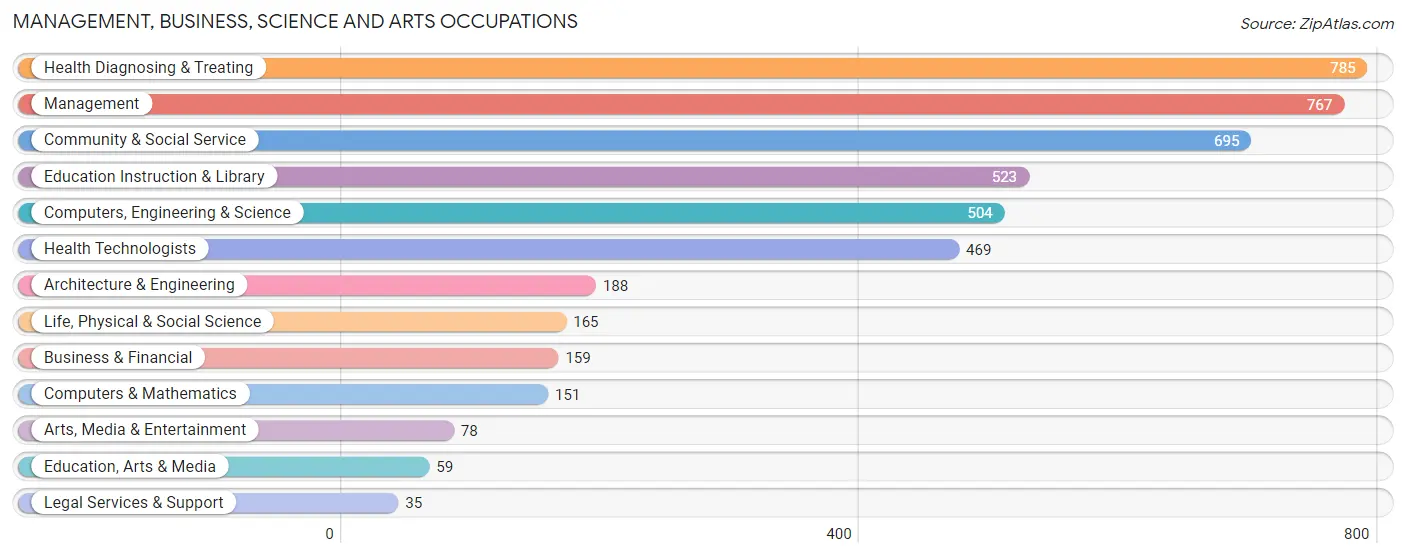
Management, Business, Science and Arts Occupations
The most common Management, Business, Science and Arts occupations in St. James Parish are Health Diagnosing & Treating (785 | 8.7%), Management (767 | 8.5%), Community & Social Service (695 | 7.7%), Education Instruction & Library (523 | 5.8%), and Computers, Engineering & Science (504 | 5.6%).
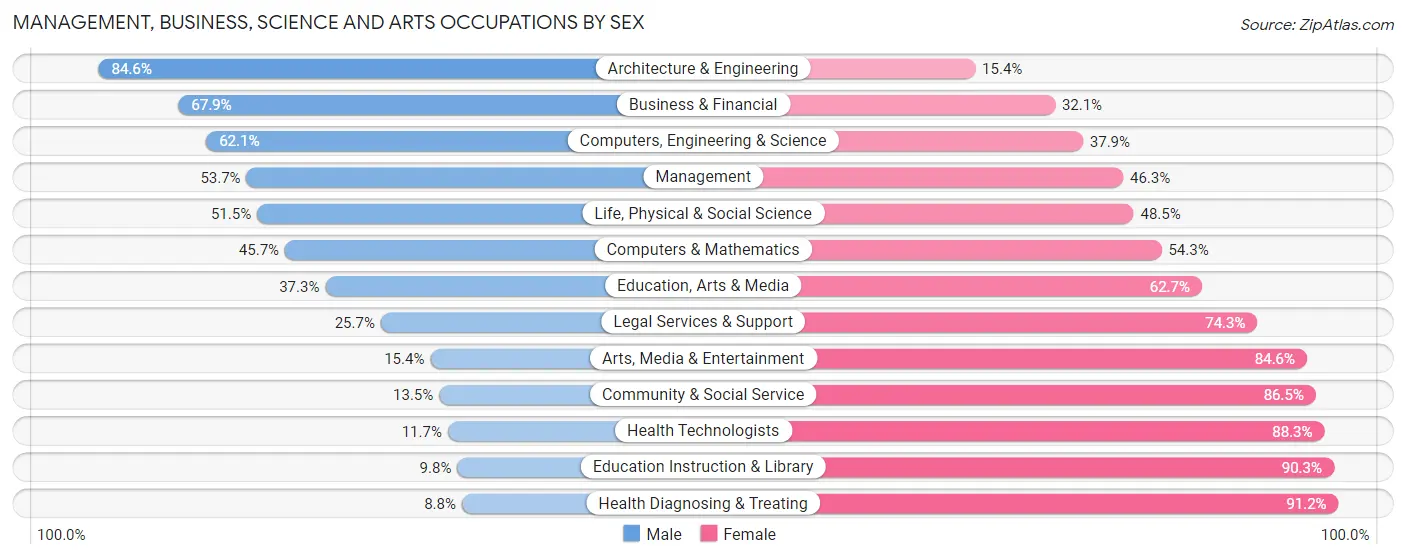
Management, Business, Science and Arts Occupations by Sex
Within the Management, Business, Science and Arts occupations in St. James Parish, the most male-oriented occupations are Architecture & Engineering (84.6%), Business & Financial (67.9%), and Computers, Engineering & Science (62.1%), while the most female-oriented occupations are Health Diagnosing & Treating (91.2%), Education Instruction & Library (90.2%), and Health Technologists (88.3%).
| Occupation | Male | Female |
| Management | 412 (53.7%) | 355 (46.3%) |
| Business & Financial | 108 (67.9%) | 51 (32.1%) |
| Computers, Engineering & Science | 313 (62.1%) | 191 (37.9%) |
| Computers & Mathematics | 69 (45.7%) | 82 (54.3%) |
| Architecture & Engineering | 159 (84.6%) | 29 (15.4%) |
| Life, Physical & Social Science | 85 (51.5%) | 80 (48.5%) |
| Community & Social Service | 94 (13.5%) | 601 (86.5%) |
| Education, Arts & Media | 22 (37.3%) | 37 (62.7%) |
| Legal Services & Support | 9 (25.7%) | 26 (74.3%) |
| Education Instruction & Library | 51 (9.8%) | 472 (90.2%) |
| Arts, Media & Entertainment | 12 (15.4%) | 66 (84.6%) |
| Health Diagnosing & Treating | 69 (8.8%) | 716 (91.2%) |
| Health Technologists | 55 (11.7%) | 414 (88.3%) |
| Total (Category) | 996 (34.2%) | 1,914 (65.8%) |
| Total (Overall) | 4,442 (49.3%) | 4,573 (50.7%) |
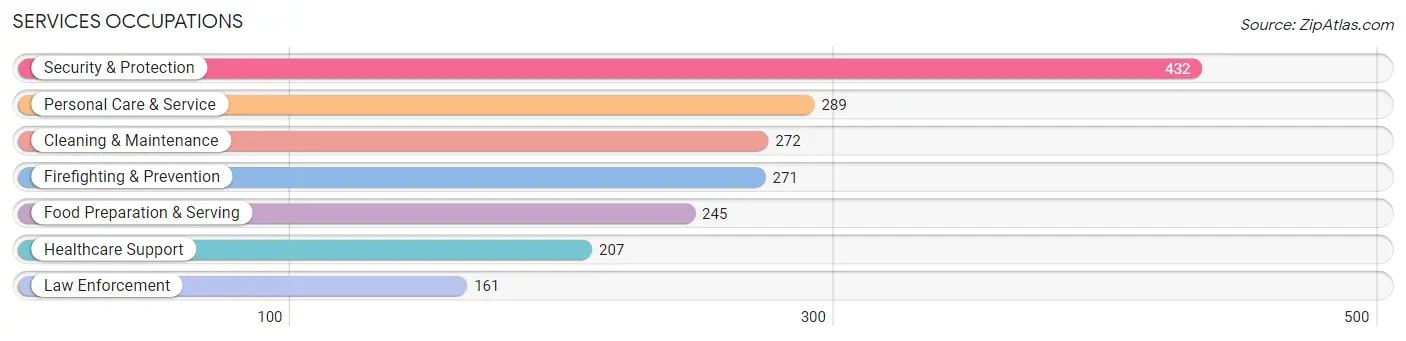
Services Occupations
The most common Services occupations in St. James Parish are Security & Protection (432 | 4.8%), Personal Care & Service (289 | 3.2%), Cleaning & Maintenance (272 | 3.0%), Firefighting & Prevention (271 | 3.0%), and Food Preparation & Serving (245 | 2.7%).
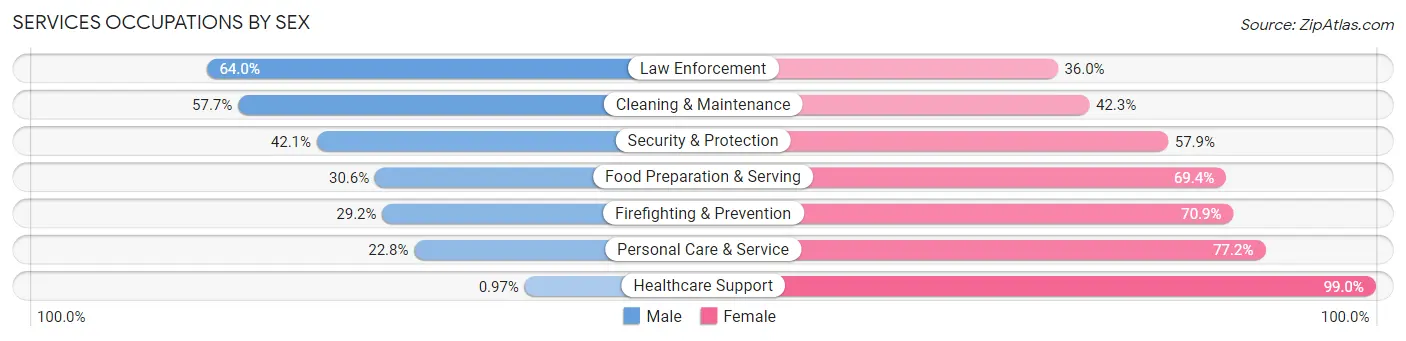
Services Occupations by Sex
Within the Services occupations in St. James Parish, the most male-oriented occupations are Law Enforcement (64.0%), Cleaning & Maintenance (57.7%), and Security & Protection (42.1%), while the most female-oriented occupations are Healthcare Support (99.0%), Personal Care & Service (77.2%), and Firefighting & Prevention (70.9%).
| Occupation | Male | Female |
| Healthcare Support | 2 (1.0%) | 205 (99.0%) |
| Security & Protection | 182 (42.1%) | 250 (57.9%) |
| Firefighting & Prevention | 79 (29.1%) | 192 (70.9%) |
| Law Enforcement | 103 (64.0%) | 58 (36.0%) |
| Food Preparation & Serving | 75 (30.6%) | 170 (69.4%) |
| Cleaning & Maintenance | 157 (57.7%) | 115 (42.3%) |
| Personal Care & Service | 66 (22.8%) | 223 (77.2%) |
| Total (Category) | 482 (33.4%) | 963 (66.6%) |
| Total (Overall) | 4,442 (49.3%) | 4,573 (50.7%) |
Sales and Office Occupations
The most common Sales and Office occupations in St. James Parish are Office & Administration (908 | 10.1%), and Sales & Related (854 | 9.5%).

Sales and Office Occupations by Sex

| Occupation | Male | Female |
| Sales & Related | 223 (26.1%) | 631 (73.9%) |
| Office & Administration | 145 (16.0%) | 763 (84.0%) |
| Total (Category) | 368 (20.9%) | 1,394 (79.1%) |
| Total (Overall) | 4,442 (49.3%) | 4,573 (50.7%) |
Natural Resources, Construction and Maintenance Occupations
The most common Natural Resources, Construction and Maintenance occupations in St. James Parish are Construction & Extraction (475 | 5.3%), Installation, Maintenance & Repair (380 | 4.2%), and Farming, Fishing & Forestry (102 | 1.1%).
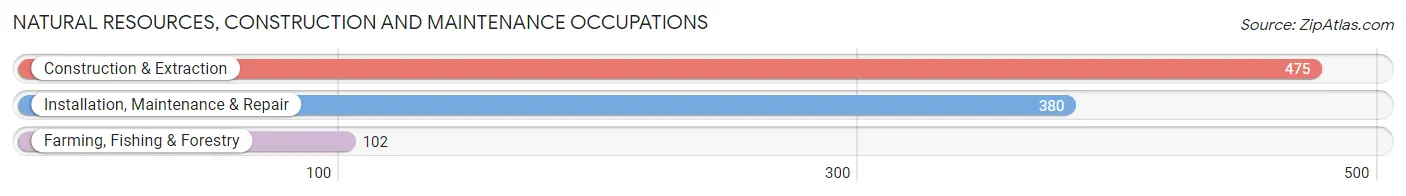
Natural Resources, Construction and Maintenance Occupations by Sex

| Occupation | Male | Female |
| Farming, Fishing & Forestry | 85 (83.3%) | 17 (16.7%) |
| Construction & Extraction | 395 (83.2%) | 80 (16.8%) |
| Installation, Maintenance & Repair | 380 (100.0%) | 0 (0.0%) |
| Total (Category) | 860 (89.9%) | 97 (10.1%) |
| Total (Overall) | 4,442 (49.3%) | 4,573 (50.7%) |
Production, Transportation and Moving Occupations
The most common Production, Transportation and Moving occupations in St. James Parish are Production (1,077 | 11.9%), Material Moving (460 | 5.1%), and Transportation (404 | 4.5%).
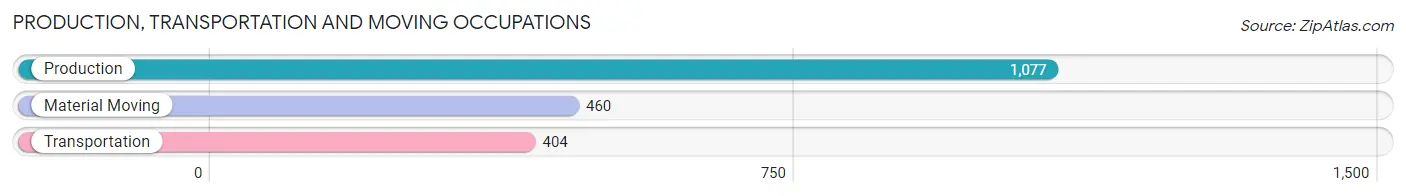
Production, Transportation and Moving Occupations by Sex
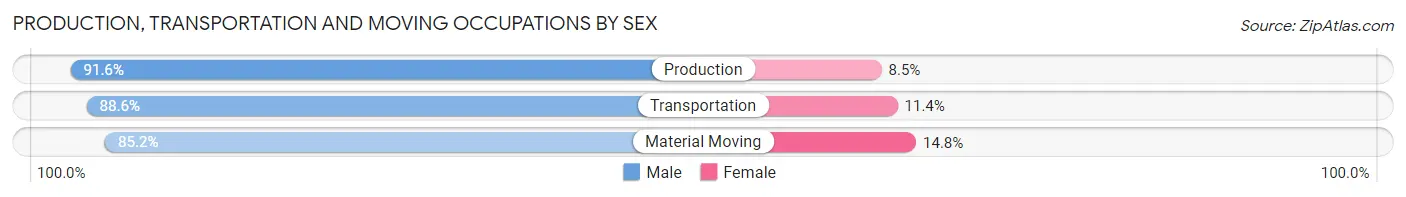
| Occupation | Male | Female |
| Production | 986 (91.5%) | 91 (8.5%) |
| Transportation | 358 (88.6%) | 46 (11.4%) |
| Material Moving | 392 (85.2%) | 68 (14.8%) |
| Total (Category) | 1,736 (89.4%) | 205 (10.6%) |
| Total (Overall) | 4,442 (49.3%) | 4,573 (50.7%) |
Employment Industries by Sex in St. James Parish
Employment Industries in St. James Parish
The major employment industries in St. James Parish include Manufacturing (1,972 | 21.9%), Retail Trade (1,331 | 14.8%), Health Care & Social Assistance (1,116 | 12.4%), Educational Services (641 | 7.1%), and Transportation & Warehousing (633 | 7.0%).
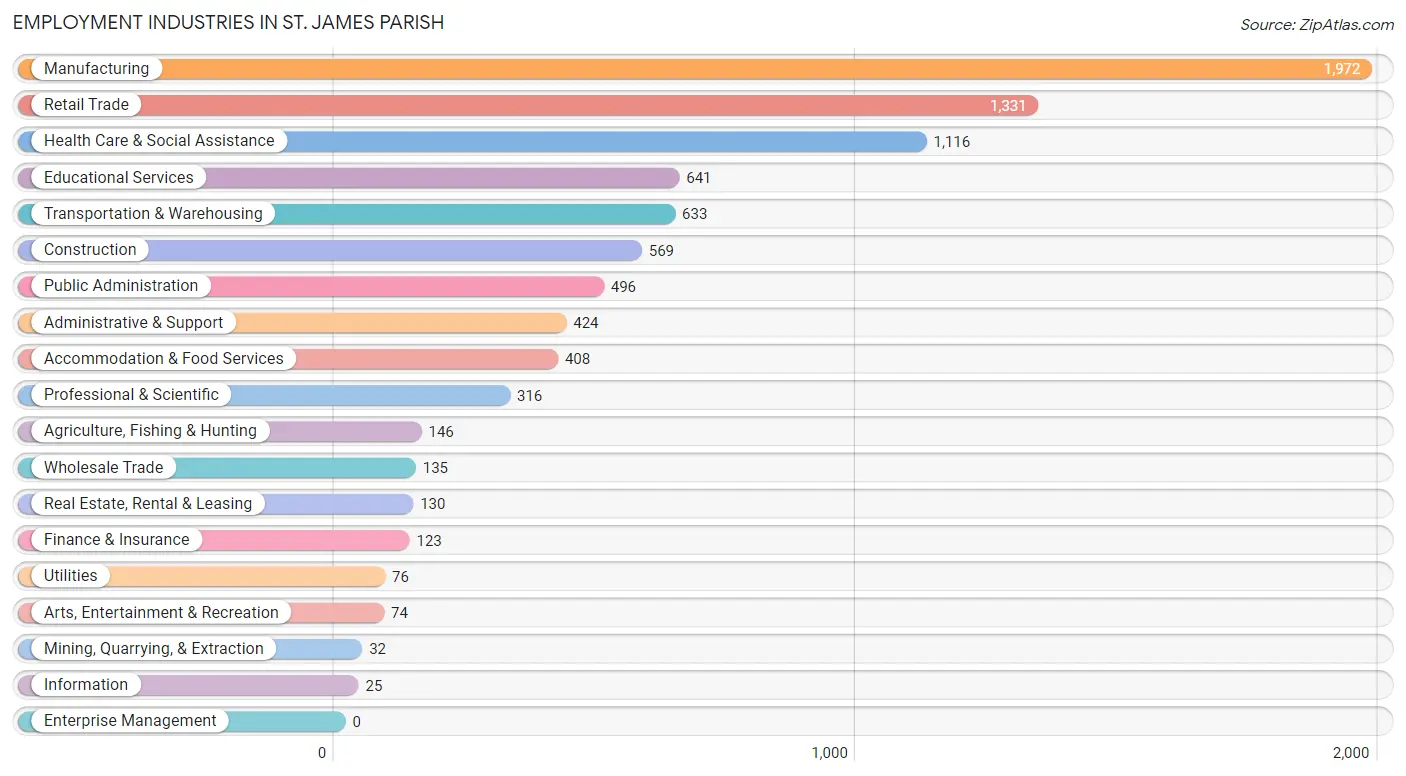
Employment Industries by Sex in St. James Parish
The St. James Parish industries that see more men than women are Mining, Quarrying, & Extraction (100.0%), Utilities (81.6%), and Manufacturing (81.1%), whereas the industries that tend to have a higher number of women are Information (100.0%), Health Care & Social Assistance (95.2%), and Real Estate, Rental & Leasing (90.0%).
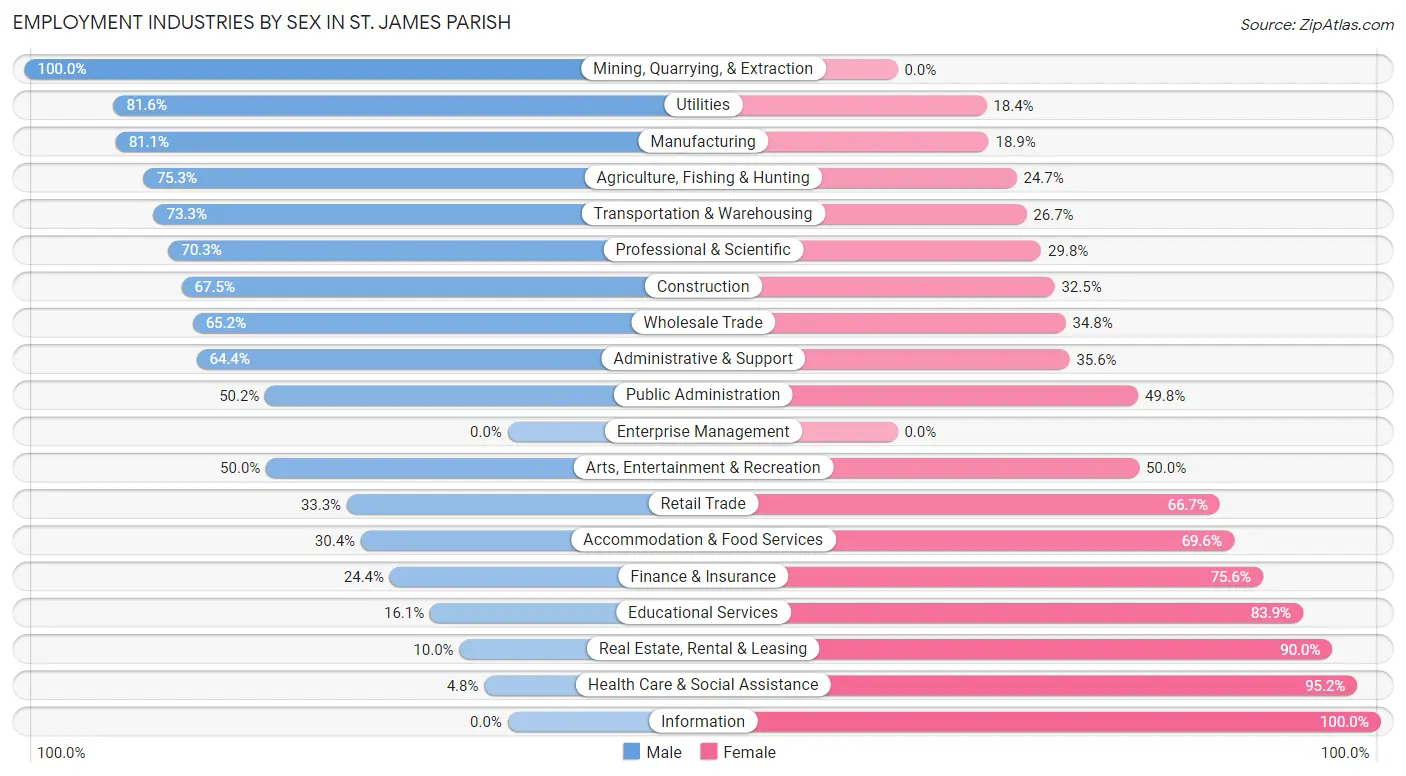
| Industry | Male | Female |
| Agriculture, Fishing & Hunting | 110 (75.3%) | 36 (24.7%) |
| Mining, Quarrying, & Extraction | 32 (100.0%) | 0 (0.0%) |
| Construction | 384 (67.5%) | 185 (32.5%) |
| Manufacturing | 1,600 (81.1%) | 372 (18.9%) |
| Wholesale Trade | 88 (65.2%) | 47 (34.8%) |
| Retail Trade | 443 (33.3%) | 888 (66.7%) |
| Transportation & Warehousing | 464 (73.3%) | 169 (26.7%) |
| Utilities | 62 (81.6%) | 14 (18.4%) |
| Information | 0 (0.0%) | 25 (100.0%) |
| Finance & Insurance | 30 (24.4%) | 93 (75.6%) |
| Real Estate, Rental & Leasing | 13 (10.0%) | 117 (90.0%) |
| Professional & Scientific | 222 (70.3%) | 94 (29.7%) |
| Enterprise Management | 0 (0.0%) | 0 (0.0%) |
| Administrative & Support | 273 (64.4%) | 151 (35.6%) |
| Educational Services | 103 (16.1%) | 538 (83.9%) |
| Health Care & Social Assistance | 54 (4.8%) | 1,062 (95.2%) |
| Arts, Entertainment & Recreation | 37 (50.0%) | 37 (50.0%) |
| Accommodation & Food Services | 124 (30.4%) | 284 (69.6%) |
| Public Administration | 249 (50.2%) | 247 (49.8%) |
| Total | 4,442 (49.3%) | 4,573 (50.7%) |
Education in St. James Parish
School Enrollment in St. James Parish
The most common levels of schooling among the 4,693 students in St. James Parish are high school (1,213 | 25.9%), elementary school (1,013 | 21.6%), and middle school (1,008 | 21.5%).
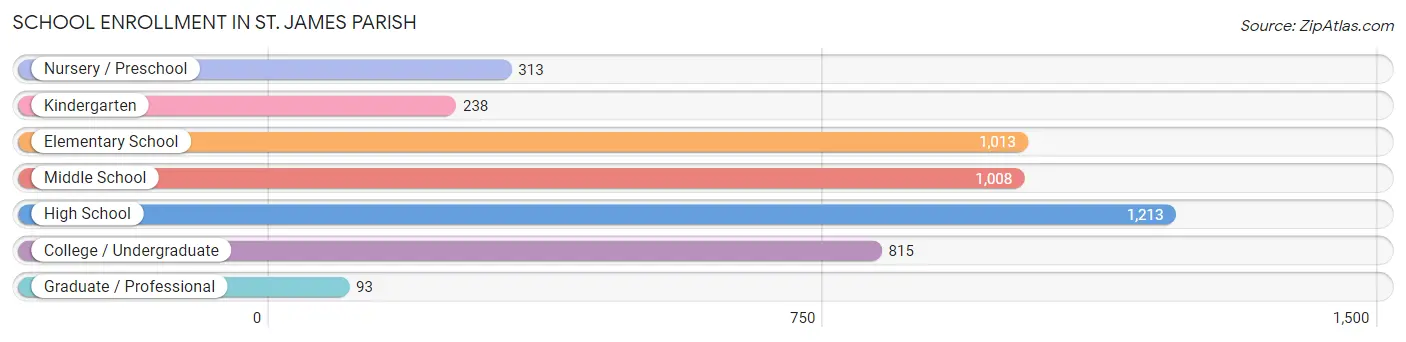
| School Level | # Students | % Students |
| Nursery / Preschool | 313 | 6.7% |
| Kindergarten | 238 | 5.1% |
| Elementary School | 1,013 | 21.6% |
| Middle School | 1,008 | 21.5% |
| High School | 1,213 | 25.9% |
| College / Undergraduate | 815 | 17.4% |
| Graduate / Professional | 93 | 2.0% |
| Total | 4,693 | 100.0% |
School Enrollment by Age by Funding Source in St. James Parish
Out of a total of 4,693 students who are enrolled in schools in St. James Parish, 704 (15.0%) attend a private institution, while the remaining 3,989 (85.0%) are enrolled in public schools. The age group of 3 to 4 year olds has the highest likelihood of being enrolled in private schools, with 140 (41.1% in the age bracket) enrolled. Conversely, the age group of 10 to 14 year olds has the lowest likelihood of being enrolled in a private school, with 1,171 (94.4% in the age bracket) attending a public institution.
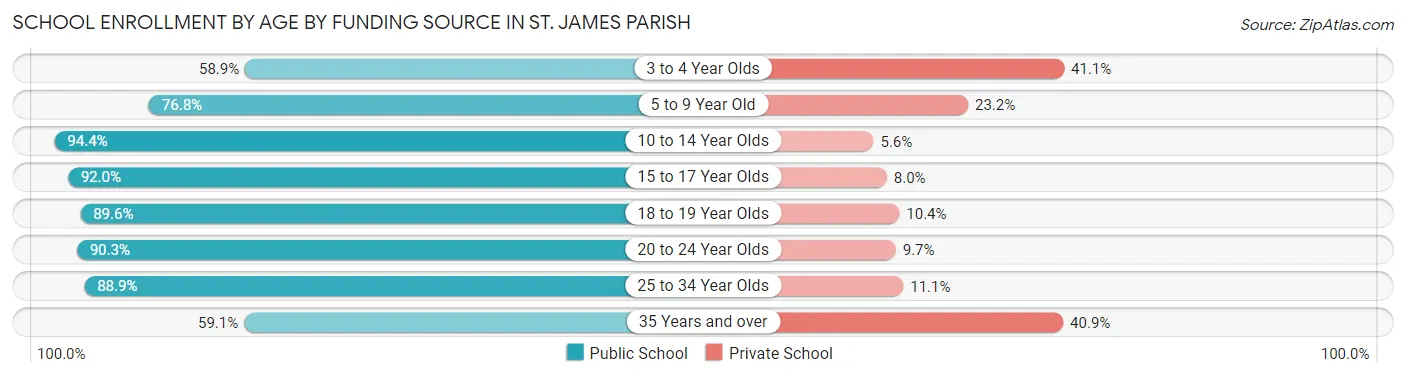
| Age Bracket | Public School | Private School |
| 3 to 4 Year Olds | 201 (58.9%) | 140 (41.1%) |
| 5 to 9 Year Old | 899 (76.8%) | 271 (23.2%) |
| 10 to 14 Year Olds | 1,171 (94.4%) | 69 (5.6%) |
| 15 to 17 Year Olds | 778 (92.0%) | 68 (8.0%) |
| 18 to 19 Year Olds | 389 (89.6%) | 45 (10.4%) |
| 20 to 24 Year Olds | 279 (90.3%) | 30 (9.7%) |
| 25 to 34 Year Olds | 192 (88.9%) | 24 (11.1%) |
| 35 Years and over | 81 (59.1%) | 56 (40.9%) |
| Total | 3,989 (85.0%) | 704 (15.0%) |
Educational Attainment by Field of Study in St. James Parish
Education (569 | 21.0%), science & technology (446 | 16.5%), business (413 | 15.3%), physical & health sciences (230 | 8.5%), and engineering (174 | 6.4%) are the most common fields of study among 2,707 individuals in St. James Parish who have obtained a bachelor's degree or higher.
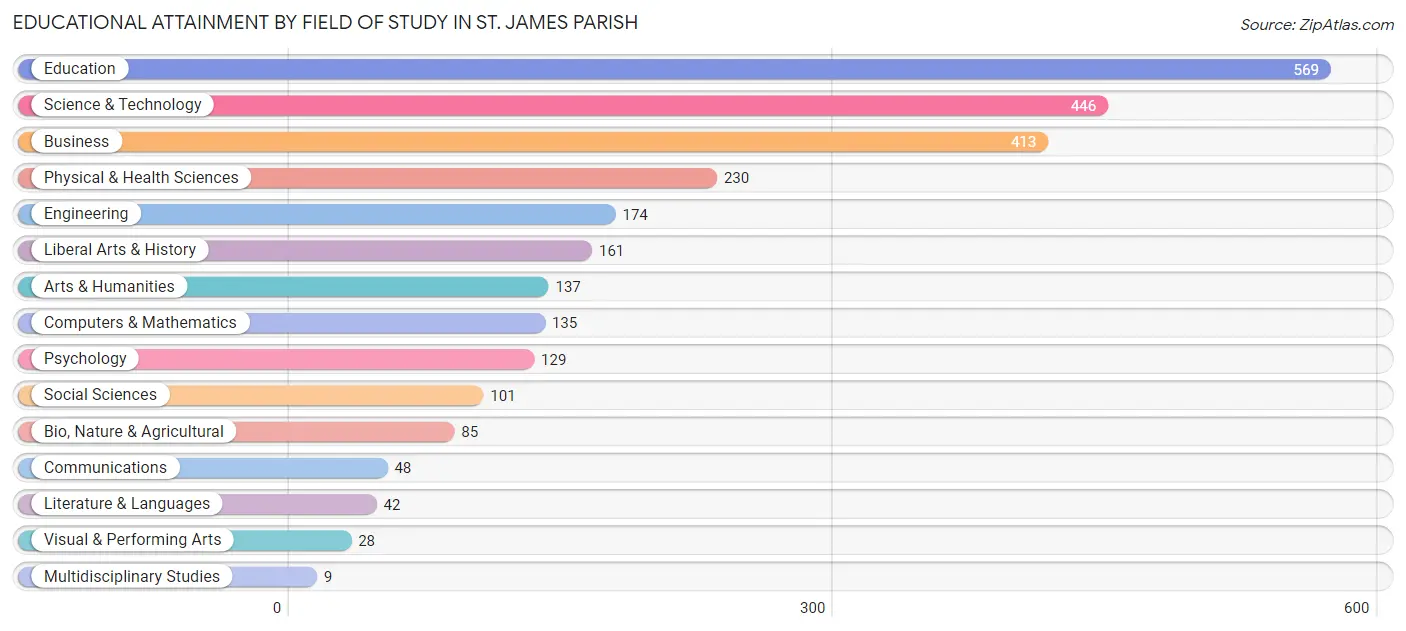
| Field of Study | # Graduates | % Graduates |
| Computers & Mathematics | 135 | 5.0% |
| Bio, Nature & Agricultural | 85 | 3.1% |
| Physical & Health Sciences | 230 | 8.5% |
| Psychology | 129 | 4.8% |
| Social Sciences | 101 | 3.7% |
| Engineering | 174 | 6.4% |
| Multidisciplinary Studies | 9 | 0.3% |
| Science & Technology | 446 | 16.5% |
| Business | 413 | 15.3% |
| Education | 569 | 21.0% |
| Literature & Languages | 42 | 1.5% |
| Liberal Arts & History | 161 | 5.9% |
| Visual & Performing Arts | 28 | 1.0% |
| Communications | 48 | 1.8% |
| Arts & Humanities | 137 | 5.1% |
| Total | 2,707 | 100.0% |
Transportation & Commute in St. James Parish
Vehicle Availability by Sex in St. James Parish
The most prevalent vehicle ownership categories in St. James Parish are males with 2 vehicles (1,430, accounting for 32.6%) and females with 2 vehicles (1,625, making up 32.9%).
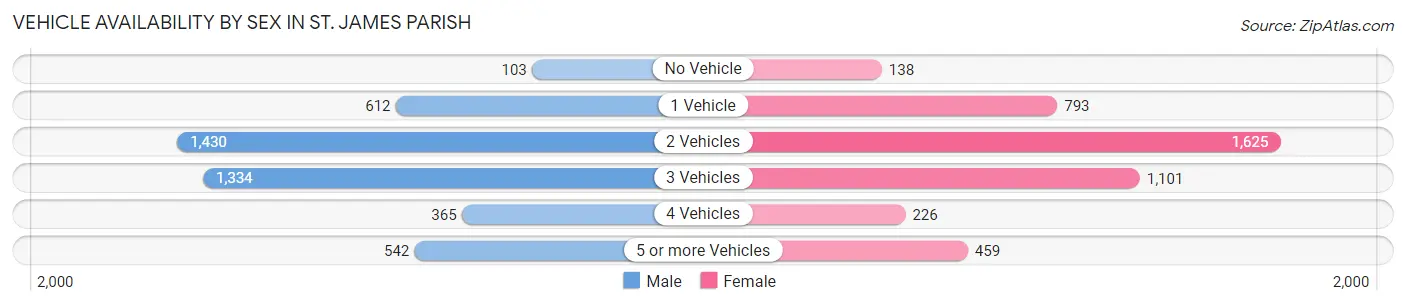
| Vehicles Available | Male | Female |
| No Vehicle | 103 (2.4%) | 138 (3.2%) |
| 1 Vehicle | 612 (14.0%) | 793 (18.3%) |
| 2 Vehicles | 1,430 (32.6%) | 1,625 (37.4%) |
| 3 Vehicles | 1,334 (30.4%) | 1,101 (25.4%) |
| 4 Vehicles | 365 (8.3%) | 226 (5.2%) |
| 5 or more Vehicles | 542 (12.4%) | 459 (10.6%) |
| Total | 4,386 (100.0%) | 4,342 (100.0%) |
Commute Time in St. James Parish
The most frequently occuring commute durations in St. James Parish are 20 to 24 minutes (1,214 commuters, 14.7%), 10 to 14 minutes (1,149 commuters, 13.9%), and 30 to 34 minutes (1,137 commuters, 13.8%).
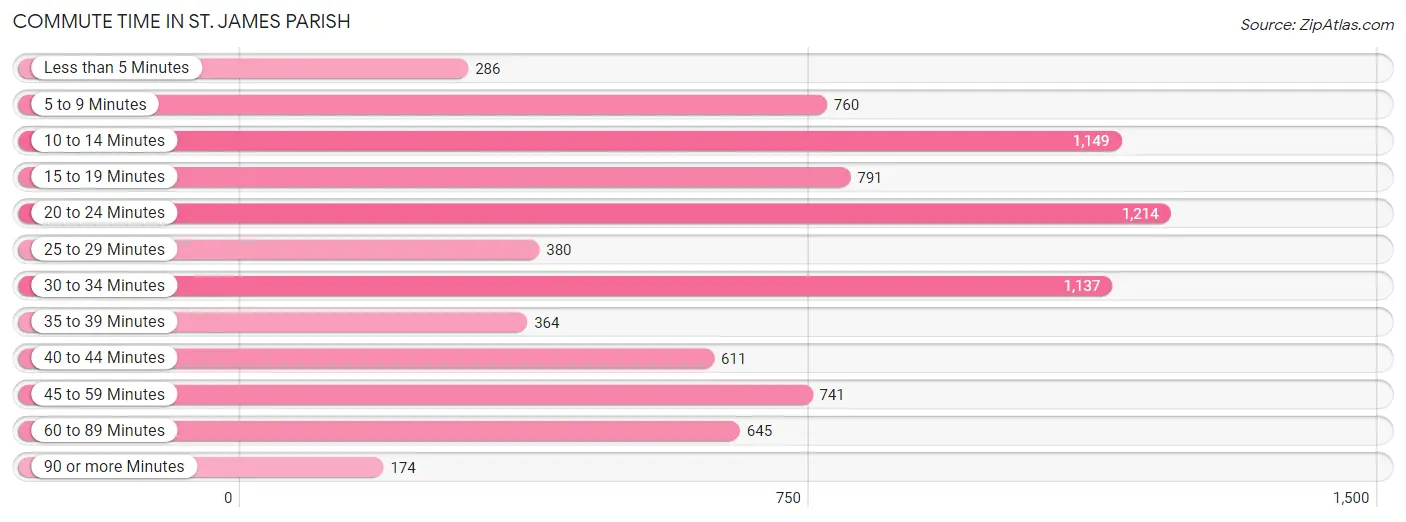
| Commute Time | # Commuters | % Commuters |
| Less than 5 Minutes | 286 | 3.5% |
| 5 to 9 Minutes | 760 | 9.2% |
| 10 to 14 Minutes | 1,149 | 13.9% |
| 15 to 19 Minutes | 791 | 9.6% |
| 20 to 24 Minutes | 1,214 | 14.7% |
| 25 to 29 Minutes | 380 | 4.6% |
| 30 to 34 Minutes | 1,137 | 13.8% |
| 35 to 39 Minutes | 364 | 4.4% |
| 40 to 44 Minutes | 611 | 7.4% |
| 45 to 59 Minutes | 741 | 9.0% |
| 60 to 89 Minutes | 645 | 7.8% |
| 90 or more Minutes | 174 | 2.1% |
Commute Time by Sex in St. James Parish
The most common commute times in St. James Parish are 20 to 24 minutes (904 commuters, 21.5%) for males and 30 to 34 minutes (632 commuters, 15.6%) for females.
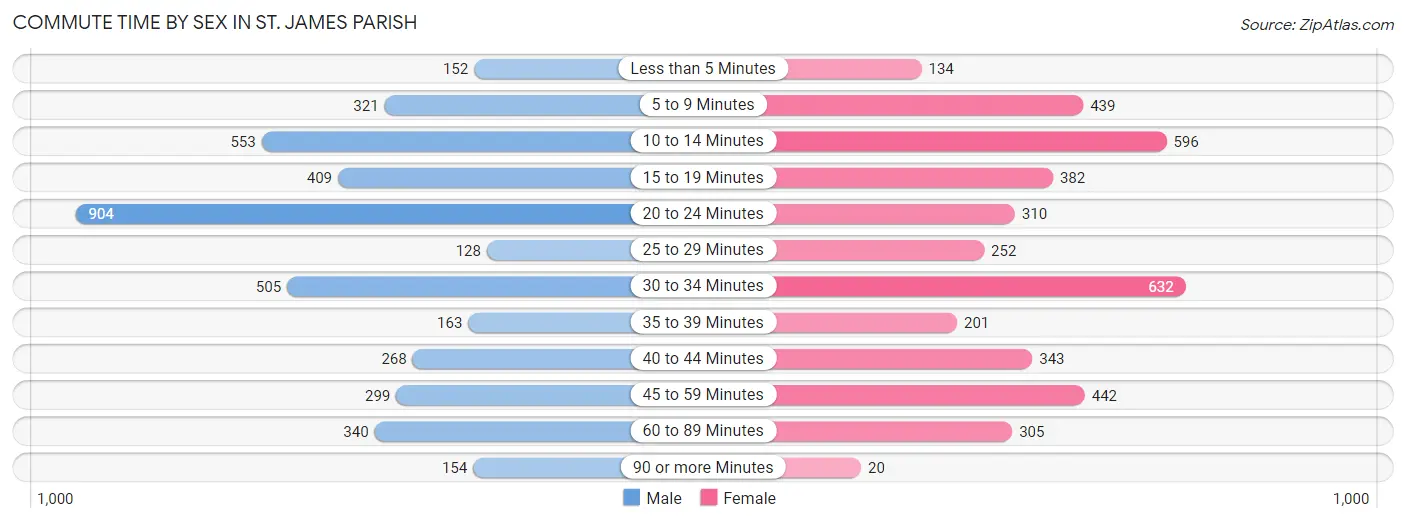
| Commute Time | Male | Female |
| Less than 5 Minutes | 152 (3.6%) | 134 (3.3%) |
| 5 to 9 Minutes | 321 (7.6%) | 439 (10.8%) |
| 10 to 14 Minutes | 553 (13.2%) | 596 (14.7%) |
| 15 to 19 Minutes | 409 (9.8%) | 382 (9.4%) |
| 20 to 24 Minutes | 904 (21.5%) | 310 (7.6%) |
| 25 to 29 Minutes | 128 (3.0%) | 252 (6.2%) |
| 30 to 34 Minutes | 505 (12.0%) | 632 (15.6%) |
| 35 to 39 Minutes | 163 (3.9%) | 201 (5.0%) |
| 40 to 44 Minutes | 268 (6.4%) | 343 (8.5%) |
| 45 to 59 Minutes | 299 (7.1%) | 442 (10.9%) |
| 60 to 89 Minutes | 340 (8.1%) | 305 (7.5%) |
| 90 or more Minutes | 154 (3.7%) | 20 (0.5%) |
Time of Departure to Work by Sex in St. James Parish
The most frequent times of departure to work in St. James Parish are 12:00 AM to 4:59 AM (1,001, 23.9%) for males and 7:00 AM to 7:29 AM (852, 21.0%) for females.
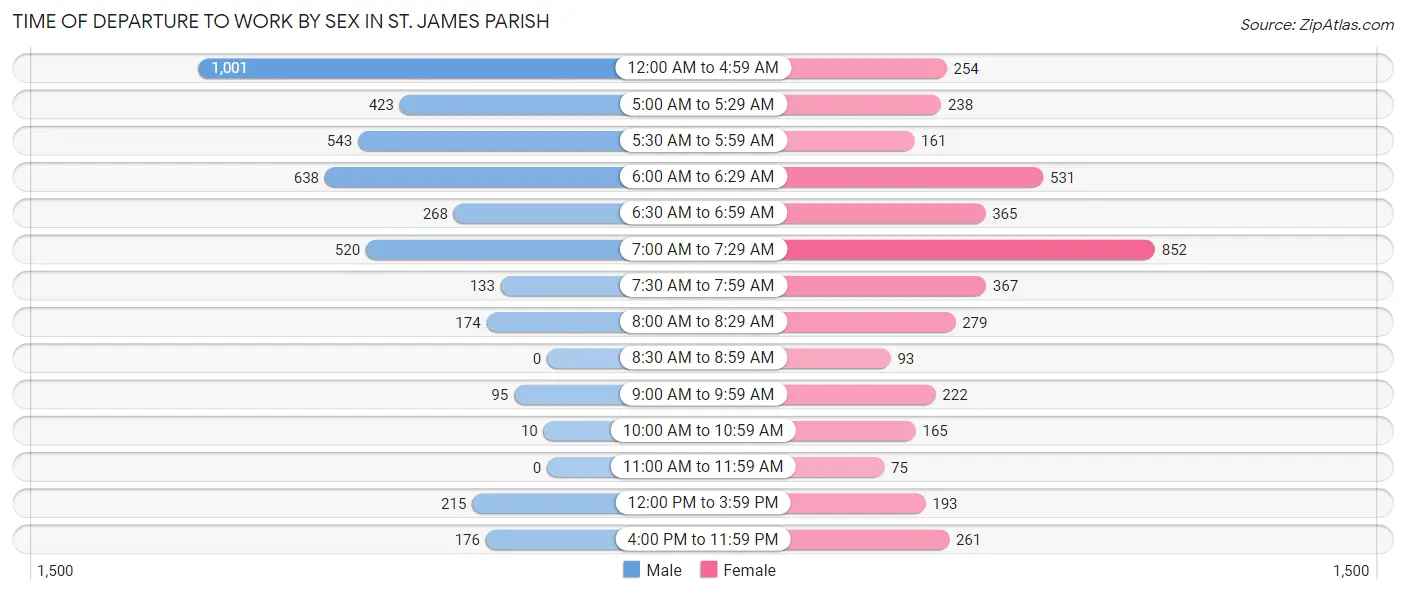
| Time of Departure | Male | Female |
| 12:00 AM to 4:59 AM | 1,001 (23.9%) | 254 (6.3%) |
| 5:00 AM to 5:29 AM | 423 (10.1%) | 238 (5.9%) |
| 5:30 AM to 5:59 AM | 543 (12.9%) | 161 (4.0%) |
| 6:00 AM to 6:29 AM | 638 (15.2%) | 531 (13.1%) |
| 6:30 AM to 6:59 AM | 268 (6.4%) | 365 (9.0%) |
| 7:00 AM to 7:29 AM | 520 (12.4%) | 852 (21.0%) |
| 7:30 AM to 7:59 AM | 133 (3.2%) | 367 (9.0%) |
| 8:00 AM to 8:29 AM | 174 (4.2%) | 279 (6.9%) |
| 8:30 AM to 8:59 AM | 0 (0.0%) | 93 (2.3%) |
| 9:00 AM to 9:59 AM | 95 (2.3%) | 222 (5.5%) |
| 10:00 AM to 10:59 AM | 10 (0.2%) | 165 (4.1%) |
| 11:00 AM to 11:59 AM | 0 (0.0%) | 75 (1.8%) |
| 12:00 PM to 3:59 PM | 215 (5.1%) | 193 (4.8%) |
| 4:00 PM to 11:59 PM | 176 (4.2%) | 261 (6.4%) |
| Total | 4,196 (100.0%) | 4,056 (100.0%) |
Housing Occupancy in St. James Parish
Occupancy by Ownership in St. James Parish
Of the total 7,498 dwellings in St. James Parish, owner-occupied units account for 6,315 (84.2%), while renter-occupied units make up 1,183 (15.8%).
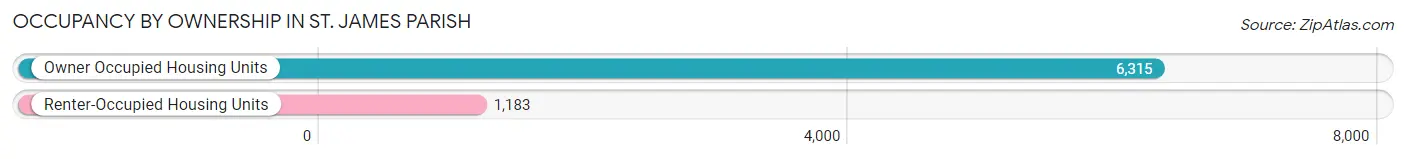
| Occupancy | # Housing Units | % Housing Units |
| Owner Occupied Housing Units | 6,315 | 84.2% |
| Renter-Occupied Housing Units | 1,183 | 15.8% |
| Total Occupied Housing Units | 7,498 | 100.0% |
Occupancy by Household Size in St. James Parish
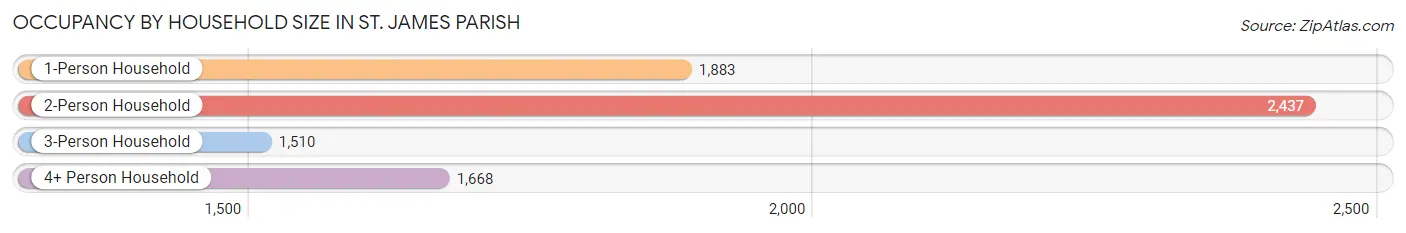
| Household Size | # Housing Units | % Housing Units |
| 1-Person Household | 1,883 | 25.1% |
| 2-Person Household | 2,437 | 32.5% |
| 3-Person Household | 1,510 | 20.1% |
| 4+ Person Household | 1,668 | 22.3% |
| Total Housing Units | 7,498 | 100.0% |
Occupancy by Ownership by Household Size in St. James Parish
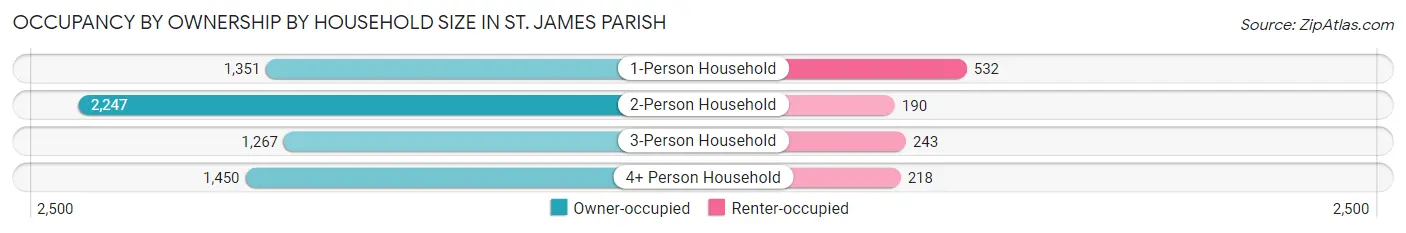
| Household Size | Owner-occupied | Renter-occupied |
| 1-Person Household | 1,351 (71.8%) | 532 (28.2%) |
| 2-Person Household | 2,247 (92.2%) | 190 (7.8%) |
| 3-Person Household | 1,267 (83.9%) | 243 (16.1%) |
| 4+ Person Household | 1,450 (86.9%) | 218 (13.1%) |
| Total Housing Units | 6,315 (84.2%) | 1,183 (15.8%) |
Occupancy by Educational Attainment in St. James Parish
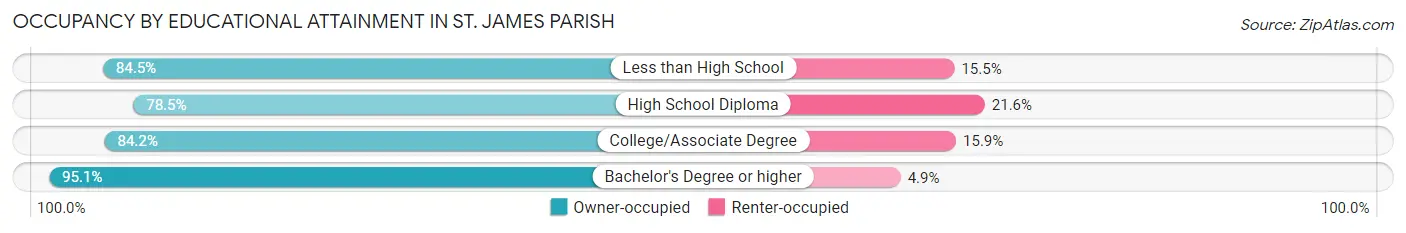
| Household Size | Owner-occupied | Renter-occupied |
| Less than High School | 609 (84.5%) | 112 (15.5%) |
| High School Diploma | 2,166 (78.4%) | 595 (21.5%) |
| College/Associate Degree | 2,150 (84.2%) | 405 (15.9%) |
| Bachelor's Degree or higher | 1,390 (95.1%) | 71 (4.9%) |
Occupancy by Age of Householder in St. James Parish
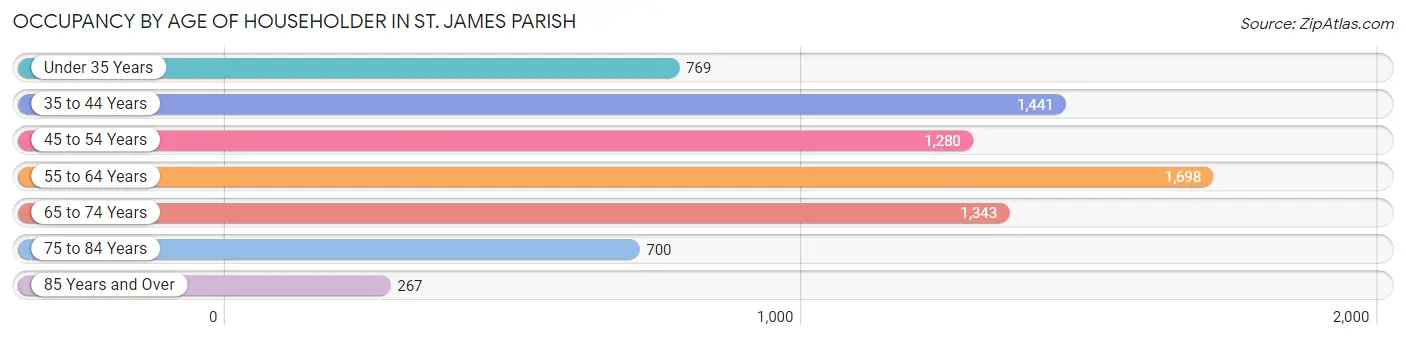
| Age Bracket | # Households | % Households |
| Under 35 Years | 769 | 10.3% |
| 35 to 44 Years | 1,441 | 19.2% |
| 45 to 54 Years | 1,280 | 17.1% |
| 55 to 64 Years | 1,698 | 22.7% |
| 65 to 74 Years | 1,343 | 17.9% |
| 75 to 84 Years | 700 | 9.3% |
| 85 Years and Over | 267 | 3.6% |
| Total | 7,498 | 100.0% |
Housing Finances in St. James Parish
Median Income by Occupancy in St. James Parish
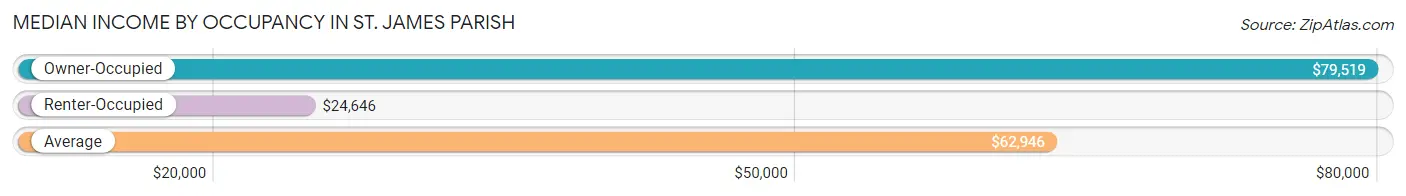
| Occupancy Type | # Households | Median Income |
| Owner-Occupied | 6,315 (84.2%) | $79,519 |
| Renter-Occupied | 1,183 (15.8%) | $24,646 |
| Average | 7,498 (100.0%) | $62,946 |
Occupancy by Householder Income Bracket in St. James Parish
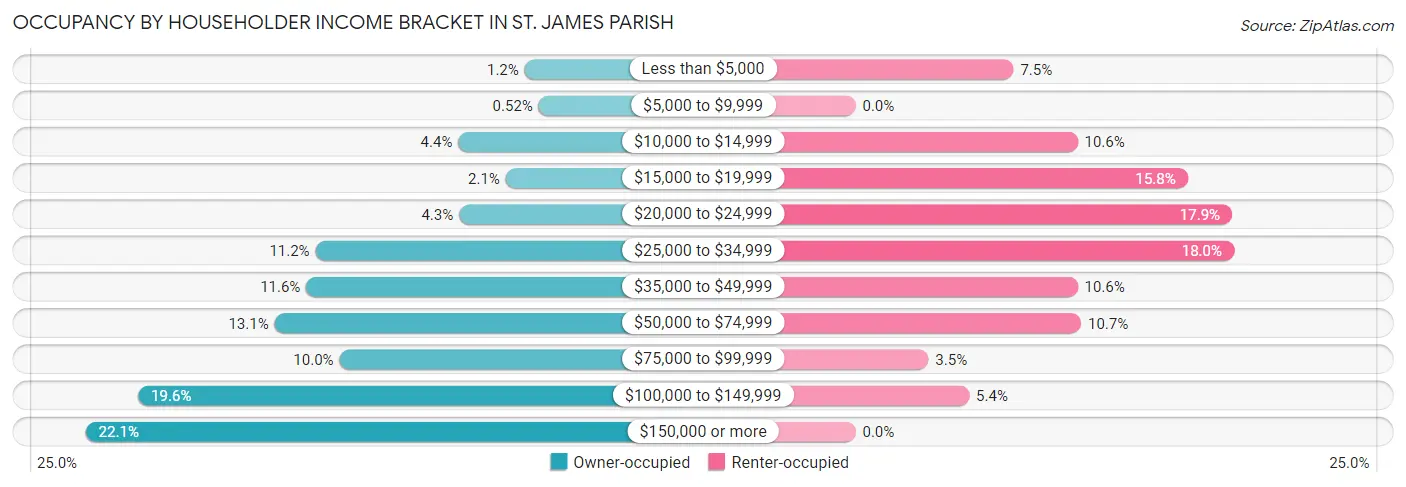
| Income Bracket | Owner-occupied | Renter-occupied |
| Less than $5,000 | 75 (1.2%) | 89 (7.5%) |
| $5,000 to $9,999 | 33 (0.5%) | 0 (0.0%) |
| $10,000 to $14,999 | 275 (4.3%) | 125 (10.6%) |
| $15,000 to $19,999 | 132 (2.1%) | 187 (15.8%) |
| $20,000 to $24,999 | 272 (4.3%) | 212 (17.9%) |
| $25,000 to $34,999 | 704 (11.2%) | 213 (18.0%) |
| $35,000 to $49,999 | 732 (11.6%) | 125 (10.6%) |
| $50,000 to $74,999 | 827 (13.1%) | 127 (10.7%) |
| $75,000 to $99,999 | 632 (10.0%) | 41 (3.5%) |
| $100,000 to $149,999 | 1,238 (19.6%) | 64 (5.4%) |
| $150,000 or more | 1,395 (22.1%) | 0 (0.0%) |
| Total | 6,315 (100.0%) | 1,183 (100.0%) |
Monthly Housing Cost Tiers in St. James Parish
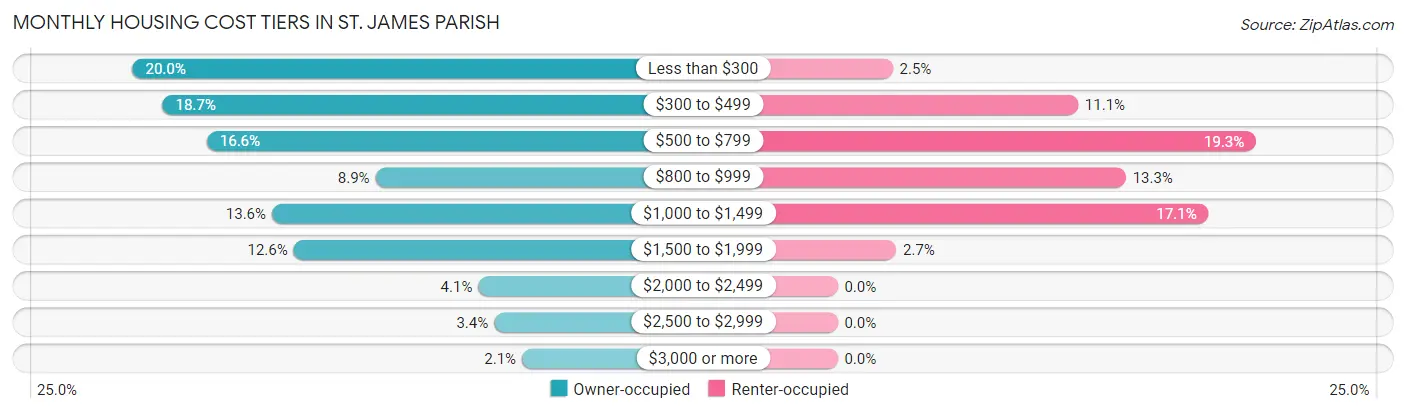
| Monthly Cost | Owner-occupied | Renter-occupied |
| Less than $300 | 1,265 (20.0%) | 30 (2.5%) |
| $300 to $499 | 1,178 (18.6%) | 131 (11.1%) |
| $500 to $799 | 1,049 (16.6%) | 228 (19.3%) |
| $800 to $999 | 559 (8.8%) | 157 (13.3%) |
| $1,000 to $1,499 | 860 (13.6%) | 202 (17.1%) |
| $1,500 to $1,999 | 797 (12.6%) | 32 (2.7%) |
| $2,000 to $2,499 | 260 (4.1%) | 0 (0.0%) |
| $2,500 to $2,999 | 214 (3.4%) | 0 (0.0%) |
| $3,000 or more | 133 (2.1%) | 0 (0.0%) |
| Total | 6,315 (100.0%) | 1,183 (100.0%) |
Physical Housing Characteristics in St. James Parish
Housing Structures in St. James Parish
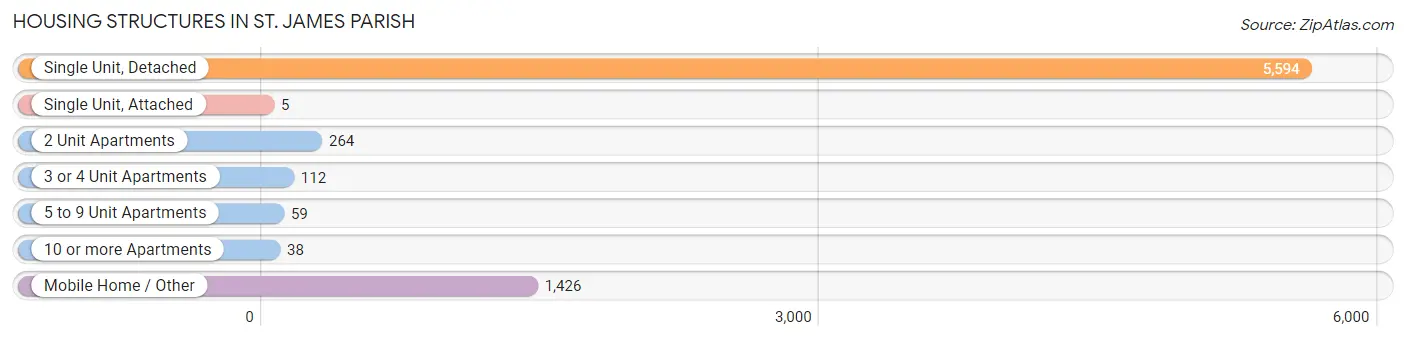
| Structure Type | # Housing Units | % Housing Units |
| Single Unit, Detached | 5,594 | 74.6% |
| Single Unit, Attached | 5 | 0.1% |
| 2 Unit Apartments | 264 | 3.5% |
| 3 or 4 Unit Apartments | 112 | 1.5% |
| 5 to 9 Unit Apartments | 59 | 0.8% |
| 10 or more Apartments | 38 | 0.5% |
| Mobile Home / Other | 1,426 | 19.0% |
| Total | 7,498 | 100.0% |
Housing Structures by Occupancy in St. James Parish
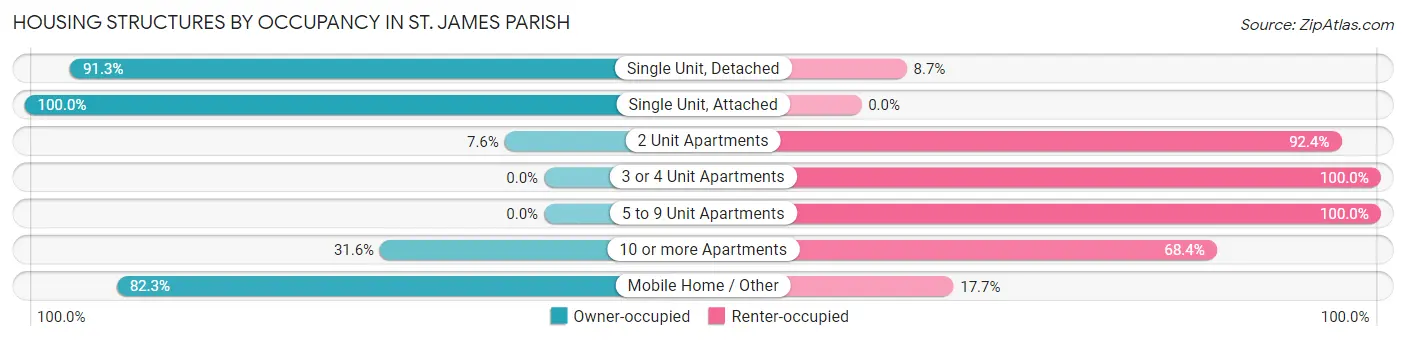
| Structure Type | Owner-occupied | Renter-occupied |
| Single Unit, Detached | 5,105 (91.3%) | 489 (8.7%) |
| Single Unit, Attached | 5 (100.0%) | 0 (0.0%) |
| 2 Unit Apartments | 20 (7.6%) | 244 (92.4%) |
| 3 or 4 Unit Apartments | 0 (0.0%) | 112 (100.0%) |
| 5 to 9 Unit Apartments | 0 (0.0%) | 59 (100.0%) |
| 10 or more Apartments | 12 (31.6%) | 26 (68.4%) |
| Mobile Home / Other | 1,173 (82.3%) | 253 (17.7%) |
| Total | 6,315 (84.2%) | 1,183 (15.8%) |
Housing Structures by Number of Rooms in St. James Parish
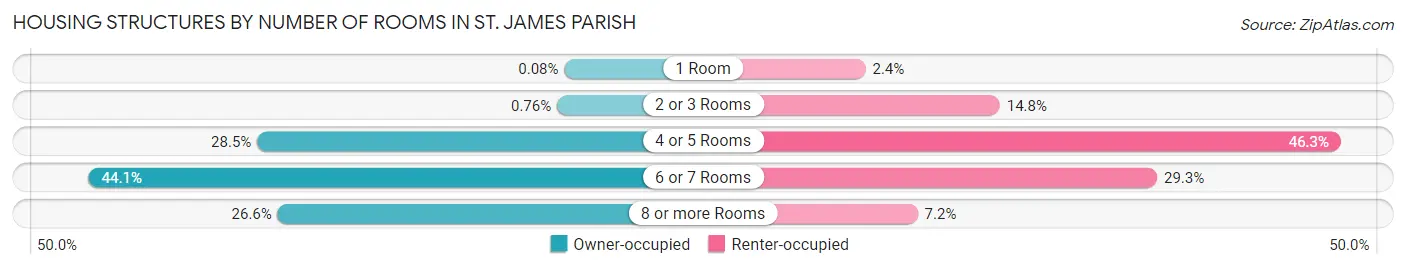
| Number of Rooms | Owner-occupied | Renter-occupied |
| 1 Room | 5 (0.1%) | 28 (2.4%) |
| 2 or 3 Rooms | 48 (0.8%) | 175 (14.8%) |
| 4 or 5 Rooms | 1,799 (28.5%) | 548 (46.3%) |
| 6 or 7 Rooms | 2,783 (44.1%) | 347 (29.3%) |
| 8 or more Rooms | 1,680 (26.6%) | 85 (7.2%) |
| Total | 6,315 (100.0%) | 1,183 (100.0%) |
Housing Structure by Heating Type in St. James Parish
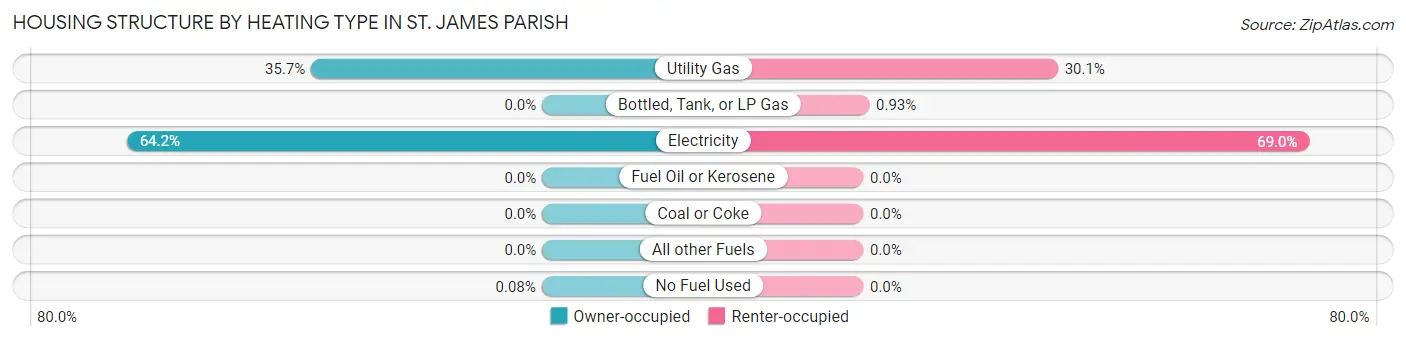
| Heating Type | Owner-occupied | Renter-occupied |
| Utility Gas | 2,255 (35.7%) | 356 (30.1%) |
| Bottled, Tank, or LP Gas | 0 (0.0%) | 11 (0.9%) |
| Electricity | 4,055 (64.2%) | 816 (69.0%) |
| Fuel Oil or Kerosene | 0 (0.0%) | 0 (0.0%) |
| Coal or Coke | 0 (0.0%) | 0 (0.0%) |
| All other Fuels | 0 (0.0%) | 0 (0.0%) |
| No Fuel Used | 5 (0.1%) | 0 (0.0%) |
| Total | 6,315 (100.0%) | 1,183 (100.0%) |
Household Vehicle Usage in St. James Parish
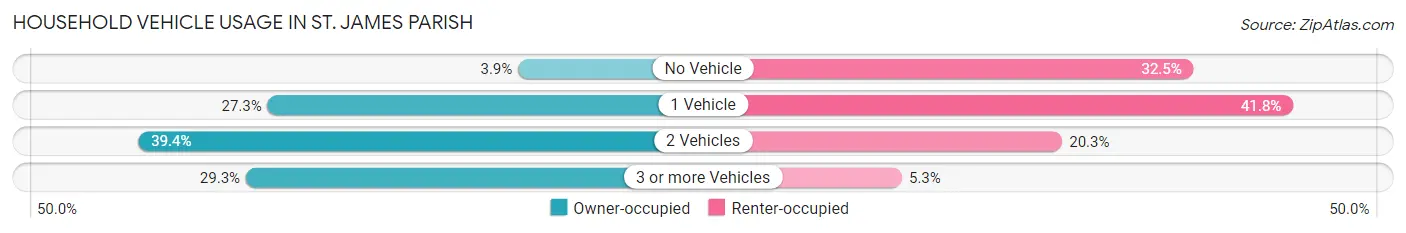
| Vehicles per Household | Owner-occupied | Renter-occupied |
| No Vehicle | 248 (3.9%) | 385 (32.5%) |
| 1 Vehicle | 1,725 (27.3%) | 495 (41.8%) |
| 2 Vehicles | 2,489 (39.4%) | 240 (20.3%) |
| 3 or more Vehicles | 1,853 (29.3%) | 63 (5.3%) |
| Total | 6,315 (100.0%) | 1,183 (100.0%) |
Real Estate & Mortgages in St. James Parish
Real Estate and Mortgage Overview in St. James Parish
| Characteristic | Without Mortgage | With Mortgage |
| Housing Units | 3,512 | 2,803 |
| Median Property Value | $164,700 | $212,700 |
| Median Household Income | $50,888 | $1,006 |
| Monthly Housing Costs | $389 | $133 |
| Real Estate Taxes | $728 | $363 |
Property Value by Mortgage Status in St. James Parish
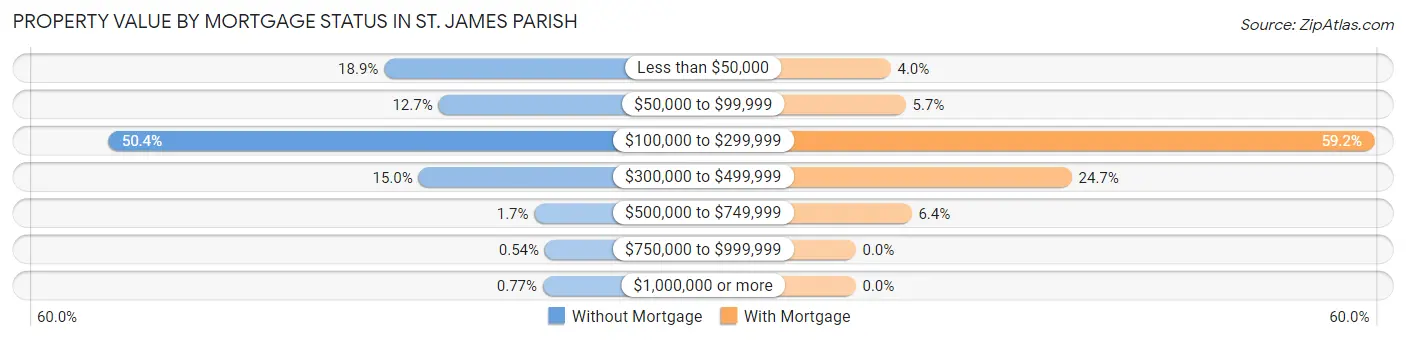
| Property Value | Without Mortgage | With Mortgage |
| Less than $50,000 | 664 (18.9%) | 112 (4.0%) |
| $50,000 to $99,999 | 446 (12.7%) | 160 (5.7%) |
| $100,000 to $299,999 | 1,769 (50.4%) | 1,660 (59.2%) |
| $300,000 to $499,999 | 526 (15.0%) | 692 (24.7%) |
| $500,000 to $749,999 | 61 (1.7%) | 179 (6.4%) |
| $750,000 to $999,999 | 19 (0.5%) | 0 (0.0%) |
| $1,000,000 or more | 27 (0.8%) | 0 (0.0%) |
| Total | 3,512 (100.0%) | 2,803 (100.0%) |
Household Income by Mortgage Status in St. James Parish
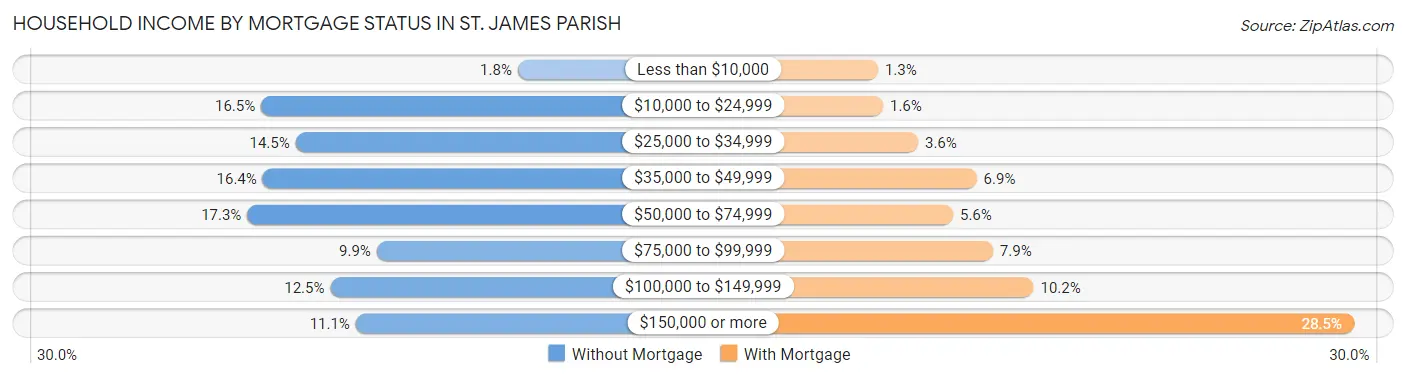
| Household Income | Without Mortgage | With Mortgage |
| Less than $10,000 | 64 (1.8%) | 36 (1.3%) |
| $10,000 to $24,999 | 579 (16.5%) | 44 (1.6%) |
| $25,000 to $34,999 | 510 (14.5%) | 100 (3.6%) |
| $35,000 to $49,999 | 576 (16.4%) | 194 (6.9%) |
| $50,000 to $74,999 | 607 (17.3%) | 156 (5.6%) |
| $75,000 to $99,999 | 347 (9.9%) | 220 (7.9%) |
| $100,000 to $149,999 | 440 (12.5%) | 285 (10.2%) |
| $150,000 or more | 389 (11.1%) | 798 (28.5%) |
| Total | 3,512 (100.0%) | 2,803 (100.0%) |
Property Value to Household Income Ratio in St. James Parish
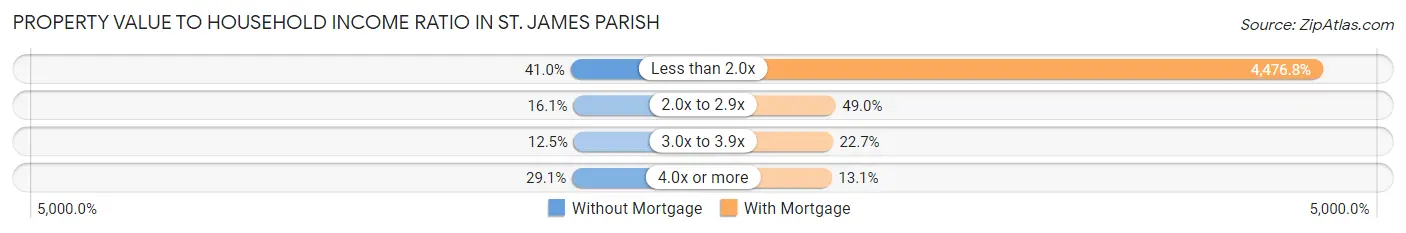
| Value-to-Income Ratio | Without Mortgage | With Mortgage |
| Less than 2.0x | 1,440 (41.0%) | 125,484 (4,476.8%) |
| 2.0x to 2.9x | 566 (16.1%) | 1,374 (49.0%) |
| 3.0x to 3.9x | 440 (12.5%) | 637 (22.7%) |
| 4.0x or more | 1,022 (29.1%) | 367 (13.1%) |
| Total | 3,512 (100.0%) | 2,803 (100.0%) |
Real Estate Taxes by Mortgage Status in St. James Parish
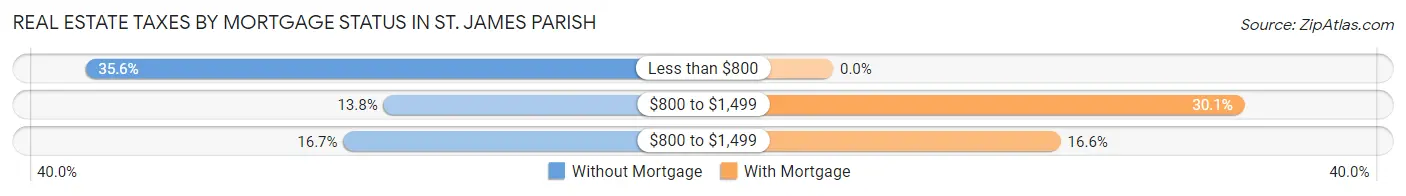
| Property Taxes | Without Mortgage | With Mortgage |
| Less than $800 | 1,249 (35.6%) | 0 (0.0%) |
| $800 to $1,499 | 484 (13.8%) | 843 (30.1%) |
| $800 to $1,499 | 587 (16.7%) | 466 (16.6%) |
| Total | 3,512 (100.0%) | 2,803 (100.0%) |
Health & Disability in St. James Parish
Health Insurance Coverage by Age in St. James Parish
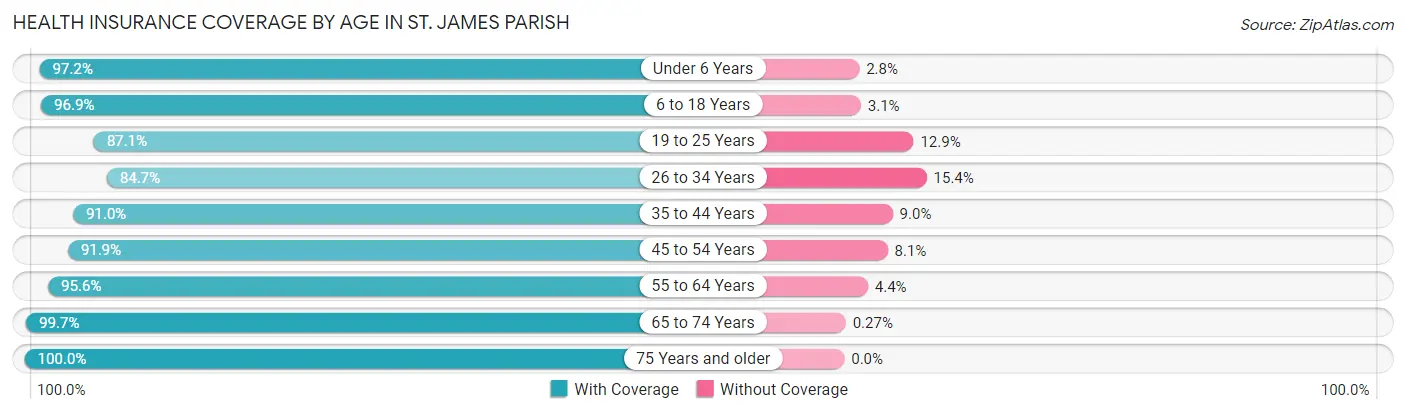
| Age Bracket | With Coverage | Without Coverage |
| Under 6 Years | 1,365 (97.2%) | 39 (2.8%) |
| 6 to 18 Years | 3,260 (96.9%) | 104 (3.1%) |
| 19 to 25 Years | 1,310 (87.1%) | 194 (12.9%) |
| 26 to 34 Years | 1,616 (84.7%) | 293 (15.3%) |
| 35 to 44 Years | 2,613 (91.0%) | 259 (9.0%) |
| 45 to 54 Years | 2,095 (91.9%) | 184 (8.1%) |
| 55 to 64 Years | 2,812 (95.6%) | 129 (4.4%) |
| 65 to 74 Years | 2,183 (99.7%) | 6 (0.3%) |
| 75 Years and older | 1,454 (100.0%) | 0 (0.0%) |
| Total | 18,708 (93.9%) | 1,208 (6.1%) |
Health Insurance Coverage by Citizenship Status in St. James Parish

| Citizenship Status | With Coverage | Without Coverage |
| Native Born | 1,365 (97.2%) | 39 (2.8%) |
| Foreign Born, Citizen | 3,260 (96.9%) | 104 (3.1%) |
| Foreign Born, not a Citizen | 1,310 (87.1%) | 194 (12.9%) |
Health Insurance Coverage by Household Income in St. James Parish
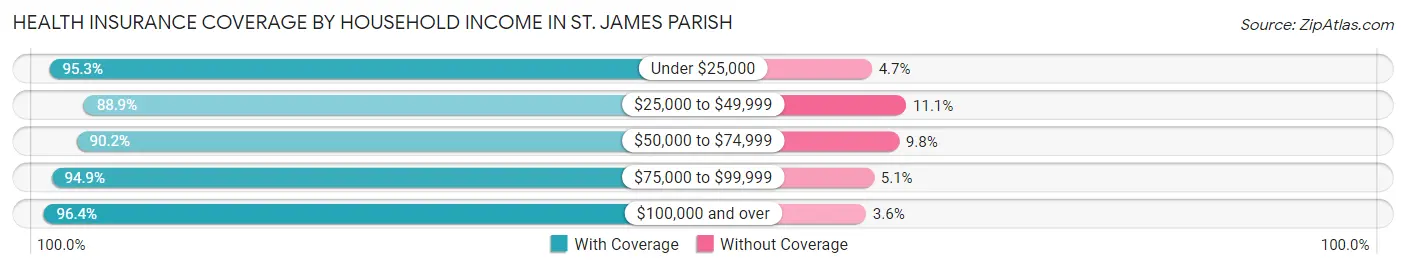
| Household Income | With Coverage | Without Coverage |
| Under $25,000 | 2,612 (95.3%) | 128 (4.7%) |
| $25,000 to $49,999 | 3,367 (88.9%) | 421 (11.1%) |
| $50,000 to $74,999 | 2,218 (90.2%) | 240 (9.8%) |
| $75,000 to $99,999 | 1,778 (94.9%) | 95 (5.1%) |
| $100,000 and over | 8,732 (96.4%) | 324 (3.6%) |
Public vs Private Health Insurance Coverage by Age in St. James Parish
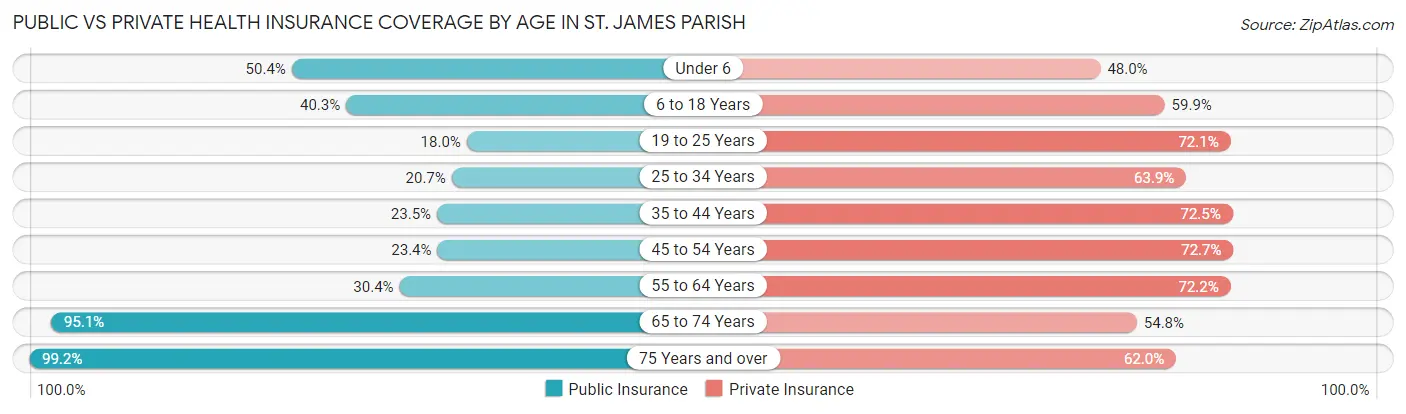
| Age Bracket | Public Insurance | Private Insurance |
| Under 6 | 708 (50.4%) | 674 (48.0%) |
| 6 to 18 Years | 1,357 (40.3%) | 2,016 (59.9%) |
| 19 to 25 Years | 270 (17.9%) | 1,085 (72.1%) |
| 25 to 34 Years | 396 (20.7%) | 1,220 (63.9%) |
| 35 to 44 Years | 674 (23.5%) | 2,083 (72.5%) |
| 45 to 54 Years | 533 (23.4%) | 1,656 (72.7%) |
| 55 to 64 Years | 895 (30.4%) | 2,122 (72.2%) |
| 65 to 74 Years | 2,082 (95.1%) | 1,199 (54.8%) |
| 75 Years and over | 1,442 (99.2%) | 902 (62.0%) |
| Total | 8,357 (42.0%) | 12,957 (65.1%) |
Disability Status by Sex by Age in St. James Parish
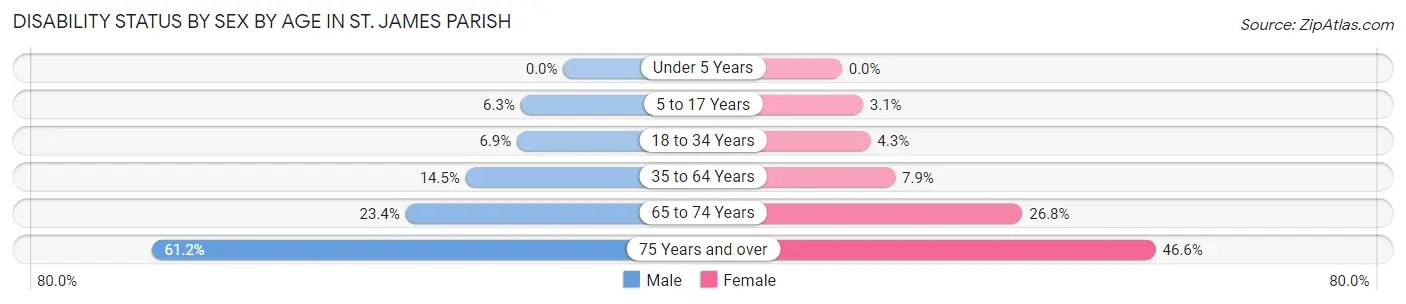
| Age Bracket | Male | Female |
| Under 5 Years | 0 (0.0%) | 0 (0.0%) |
| 5 to 17 Years | 104 (6.3%) | 52 (3.1%) |
| 18 to 34 Years | 126 (6.9%) | 80 (4.3%) |
| 35 to 64 Years | 567 (14.5%) | 331 (7.9%) |
| 65 to 74 Years | 241 (23.4%) | 311 (26.8%) |
| 75 Years and over | 359 (61.2%) | 404 (46.6%) |
Disability Class by Sex by Age in St. James Parish
Disability Class: Hearing Difficulty
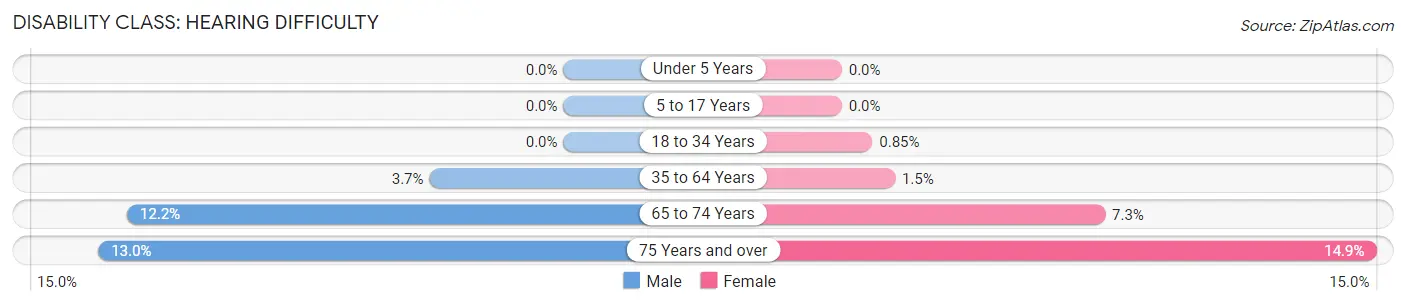
| Age Bracket | Male | Female |
| Under 5 Years | 0 (0.0%) | 0 (0.0%) |
| 5 to 17 Years | 0 (0.0%) | 0 (0.0%) |
| 18 to 34 Years | 0 (0.0%) | 16 (0.9%) |
| 35 to 64 Years | 146 (3.7%) | 62 (1.5%) |
| 65 to 74 Years | 125 (12.1%) | 85 (7.3%) |
| 75 Years and over | 76 (13.0%) | 129 (14.9%) |
Disability Class: Vision Difficulty
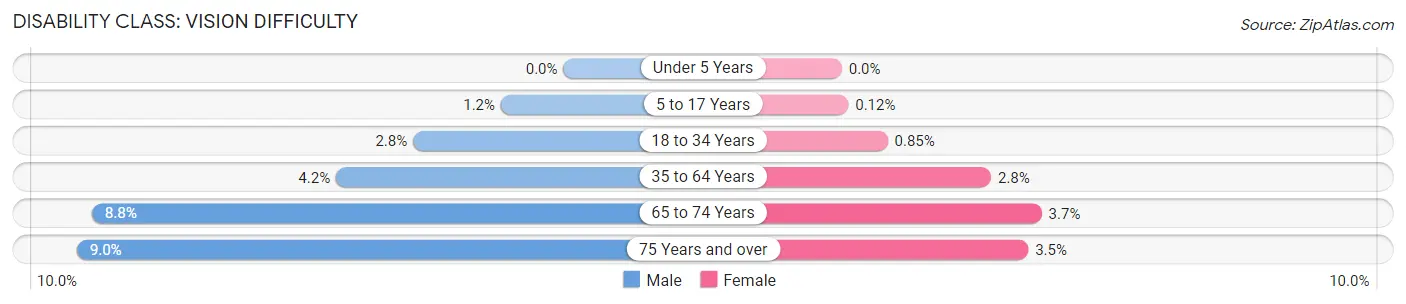
| Age Bracket | Male | Female |
| Under 5 Years | 0 (0.0%) | 0 (0.0%) |
| 5 to 17 Years | 19 (1.2%) | 2 (0.1%) |
| 18 to 34 Years | 51 (2.8%) | 16 (0.9%) |
| 35 to 64 Years | 165 (4.2%) | 116 (2.8%) |
| 65 to 74 Years | 90 (8.7%) | 43 (3.7%) |
| 75 Years and over | 53 (9.0%) | 30 (3.5%) |
Disability Class: Cognitive Difficulty
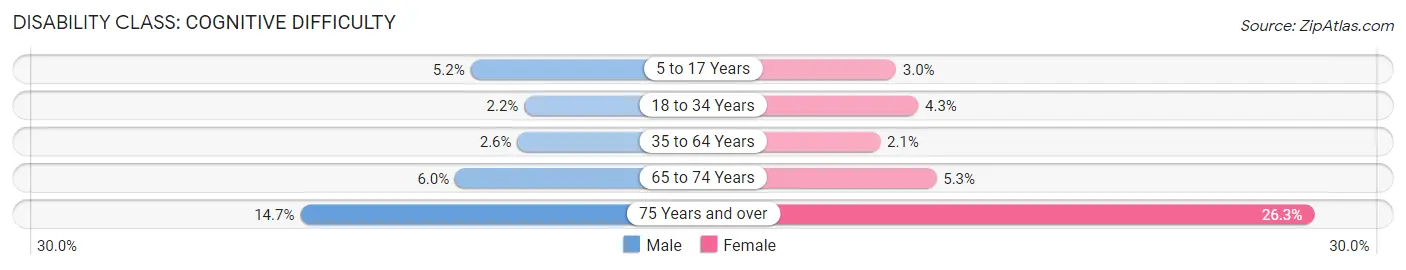
| Age Bracket | Male | Female |
| 5 to 17 Years | 85 (5.2%) | 50 (3.0%) |
| 18 to 34 Years | 40 (2.2%) | 80 (4.3%) |
| 35 to 64 Years | 100 (2.6%) | 89 (2.1%) |
| 65 to 74 Years | 62 (6.0%) | 61 (5.3%) |
| 75 Years and over | 86 (14.6%) | 228 (26.3%) |
Disability Class: Ambulatory Difficulty
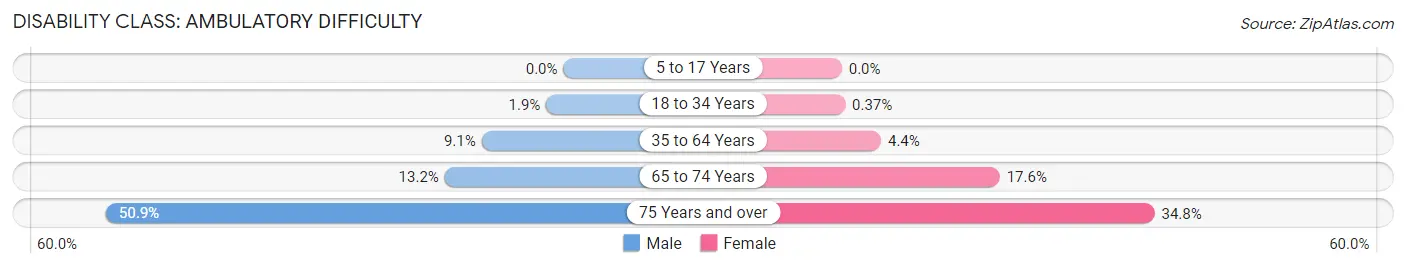
| Age Bracket | Male | Female |
| 5 to 17 Years | 0 (0.0%) | 0 (0.0%) |
| 18 to 34 Years | 35 (1.9%) | 7 (0.4%) |
| 35 to 64 Years | 356 (9.1%) | 183 (4.4%) |
| 65 to 74 Years | 136 (13.2%) | 204 (17.6%) |
| 75 Years and over | 299 (50.9%) | 302 (34.8%) |
Disability Class: Self-Care Difficulty
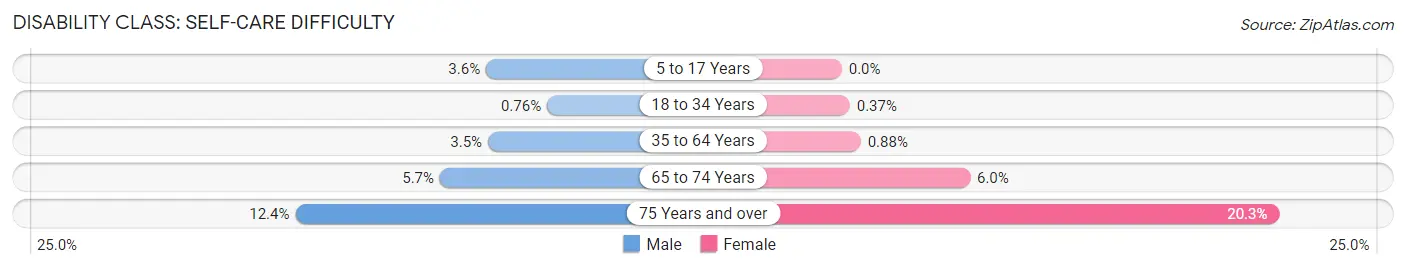
| Age Bracket | Male | Female |
| 5 to 17 Years | 59 (3.6%) | 0 (0.0%) |
| 18 to 34 Years | 14 (0.8%) | 7 (0.4%) |
| 35 to 64 Years | 137 (3.5%) | 37 (0.9%) |
| 65 to 74 Years | 59 (5.7%) | 69 (5.9%) |
| 75 Years and over | 73 (12.4%) | 176 (20.3%) |
Technology Access in St. James Parish
Computing Device Access in St. James Parish
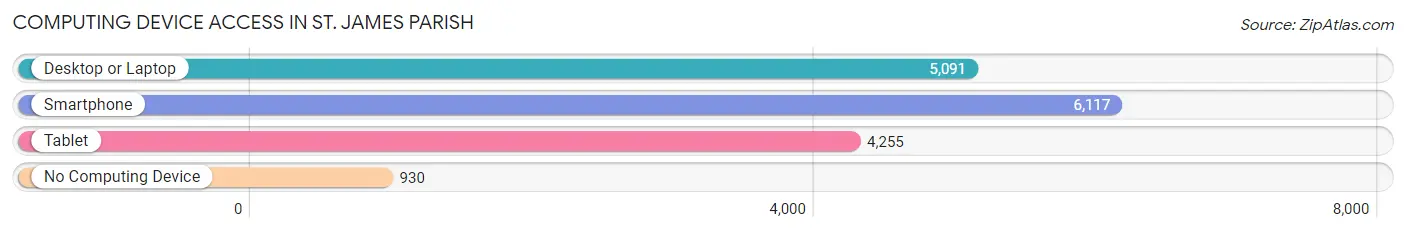
| Device Type | # Households | % Households |
| Desktop or Laptop | 5,091 | 67.9% |
| Smartphone | 6,117 | 81.6% |
| Tablet | 4,255 | 56.8% |
| No Computing Device | 930 | 12.4% |
| Total | 7,498 | 100.0% |
Internet Access in St. James Parish
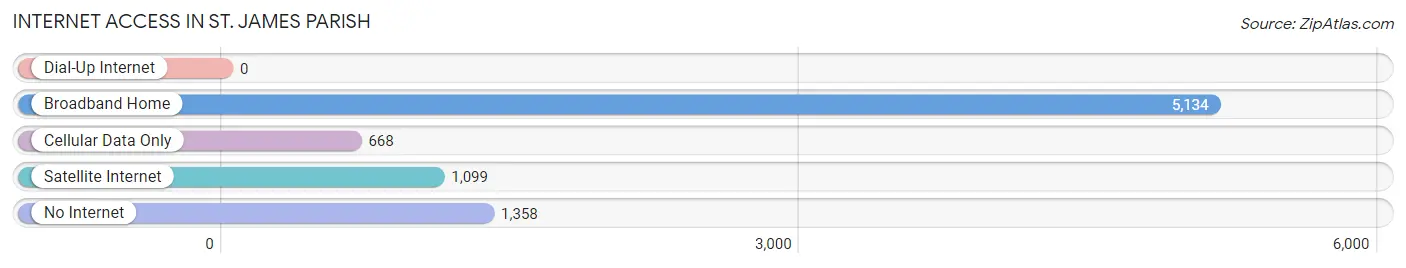
| Internet Type | # Households | % Households |
| Dial-Up Internet | 0 | 0.0% |
| Broadband Home | 5,134 | 68.5% |
| Cellular Data Only | 668 | 8.9% |
| Satellite Internet | 1,099 | 14.7% |
| No Internet | 1,358 | 18.1% |
| Total | 7,498 | 100.0% |
St. James Parish Summary
St. James Parish is a parish located in the southeastern part of Louisiana. It is bordered by Ascension Parish to the north, Assumption Parish to the east, St. John the Baptist Parish to the south, and St. Charles Parish to the west. The parish seat is Convent, and the largest city is Lutcher. As of the 2010 census, the population was 22,102.
Geography
St. James Parish is located in the southeastern part of Louisiana, and is bordered by Ascension Parish to the north, Assumption Parish to the east, St. John the Baptist Parish to the south, and St. Charles Parish to the west. The parish has a total area of 545 square miles, of which 543 square miles is land and 2 square miles (0.4%) is water.
The parish is located in the Mississippi River Delta region, and is part of the Atchafalaya Basin. The terrain is mostly flat, with some rolling hills in the northern part of the parish. The parish is drained by the Mississippi River and its tributaries, including the Amite River, Blind River, and Bayou Goula.
History
St. James Parish was established in 1807, and was named after the Catholic saint, James the Greater. The parish was originally part of the German Coast, a settlement of German immigrants who arrived in the area in the early 1700s.
The parish was an important center of the sugar cane industry in the 19th century, and the area was home to many large plantations. The parish was also home to several large slave plantations, and the population of slaves in the parish was higher than the population of whites.
In the late 19th century, the parish was home to several large lumber mills, and the area was known for its production of cypress lumber. The parish was also home to several large brickyards, which produced bricks for the construction of buildings in New Orleans.
Economy
St. James Parish is a rural parish, and the economy is largely based on agriculture. The main crops grown in the parish are sugar cane, corn, soybeans, and rice. The parish is also home to several large chemical plants, which produce a variety of products, including fertilizers, plastics, and petrochemicals.
The parish is also home to several large oil and gas companies, which are involved in the exploration and production of oil and natural gas. The parish is also home to several large industrial parks, which are home to a variety of businesses, including manufacturing, warehousing, and distribution.
Demographics
As of the 2010 census, the population of St. James Parish was 22,102. The racial makeup of the parish was 68.3% White, 28.2% African American, 0.5% Native American, 0.3% Asian, 0.1% Pacific Islander, 0.7% from other races, and 1.9% from two or more races. Hispanic or Latino of any race were 2.7% of the population.
The median income for a household in the parish was $37,945, and the median income for a family was $45,945. The per capita income for the parish was $17,945. About 17.2% of families and 21.2% of the population were below the poverty line, including 28.2% of those under age 18 and 16.2% of those age 65 or over.
Common Questions
What is Per Capita Income in St. James Parish?
Per Capita income in St. James Parish is $33,616.
What is the Median Family Income in St. James Parish?
Median Family Income in St. James Parish is $84,091.
What is the Median Household income in St. James Parish?
Median Household Income in St. James Parish is $62,946.
What is Income or Wage Gap in St. James Parish?
Income or Wage Gap in St. James Parish is 45.1%.
Women in St. James Parish earn 54.9 cents for every dollar earned by a man.
What is Inequality or Gini Index in St. James Parish?
Inequality or Gini Index in St. James Parish is 0.43.
What is the Total Population of St. James Parish?
Total Population of St. James Parish is 20,090.
What is the Total Male Population of St. James Parish?
Total Male Population of St. James Parish is 9,716.
What is the Total Female Population of St. James Parish?
Total Female Population of St. James Parish is 10,374.
What is the Ratio of Males per 100 Females in St. James Parish?
There are 93.66 Males per 100 Females in St. James Parish.
What is the Ratio of Females per 100 Males in St. James Parish?
There are 106.77 Females per 100 Males in St. James Parish.
What is the Median Population Age in St. James Parish?
Median Population Age in St. James Parish is 40.4 Years.
What is the Average Family Size in St. James Parish
Average Family Size in St. James Parish is 3.2 People.
What is the Average Household Size in St. James Parish
Average Household Size in St. James Parish is 2.7 People.
How Large is the Labor Force in St. James Parish?
There are 9,358 People in the Labor Forcein in St. James Parish.
What is the Percentage of People in the Labor Force in St. James Parish?
57.9% of People are in the Labor Force in St. James Parish.
What is the Unemployment Rate in St. James Parish?
Unemployment Rate in St. James Parish is 3.6%.