Red River Parish, LA Map & Demographics
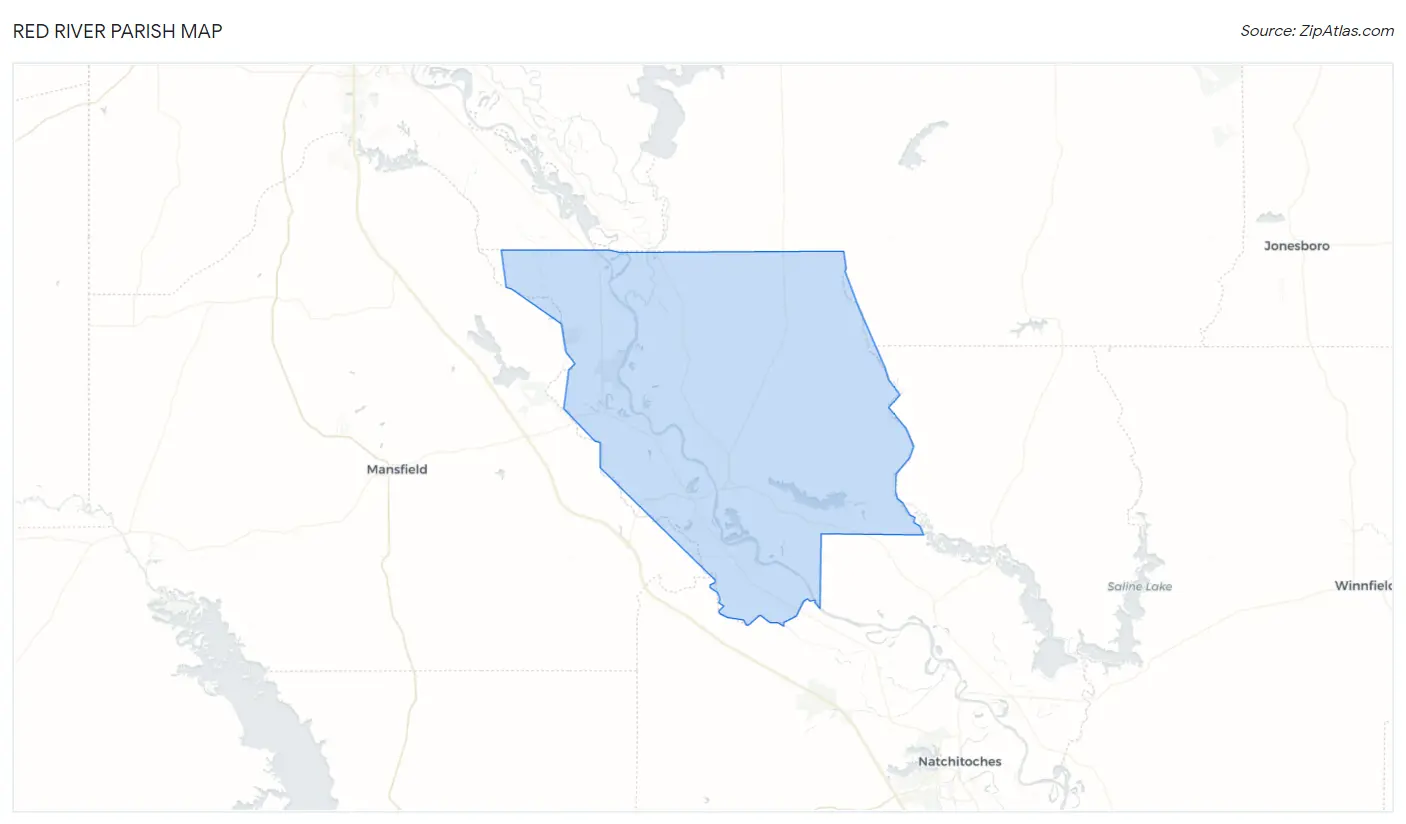
Red River Parish Map
Red River Parish Overview
$23,162
PER CAPITA INCOME
$56,918
AVG FAMILY INCOME
$43,821
AVG HOUSEHOLD INCOME
42.5%
WAGE / INCOME GAP [ % ]
57.5¢/ $1
WAGE / INCOME GAP [ $ ]
$10,748
FAMILY INCOME DEFICIT
0.46
INEQUALITY / GINI INDEX
7,631
TOTAL POPULATION
3,839
MALE POPULATION
3,792
FEMALE POPULATION
101.24
MALES / 100 FEMALES
98.78
FEMALES / 100 MALES
37.8
MEDIAN AGE
3.1
AVG FAMILY SIZE
2.5
AVG HOUSEHOLD SIZE
3,018
LABOR FORCE [ PEOPLE ]
49.4%
PERCENT IN LABOR FORCE
3.3%
UNEMPLOYMENT RATE
Red River Parish Area Codes
Income in Red River Parish
Income Overview in Red River Parish
Per Capita Income in Red River Parish is $23,162, while median incomes of families and households are $56,918 and $43,821 respectively.
| Characteristic | Number | Measure |
| Per Capita Income | 7,631 | $23,162 |
| Median Family Income | 1,917 | $56,918 |
| Mean Family Income | 1,917 | $67,904 |
| Median Household Income | 2,934 | $43,821 |
| Mean Household Income | 2,934 | $58,820 |
| Income Deficit | 1,917 | $10,748 |
| Wage / Income Gap (%) | 7,631 | 42.48% |
| Wage / Income Gap ($) | 7,631 | 57.52¢ per $1 |
| Gini / Inequality Index | 7,631 | 0.46 |
Earnings by Sex in Red River Parish
Average Earnings in Red River Parish are $32,977, $41,696 for men and $23,984 for women, a difference of 42.5%.
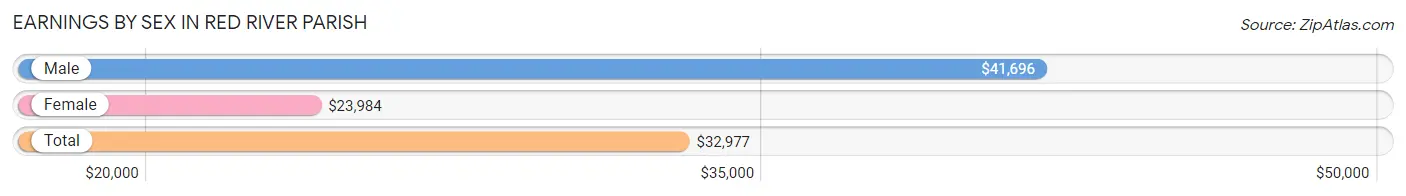
| Sex | Number | Average Earnings |
| Male | 1,706 (54.6%) | $41,696 |
| Female | 1,417 (45.4%) | $23,984 |
| Total | 3,123 (100.0%) | $32,977 |
Earnings by Sex by Income Bracket in Red River Parish
The most common earnings brackets in Red River Parish are $100,000+ for men (214 | 12.5%) and $2,499 or less for women (192 | 13.6%).
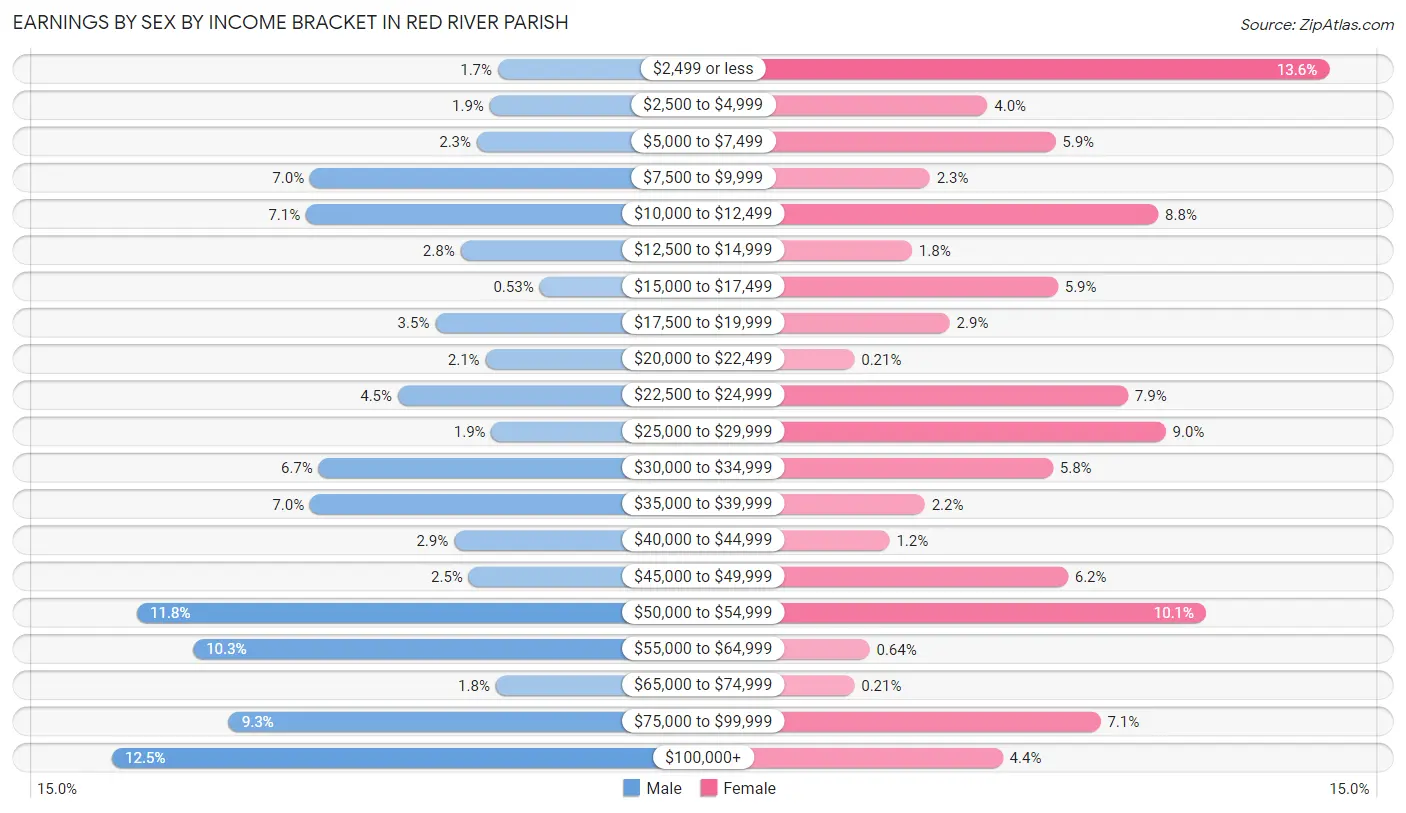
| Income | Male | Female |
| $2,499 or less | 29 (1.7%) | 192 (13.6%) |
| $2,500 to $4,999 | 33 (1.9%) | 56 (4.0%) |
| $5,000 to $7,499 | 39 (2.3%) | 83 (5.9%) |
| $7,500 to $9,999 | 119 (7.0%) | 33 (2.3%) |
| $10,000 to $12,499 | 121 (7.1%) | 124 (8.7%) |
| $12,500 to $14,999 | 47 (2.8%) | 26 (1.8%) |
| $15,000 to $17,499 | 9 (0.5%) | 84 (5.9%) |
| $17,500 to $19,999 | 59 (3.5%) | 41 (2.9%) |
| $20,000 to $22,499 | 35 (2.1%) | 3 (0.2%) |
| $22,500 to $24,999 | 77 (4.5%) | 112 (7.9%) |
| $25,000 to $29,999 | 32 (1.9%) | 127 (9.0%) |
| $30,000 to $34,999 | 115 (6.7%) | 82 (5.8%) |
| $35,000 to $39,999 | 119 (7.0%) | 31 (2.2%) |
| $40,000 to $44,999 | 50 (2.9%) | 17 (1.2%) |
| $45,000 to $49,999 | 43 (2.5%) | 88 (6.2%) |
| $50,000 to $54,999 | 202 (11.8%) | 143 (10.1%) |
| $55,000 to $64,999 | 175 (10.3%) | 9 (0.6%) |
| $65,000 to $74,999 | 30 (1.8%) | 3 (0.2%) |
| $75,000 to $99,999 | 158 (9.3%) | 101 (7.1%) |
| $100,000+ | 214 (12.5%) | 62 (4.4%) |
| Total | 1,706 (100.0%) | 1,417 (100.0%) |
Earnings by Sex by Educational Attainment in Red River Parish
Average earnings in Red River Parish are $50,558 for men and $25,235 for women, a difference of 50.1%. Men with an educational attainment of bachelor's degree enjoy the highest average annual earnings of $51,657, while those with high school diploma education earn the least with $47,436. Women with an educational attainment of bachelor's degree earn the most with the average annual earnings of $46,310, while those with high school diploma education have the smallest earnings of $17,781.
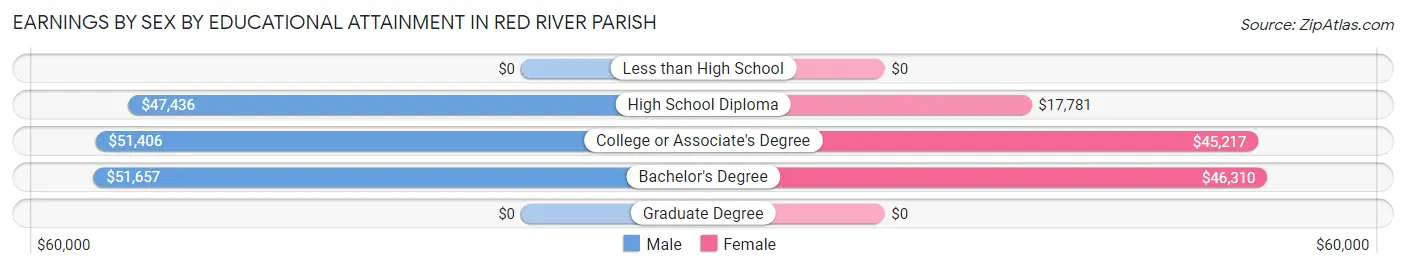
| Educational Attainment | Male Income | Female Income |
| Less than High School | - | - |
| High School Diploma | $47,436 | $17,781 |
| College or Associate's Degree | $51,406 | $45,217 |
| Bachelor's Degree | $51,657 | $46,310 |
| Graduate Degree | - | - |
| Total | $50,558 | $25,235 |
Family Income in Red River Parish
Family Income Brackets in Red River Parish
According to the Red River Parish family income data, there are 383 families falling into the $50,000 to $74,999 income range, which is the most common income bracket and makes up 20.0% of all families. Conversely, the $10,000 to $14,999 income bracket is the least frequent group with only 33 families (1.7%) belonging to this category.
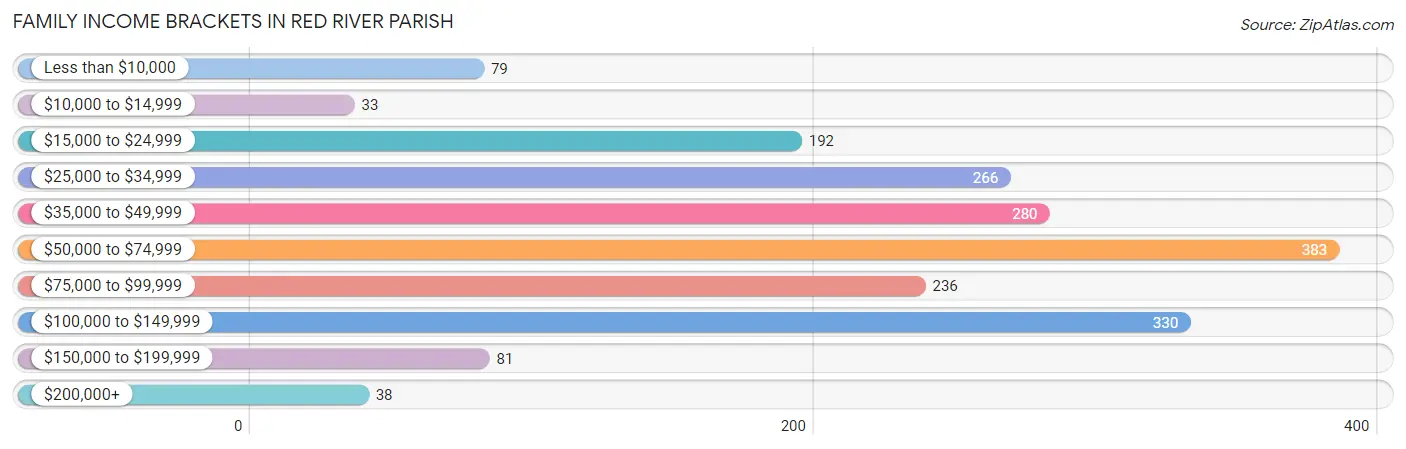
| Income Bracket | # Families | % Families |
| Less than $10,000 | 79 | 4.1% |
| $10,000 to $14,999 | 33 | 1.7% |
| $15,000 to $24,999 | 192 | 10.0% |
| $25,000 to $34,999 | 266 | 13.9% |
| $35,000 to $49,999 | 280 | 14.6% |
| $50,000 to $74,999 | 383 | 20.0% |
| $75,000 to $99,999 | 236 | 12.3% |
| $100,000 to $149,999 | 330 | 17.2% |
| $150,000 to $199,999 | 81 | 4.2% |
| $200,000+ | 38 | 2.0% |
Family Income by Famaliy Size in Red River Parish
7+ person families (39 | 2.0%) account for the highest median family income in Red River Parish with $146,181 per family, while 2-person families (898 | 46.8%) have the highest median income of $22,336 per family member.
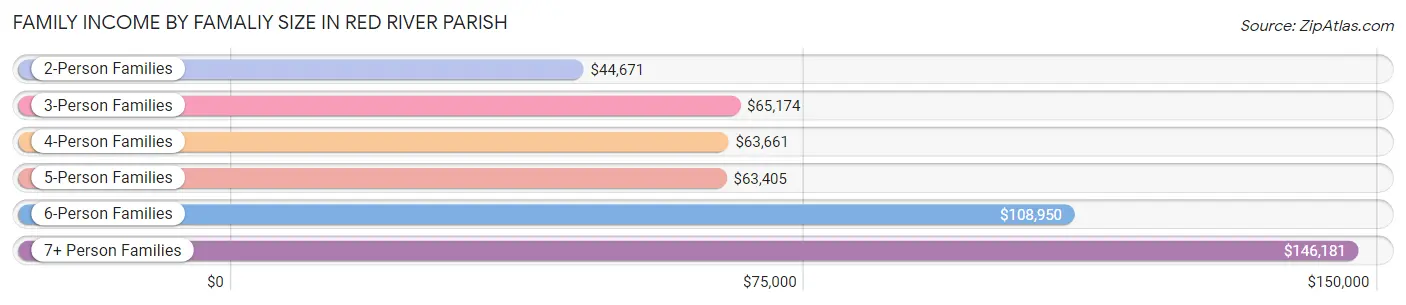
| Income Bracket | # Families | Median Income |
| 2-Person Families | 898 (46.8%) | $44,671 |
| 3-Person Families | 515 (26.9%) | $65,174 |
| 4-Person Families | 255 (13.3%) | $63,661 |
| 5-Person Families | 163 (8.5%) | $63,405 |
| 6-Person Families | 47 (2.5%) | $108,950 |
| 7+ Person Families | 39 (2.0%) | $146,181 |
| Total | 1,917 (100.0%) | $56,918 |
Family Income by Number of Earners in Red River Parish
The median family income in Red River Parish is $56,918, with families comprising 3+ earners (81) having the highest median family income of $97,865, while families with no earners (495) have the lowest median family income of $29,984, accounting for 4.2% and 25.8% of families, respectively.
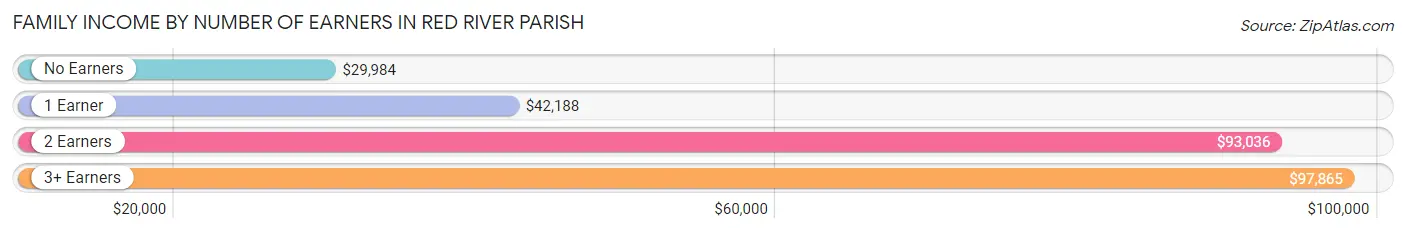
| Number of Earners | # Families | Median Income |
| No Earners | 495 (25.8%) | $29,984 |
| 1 Earner | 680 (35.5%) | $42,188 |
| 2 Earners | 661 (34.5%) | $93,036 |
| 3+ Earners | 81 (4.2%) | $97,865 |
| Total | 1,917 (100.0%) | $56,918 |
Household Income in Red River Parish
Household Income Brackets in Red River Parish
With 522 households falling in the category, the $50,000 to $74,999 income range is the most frequent in Red River Parish, accounting for 17.8% of all households. In contrast, only 65 households (2.2%) fall into the $200,000+ income bracket, making it the least populous group.
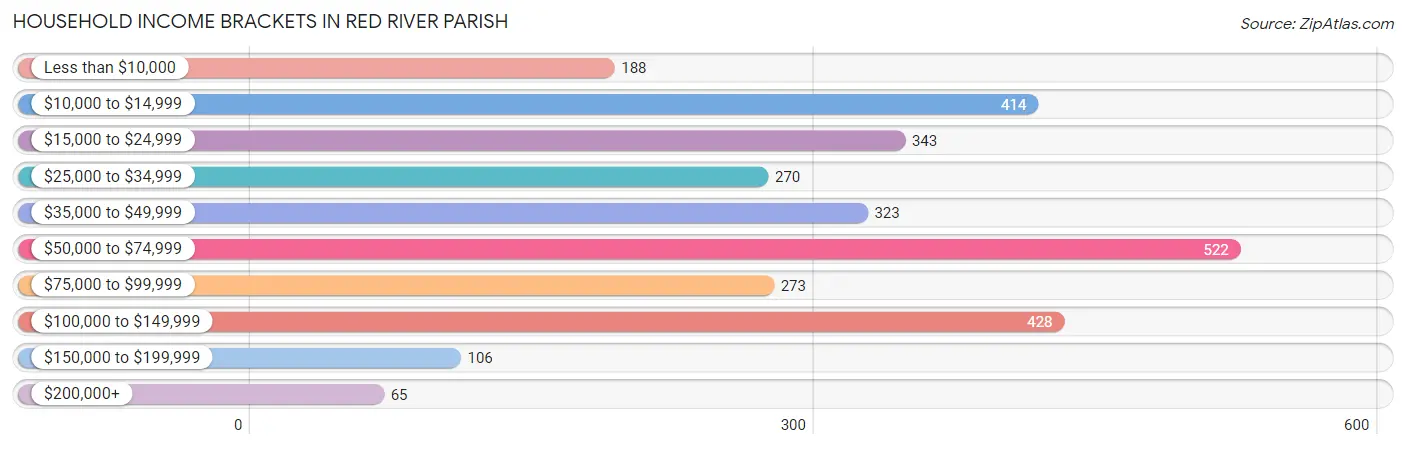
| Income Bracket | # Households | % Households |
| Less than $10,000 | 188 | 6.4% |
| $10,000 to $14,999 | 414 | 14.1% |
| $15,000 to $24,999 | 343 | 11.7% |
| $25,000 to $34,999 | 270 | 9.2% |
| $35,000 to $49,999 | 323 | 11.0% |
| $50,000 to $74,999 | 522 | 17.8% |
| $75,000 to $99,999 | 273 | 9.3% |
| $100,000 to $149,999 | 428 | 14.6% |
| $150,000 to $199,999 | 106 | 3.6% |
| $200,000+ | 65 | 2.2% |
Household Income by Householder Age in Red River Parish
The median household income in Red River Parish is $43,821, with the highest median household income of $51,942 found in the 25 to 44 years age bracket for the primary householder. A total of 787 households (26.8%) fall into this category. Meanwhile, the 15 to 24 years age bracket for the primary householder has the lowest median household income of $0, with 274 households (9.3%) in this group.
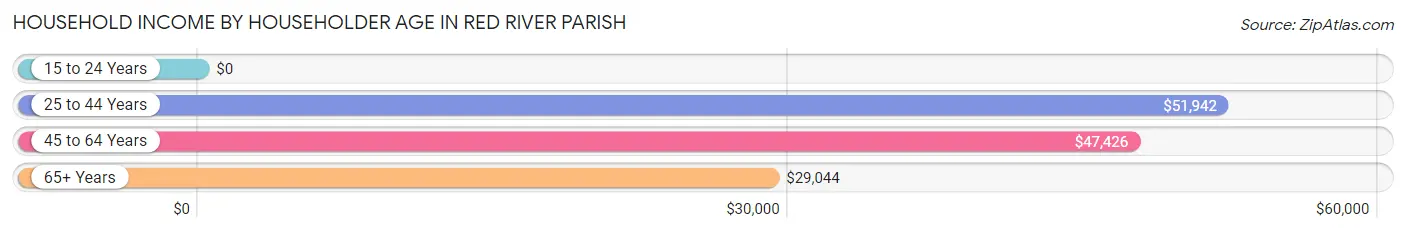
| Income Bracket | # Households | Median Income |
| 15 to 24 Years | 274 (9.3%) | $0 |
| 25 to 44 Years | 787 (26.8%) | $51,942 |
| 45 to 64 Years | 997 (34.0%) | $47,426 |
| 65+ Years | 876 (29.9%) | $29,044 |
| Total | 2,934 (100.0%) | $43,821 |
Poverty in Red River Parish
Income Below Poverty by Sex and Age in Red River Parish
With 20.8% poverty level for males and 28.7% for females among the residents of Red River Parish, under 5 year old males and 5 year old females are the most vulnerable to poverty, with 123 males (65.1%) and 26 females (68.4%) in their respective age groups living below the poverty level.

| Age Bracket | Male | Female |
| Under 5 Years | 123 (65.1%) | 76 (50.7%) |
| 5 Years | 0 (0.0%) | 26 (68.4%) |
| 6 to 11 Years | 169 (54.0%) | 24 (13.2%) |
| 12 to 14 Years | 85 (42.1%) | 59 (37.6%) |
| 15 Years | 5 (13.9%) | 30 (51.7%) |
| 16 and 17 Years | 10 (5.5%) | 0 (0.0%) |
| 18 to 24 Years | 85 (22.4%) | 128 (37.3%) |
| 25 to 34 Years | 36 (7.3%) | 231 (53.8%) |
| 35 to 44 Years | 58 (17.3%) | 146 (30.9%) |
| 45 to 54 Years | 35 (9.5%) | 66 (17.3%) |
| 55 to 64 Years | 69 (13.2%) | 65 (11.3%) |
| 65 to 74 Years | 45 (12.0%) | 42 (11.1%) |
| 75 Years and over | 30 (16.2%) | 157 (39.0%) |
| Total | 750 (20.8%) | 1,050 (28.7%) |
Income Above Poverty by Sex and Age in Red River Parish
According to the poverty statistics in Red River Parish, males aged 5 years and females aged 16 and 17 years are the age groups that are most secure financially, with 100.0% of males and 100.0% of females in these age groups living above the poverty line.
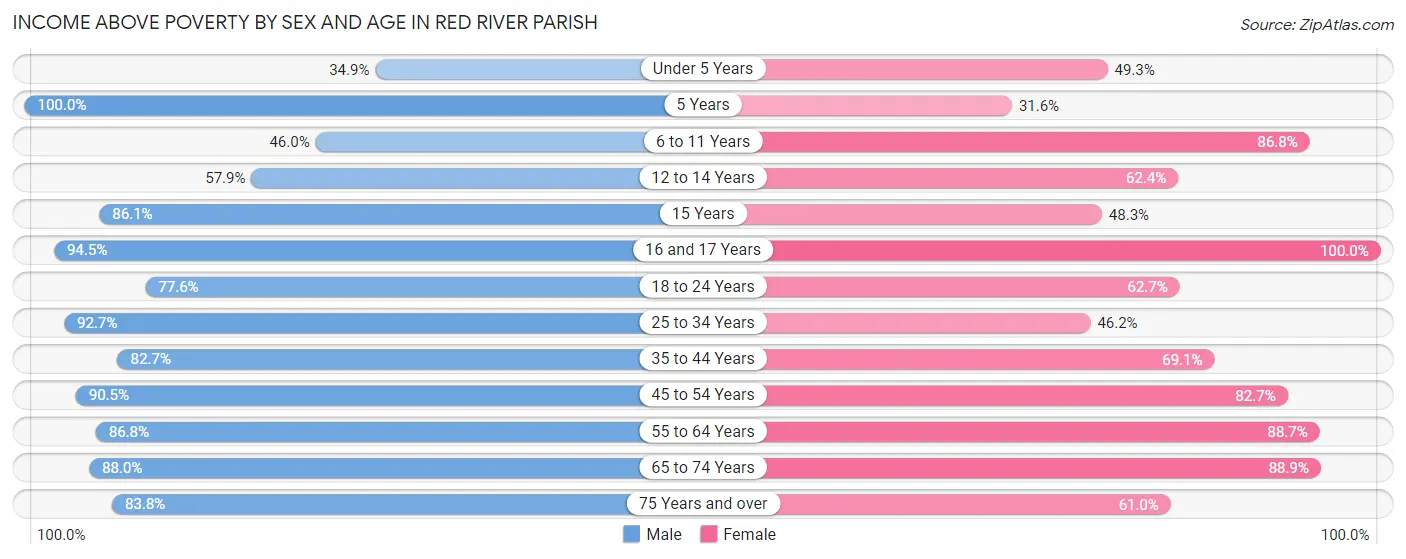
| Age Bracket | Male | Female |
| Under 5 Years | 66 (34.9%) | 74 (49.3%) |
| 5 Years | 28 (100.0%) | 12 (31.6%) |
| 6 to 11 Years | 144 (46.0%) | 158 (86.8%) |
| 12 to 14 Years | 117 (57.9%) | 98 (62.4%) |
| 15 Years | 31 (86.1%) | 28 (48.3%) |
| 16 and 17 Years | 173 (94.5%) | 94 (100.0%) |
| 18 to 24 Years | 294 (77.6%) | 215 (62.7%) |
| 25 to 34 Years | 455 (92.7%) | 198 (46.2%) |
| 35 to 44 Years | 278 (82.7%) | 327 (69.1%) |
| 45 to 54 Years | 333 (90.5%) | 316 (82.7%) |
| 55 to 64 Years | 453 (86.8%) | 509 (88.7%) |
| 65 to 74 Years | 331 (88.0%) | 336 (88.9%) |
| 75 Years and over | 155 (83.8%) | 246 (61.0%) |
| Total | 2,858 (79.2%) | 2,611 (71.3%) |
Income Below Poverty Among Married-Couple Families in Red River Parish
The poverty statistics for married-couple families in Red River Parish show that 5.9% or 75 of the total 1,267 families live below the poverty line. Families with 5 or more children have the highest poverty rate of 47.4%, comprising of 9 families. On the other hand, families with 1 or 2 children have the lowest poverty rate of 4.2%, which includes 15 families.
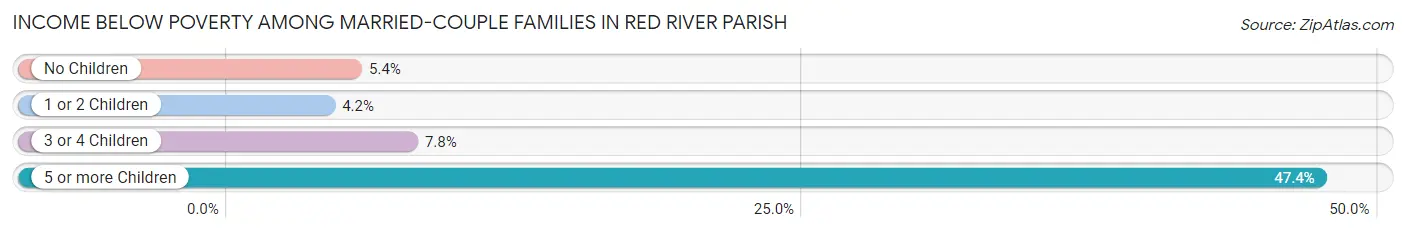
| Children | Above Poverty | Below Poverty |
| No Children | 736 (94.6%) | 42 (5.4%) |
| 1 or 2 Children | 340 (95.8%) | 15 (4.2%) |
| 3 or 4 Children | 106 (92.2%) | 9 (7.8%) |
| 5 or more Children | 10 (52.6%) | 9 (47.4%) |
| Total | 1,192 (94.1%) | 75 (5.9%) |
Income Below Poverty Among Single-Parent Households in Red River Parish
According to the poverty data in Red River Parish, 23.2% or 35 single-father households and 31.7% or 158 single-mother households are living below the poverty line. Among single-father households, those with 1 or 2 children have the highest poverty rate, with 35 households (34.3%) experiencing poverty. Likewise, among single-mother households, those with 3 or 4 children have the highest poverty rate, with 79 households (81.4%) falling below the poverty line.
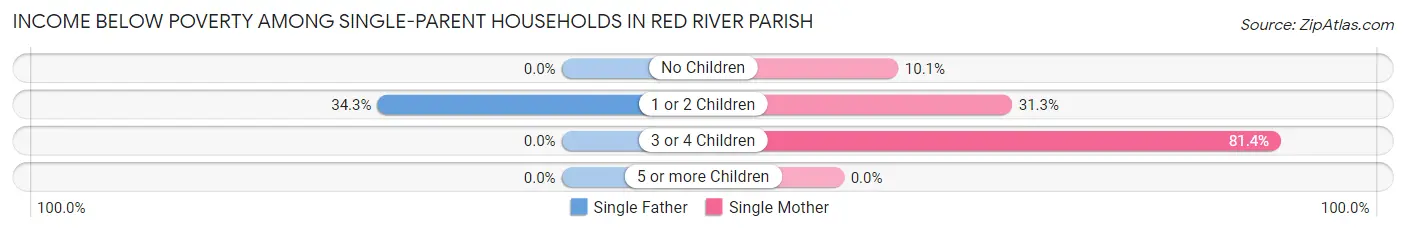
| Children | Single Father | Single Mother |
| No Children | 0 (0.0%) | 22 (10.1%) |
| 1 or 2 Children | 35 (34.3%) | 57 (31.3%) |
| 3 or 4 Children | 0 (0.0%) | 79 (81.4%) |
| 5 or more Children | 0 (0.0%) | 0 (0.0%) |
| Total | 35 (23.2%) | 158 (31.7%) |
Income Below Poverty Among Married-Couple vs Single-Parent Households in Red River Parish
The poverty data for Red River Parish shows that 75 of the married-couple family households (5.9%) and 193 of the single-parent households (29.7%) are living below the poverty level. Within the married-couple family households, those with 5 or more children have the highest poverty rate, with 9 households (47.4%) falling below the poverty line. Among the single-parent households, those with 3 or 4 children have the highest poverty rate, with 79 household (81.4%) living below poverty.
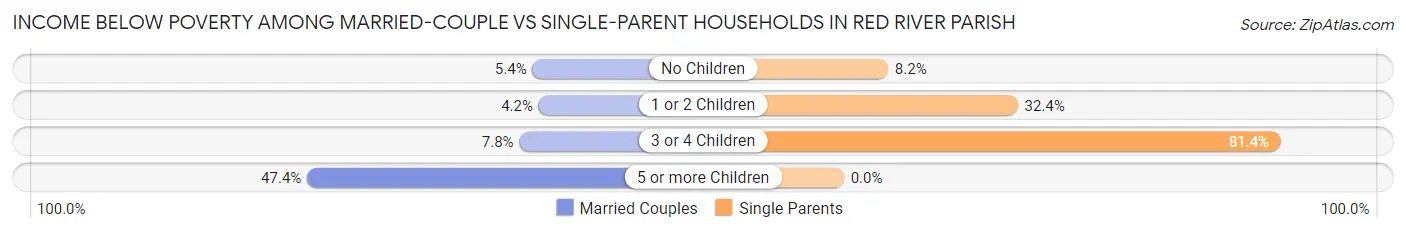
| Children | Married-Couple Families | Single-Parent Households |
| No Children | 42 (5.4%) | 22 (8.2%) |
| 1 or 2 Children | 15 (4.2%) | 92 (32.4%) |
| 3 or 4 Children | 9 (7.8%) | 79 (81.4%) |
| 5 or more Children | 9 (47.4%) | 0 (0.0%) |
| Total | 75 (5.9%) | 193 (29.7%) |
Race in Red River Parish
The most populous races in Red River Parish are White / Caucasian (4,398 | 57.6%), Black / African American (2,979 | 39.0%), and Two or more Races (241 | 3.2%).
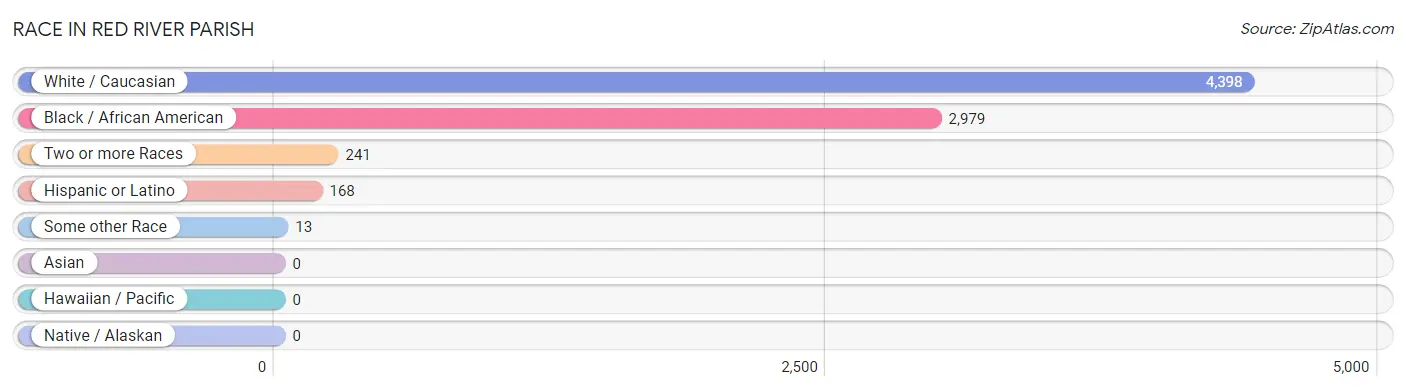
| Race | # Population | % Population |
| Asian | 0 | 0.0% |
| Black / African American | 2,979 | 39.0% |
| Hawaiian / Pacific | 0 | 0.0% |
| Hispanic or Latino | 168 | 2.2% |
| Native / Alaskan | 0 | 0.0% |
| White / Caucasian | 4,398 | 57.6% |
| Two or more Races | 241 | 3.2% |
| Some other Race | 13 | 0.2% |
| Total | 7,631 | 100.0% |
Ancestry in Red River Parish
The most populous ancestries reported in Red River Parish are American (1,171 | 15.3%), Irish (463 | 6.1%), German (408 | 5.3%), English (260 | 3.4%), and French (165 | 2.2%), together accounting for 32.3% of all Red River Parish residents.
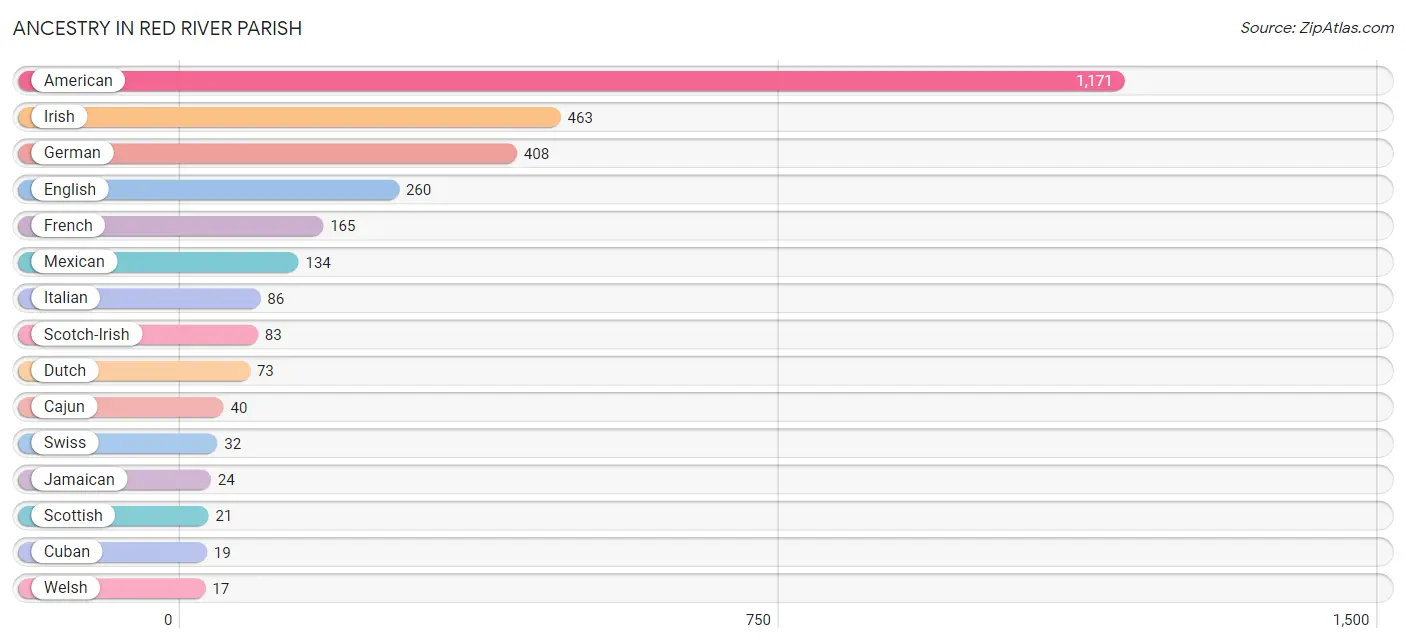
| Ancestry | # Population | % Population |
| American | 1,171 | 15.3% |
| British | 15 | 0.2% |
| Cajun | 40 | 0.5% |
| Cherokee | 9 | 0.1% |
| Choctaw | 9 | 0.1% |
| Cuban | 19 | 0.3% |
| Dutch | 73 | 1.0% |
| Eastern European | 1 | 0.0% |
| English | 260 | 3.4% |
| European | 6 | 0.1% |
| French | 165 | 2.2% |
| French Canadian | 4 | 0.1% |
| German | 408 | 5.3% |
| Irish | 463 | 6.1% |
| Italian | 86 | 1.1% |
| Jamaican | 24 | 0.3% |
| Mexican | 134 | 1.8% |
| Russian | 3 | 0.0% |
| Scotch-Irish | 83 | 1.1% |
| Scottish | 21 | 0.3% |
| Spaniard | 15 | 0.2% |
| Swiss | 32 | 0.4% |
| Welsh | 17 | 0.2% | View All 23 Rows |
Immigrants in Red River Parish
The most numerous immigrant groups reported in Red River Parish came from Latin America (32 | 0.4%), Caribbean (24 | 0.3%), Jamaica (24 | 0.3%), Central America (8 | 0.1%), and Mexico (8 | 0.1%), together accounting for 1.2% of all Red River Parish residents.
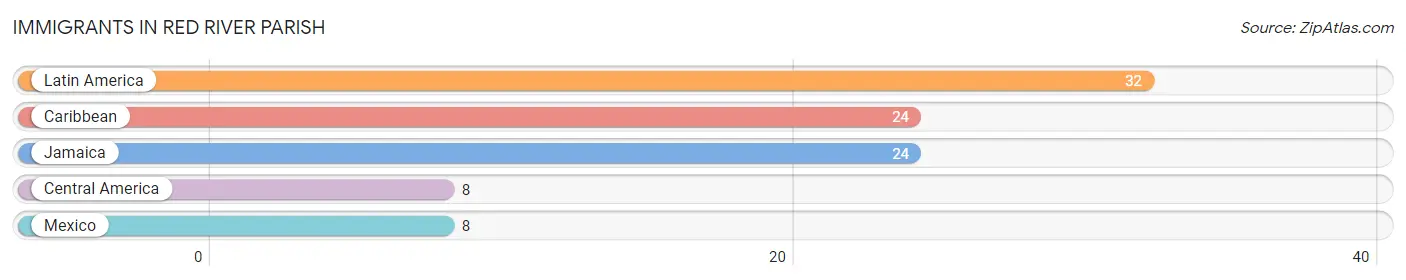
| Immigration Origin | # Population | % Population |
| Caribbean | 24 | 0.3% |
| Central America | 8 | 0.1% |
| Jamaica | 24 | 0.3% |
| Latin America | 32 | 0.4% |
| Mexico | 8 | 0.1% | View All 5 Rows |
Sex and Age in Red River Parish
Sex and Age in Red River Parish
The most populous age groups in Red River Parish are 30 to 34 Years (375 | 9.8%) for men and 60 to 64 Years (302 | 8.0%) for women.
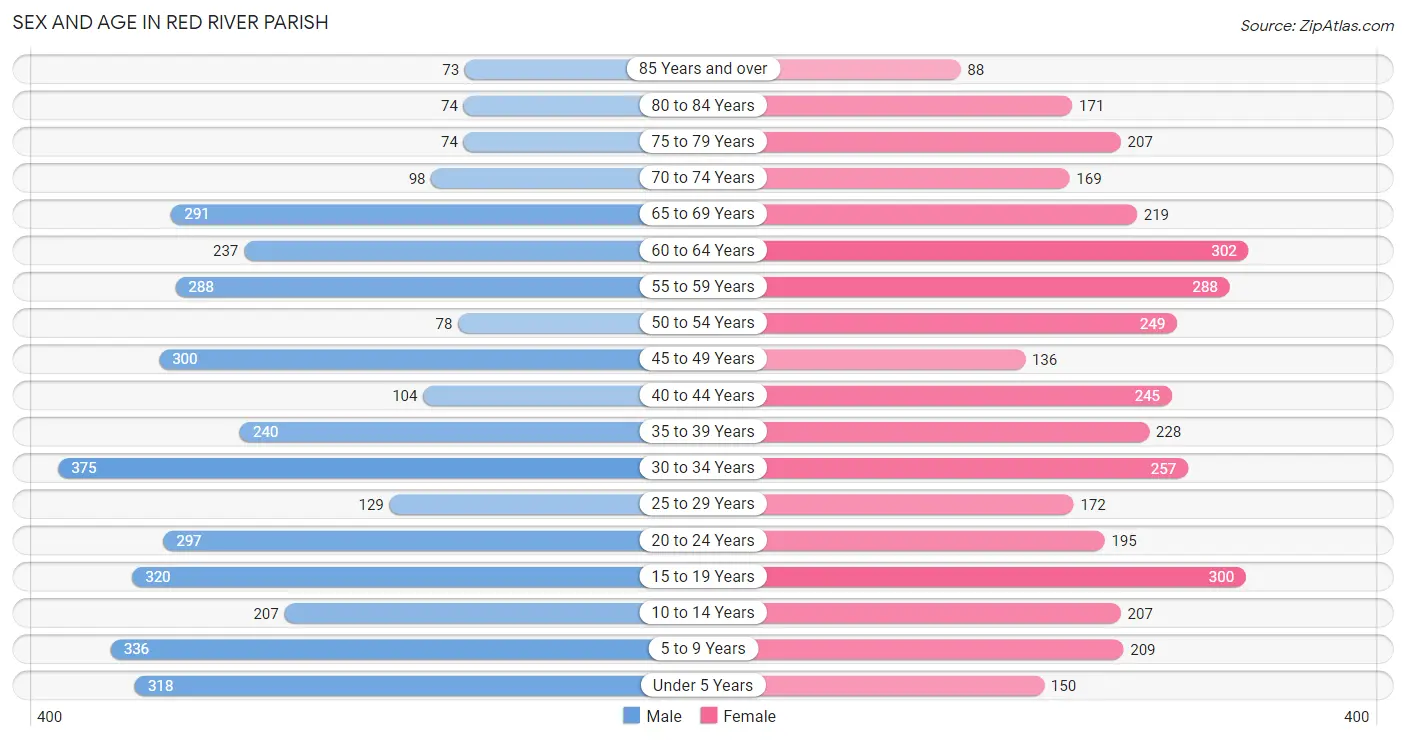
| Age Bracket | Male | Female |
| Under 5 Years | 318 (8.3%) | 150 (4.0%) |
| 5 to 9 Years | 336 (8.7%) | 209 (5.5%) |
| 10 to 14 Years | 207 (5.4%) | 207 (5.5%) |
| 15 to 19 Years | 320 (8.3%) | 300 (7.9%) |
| 20 to 24 Years | 297 (7.7%) | 195 (5.1%) |
| 25 to 29 Years | 129 (3.4%) | 172 (4.5%) |
| 30 to 34 Years | 375 (9.8%) | 257 (6.8%) |
| 35 to 39 Years | 240 (6.2%) | 228 (6.0%) |
| 40 to 44 Years | 104 (2.7%) | 245 (6.5%) |
| 45 to 49 Years | 300 (7.8%) | 136 (3.6%) |
| 50 to 54 Years | 78 (2.0%) | 249 (6.6%) |
| 55 to 59 Years | 288 (7.5%) | 288 (7.6%) |
| 60 to 64 Years | 237 (6.2%) | 302 (8.0%) |
| 65 to 69 Years | 291 (7.6%) | 219 (5.8%) |
| 70 to 74 Years | 98 (2.5%) | 169 (4.5%) |
| 75 to 79 Years | 74 (1.9%) | 207 (5.5%) |
| 80 to 84 Years | 74 (1.9%) | 171 (4.5%) |
| 85 Years and over | 73 (1.9%) | 88 (2.3%) |
| Total | 3,839 (100.0%) | 3,792 (100.0%) |
Families and Households in Red River Parish
Median Family Size in Red River Parish
The median family size in Red River Parish is 3.09 persons per family, with single female/mother families (499 | 26.0%) accounting for the largest median family size of 3.35 persons per family. On the other hand, single male/father families (151 | 7.9%) represent the smallest median family size with 2.30 persons per family.
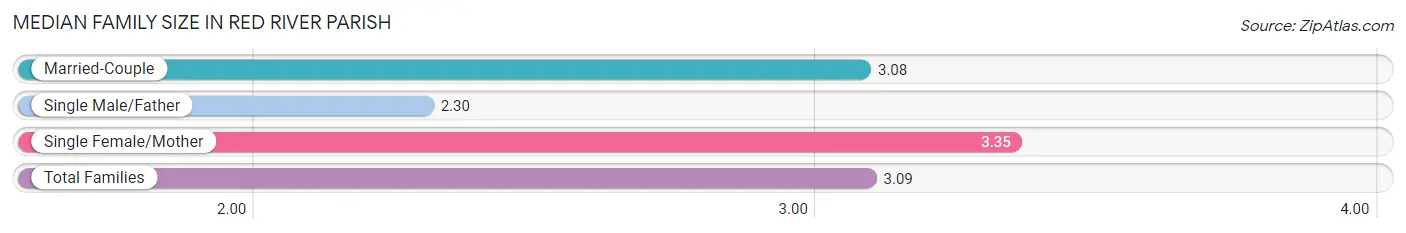
| Family Type | # Families | Family Size |
| Married-Couple | 1,267 (66.1%) | 3.08 |
| Single Male/Father | 151 (7.9%) | 2.30 |
| Single Female/Mother | 499 (26.0%) | 3.35 |
| Total Families | 1,917 (100.0%) | 3.09 |
Median Household Size in Red River Parish
The median household size in Red River Parish is 2.53 persons per household, with single female/mother households (499 | 17.0%) accounting for the largest median household size of 3.51 persons per household. non-family households (1,017 | 34.7%) represent the smallest median household size with 1.19 persons per household.
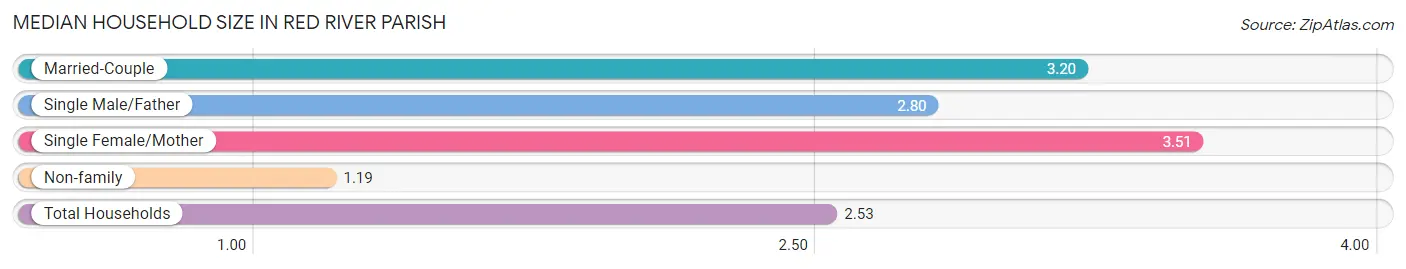
| Household Type | # Households | Household Size |
| Married-Couple | 1,267 (43.2%) | 3.20 |
| Single Male/Father | 151 (5.1%) | 2.80 |
| Single Female/Mother | 499 (17.0%) | 3.51 |
| Non-family | 1,017 (34.7%) | 1.19 |
| Total Households | 2,934 (100.0%) | 2.53 |
Household Size by Marriage Status in Red River Parish
Out of a total of 2,934 households in Red River Parish, 1,917 (65.3%) are family households, while 1,017 (34.7%) are nonfamily households. The most numerous type of family households are 2-person households, comprising 834, and the most common type of nonfamily households are 1-person households, comprising 860.
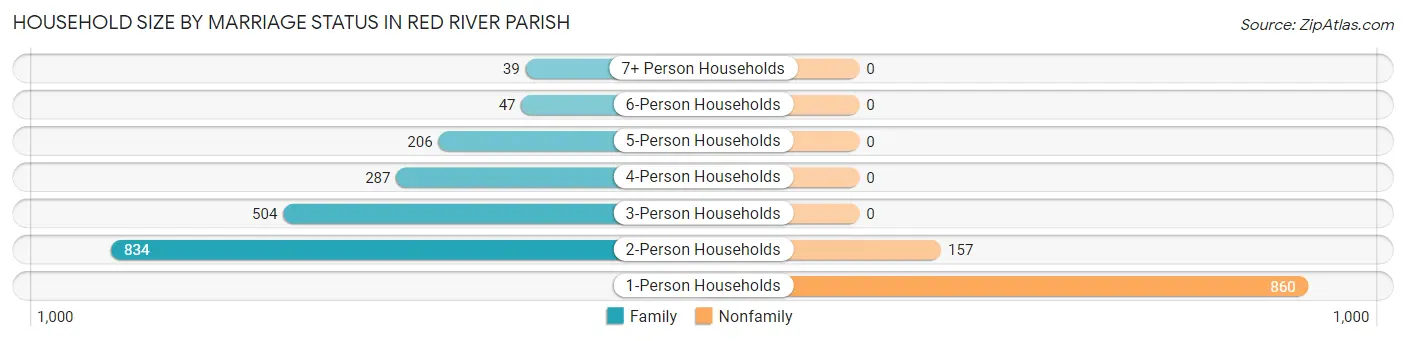
| Household Size | Family Households | Nonfamily Households |
| 1-Person Households | - | 860 (29.3%) |
| 2-Person Households | 834 (28.4%) | 157 (5.3%) |
| 3-Person Households | 504 (17.2%) | 0 (0.0%) |
| 4-Person Households | 287 (9.8%) | 0 (0.0%) |
| 5-Person Households | 206 (7.0%) | 0 (0.0%) |
| 6-Person Households | 47 (1.6%) | 0 (0.0%) |
| 7+ Person Households | 39 (1.3%) | 0 (0.0%) |
| Total | 1,917 (65.3%) | 1,017 (34.7%) |
Female Fertility in Red River Parish
Fertility by Age in Red River Parish
Average fertility rate in Red River Parish is 20.0 births per 1,000 women. Women in the age bracket of 35 to 50 years have the highest fertility rate with 32.0 births per 1,000 women. Women in the age bracket of 35 to 50 years acount for 65.6% of all women with births.
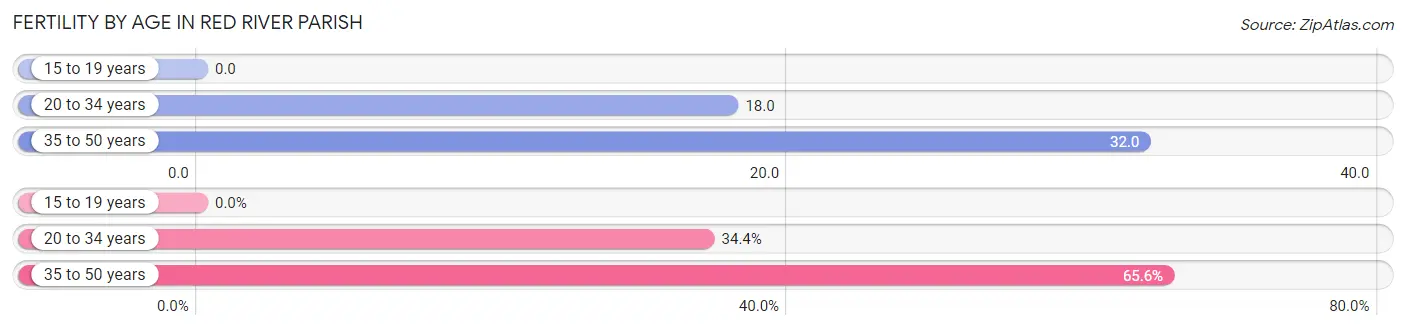
| Age Bracket | Women with Births | Births / 1,000 Women |
| 15 to 19 years | 0 (0.0%) | 0.0 |
| 20 to 34 years | 11 (34.4%) | 18.0 |
| 35 to 50 years | 21 (65.6%) | 32.0 |
| Total | 32 (100.0%) | 20.0 |
Fertility by Age by Marriage Status in Red River Parish
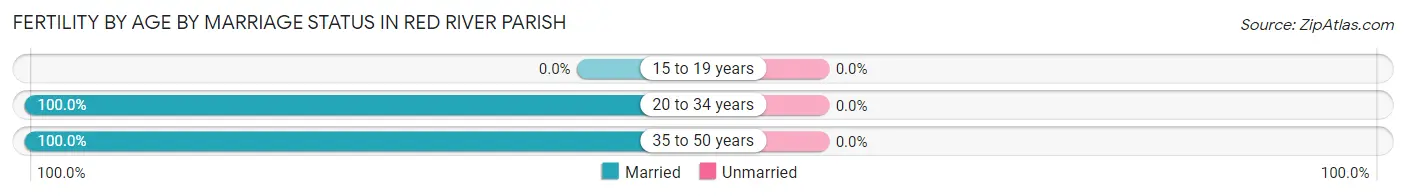
| Age Bracket | Married | Unmarried |
| 15 to 19 years | 0 (0.0%) | 0 (0.0%) |
| 20 to 34 years | 11 (100.0%) | 0 (0.0%) |
| 35 to 50 years | 21 (100.0%) | 0 (0.0%) |
| Total | 32 (100.0%) | 0 (0.0%) |
Fertility by Education in Red River Parish
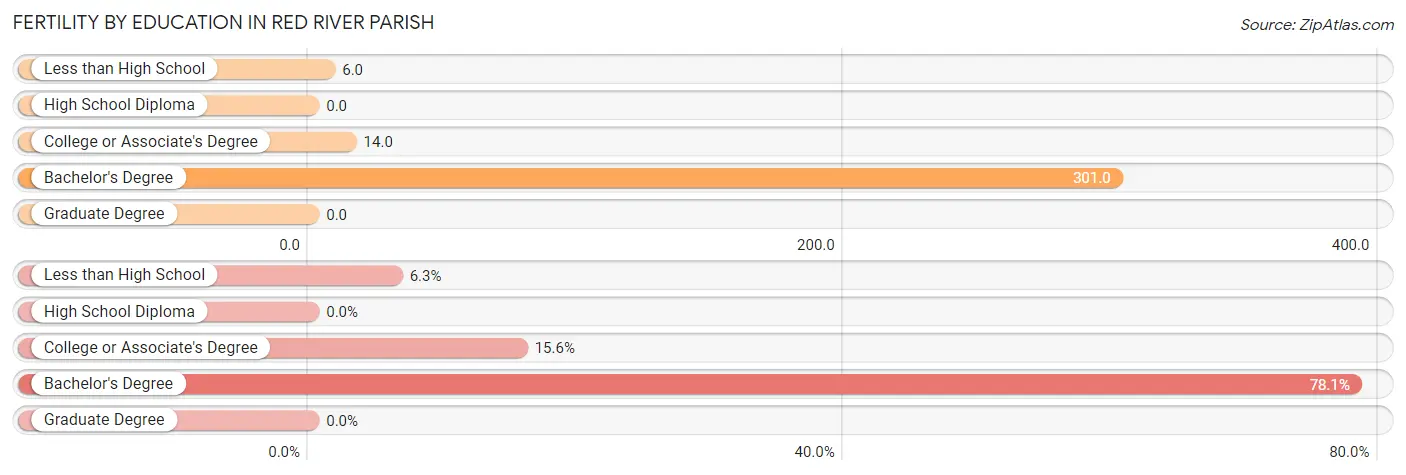
| Educational Attainment | Women with Births | Births / 1,000 Women |
| Less than High School | 2 (6.2%) | 6.0 |
| High School Diploma | 0 (0.0%) | 0.0 |
| College or Associate's Degree | 5 (15.6%) | 14.0 |
| Bachelor's Degree | 25 (78.1%) | 301.0 |
| Graduate Degree | 0 (0.0%) | 0.0 |
| Total | 32 (100.0%) | 20.0 |
Fertility by Education by Marriage Status in Red River Parish
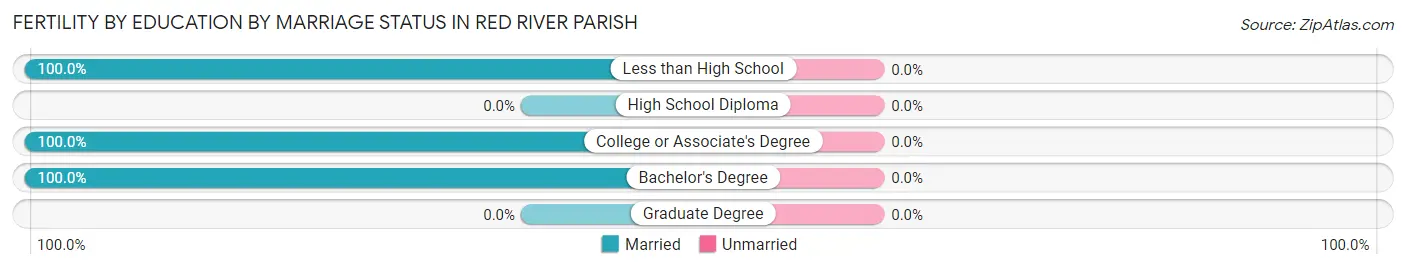
| Educational Attainment | Married | Unmarried |
| Less than High School | 2 (100.0%) | 0 (0.0%) |
| High School Diploma | 0 (0.0%) | 0 (0.0%) |
| College or Associate's Degree | 5 (100.0%) | 0 (0.0%) |
| Bachelor's Degree | 25 (100.0%) | 0 (0.0%) |
| Graduate Degree | 0 (0.0%) | 0 (0.0%) |
| Total | 32 (100.0%) | 0 (0.0%) |
Employment Characteristics in Red River Parish
Employment by Class of Employer in Red River Parish
Among the 2,849 employed individuals in Red River Parish, private company employees (1,887 | 66.2%), state government employees (330 | 11.6%), and local government employees (245 | 8.6%) make up the most common classes of employment.
| Employer Class | # Employees | % Employees |
| Private Company Employees | 1,887 | 66.2% |
| Self-Employed (Incorporated) | 74 | 2.6% |
| Self-Employed (Not Incorporated) | 103 | 3.6% |
| Not-for-profit Organizations | 146 | 5.1% |
| Local Government Employees | 245 | 8.6% |
| State Government Employees | 330 | 11.6% |
| Federal Government Employees | 64 | 2.2% |
| Unpaid Family Workers | 0 | 0.0% |
| Total | 2,849 | 100.0% |
Employment Status by Age in Red River Parish
According to the labor force statistics for Red River Parish, out of the total population over 16 years of age (6,110), 49.4% or 3,018 individuals are in the labor force, with 3.3% or 100 of them unemployed. The age group with the highest labor force participation rate is 20 to 24 years, with 78.3% or 385 individuals in the labor force. Within the labor force, the 65 to 74 years age range has the highest percentage of unemployed individuals, with 33.7% or 35 of them being unemployed.
| Age Bracket | In Labor Force | Unemployed |
| 16 to 19 Years | 258 (49.0%) | 4 (1.6%) |
| 20 to 24 Years | 385 (78.3%) | 11 (2.9%) |
| 25 to 29 Years | 160 (53.2%) | 6 (3.8%) |
| 30 to 34 Years | 454 (71.8%) | 24 (5.3%) |
| 35 to 44 Years | 509 (62.3%) | 17 (3.3%) |
| 45 to 54 Years | 588 (77.1%) | 2 (0.3%) |
| 55 to 59 Years | 303 (52.6%) | 0 (0.0%) |
| 60 to 64 Years | 243 (45.1%) | 0 (0.0%) |
| 65 to 74 Years | 104 (13.4%) | 35 (33.7%) |
| 75 Years and over | 12 (1.7%) | 2 (16.7%) |
| Total | 3,018 (49.4%) | 100 (3.3%) |
Employment Status by Educational Attainment in Red River Parish
According to labor force statistics for Red River Parish, 62.2% of individuals (2,257) out of the total population between 25 and 64 years of age (3,628) are in the labor force, with 2.2% or 50 of them being unemployed. The group with the highest labor force participation rate are those with the educational attainment of bachelor's degree or higher, with 81.3% or 343 individuals in the labor force. Within the labor force, individuals with less than high school education have the highest percentage of unemployment, with 8.8% or 16 of them being unemployed.
| Educational Attainment | In Labor Force | Unemployed |
| Less than High School | 182 (36.5%) | 44 (8.8%) |
| High School Diploma | 1,064 (57.2%) | 28 (1.5%) |
| College / Associate Degree | 669 (79.0%) | 3 (0.3%) |
| Bachelor's Degree or higher | 343 (81.3%) | 19 (4.4%) |
| Total | 2,257 (62.2%) | 80 (2.2%) |
Employment Occupations by Sex in Red River Parish
Management, Business, Science and Arts Occupations
The most common Management, Business, Science and Arts occupations in Red River Parish are Health Diagnosing & Treating (239 | 8.2%), Community & Social Service (185 | 6.4%), Management (114 | 3.9%), Education Instruction & Library (110 | 3.8%), and Business & Financial (97 | 3.3%).
Management, Business, Science and Arts Occupations by Sex
Within the Management, Business, Science and Arts occupations in Red River Parish, the most male-oriented occupations are Architecture & Engineering (100.0%), Business & Financial (90.7%), and Management (84.2%), while the most female-oriented occupations are Health Diagnosing & Treating (86.2%), Education Instruction & Library (82.7%), and Health Technologists (69.8%).
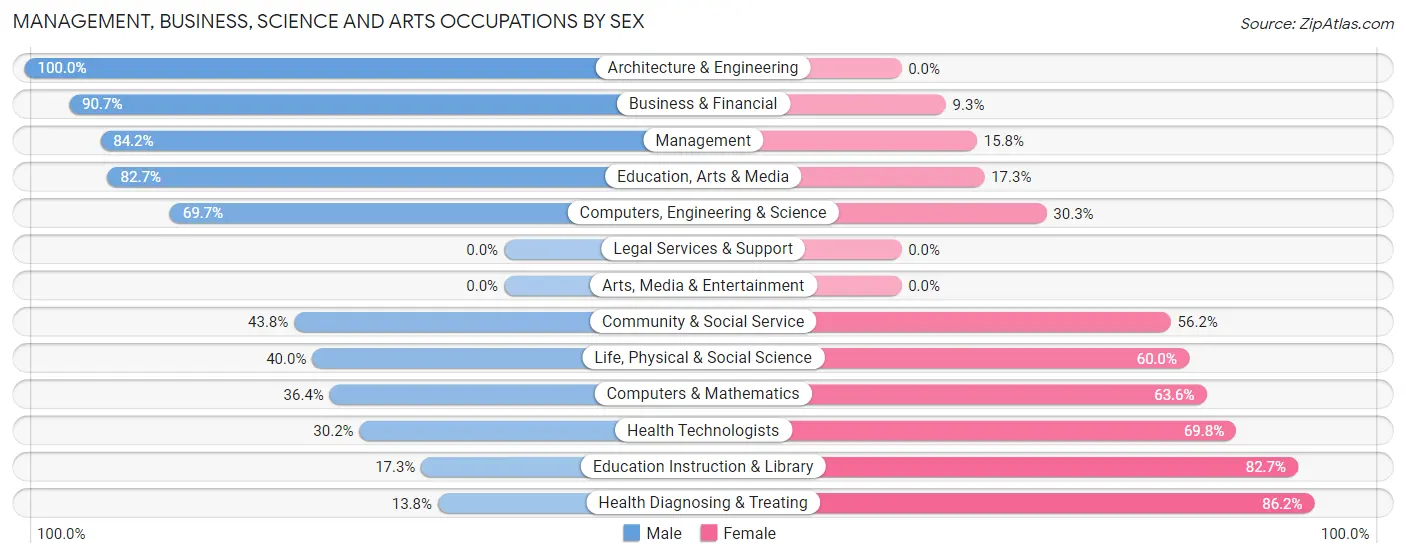
| Occupation | Male | Female |
| Management | 96 (84.2%) | 18 (15.8%) |
| Business & Financial | 88 (90.7%) | 9 (9.3%) |
| Computers, Engineering & Science | 23 (69.7%) | 10 (30.3%) |
| Computers & Mathematics | 4 (36.4%) | 7 (63.6%) |
| Architecture & Engineering | 17 (100.0%) | 0 (0.0%) |
| Life, Physical & Social Science | 2 (40.0%) | 3 (60.0%) |
| Community & Social Service | 81 (43.8%) | 104 (56.2%) |
| Education, Arts & Media | 62 (82.7%) | 13 (17.3%) |
| Legal Services & Support | 0 (0.0%) | 0 (0.0%) |
| Education Instruction & Library | 19 (17.3%) | 91 (82.7%) |
| Arts, Media & Entertainment | 0 (0.0%) | 0 (0.0%) |
| Health Diagnosing & Treating | 33 (13.8%) | 206 (86.2%) |
| Health Technologists | 19 (30.2%) | 44 (69.8%) |
| Total (Category) | 321 (48.0%) | 347 (51.9%) |
| Total (Overall) | 1,600 (54.9%) | 1,315 (45.1%) |
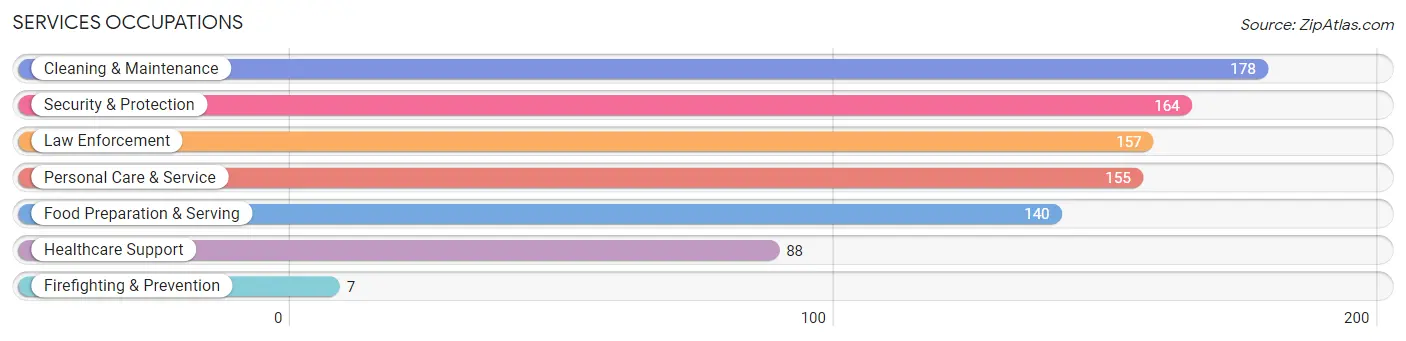
Services Occupations
The most common Services occupations in Red River Parish are Cleaning & Maintenance (178 | 6.1%), Security & Protection (164 | 5.6%), Law Enforcement (157 | 5.4%), Personal Care & Service (155 | 5.3%), and Food Preparation & Serving (140 | 4.8%).
Services Occupations by Sex
Within the Services occupations in Red River Parish, the most male-oriented occupations are Firefighting & Prevention (100.0%), Food Preparation & Serving (70.0%), and Cleaning & Maintenance (28.1%), while the most female-oriented occupations are Healthcare Support (100.0%), Personal Care & Service (84.5%), and Law Enforcement (78.3%).
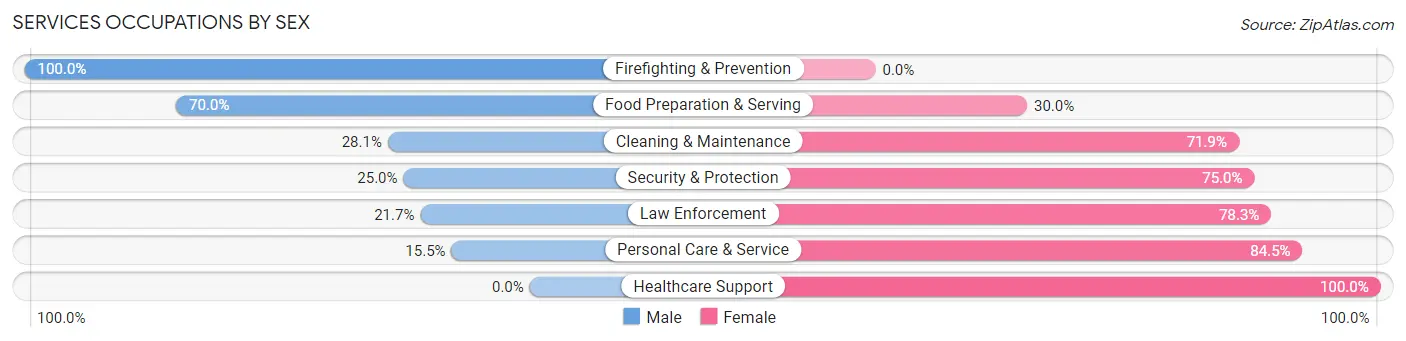
| Occupation | Male | Female |
| Healthcare Support | 0 (0.0%) | 88 (100.0%) |
| Security & Protection | 41 (25.0%) | 123 (75.0%) |
| Firefighting & Prevention | 7 (100.0%) | 0 (0.0%) |
| Law Enforcement | 34 (21.7%) | 123 (78.3%) |
| Food Preparation & Serving | 98 (70.0%) | 42 (30.0%) |
| Cleaning & Maintenance | 50 (28.1%) | 128 (71.9%) |
| Personal Care & Service | 24 (15.5%) | 131 (84.5%) |
| Total (Category) | 213 (29.4%) | 512 (70.6%) |
| Total (Overall) | 1,600 (54.9%) | 1,315 (45.1%) |
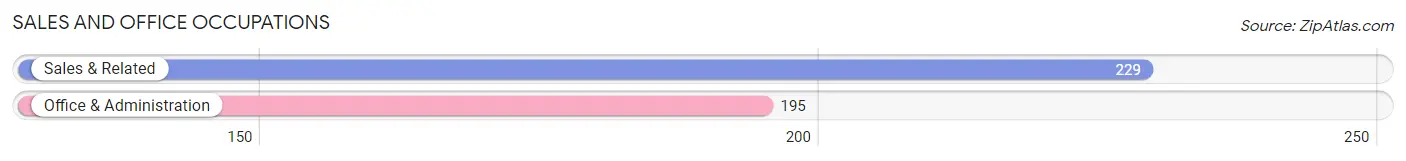
Sales and Office Occupations
The most common Sales and Office occupations in Red River Parish are Sales & Related (229 | 7.9%), and Office & Administration (195 | 6.7%).
Sales and Office Occupations by Sex

| Occupation | Male | Female |
| Sales & Related | 84 (36.7%) | 145 (63.3%) |
| Office & Administration | 25 (12.8%) | 170 (87.2%) |
| Total (Category) | 109 (25.7%) | 315 (74.3%) |
| Total (Overall) | 1,600 (54.9%) | 1,315 (45.1%) |
Natural Resources, Construction and Maintenance Occupations
The most common Natural Resources, Construction and Maintenance occupations in Red River Parish are Construction & Extraction (250 | 8.6%), Installation, Maintenance & Repair (232 | 8.0%), and Farming, Fishing & Forestry (60 | 2.1%).
Natural Resources, Construction and Maintenance Occupations by Sex
| Occupation | Male | Female |
| Farming, Fishing & Forestry | 43 (71.7%) | 17 (28.3%) |
| Construction & Extraction | 248 (99.2%) | 2 (0.8%) |
| Installation, Maintenance & Repair | 232 (100.0%) | 0 (0.0%) |
| Total (Category) | 523 (96.5%) | 19 (3.5%) |
| Total (Overall) | 1,600 (54.9%) | 1,315 (45.1%) |
Production, Transportation and Moving Occupations
The most common Production, Transportation and Moving occupations in Red River Parish are Production (232 | 8.0%), Transportation (229 | 7.9%), and Material Moving (95 | 3.3%).
Production, Transportation and Moving Occupations by Sex
| Occupation | Male | Female |
| Production | 197 (84.9%) | 35 (15.1%) |
| Transportation | 142 (62.0%) | 87 (38.0%) |
| Material Moving | 95 (100.0%) | 0 (0.0%) |
| Total (Category) | 434 (78.1%) | 122 (21.9%) |
| Total (Overall) | 1,600 (54.9%) | 1,315 (45.1%) |
Employment Industries by Sex in Red River Parish
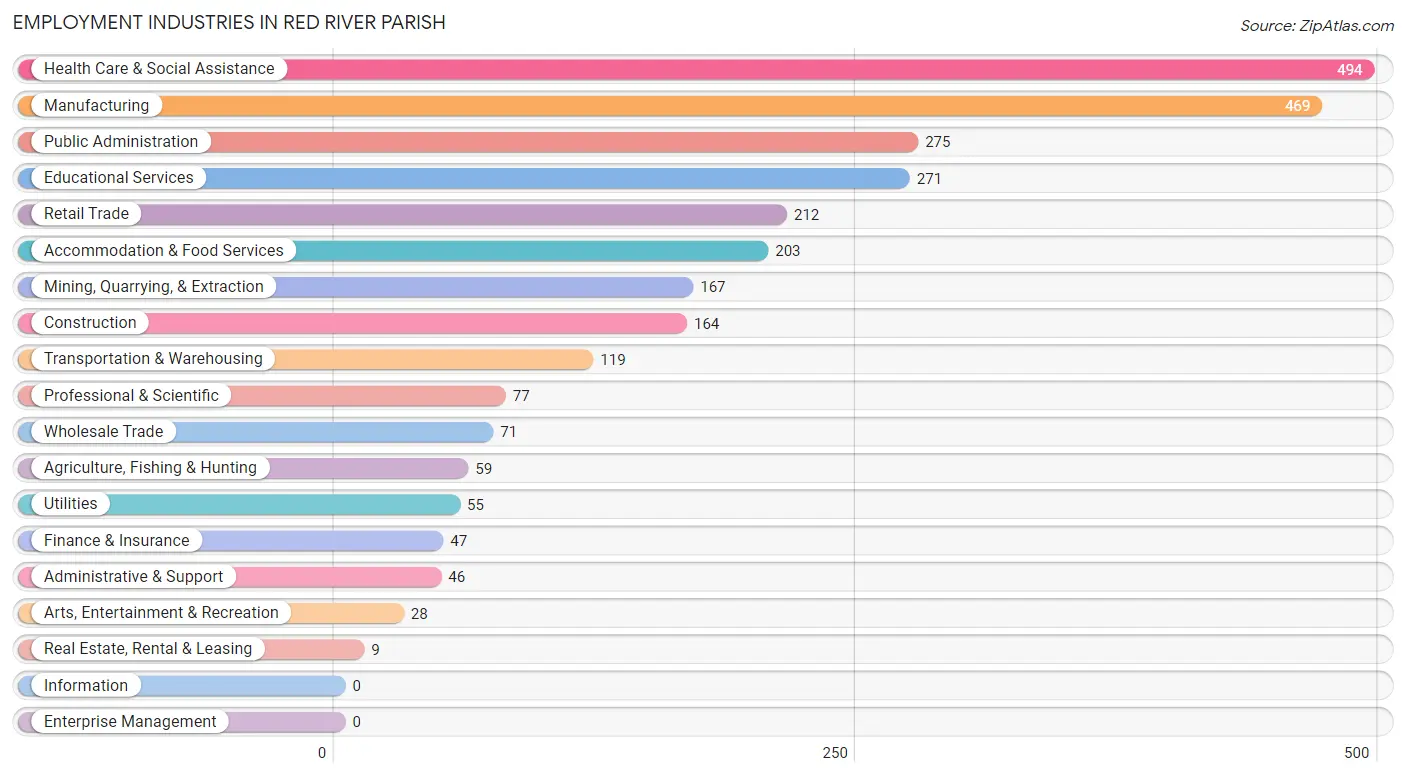
Employment Industries in Red River Parish
The major employment industries in Red River Parish include Health Care & Social Assistance (494 | 17.0%), Manufacturing (469 | 16.1%), Public Administration (275 | 9.4%), Educational Services (271 | 9.3%), and Retail Trade (212 | 7.3%).
Employment Industries by Sex in Red River Parish
The Red River Parish industries that see more men than women are Construction (100.0%), Real Estate, Rental & Leasing (100.0%), and Arts, Entertainment & Recreation (100.0%), whereas the industries that tend to have a higher number of women are Health Care & Social Assistance (93.7%), Educational Services (81.9%), and Administrative & Support (73.9%).
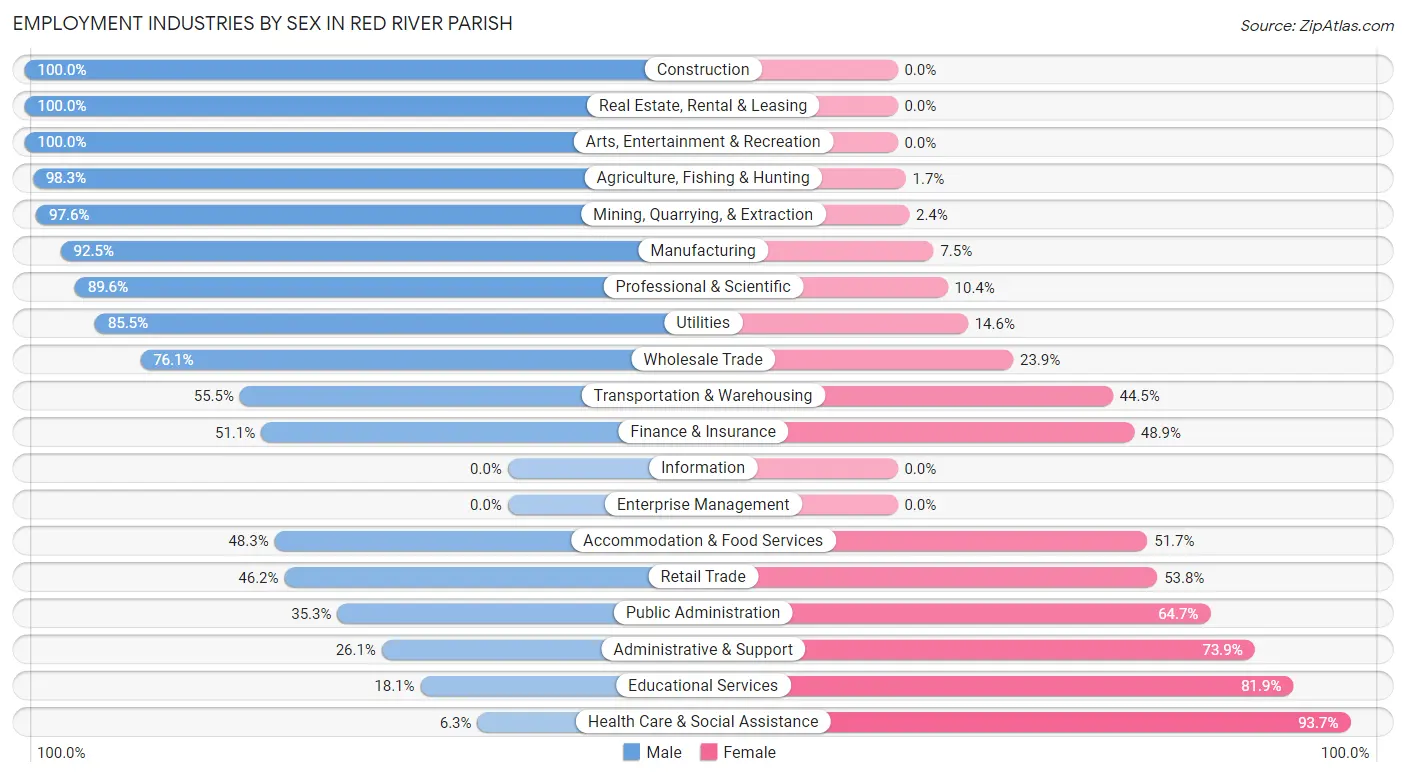
| Industry | Male | Female |
| Agriculture, Fishing & Hunting | 58 (98.3%) | 1 (1.7%) |
| Mining, Quarrying, & Extraction | 163 (97.6%) | 4 (2.4%) |
| Construction | 164 (100.0%) | 0 (0.0%) |
| Manufacturing | 434 (92.5%) | 35 (7.5%) |
| Wholesale Trade | 54 (76.1%) | 17 (23.9%) |
| Retail Trade | 98 (46.2%) | 114 (53.8%) |
| Transportation & Warehousing | 66 (55.5%) | 53 (44.5%) |
| Utilities | 47 (85.5%) | 8 (14.5%) |
| Information | 0 (0.0%) | 0 (0.0%) |
| Finance & Insurance | 24 (51.1%) | 23 (48.9%) |
| Real Estate, Rental & Leasing | 9 (100.0%) | 0 (0.0%) |
| Professional & Scientific | 69 (89.6%) | 8 (10.4%) |
| Enterprise Management | 0 (0.0%) | 0 (0.0%) |
| Administrative & Support | 12 (26.1%) | 34 (73.9%) |
| Educational Services | 49 (18.1%) | 222 (81.9%) |
| Health Care & Social Assistance | 31 (6.3%) | 463 (93.7%) |
| Arts, Entertainment & Recreation | 28 (100.0%) | 0 (0.0%) |
| Accommodation & Food Services | 98 (48.3%) | 105 (51.7%) |
| Public Administration | 97 (35.3%) | 178 (64.7%) |
| Total | 1,600 (54.9%) | 1,315 (45.1%) |
Education in Red River Parish
School Enrollment in Red River Parish
The most common levels of schooling among the 1,709 students in Red River Parish are middle school (429 | 25.1%), high school (375 | 21.9%), and elementary school (357 | 20.9%).
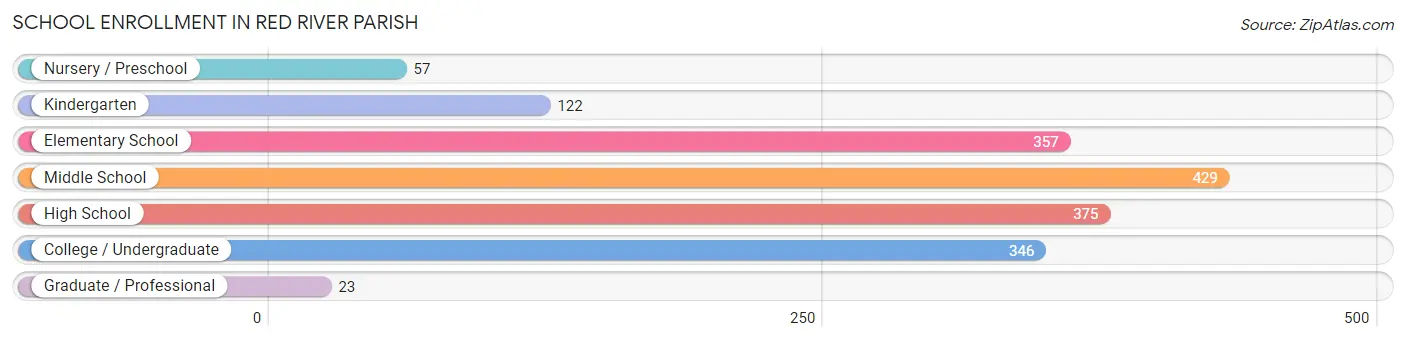
| School Level | # Students | % Students |
| Nursery / Preschool | 57 | 3.3% |
| Kindergarten | 122 | 7.1% |
| Elementary School | 357 | 20.9% |
| Middle School | 429 | 25.1% |
| High School | 375 | 21.9% |
| College / Undergraduate | 346 | 20.3% |
| Graduate / Professional | 23 | 1.3% |
| Total | 1,709 | 100.0% |
School Enrollment by Age by Funding Source in Red River Parish
Out of a total of 1,709 students who are enrolled in schools in Red River Parish, 284 (16.6%) attend a private institution, while the remaining 1,425 (83.4%) are enrolled in public schools. The age group of 18 to 19 year olds has the highest likelihood of being enrolled in private schools, with 75 (33.3% in the age bracket) enrolled. Conversely, the age group of 20 to 24 year olds has the lowest likelihood of being enrolled in a private school, with 153 (100.0% in the age bracket) attending a public institution.
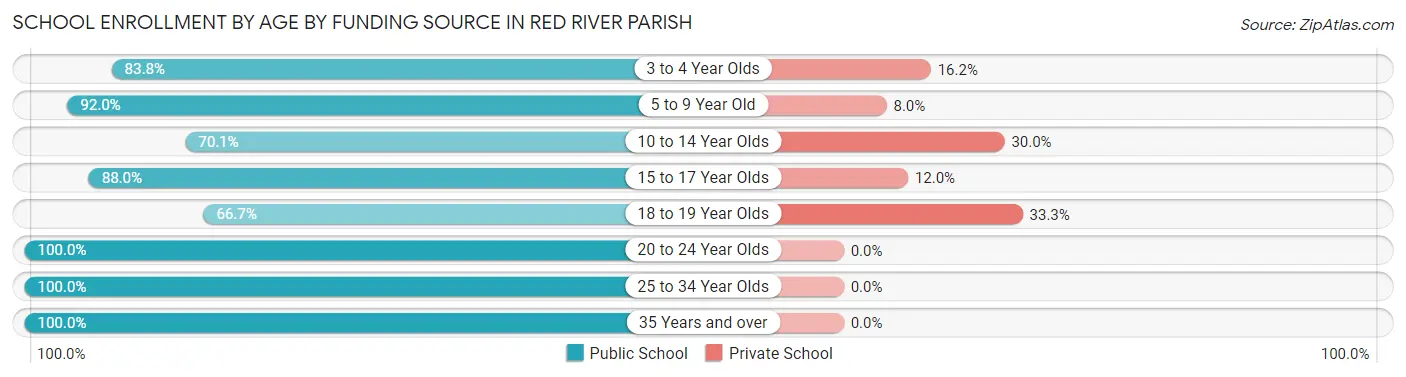
| Age Bracket | Public School | Private School |
| 3 to 4 Year Olds | 31 (83.8%) | 6 (16.2%) |
| 5 to 9 Year Old | 473 (92.0%) | 41 (8.0%) |
| 10 to 14 Year Olds | 290 (70.1%) | 124 (29.9%) |
| 15 to 17 Year Olds | 272 (88.0%) | 37 (12.0%) |
| 18 to 19 Year Olds | 150 (66.7%) | 75 (33.3%) |
| 20 to 24 Year Olds | 153 (100.0%) | 0 (0.0%) |
| 25 to 34 Year Olds | 30 (100.0%) | 0 (0.0%) |
| 35 Years and over | 27 (100.0%) | 0 (0.0%) |
| Total | 1,425 (83.4%) | 284 (16.6%) |
Educational Attainment by Field of Study in Red River Parish
Education (161 | 28.2%), liberal arts & history (102 | 17.9%), business (69 | 12.1%), science & technology (67 | 11.7%), and arts & humanities (48 | 8.4%) are the most common fields of study among 570 individuals in Red River Parish who have obtained a bachelor's degree or higher.
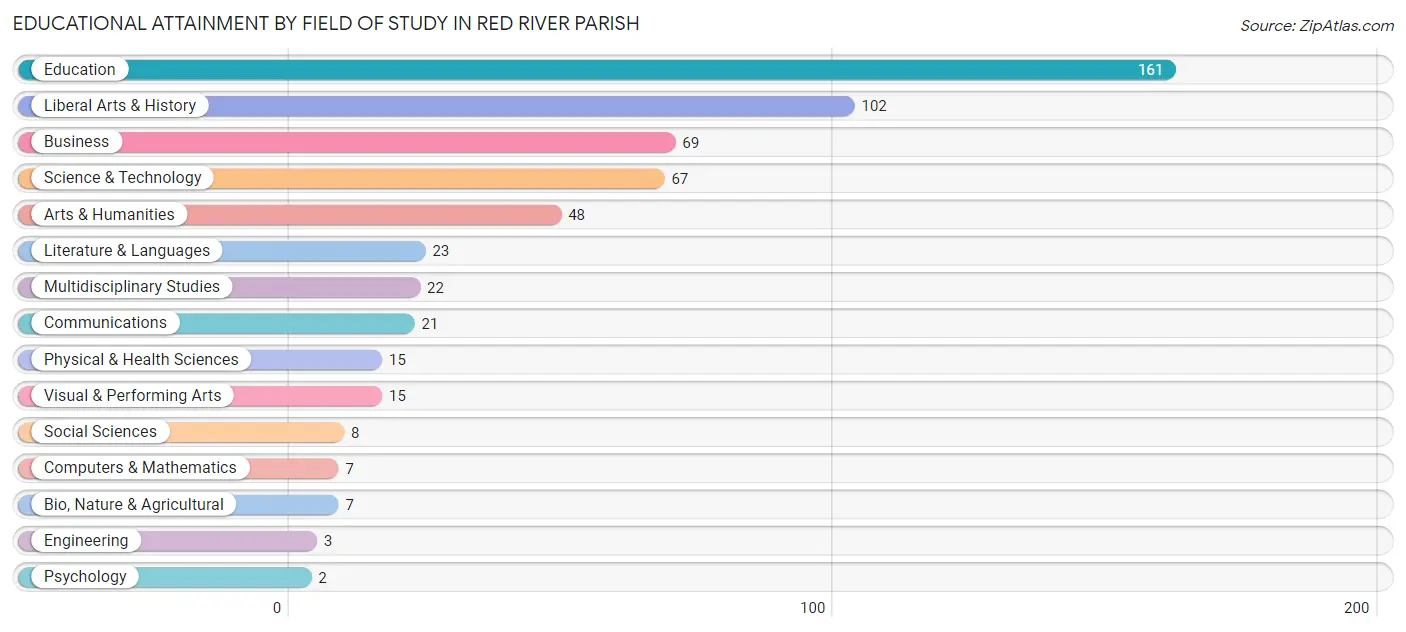
| Field of Study | # Graduates | % Graduates |
| Computers & Mathematics | 7 | 1.2% |
| Bio, Nature & Agricultural | 7 | 1.2% |
| Physical & Health Sciences | 15 | 2.6% |
| Psychology | 2 | 0.4% |
| Social Sciences | 8 | 1.4% |
| Engineering | 3 | 0.5% |
| Multidisciplinary Studies | 22 | 3.9% |
| Science & Technology | 67 | 11.7% |
| Business | 69 | 12.1% |
| Education | 161 | 28.2% |
| Literature & Languages | 23 | 4.0% |
| Liberal Arts & History | 102 | 17.9% |
| Visual & Performing Arts | 15 | 2.6% |
| Communications | 21 | 3.7% |
| Arts & Humanities | 48 | 8.4% |
| Total | 570 | 100.0% |
Transportation & Commute in Red River Parish
Vehicle Availability by Sex in Red River Parish
The most prevalent vehicle ownership categories in Red River Parish are males with 2 vehicles (753, accounting for 47.4%) and females with 2 vehicles (482, making up 59.8%).
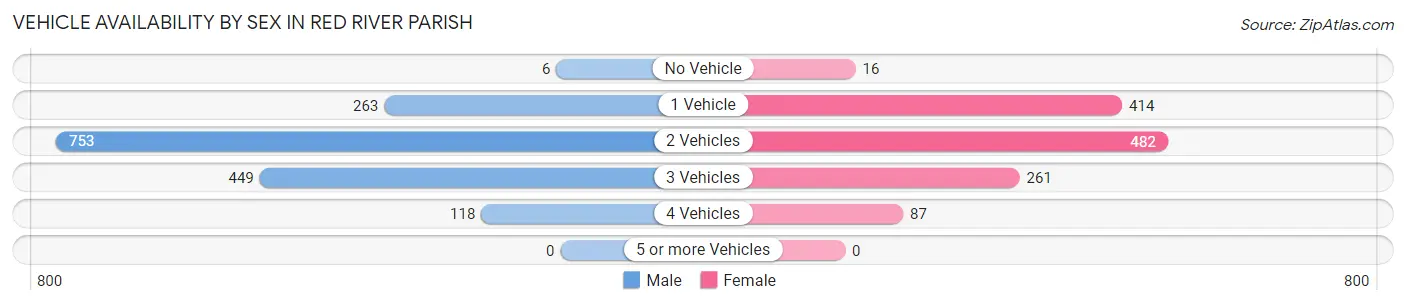
| Vehicles Available | Male | Female |
| No Vehicle | 6 (0.4%) | 16 (1.3%) |
| 1 Vehicle | 263 (16.6%) | 414 (32.9%) |
| 2 Vehicles | 753 (47.4%) | 482 (38.3%) |
| 3 Vehicles | 449 (28.3%) | 261 (20.7%) |
| 4 Vehicles | 118 (7.4%) | 87 (6.9%) |
| 5 or more Vehicles | 0 (0.0%) | 0 (0.0%) |
| Total | 1,589 (100.0%) | 1,260 (100.0%) |
Commute Time in Red River Parish
The most frequently occuring commute durations in Red River Parish are 15 to 19 minutes (781 commuters, 27.6%), 45 to 59 minutes (388 commuters, 13.7%), and 5 to 9 minutes (374 commuters, 13.2%).
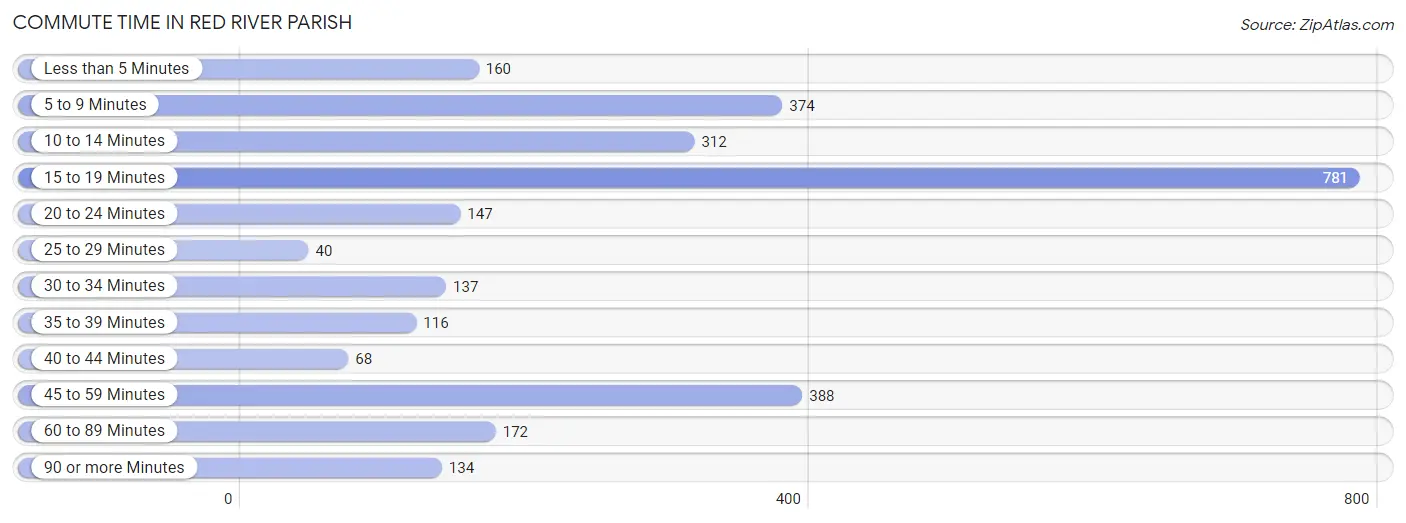
| Commute Time | # Commuters | % Commuters |
| Less than 5 Minutes | 160 | 5.7% |
| 5 to 9 Minutes | 374 | 13.2% |
| 10 to 14 Minutes | 312 | 11.0% |
| 15 to 19 Minutes | 781 | 27.6% |
| 20 to 24 Minutes | 147 | 5.2% |
| 25 to 29 Minutes | 40 | 1.4% |
| 30 to 34 Minutes | 137 | 4.8% |
| 35 to 39 Minutes | 116 | 4.1% |
| 40 to 44 Minutes | 68 | 2.4% |
| 45 to 59 Minutes | 388 | 13.7% |
| 60 to 89 Minutes | 172 | 6.1% |
| 90 or more Minutes | 134 | 4.7% |
Commute Time by Sex in Red River Parish
The most common commute times in Red River Parish are 45 to 59 minutes (300 commuters, 18.9%) for males and 15 to 19 minutes (534 commuters, 42.9%) for females.
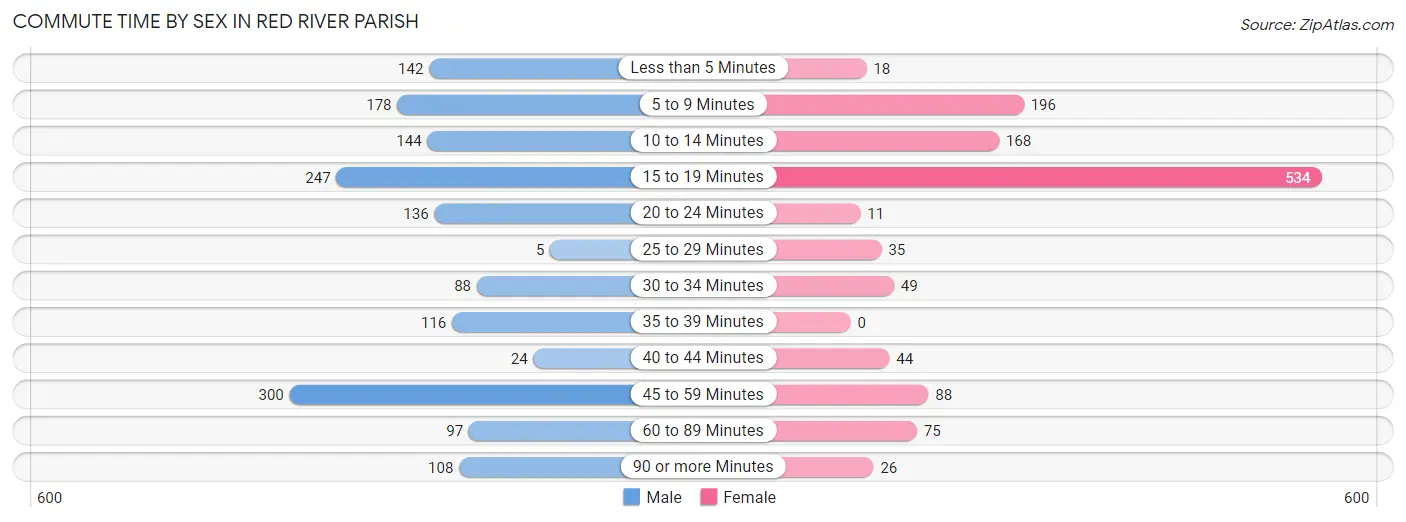
| Commute Time | Male | Female |
| Less than 5 Minutes | 142 (9.0%) | 18 (1.5%) |
| 5 to 9 Minutes | 178 (11.2%) | 196 (15.8%) |
| 10 to 14 Minutes | 144 (9.1%) | 168 (13.5%) |
| 15 to 19 Minutes | 247 (15.6%) | 534 (42.9%) |
| 20 to 24 Minutes | 136 (8.6%) | 11 (0.9%) |
| 25 to 29 Minutes | 5 (0.3%) | 35 (2.8%) |
| 30 to 34 Minutes | 88 (5.6%) | 49 (3.9%) |
| 35 to 39 Minutes | 116 (7.3%) | 0 (0.0%) |
| 40 to 44 Minutes | 24 (1.5%) | 44 (3.5%) |
| 45 to 59 Minutes | 300 (18.9%) | 88 (7.1%) |
| 60 to 89 Minutes | 97 (6.1%) | 75 (6.0%) |
| 90 or more Minutes | 108 (6.8%) | 26 (2.1%) |
Time of Departure to Work by Sex in Red River Parish
The most frequent times of departure to work in Red River Parish are 6:00 AM to 6:29 AM (339, 21.4%) for males and 6:00 AM to 6:29 AM (199, 16.0%) for females.
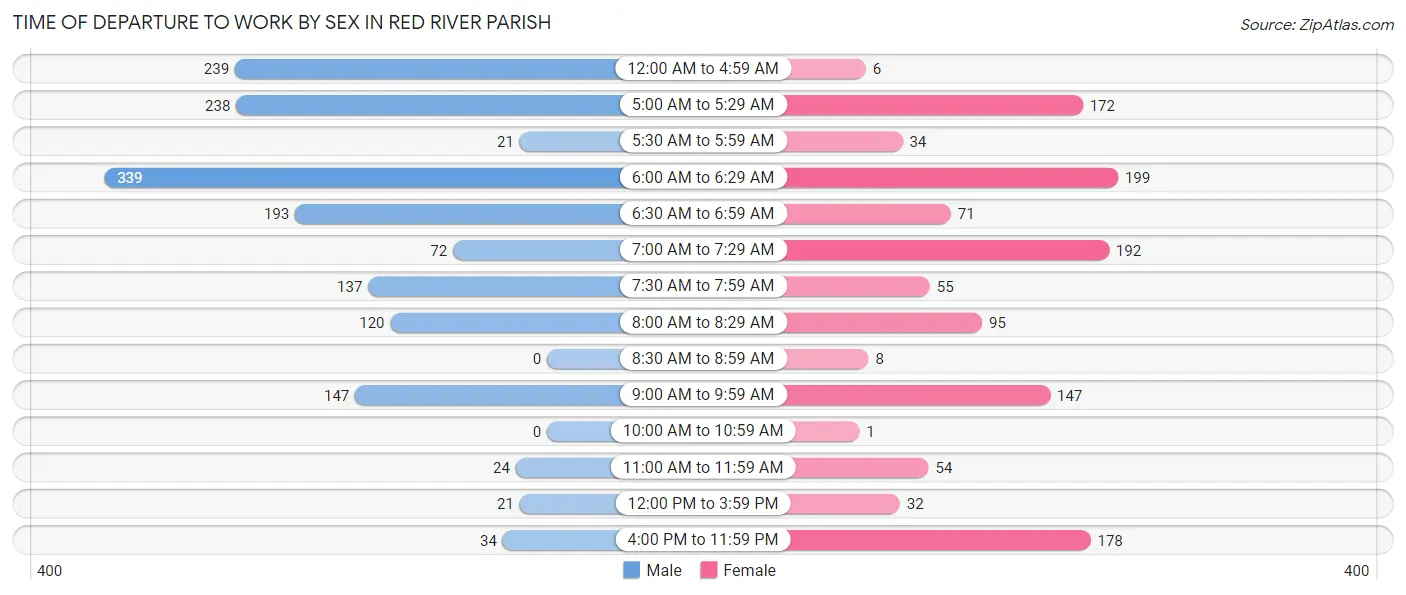
| Time of Departure | Male | Female |
| 12:00 AM to 4:59 AM | 239 (15.1%) | 6 (0.5%) |
| 5:00 AM to 5:29 AM | 238 (15.0%) | 172 (13.8%) |
| 5:30 AM to 5:59 AM | 21 (1.3%) | 34 (2.7%) |
| 6:00 AM to 6:29 AM | 339 (21.4%) | 199 (16.0%) |
| 6:30 AM to 6:59 AM | 193 (12.2%) | 71 (5.7%) |
| 7:00 AM to 7:29 AM | 72 (4.5%) | 192 (15.4%) |
| 7:30 AM to 7:59 AM | 137 (8.6%) | 55 (4.4%) |
| 8:00 AM to 8:29 AM | 120 (7.6%) | 95 (7.6%) |
| 8:30 AM to 8:59 AM | 0 (0.0%) | 8 (0.6%) |
| 9:00 AM to 9:59 AM | 147 (9.3%) | 147 (11.8%) |
| 10:00 AM to 10:59 AM | 0 (0.0%) | 1 (0.1%) |
| 11:00 AM to 11:59 AM | 24 (1.5%) | 54 (4.3%) |
| 12:00 PM to 3:59 PM | 21 (1.3%) | 32 (2.6%) |
| 4:00 PM to 11:59 PM | 34 (2.1%) | 178 (14.3%) |
| Total | 1,585 (100.0%) | 1,244 (100.0%) |
Housing Occupancy in Red River Parish
Occupancy by Ownership in Red River Parish
Of the total 2,934 dwellings in Red River Parish, owner-occupied units account for 2,206 (75.2%), while renter-occupied units make up 728 (24.8%).
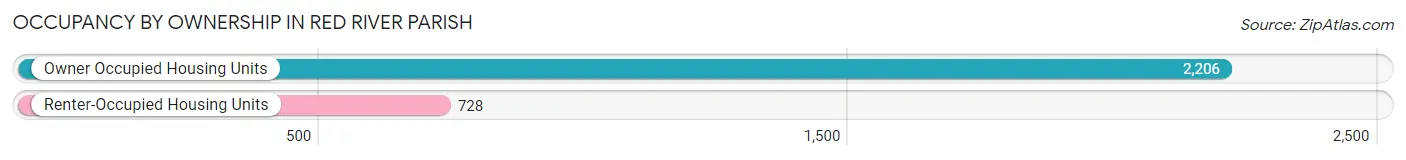
| Occupancy | # Housing Units | % Housing Units |
| Owner Occupied Housing Units | 2,206 | 75.2% |
| Renter-Occupied Housing Units | 728 | 24.8% |
| Total Occupied Housing Units | 2,934 | 100.0% |
Occupancy by Household Size in Red River Parish
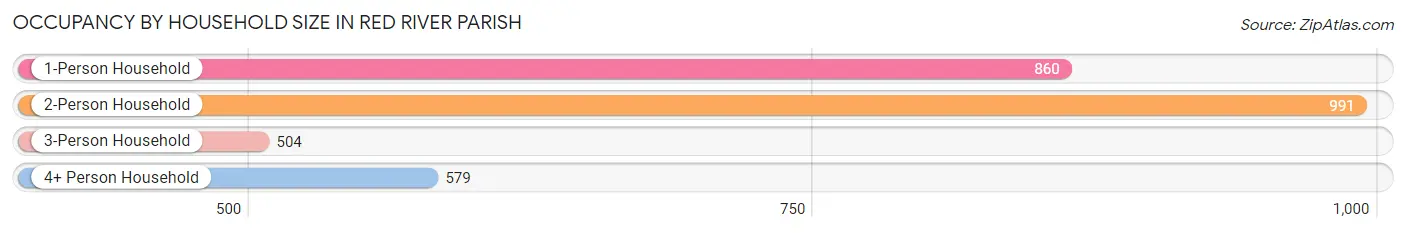
| Household Size | # Housing Units | % Housing Units |
| 1-Person Household | 860 | 29.3% |
| 2-Person Household | 991 | 33.8% |
| 3-Person Household | 504 | 17.2% |
| 4+ Person Household | 579 | 19.7% |
| Total Housing Units | 2,934 | 100.0% |
Occupancy by Ownership by Household Size in Red River Parish
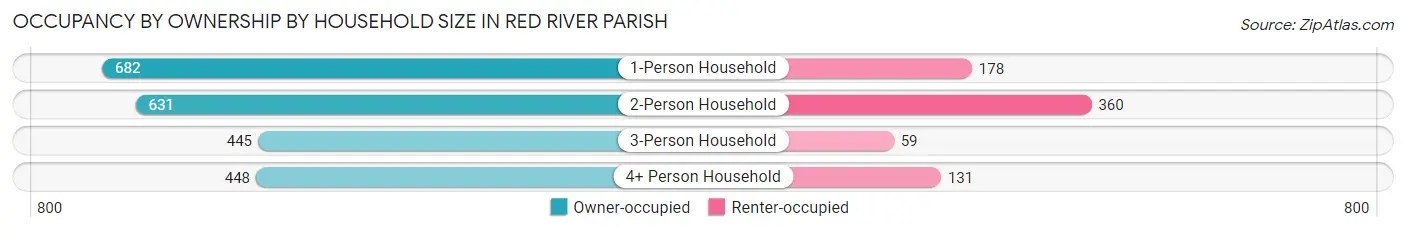
| Household Size | Owner-occupied | Renter-occupied |
| 1-Person Household | 682 (79.3%) | 178 (20.7%) |
| 2-Person Household | 631 (63.7%) | 360 (36.3%) |
| 3-Person Household | 445 (88.3%) | 59 (11.7%) |
| 4+ Person Household | 448 (77.4%) | 131 (22.6%) |
| Total Housing Units | 2,206 (75.2%) | 728 (24.8%) |
Occupancy by Educational Attainment in Red River Parish
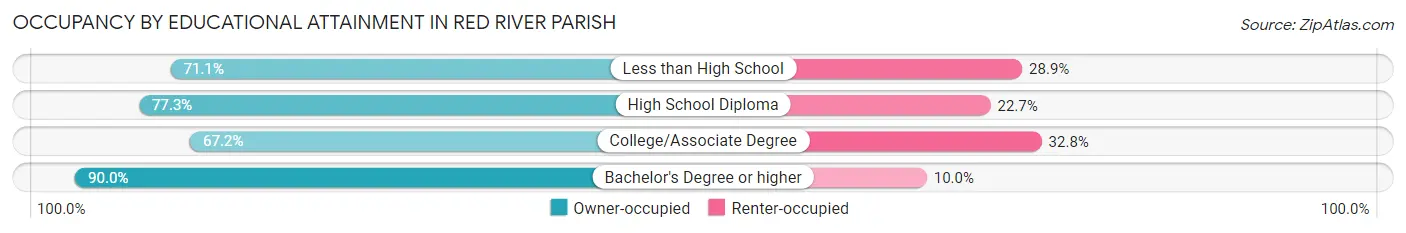
| Household Size | Owner-occupied | Renter-occupied |
| Less than High School | 415 (71.1%) | 169 (28.9%) |
| High School Diploma | 1,081 (77.3%) | 317 (22.7%) |
| College/Associate Degree | 432 (67.2%) | 211 (32.8%) |
| Bachelor's Degree or higher | 278 (90.0%) | 31 (10.0%) |
Occupancy by Age of Householder in Red River Parish
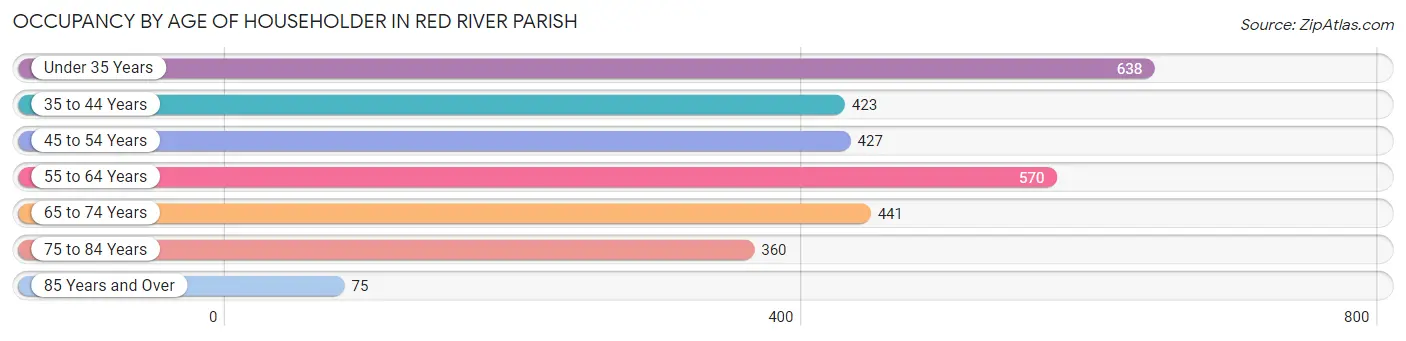
| Age Bracket | # Households | % Households |
| Under 35 Years | 638 | 21.7% |
| 35 to 44 Years | 423 | 14.4% |
| 45 to 54 Years | 427 | 14.5% |
| 55 to 64 Years | 570 | 19.4% |
| 65 to 74 Years | 441 | 15.0% |
| 75 to 84 Years | 360 | 12.3% |
| 85 Years and Over | 75 | 2.6% |
| Total | 2,934 | 100.0% |
Housing Finances in Red River Parish
Median Income by Occupancy in Red River Parish
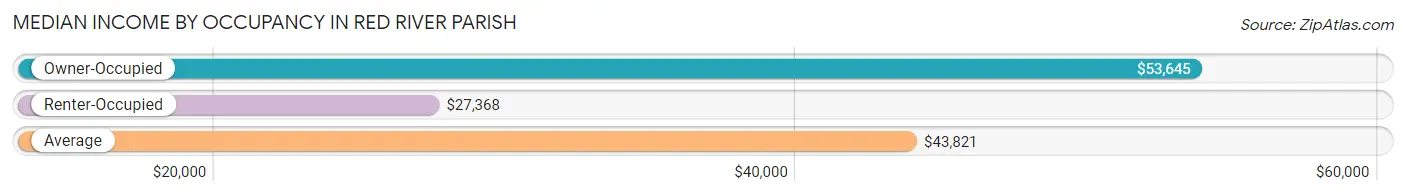
| Occupancy Type | # Households | Median Income |
| Owner-Occupied | 2,206 (75.2%) | $53,645 |
| Renter-Occupied | 728 (24.8%) | $27,368 |
| Average | 2,934 (100.0%) | $43,821 |
Occupancy by Householder Income Bracket in Red River Parish
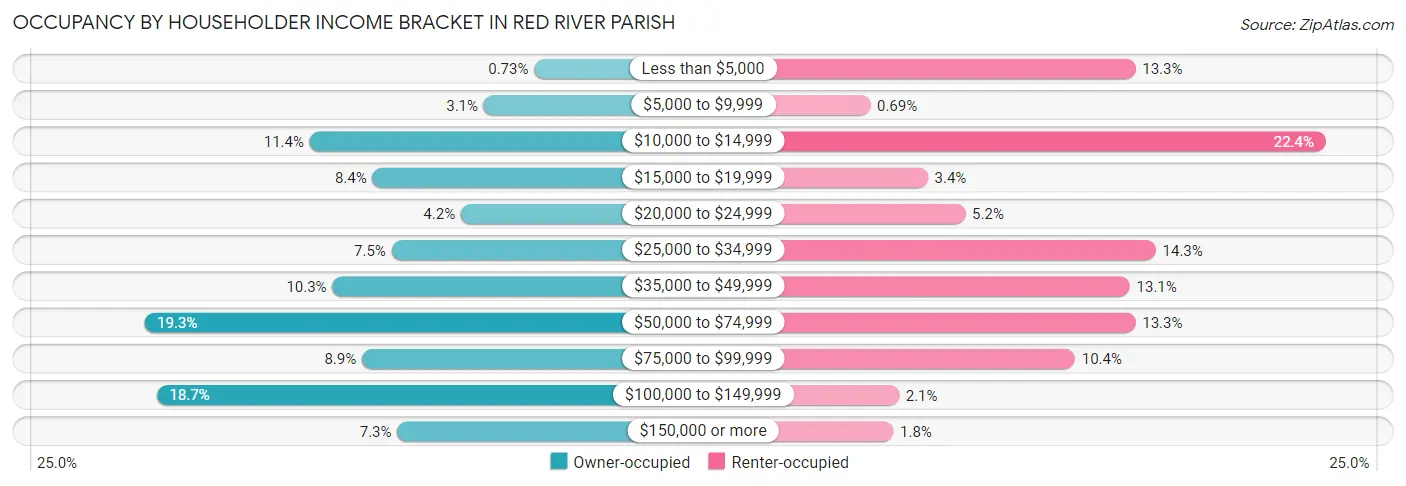
| Income Bracket | Owner-occupied | Renter-occupied |
| Less than $5,000 | 16 (0.7%) | 97 (13.3%) |
| $5,000 to $9,999 | 69 (3.1%) | 5 (0.7%) |
| $10,000 to $14,999 | 252 (11.4%) | 163 (22.4%) |
| $15,000 to $19,999 | 186 (8.4%) | 25 (3.4%) |
| $20,000 to $24,999 | 93 (4.2%) | 38 (5.2%) |
| $25,000 to $34,999 | 166 (7.5%) | 104 (14.3%) |
| $35,000 to $49,999 | 228 (10.3%) | 95 (13.1%) |
| $50,000 to $74,999 | 426 (19.3%) | 97 (13.3%) |
| $75,000 to $99,999 | 197 (8.9%) | 76 (10.4%) |
| $100,000 to $149,999 | 413 (18.7%) | 15 (2.1%) |
| $150,000 or more | 160 (7.2%) | 13 (1.8%) |
| Total | 2,206 (100.0%) | 728 (100.0%) |
Monthly Housing Cost Tiers in Red River Parish
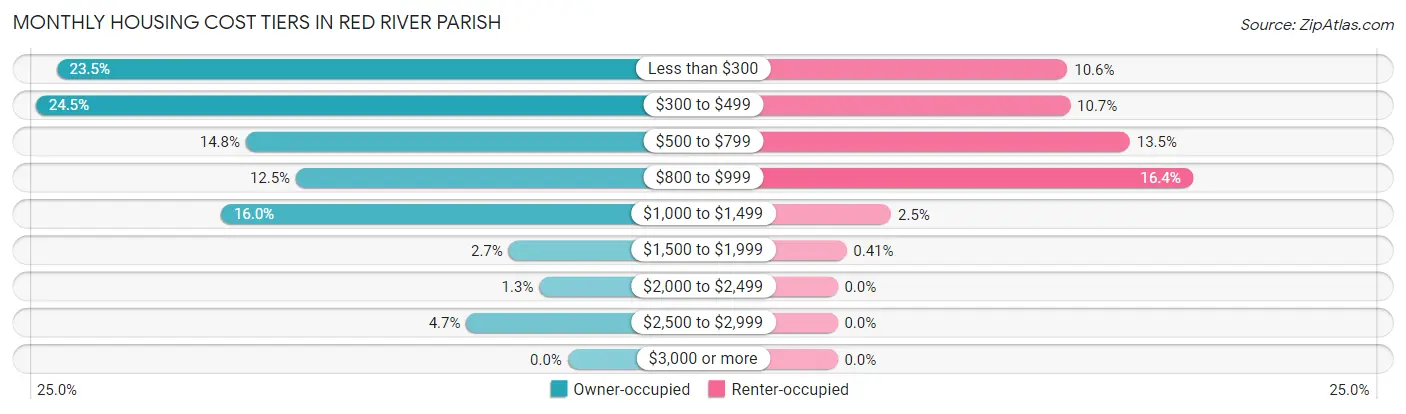
| Monthly Cost | Owner-occupied | Renter-occupied |
| Less than $300 | 519 (23.5%) | 77 (10.6%) |
| $300 to $499 | 540 (24.5%) | 78 (10.7%) |
| $500 to $799 | 327 (14.8%) | 98 (13.5%) |
| $800 to $999 | 276 (12.5%) | 119 (16.4%) |
| $1,000 to $1,499 | 352 (16.0%) | 18 (2.5%) |
| $1,500 to $1,999 | 60 (2.7%) | 3 (0.4%) |
| $2,000 to $2,499 | 29 (1.3%) | 0 (0.0%) |
| $2,500 to $2,999 | 103 (4.7%) | 0 (0.0%) |
| $3,000 or more | 0 (0.0%) | 0 (0.0%) |
| Total | 2,206 (100.0%) | 728 (100.0%) |
Physical Housing Characteristics in Red River Parish
Housing Structures in Red River Parish
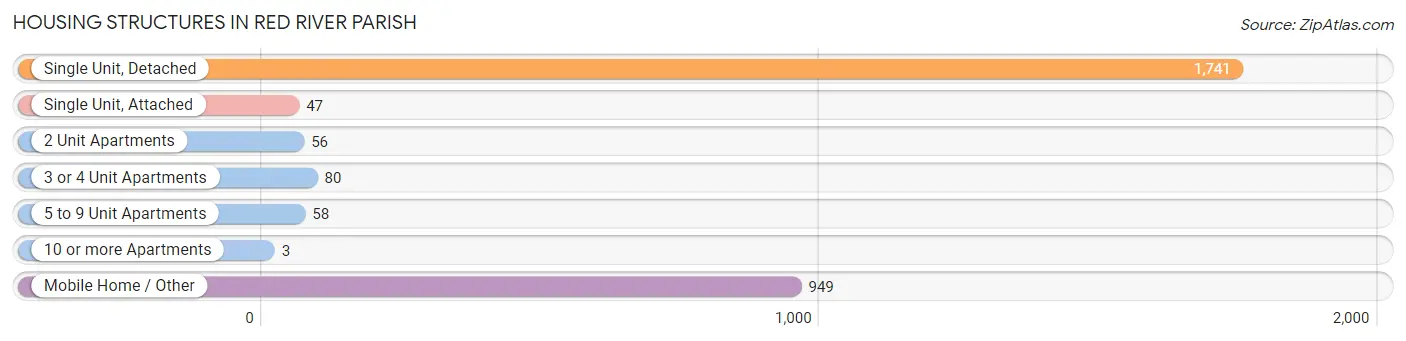
| Structure Type | # Housing Units | % Housing Units |
| Single Unit, Detached | 1,741 | 59.3% |
| Single Unit, Attached | 47 | 1.6% |
| 2 Unit Apartments | 56 | 1.9% |
| 3 or 4 Unit Apartments | 80 | 2.7% |
| 5 to 9 Unit Apartments | 58 | 2.0% |
| 10 or more Apartments | 3 | 0.1% |
| Mobile Home / Other | 949 | 32.3% |
| Total | 2,934 | 100.0% |
Housing Structures by Occupancy in Red River Parish
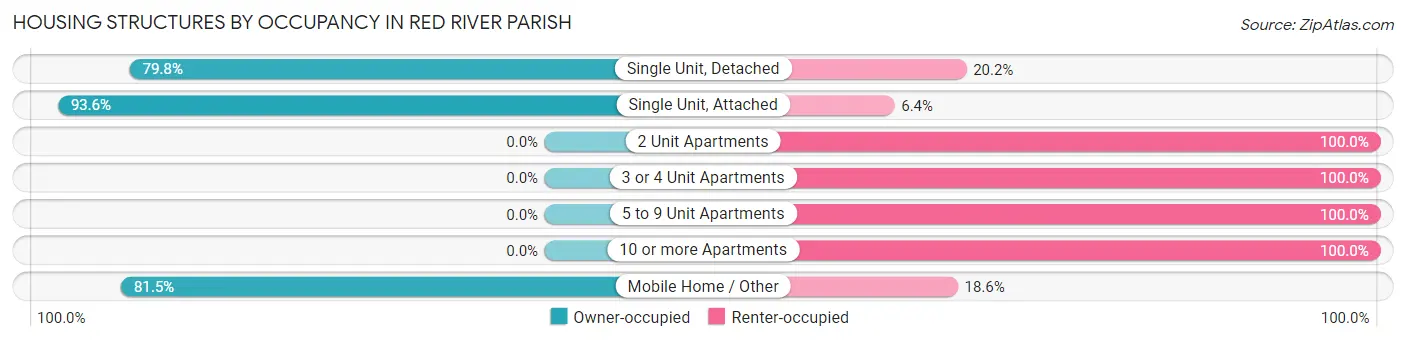
| Structure Type | Owner-occupied | Renter-occupied |
| Single Unit, Detached | 1,389 (79.8%) | 352 (20.2%) |
| Single Unit, Attached | 44 (93.6%) | 3 (6.4%) |
| 2 Unit Apartments | 0 (0.0%) | 56 (100.0%) |
| 3 or 4 Unit Apartments | 0 (0.0%) | 80 (100.0%) |
| 5 to 9 Unit Apartments | 0 (0.0%) | 58 (100.0%) |
| 10 or more Apartments | 0 (0.0%) | 3 (100.0%) |
| Mobile Home / Other | 773 (81.5%) | 176 (18.5%) |
| Total | 2,206 (75.2%) | 728 (24.8%) |
Housing Structures by Number of Rooms in Red River Parish
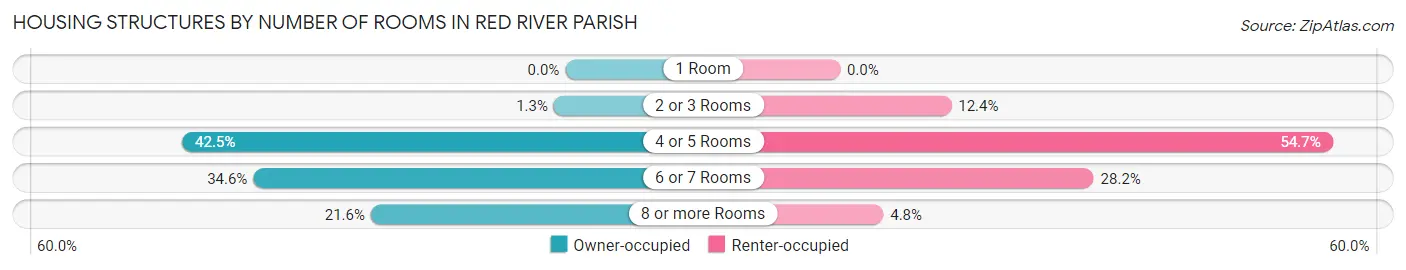
| Number of Rooms | Owner-occupied | Renter-occupied |
| 1 Room | 0 (0.0%) | 0 (0.0%) |
| 2 or 3 Rooms | 28 (1.3%) | 90 (12.4%) |
| 4 or 5 Rooms | 938 (42.5%) | 398 (54.7%) |
| 6 or 7 Rooms | 764 (34.6%) | 205 (28.2%) |
| 8 or more Rooms | 476 (21.6%) | 35 (4.8%) |
| Total | 2,206 (100.0%) | 728 (100.0%) |
Housing Structure by Heating Type in Red River Parish
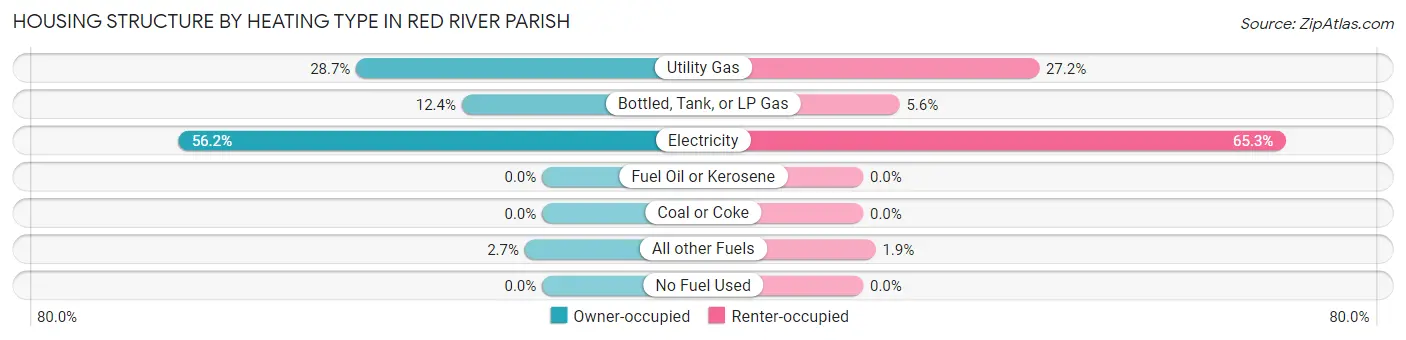
| Heating Type | Owner-occupied | Renter-occupied |
| Utility Gas | 634 (28.7%) | 198 (27.2%) |
| Bottled, Tank, or LP Gas | 274 (12.4%) | 41 (5.6%) |
| Electricity | 1,239 (56.2%) | 475 (65.2%) |
| Fuel Oil or Kerosene | 0 (0.0%) | 0 (0.0%) |
| Coal or Coke | 0 (0.0%) | 0 (0.0%) |
| All other Fuels | 59 (2.7%) | 14 (1.9%) |
| No Fuel Used | 0 (0.0%) | 0 (0.0%) |
| Total | 2,206 (100.0%) | 728 (100.0%) |
Household Vehicle Usage in Red River Parish
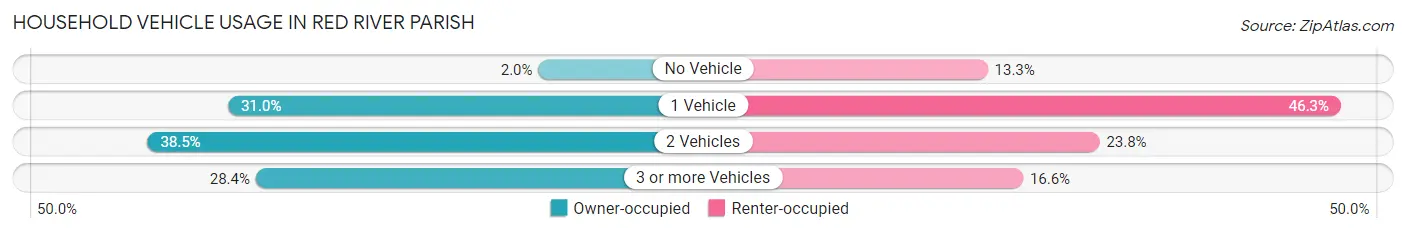
| Vehicles per Household | Owner-occupied | Renter-occupied |
| No Vehicle | 45 (2.0%) | 97 (13.3%) |
| 1 Vehicle | 684 (31.0%) | 337 (46.3%) |
| 2 Vehicles | 850 (38.5%) | 173 (23.8%) |
| 3 or more Vehicles | 627 (28.4%) | 121 (16.6%) |
| Total | 2,206 (100.0%) | 728 (100.0%) |
Real Estate & Mortgages in Red River Parish
Real Estate and Mortgage Overview in Red River Parish
| Characteristic | Without Mortgage | With Mortgage |
| Housing Units | 1,230 | 976 |
| Median Property Value | $72,000 | $122,000 |
| Median Household Income | $41,369 | $131 |
| Monthly Housing Costs | $326 | $0 |
| Real Estate Taxes | $313 | $538 |
Property Value by Mortgage Status in Red River Parish
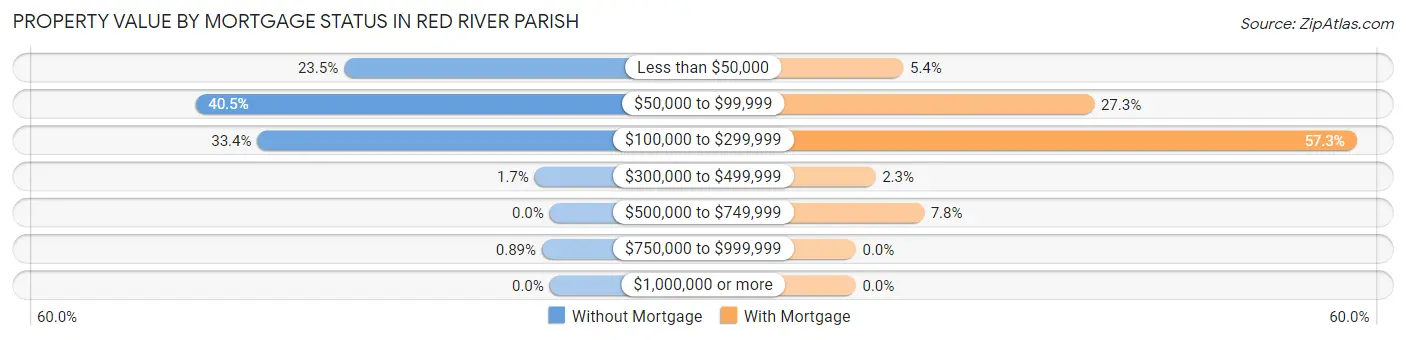
| Property Value | Without Mortgage | With Mortgage |
| Less than $50,000 | 289 (23.5%) | 53 (5.4%) |
| $50,000 to $99,999 | 498 (40.5%) | 266 (27.3%) |
| $100,000 to $299,999 | 411 (33.4%) | 559 (57.3%) |
| $300,000 to $499,999 | 21 (1.7%) | 22 (2.2%) |
| $500,000 to $749,999 | 0 (0.0%) | 76 (7.8%) |
| $750,000 to $999,999 | 11 (0.9%) | 0 (0.0%) |
| $1,000,000 or more | 0 (0.0%) | 0 (0.0%) |
| Total | 1,230 (100.0%) | 976 (100.0%) |
Household Income by Mortgage Status in Red River Parish
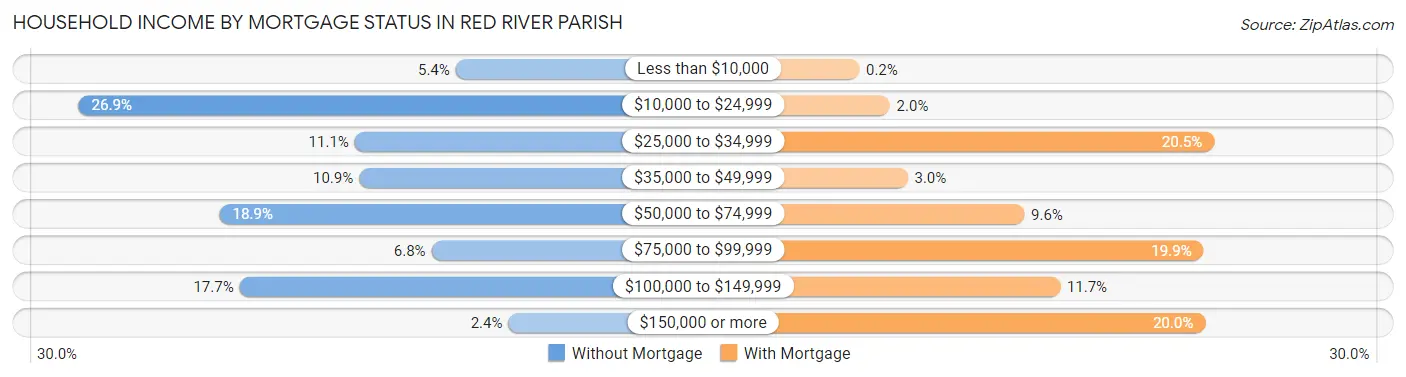
| Household Income | Without Mortgage | With Mortgage |
| Less than $10,000 | 66 (5.4%) | 2 (0.2%) |
| $10,000 to $24,999 | 331 (26.9%) | 19 (1.9%) |
| $25,000 to $34,999 | 137 (11.1%) | 200 (20.5%) |
| $35,000 to $49,999 | 134 (10.9%) | 29 (3.0%) |
| $50,000 to $74,999 | 232 (18.9%) | 94 (9.6%) |
| $75,000 to $99,999 | 83 (6.8%) | 194 (19.9%) |
| $100,000 to $149,999 | 218 (17.7%) | 114 (11.7%) |
| $150,000 or more | 29 (2.4%) | 195 (20.0%) |
| Total | 1,230 (100.0%) | 976 (100.0%) |
Property Value to Household Income Ratio in Red River Parish
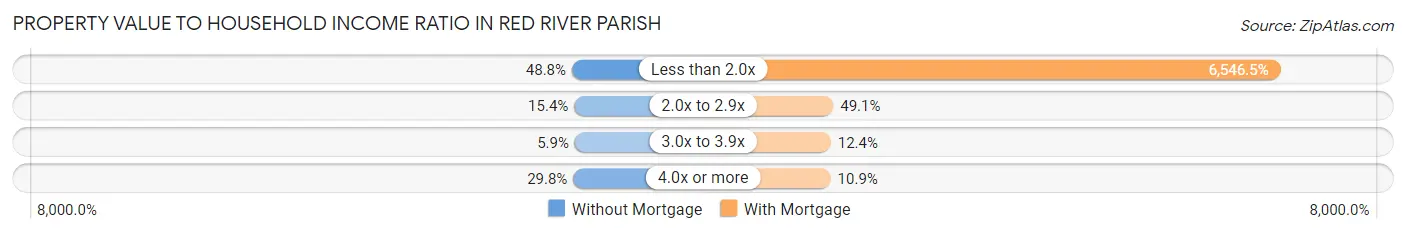
| Value-to-Income Ratio | Without Mortgage | With Mortgage |
| Less than 2.0x | 600 (48.8%) | 63,894 (6,546.5%) |
| 2.0x to 2.9x | 189 (15.4%) | 479 (49.1%) |
| 3.0x to 3.9x | 73 (5.9%) | 121 (12.4%) |
| 4.0x or more | 366 (29.8%) | 106 (10.9%) |
| Total | 1,230 (100.0%) | 976 (100.0%) |
Real Estate Taxes by Mortgage Status in Red River Parish
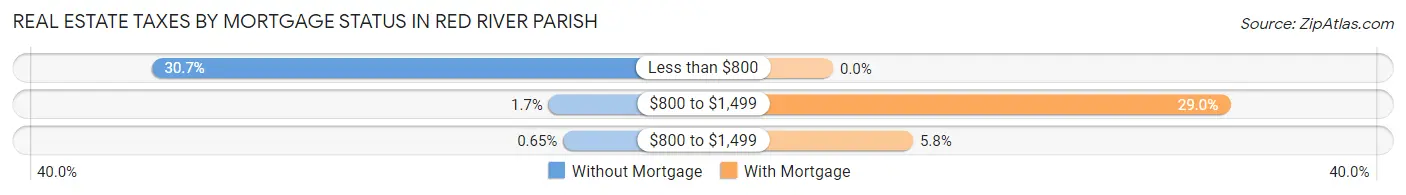
| Property Taxes | Without Mortgage | With Mortgage |
| Less than $800 | 378 (30.7%) | 0 (0.0%) |
| $800 to $1,499 | 21 (1.7%) | 283 (29.0%) |
| $800 to $1,499 | 8 (0.6%) | 57 (5.8%) |
| Total | 1,230 (100.0%) | 976 (100.0%) |
Health & Disability in Red River Parish
Health Insurance Coverage by Age in Red River Parish
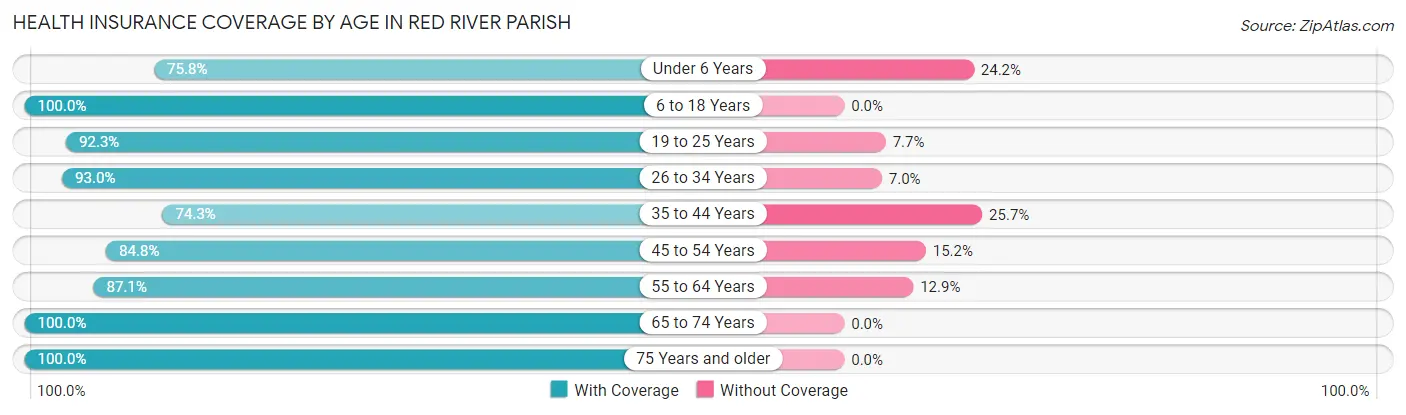
| Age Bracket | With Coverage | Without Coverage |
| Under 6 Years | 405 (75.8%) | 129 (24.2%) |
| 6 to 18 Years | 1,390 (100.0%) | 0 (0.0%) |
| 19 to 25 Years | 622 (92.3%) | 52 (7.7%) |
| 26 to 34 Years | 783 (93.0%) | 59 (7.0%) |
| 35 to 44 Years | 601 (74.3%) | 208 (25.7%) |
| 45 to 54 Years | 636 (84.8%) | 114 (15.2%) |
| 55 to 64 Years | 955 (87.1%) | 141 (12.9%) |
| 65 to 74 Years | 754 (100.0%) | 0 (0.0%) |
| 75 Years and older | 588 (100.0%) | 0 (0.0%) |
| Total | 6,734 (90.5%) | 703 (9.5%) |
Health Insurance Coverage by Citizenship Status in Red River Parish
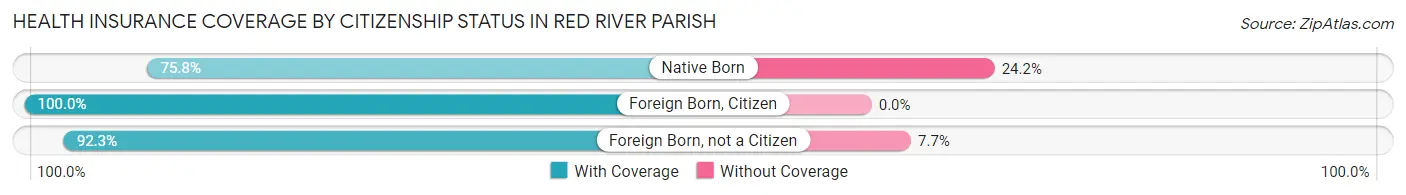
| Citizenship Status | With Coverage | Without Coverage |
| Native Born | 405 (75.8%) | 129 (24.2%) |
| Foreign Born, Citizen | 1,390 (100.0%) | 0 (0.0%) |
| Foreign Born, not a Citizen | 622 (92.3%) | 52 (7.7%) |
Health Insurance Coverage by Household Income in Red River Parish
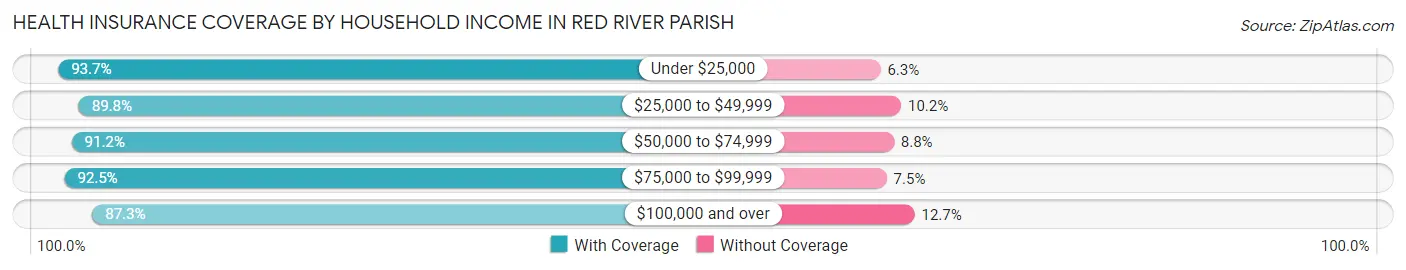
| Household Income | With Coverage | Without Coverage |
| Under $25,000 | 1,486 (93.7%) | 100 (6.3%) |
| $25,000 to $49,999 | 1,795 (89.8%) | 203 (10.2%) |
| $50,000 to $74,999 | 1,253 (91.2%) | 121 (8.8%) |
| $75,000 to $99,999 | 632 (92.5%) | 51 (7.5%) |
| $100,000 and over | 1,568 (87.3%) | 228 (12.7%) |
Public vs Private Health Insurance Coverage by Age in Red River Parish
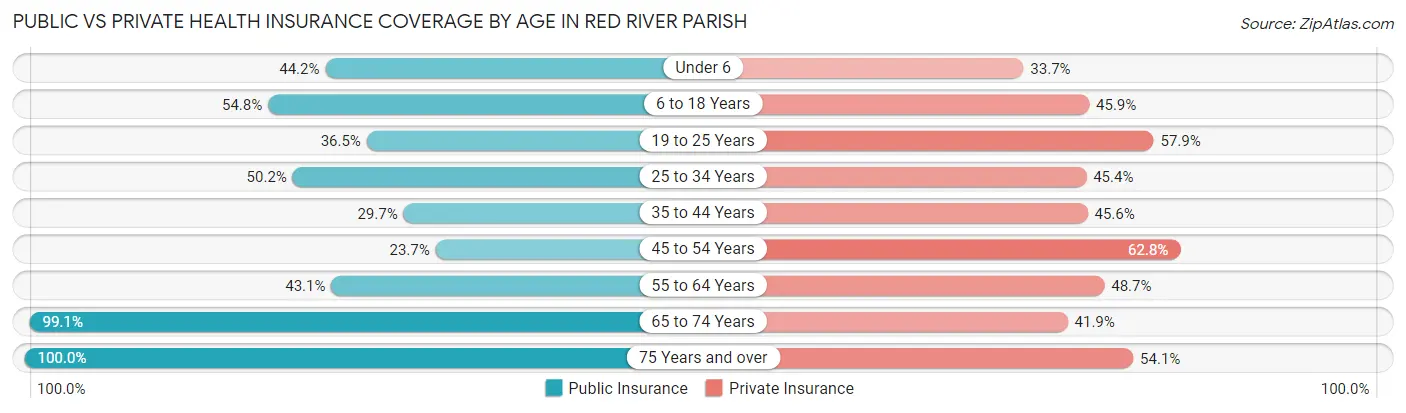
| Age Bracket | Public Insurance | Private Insurance |
| Under 6 | 236 (44.2%) | 180 (33.7%) |
| 6 to 18 Years | 762 (54.8%) | 638 (45.9%) |
| 19 to 25 Years | 246 (36.5%) | 390 (57.9%) |
| 25 to 34 Years | 423 (50.2%) | 382 (45.4%) |
| 35 to 44 Years | 240 (29.7%) | 369 (45.6%) |
| 45 to 54 Years | 178 (23.7%) | 471 (62.8%) |
| 55 to 64 Years | 472 (43.1%) | 534 (48.7%) |
| 65 to 74 Years | 747 (99.1%) | 316 (41.9%) |
| 75 Years and over | 588 (100.0%) | 318 (54.1%) |
| Total | 3,892 (52.3%) | 3,598 (48.4%) |
Disability Status by Sex by Age in Red River Parish
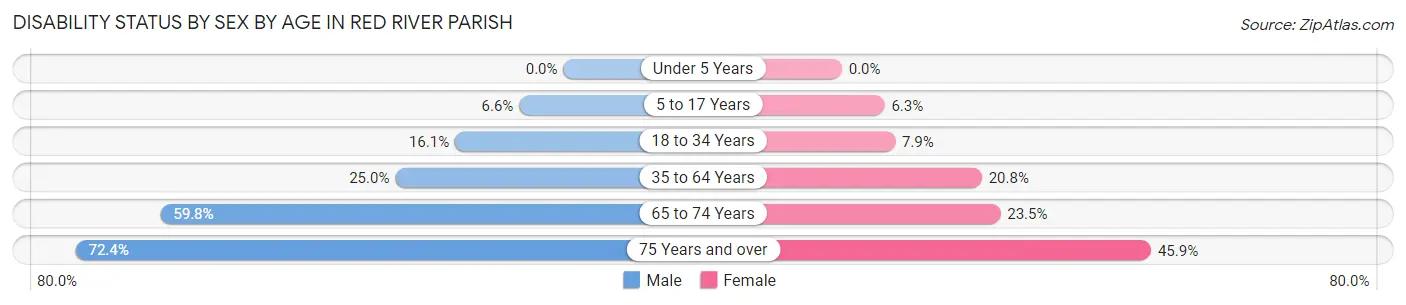
| Age Bracket | Male | Female |
| Under 5 Years | 0 (0.0%) | 0 (0.0%) |
| 5 to 17 Years | 50 (6.6%) | 36 (6.3%) |
| 18 to 34 Years | 140 (16.1%) | 61 (7.9%) |
| 35 to 64 Years | 306 (25.0%) | 297 (20.8%) |
| 65 to 74 Years | 225 (59.8%) | 89 (23.5%) |
| 75 Years and over | 134 (72.4%) | 185 (45.9%) |
Disability Class by Sex by Age in Red River Parish
Disability Class: Hearing Difficulty
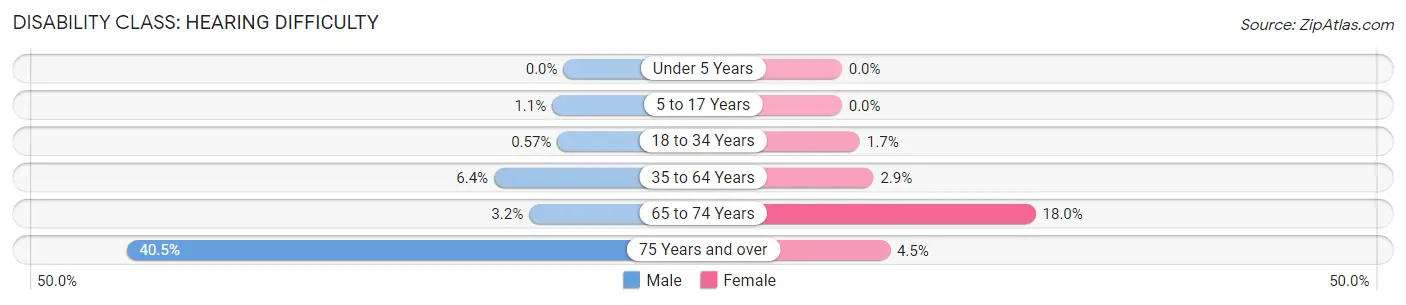
| Age Bracket | Male | Female |
| Under 5 Years | 0 (0.0%) | 0 (0.0%) |
| 5 to 17 Years | 8 (1.1%) | 0 (0.0%) |
| 18 to 34 Years | 5 (0.6%) | 13 (1.7%) |
| 35 to 64 Years | 79 (6.4%) | 42 (2.9%) |
| 65 to 74 Years | 12 (3.2%) | 68 (18.0%) |
| 75 Years and over | 75 (40.5%) | 18 (4.5%) |
Disability Class: Vision Difficulty
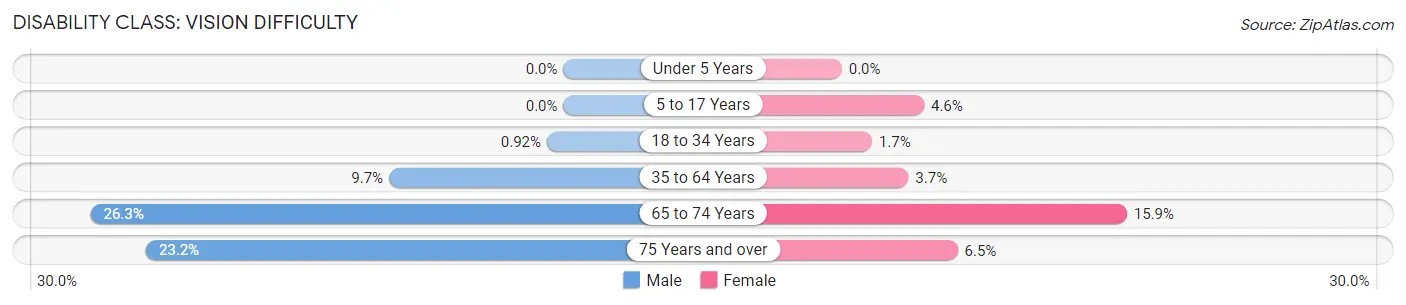
| Age Bracket | Male | Female |
| Under 5 Years | 0 (0.0%) | 0 (0.0%) |
| 5 to 17 Years | 0 (0.0%) | 26 (4.6%) |
| 18 to 34 Years | 8 (0.9%) | 13 (1.7%) |
| 35 to 64 Years | 119 (9.7%) | 53 (3.7%) |
| 65 to 74 Years | 99 (26.3%) | 60 (15.9%) |
| 75 Years and over | 43 (23.2%) | 26 (6.5%) |
Disability Class: Cognitive Difficulty
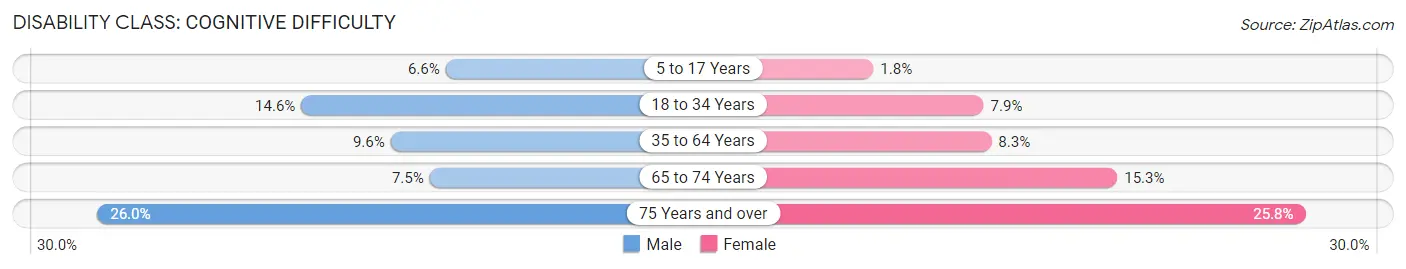
| Age Bracket | Male | Female |
| 5 to 17 Years | 50 (6.6%) | 10 (1.8%) |
| 18 to 34 Years | 127 (14.6%) | 61 (7.9%) |
| 35 to 64 Years | 118 (9.6%) | 119 (8.3%) |
| 65 to 74 Years | 28 (7.4%) | 58 (15.3%) |
| 75 Years and over | 48 (26.0%) | 104 (25.8%) |
Disability Class: Ambulatory Difficulty
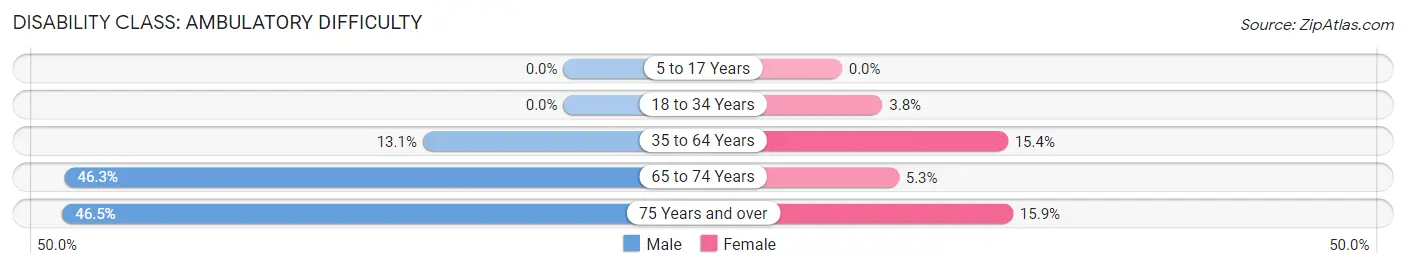
| Age Bracket | Male | Female |
| 5 to 17 Years | 0 (0.0%) | 0 (0.0%) |
| 18 to 34 Years | 0 (0.0%) | 29 (3.8%) |
| 35 to 64 Years | 160 (13.1%) | 220 (15.4%) |
| 65 to 74 Years | 174 (46.3%) | 20 (5.3%) |
| 75 Years and over | 86 (46.5%) | 64 (15.9%) |
Disability Class: Self-Care Difficulty
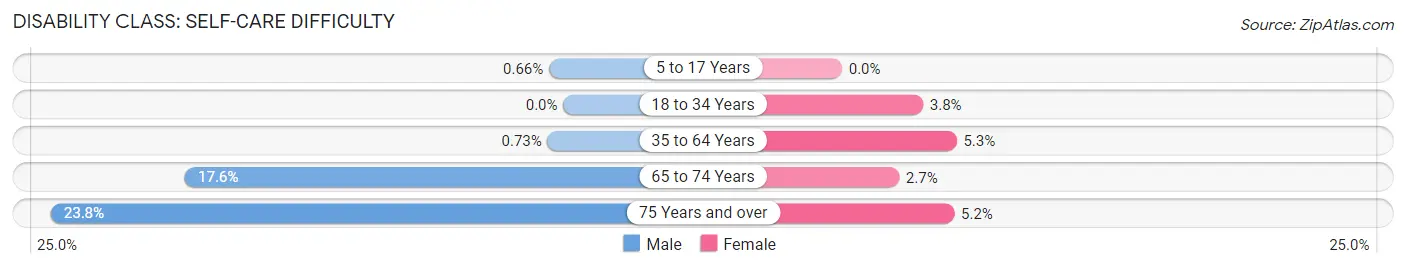
| Age Bracket | Male | Female |
| 5 to 17 Years | 5 (0.7%) | 0 (0.0%) |
| 18 to 34 Years | 0 (0.0%) | 29 (3.8%) |
| 35 to 64 Years | 9 (0.7%) | 76 (5.3%) |
| 65 to 74 Years | 66 (17.5%) | 10 (2.6%) |
| 75 Years and over | 44 (23.8%) | 21 (5.2%) |
Technology Access in Red River Parish
Computing Device Access in Red River Parish
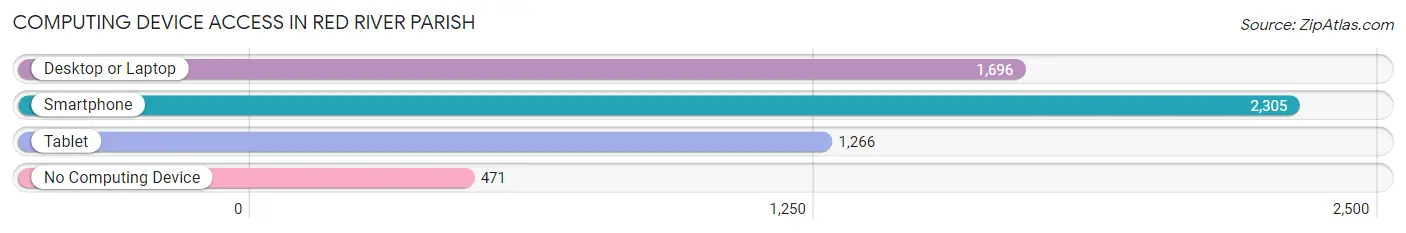
| Device Type | # Households | % Households |
| Desktop or Laptop | 1,696 | 57.8% |
| Smartphone | 2,305 | 78.6% |
| Tablet | 1,266 | 43.1% |
| No Computing Device | 471 | 16.1% |
| Total | 2,934 | 100.0% |
Internet Access in Red River Parish
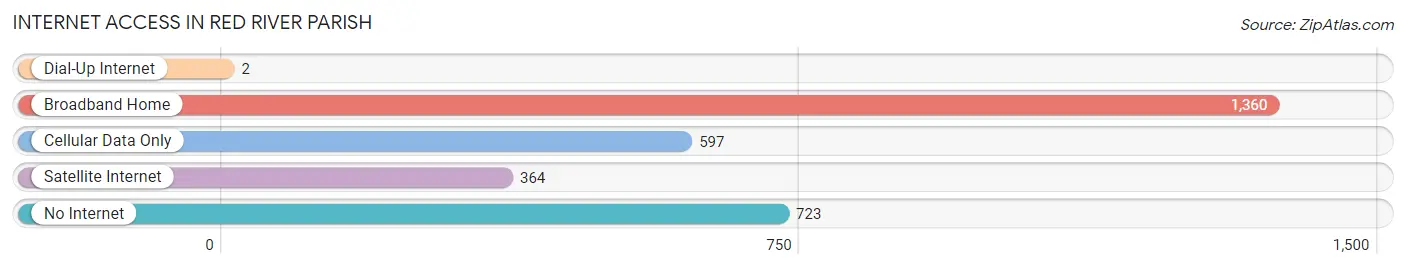
| Internet Type | # Households | % Households |
| Dial-Up Internet | 2 | 0.1% |
| Broadband Home | 1,360 | 46.4% |
| Cellular Data Only | 597 | 20.3% |
| Satellite Internet | 364 | 12.4% |
| No Internet | 723 | 24.6% |
| Total | 2,934 | 100.0% |
Red River Parish Summary
Red River Parish is located in the northwestern corner of Louisiana, and is part of the Shreveport-Bossier City metropolitan area. The parish is bordered by Caddo Parish to the east, Bossier Parish to the south, and DeSoto Parish to the west. The Red River forms the northern boundary of the parish. The parish seat is Coushatta, and the largest city is Coushatta.
History
Red River Parish was established in 1871, and was named for the Red River, which forms its northern boundary. The parish was created from parts of Bossier and Natchitoches parishes. The parish was originally part of the Natchitoches District, which was created in 1805.
The first settlers in the area were Native Americans, who were followed by French and Spanish settlers in the late 1700s. The area was part of the Neutral Strip, a disputed area between the United States and Spain. The Neutral Strip was eventually ceded to the United States in 1819.
The parish was home to several plantations, and the economy was largely based on cotton and sugar cane production. The parish was also home to several sawmills and gristmills.
Geography
Red River Parish is located in the northwestern corner of Louisiana, and is part of the Shreveport-Bossier City metropolitan area. The parish is bordered by Caddo Parish to the east, Bossier Parish to the south, and DeSoto Parish to the west. The Red River forms the northern boundary of the parish.
The parish has a total area of 545 square miles, of which 543 square miles is land and 2 square miles (0.4%) is water. The parish is mostly flat, with some rolling hills in the southern part of the parish. The parish is drained by the Red River and its tributaries, including the Little River, the Saline Bayou, and the Black Bayou.
Economy
The economy of Red River Parish is largely based on agriculture. The main crops grown in the parish are cotton, soybeans, corn, and wheat. The parish is also home to several timber and lumber companies.
The parish is home to several manufacturing companies, including a paper mill, a furniture factory, and a plastics plant. The parish is also home to several oil and gas companies.
Demographics
As of the 2010 census, the population of Red River Parish was 9,091. The racial makeup of the parish was 79.3% White, 18.2% African American, 0.4% Native American, 0.3% Asian, 0.1% Pacific Islander, 0.7% from other races, and 1.1% from two or more races. Hispanic or Latino of any race were 2.2% of the population.
The median household income in the parish was $35,945, and the median family income was $43,958. The per capita income was $17,845. About 17.3% of the population was below the poverty line.
Common Questions
What is Per Capita Income in Red River Parish?
Per Capita income in Red River Parish is $23,162.
What is the Median Family Income in Red River Parish?
Median Family Income in Red River Parish is $56,918.
What is the Median Household income in Red River Parish?
Median Household Income in Red River Parish is $43,821.
What is Income or Wage Gap in Red River Parish?
Income or Wage Gap in Red River Parish is 42.5%.
Women in Red River Parish earn 57.5 cents for every dollar earned by a man.
What is Family Income Deficit in Red River Parish?
Family Income Deficit in Red River Parish is $10,748.
Families that are below poverty line in Red River Parish earn $10,748 less on average than the poverty threshold level.
What is Inequality or Gini Index in Red River Parish?
Inequality or Gini Index in Red River Parish is 0.46.
What is the Total Population of Red River Parish?
Total Population of Red River Parish is 7,631.
What is the Total Male Population of Red River Parish?
Total Male Population of Red River Parish is 3,839.
What is the Total Female Population of Red River Parish?
Total Female Population of Red River Parish is 3,792.
What is the Ratio of Males per 100 Females in Red River Parish?
There are 101.24 Males per 100 Females in Red River Parish.
What is the Ratio of Females per 100 Males in Red River Parish?
There are 98.78 Females per 100 Males in Red River Parish.
What is the Median Population Age in Red River Parish?
Median Population Age in Red River Parish is 37.8 Years.
What is the Average Family Size in Red River Parish
Average Family Size in Red River Parish is 3.1 People.
What is the Average Household Size in Red River Parish
Average Household Size in Red River Parish is 2.5 People.
How Large is the Labor Force in Red River Parish?
There are 3,018 People in the Labor Forcein in Red River Parish.
What is the Percentage of People in the Labor Force in Red River Parish?
49.4% of People are in the Labor Force in Red River Parish.
What is the Unemployment Rate in Red River Parish?
Unemployment Rate in Red River Parish is 3.3%.