Morehouse Parish, LA Map & Demographics
Morehouse Parish Map
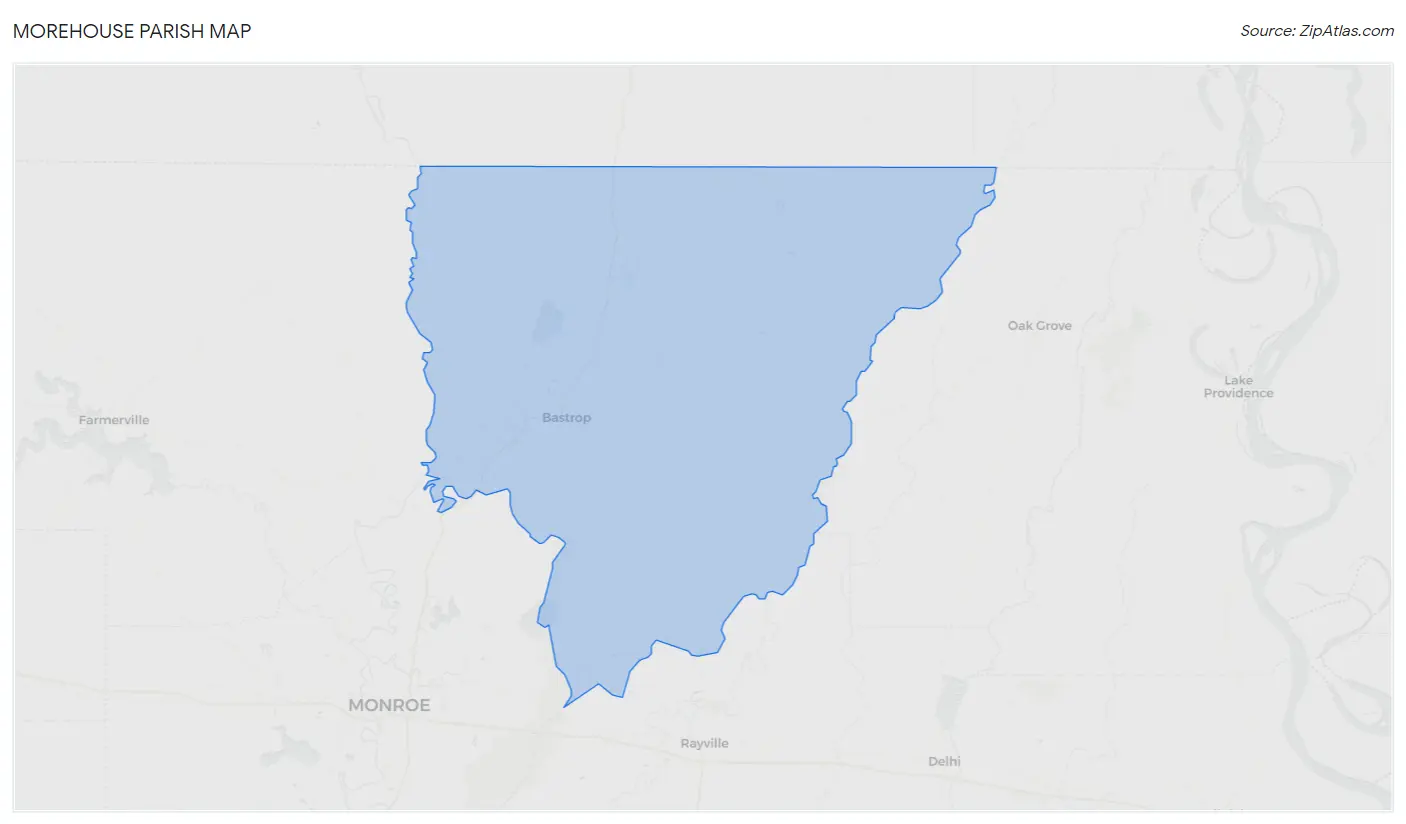
Morehouse Parish Overview
$22,534
PER CAPITA INCOME
$51,925
AVG FAMILY INCOME
$37,875
AVG HOUSEHOLD INCOME
33.0%
WAGE / INCOME GAP [ % ]
67.0¢/ $1
WAGE / INCOME GAP [ $ ]
$10,688
FAMILY INCOME DEFICIT
0.51
INEQUALITY / GINI INDEX
25,438
TOTAL POPULATION
12,407
MALE POPULATION
13,031
FEMALE POPULATION
95.21
MALES / 100 FEMALES
105.03
FEMALES / 100 MALES
40.0
MEDIAN AGE
3.5
AVG FAMILY SIZE
2.6
AVG HOUSEHOLD SIZE
10,287
LABOR FORCE [ PEOPLE ]
50.9%
PERCENT IN LABOR FORCE
8.8%
UNEMPLOYMENT RATE
Morehouse Parish Area Codes
Income in Morehouse Parish
Income Overview in Morehouse Parish
Per Capita Income in Morehouse Parish is $22,534, while median incomes of families and households are $51,925 and $37,875 respectively.
| Characteristic | Number | Measure |
| Per Capita Income | 25,438 | $22,534 |
| Median Family Income | 5,752 | $51,925 |
| Mean Family Income | 5,752 | $73,917 |
| Median Household Income | 9,474 | $37,875 |
| Mean Household Income | 9,474 | $57,055 |
| Income Deficit | 5,752 | $10,688 |
| Wage / Income Gap (%) | 25,438 | 33.02% |
| Wage / Income Gap ($) | 25,438 | 66.98¢ per $1 |
| Gini / Inequality Index | 25,438 | 0.51 |
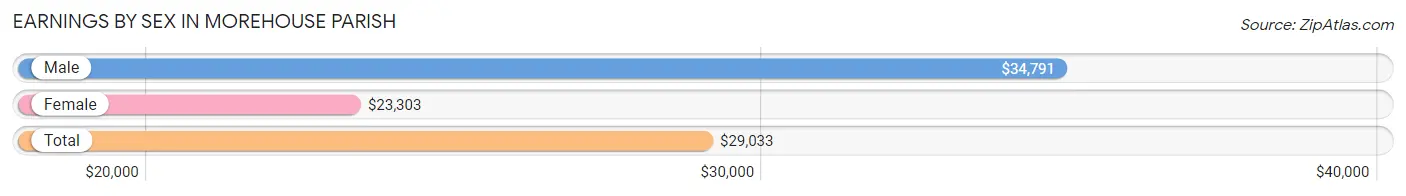
Earnings by Sex in Morehouse Parish
Average Earnings in Morehouse Parish are $29,033, $34,791 for men and $23,303 for women, a difference of 33.0%.
| Sex | Number | Average Earnings |
| Male | 5,452 (51.6%) | $34,791 |
| Female | 5,111 (48.4%) | $23,303 |
| Total | 10,563 (100.0%) | $29,033 |
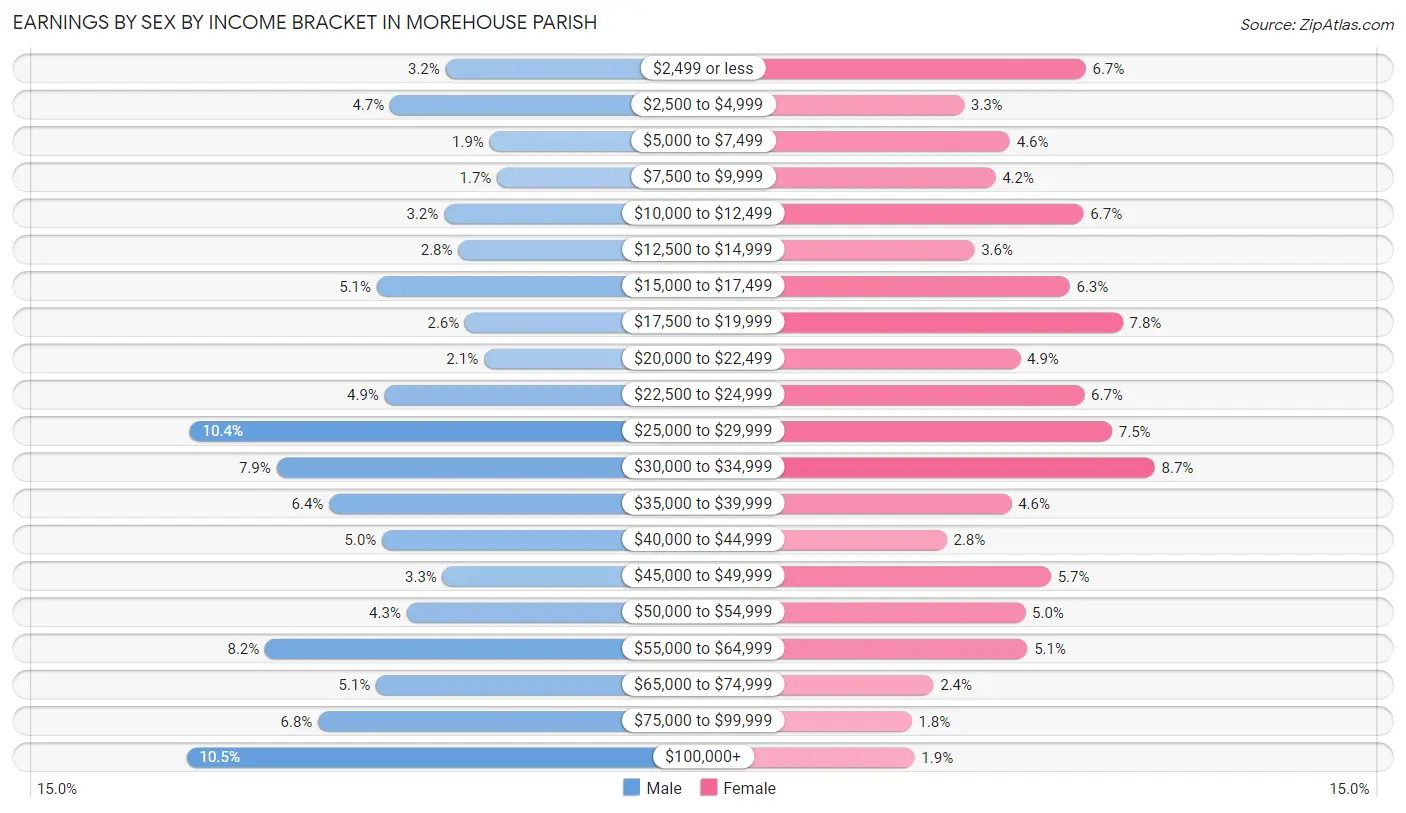
Earnings by Sex by Income Bracket in Morehouse Parish
The most common earnings brackets in Morehouse Parish are $100,000+ for men (570 | 10.4%) and $30,000 to $34,999 for women (442 | 8.6%).
| Income | Male | Female |
| $2,499 or less | 173 (3.2%) | 343 (6.7%) |
| $2,500 to $4,999 | 258 (4.7%) | 168 (3.3%) |
| $5,000 to $7,499 | 105 (1.9%) | 234 (4.6%) |
| $7,500 to $9,999 | 94 (1.7%) | 213 (4.2%) |
| $10,000 to $12,499 | 175 (3.2%) | 340 (6.7%) |
| $12,500 to $14,999 | 153 (2.8%) | 183 (3.6%) |
| $15,000 to $17,499 | 278 (5.1%) | 320 (6.3%) |
| $17,500 to $19,999 | 143 (2.6%) | 396 (7.7%) |
| $20,000 to $22,499 | 114 (2.1%) | 249 (4.9%) |
| $22,500 to $24,999 | 266 (4.9%) | 341 (6.7%) |
| $25,000 to $29,999 | 565 (10.4%) | 381 (7.4%) |
| $30,000 to $34,999 | 432 (7.9%) | 442 (8.6%) |
| $35,000 to $39,999 | 351 (6.4%) | 236 (4.6%) |
| $40,000 to $44,999 | 270 (5.0%) | 143 (2.8%) |
| $45,000 to $49,999 | 177 (3.3%) | 293 (5.7%) |
| $50,000 to $54,999 | 232 (4.3%) | 256 (5.0%) |
| $55,000 to $64,999 | 449 (8.2%) | 259 (5.1%) |
| $65,000 to $74,999 | 279 (5.1%) | 124 (2.4%) |
| $75,000 to $99,999 | 368 (6.8%) | 93 (1.8%) |
| $100,000+ | 570 (10.4%) | 97 (1.9%) |
| Total | 5,452 (100.0%) | 5,111 (100.0%) |
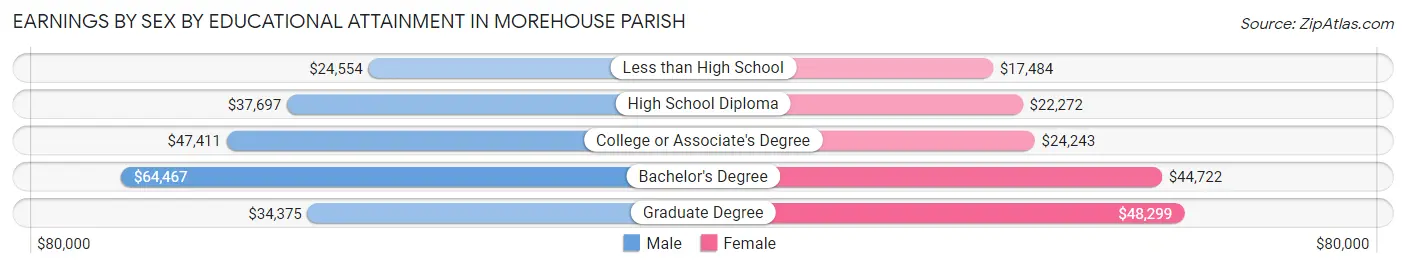
Earnings by Sex by Educational Attainment in Morehouse Parish
Average earnings in Morehouse Parish are $39,474 for men and $24,647 for women, a difference of 37.6%. Men with an educational attainment of bachelor's degree enjoy the highest average annual earnings of $64,467, while those with less than high school education earn the least with $24,554. Women with an educational attainment of graduate degree earn the most with the average annual earnings of $48,299, while those with less than high school education have the smallest earnings of $17,484.
| Educational Attainment | Male Income | Female Income |
| Less than High School | $24,554 | $17,484 |
| High School Diploma | $37,697 | $22,272 |
| College or Associate's Degree | $47,411 | $24,243 |
| Bachelor's Degree | $64,467 | $44,722 |
| Graduate Degree | $34,375 | $48,299 |
| Total | $39,474 | $24,647 |
Family Income in Morehouse Parish
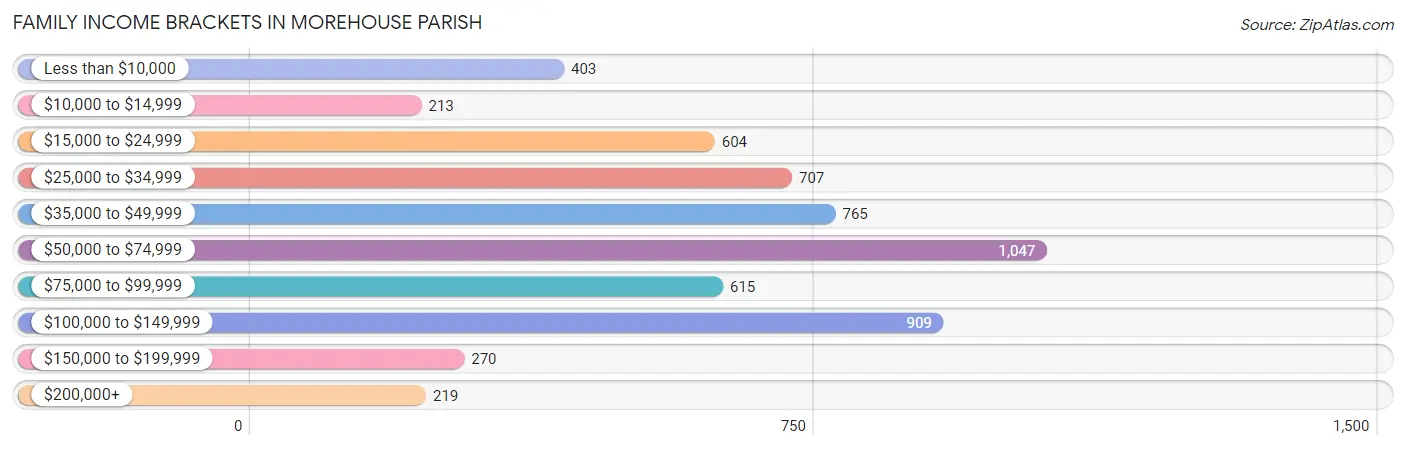
Family Income Brackets in Morehouse Parish
According to the Morehouse Parish family income data, there are 1,047 families falling into the $50,000 to $74,999 income range, which is the most common income bracket and makes up 18.2% of all families. Conversely, the $10,000 to $14,999 income bracket is the least frequent group with only 213 families (3.7%) belonging to this category.
| Income Bracket | # Families | % Families |
| Less than $10,000 | 403 | 7.0% |
| $10,000 to $14,999 | 213 | 3.7% |
| $15,000 to $24,999 | 604 | 10.5% |
| $25,000 to $34,999 | 707 | 12.3% |
| $35,000 to $49,999 | 765 | 13.3% |
| $50,000 to $74,999 | 1,047 | 18.2% |
| $75,000 to $99,999 | 615 | 10.7% |
| $100,000 to $149,999 | 909 | 15.8% |
| $150,000 to $199,999 | 270 | 4.7% |
| $200,000+ | 219 | 3.8% |
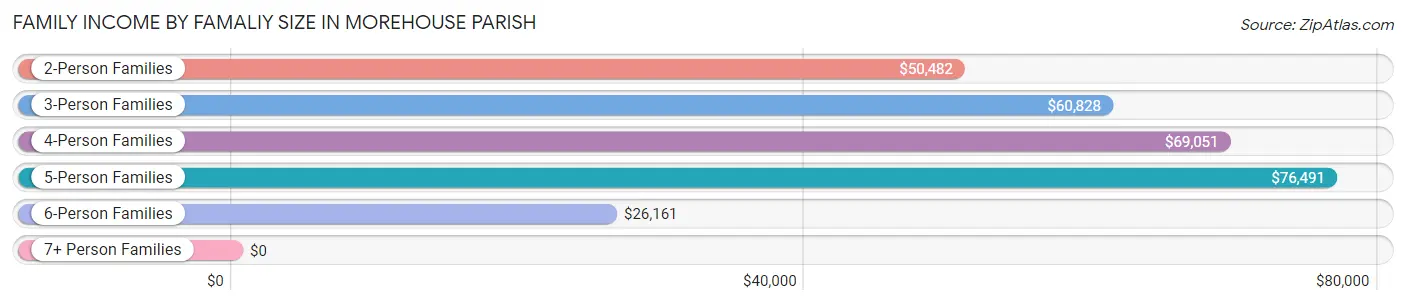
Family Income by Famaliy Size in Morehouse Parish
5-person families (528 | 9.2%) account for the highest median family income in Morehouse Parish with $76,491 per family, while 2-person families (2,802 | 48.7%) have the highest median income of $25,241 per family member.
| Income Bracket | # Families | Median Income |
| 2-Person Families | 2,802 (48.7%) | $50,482 |
| 3-Person Families | 1,469 (25.5%) | $60,828 |
| 4-Person Families | 693 (12.0%) | $69,051 |
| 5-Person Families | 528 (9.2%) | $76,491 |
| 6-Person Families | 198 (3.4%) | $26,161 |
| 7+ Person Families | 62 (1.1%) | $0 |
| Total | 5,752 (100.0%) | $51,925 |
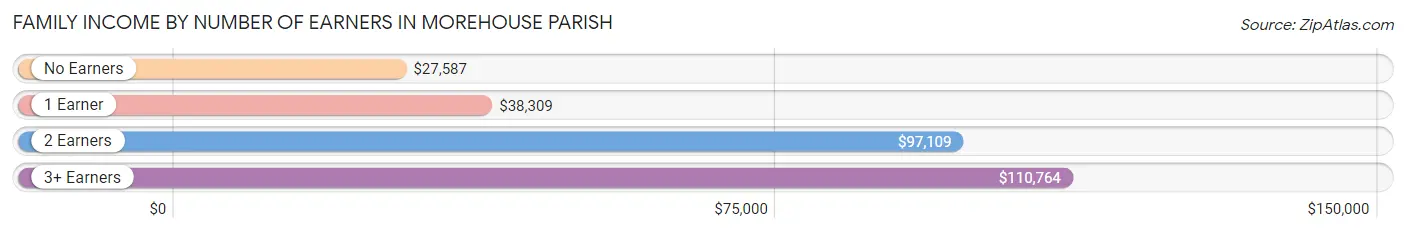
Family Income by Number of Earners in Morehouse Parish
The median family income in Morehouse Parish is $51,925, with families comprising 3+ earners (393) having the highest median family income of $110,764, while families with no earners (1,193) have the lowest median family income of $27,587, accounting for 6.8% and 20.7% of families, respectively.
| Number of Earners | # Families | Median Income |
| No Earners | 1,193 (20.7%) | $27,587 |
| 1 Earner | 2,294 (39.9%) | $38,309 |
| 2 Earners | 1,872 (32.6%) | $97,109 |
| 3+ Earners | 393 (6.8%) | $110,764 |
| Total | 5,752 (100.0%) | $51,925 |
Household Income in Morehouse Parish
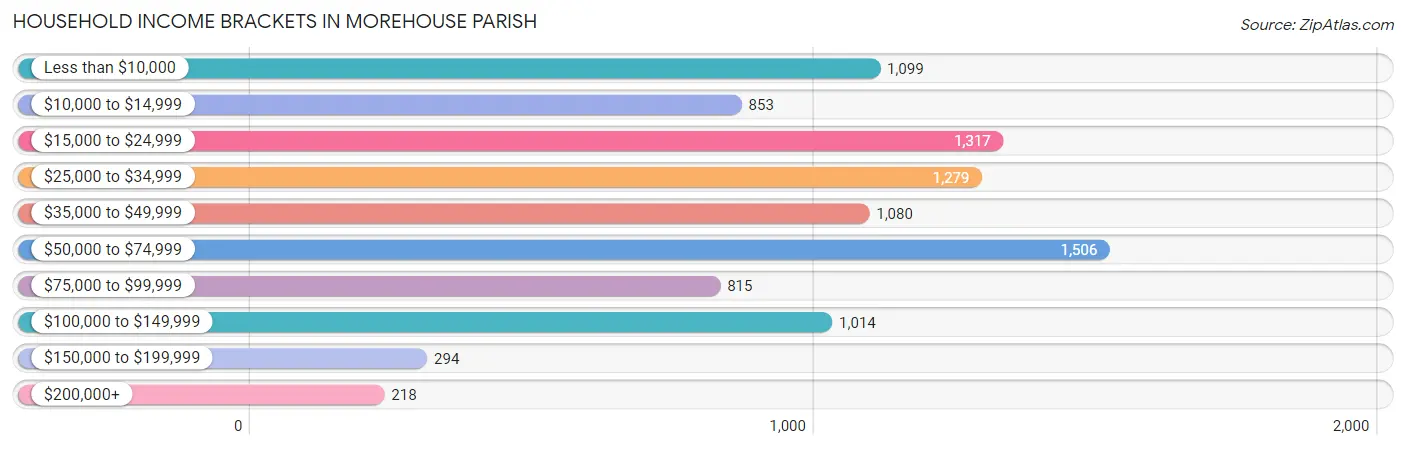
Household Income Brackets in Morehouse Parish
With 1,506 households falling in the category, the $50,000 to $74,999 income range is the most frequent in Morehouse Parish, accounting for 15.9% of all households. In contrast, only 218 households (2.3%) fall into the $200,000+ income bracket, making it the least populous group.
| Income Bracket | # Households | % Households |
| Less than $10,000 | 1,099 | 11.6% |
| $10,000 to $14,999 | 853 | 9.0% |
| $15,000 to $24,999 | 1,317 | 13.9% |
| $25,000 to $34,999 | 1,279 | 13.5% |
| $35,000 to $49,999 | 1,080 | 11.4% |
| $50,000 to $74,999 | 1,506 | 15.9% |
| $75,000 to $99,999 | 815 | 8.6% |
| $100,000 to $149,999 | 1,014 | 10.7% |
| $150,000 to $199,999 | 294 | 3.1% |
| $200,000+ | 218 | 2.3% |
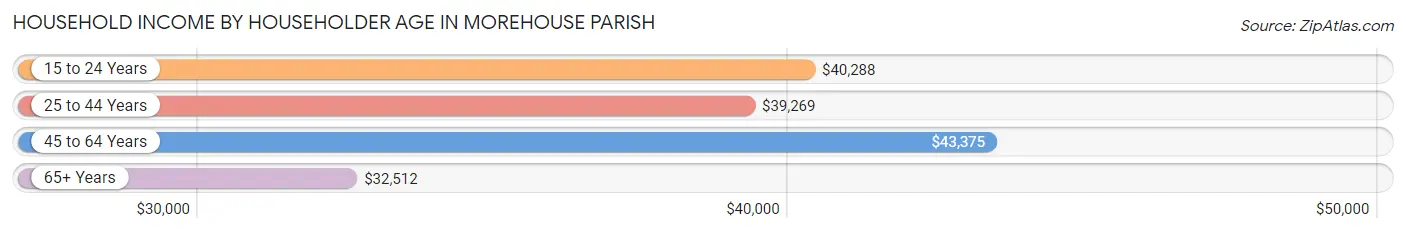
Household Income by Householder Age in Morehouse Parish
The median household income in Morehouse Parish is $37,875, with the highest median household income of $43,375 found in the 45 to 64 years age bracket for the primary householder. A total of 3,864 households (40.8%) fall into this category. Meanwhile, the 65+ years age bracket for the primary householder has the lowest median household income of $32,512, with 2,889 households (30.5%) in this group.
| Income Bracket | # Households | Median Income |
| 15 to 24 Years | 133 (1.4%) | $40,288 |
| 25 to 44 Years | 2,588 (27.3%) | $39,269 |
| 45 to 64 Years | 3,864 (40.8%) | $43,375 |
| 65+ Years | 2,889 (30.5%) | $32,512 |
| Total | 9,474 (100.0%) | $37,875 |
Poverty in Morehouse Parish
Income Below Poverty by Sex and Age in Morehouse Parish
With 27.2% poverty level for males and 30.2% for females among the residents of Morehouse Parish, 15 year old males and 12 to 14 year old females are the most vulnerable to poverty, with 146 males (71.6%) and 326 females (72.9%) in their respective age groups living below the poverty level.
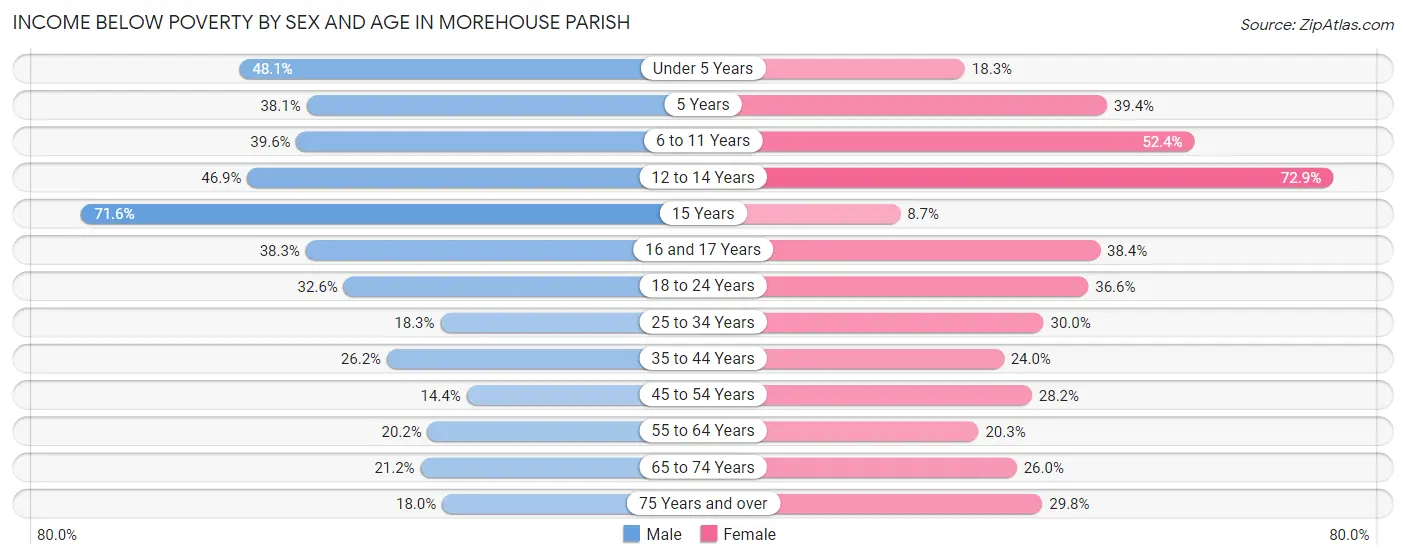
| Age Bracket | Male | Female |
| Under 5 Years | 390 (48.1%) | 140 (18.3%) |
| 5 Years | 37 (38.1%) | 50 (39.4%) |
| 6 to 11 Years | 467 (39.6%) | 533 (52.4%) |
| 12 to 14 Years | 137 (46.9%) | 326 (72.9%) |
| 15 Years | 146 (71.6%) | 13 (8.7%) |
| 16 and 17 Years | 119 (38.3%) | 135 (38.4%) |
| 18 to 24 Years | 394 (32.6%) | 347 (36.6%) |
| 25 to 34 Years | 249 (18.3%) | 424 (30.0%) |
| 35 to 44 Years | 345 (26.2%) | 393 (24.0%) |
| 45 to 54 Years | 206 (14.4%) | 412 (28.2%) |
| 55 to 64 Years | 307 (20.2%) | 383 (20.3%) |
| 65 to 74 Years | 278 (21.2%) | 399 (26.0%) |
| 75 Years and over | 127 (18.0%) | 310 (29.8%) |
| Total | 3,202 (27.2%) | 3,865 (30.2%) |
Income Above Poverty by Sex and Age in Morehouse Parish
According to the poverty statistics in Morehouse Parish, males aged 45 to 54 years and females aged 15 years are the age groups that are most secure financially, with 85.6% of males and 91.3% of females in these age groups living above the poverty line.
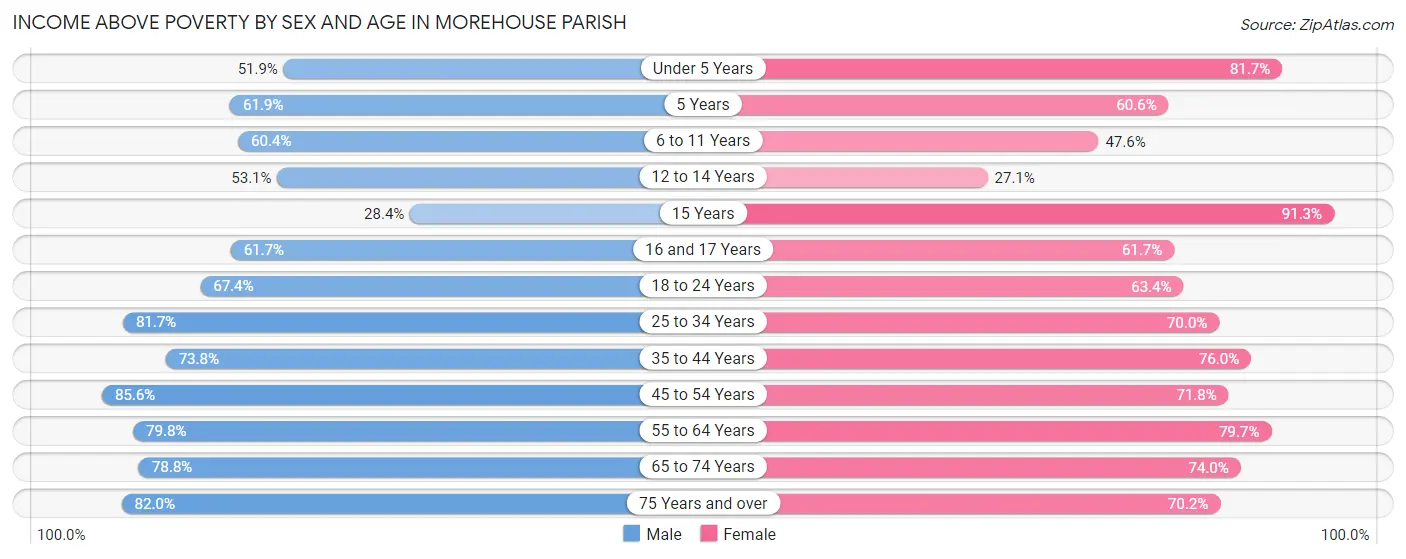
| Age Bracket | Male | Female |
| Under 5 Years | 421 (51.9%) | 626 (81.7%) |
| 5 Years | 60 (61.9%) | 77 (60.6%) |
| 6 to 11 Years | 711 (60.4%) | 485 (47.6%) |
| 12 to 14 Years | 155 (53.1%) | 121 (27.1%) |
| 15 Years | 58 (28.4%) | 137 (91.3%) |
| 16 and 17 Years | 192 (61.7%) | 217 (61.7%) |
| 18 to 24 Years | 814 (67.4%) | 601 (63.4%) |
| 25 to 34 Years | 1,115 (81.7%) | 991 (70.0%) |
| 35 to 44 Years | 972 (73.8%) | 1,242 (76.0%) |
| 45 to 54 Years | 1,229 (85.6%) | 1,048 (71.8%) |
| 55 to 64 Years | 1,216 (79.8%) | 1,504 (79.7%) |
| 65 to 74 Years | 1,032 (78.8%) | 1,137 (74.0%) |
| 75 Years and over | 578 (82.0%) | 731 (70.2%) |
| Total | 8,553 (72.8%) | 8,917 (69.8%) |
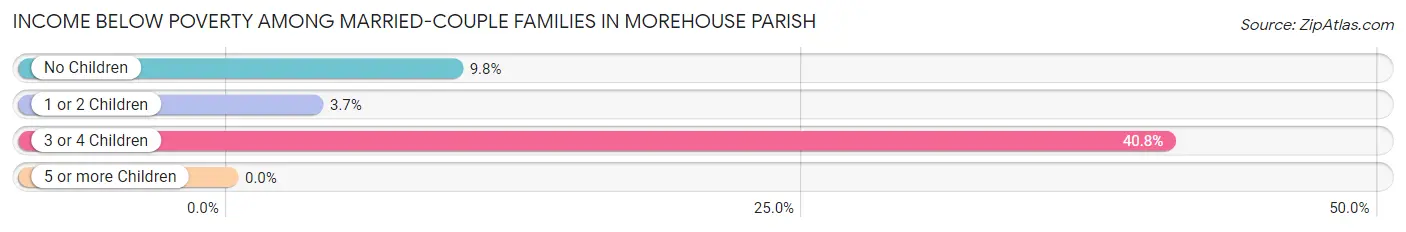
Income Below Poverty Among Married-Couple Families in Morehouse Parish
The poverty statistics for married-couple families in Morehouse Parish show that 10.7% or 408 of the total 3,822 families live below the poverty line. Families with 3 or 4 children have the highest poverty rate of 40.8%, comprising of 126 families. On the other hand, families with 5 or more children have the lowest poverty rate of 0.0%, which includes 0 families.
| Children | Above Poverty | Below Poverty |
| No Children | 2,269 (90.2%) | 246 (9.8%) |
| 1 or 2 Children | 936 (96.3%) | 36 (3.7%) |
| 3 or 4 Children | 183 (59.2%) | 126 (40.8%) |
| 5 or more Children | 26 (100.0%) | 0 (0.0%) |
| Total | 3,414 (89.3%) | 408 (10.7%) |
Income Below Poverty Among Single-Parent Households in Morehouse Parish
According to the poverty data in Morehouse Parish, 20.7% or 103 single-father households and 50.4% or 722 single-mother households are living below the poverty line. Among single-father households, those with 3 or 4 children have the highest poverty rate, with 13 households (54.2%) experiencing poverty. Likewise, among single-mother households, those with 3 or 4 children have the highest poverty rate, with 182 households (80.9%) falling below the poverty line.
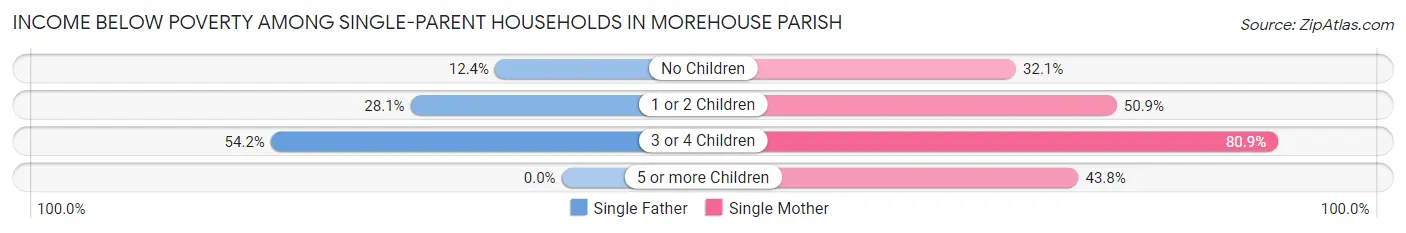
| Children | Single Father | Single Mother |
| No Children | 34 (12.4%) | 124 (32.1%) |
| 1 or 2 Children | 56 (28.1%) | 402 (50.9%) |
| 3 or 4 Children | 13 (54.2%) | 182 (80.9%) |
| 5 or more Children | 0 (0.0%) | 14 (43.8%) |
| Total | 103 (20.7%) | 722 (50.4%) |
Income Below Poverty Among Married-Couple vs Single-Parent Households in Morehouse Parish
The poverty data for Morehouse Parish shows that 408 of the married-couple family households (10.7%) and 825 of the single-parent households (42.7%) are living below the poverty level. Within the married-couple family households, those with 3 or 4 children have the highest poverty rate, with 126 households (40.8%) falling below the poverty line. Among the single-parent households, those with 3 or 4 children have the highest poverty rate, with 195 household (78.3%) living below poverty.
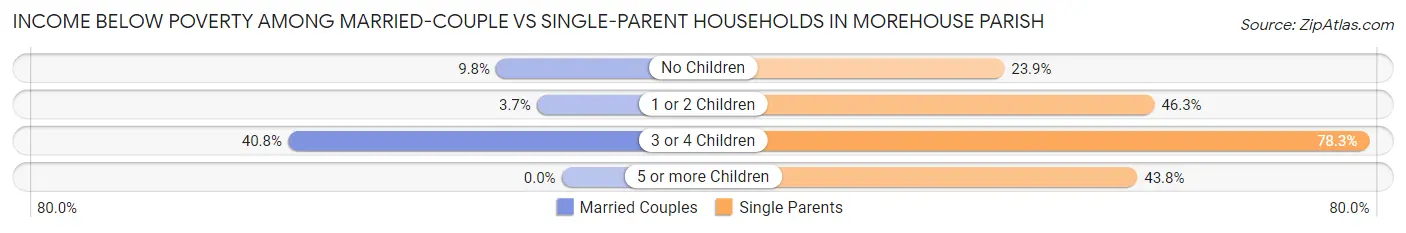
| Children | Married-Couple Families | Single-Parent Households |
| No Children | 246 (9.8%) | 158 (23.9%) |
| 1 or 2 Children | 36 (3.7%) | 458 (46.3%) |
| 3 or 4 Children | 126 (40.8%) | 195 (78.3%) |
| 5 or more Children | 0 (0.0%) | 14 (43.8%) |
| Total | 408 (10.7%) | 825 (42.7%) |
Race in Morehouse Parish
The most populous races in Morehouse Parish are White / Caucasian (12,287 | 48.3%), Black / African American (12,277 | 48.3%), and Two or more Races (545 | 2.1%).
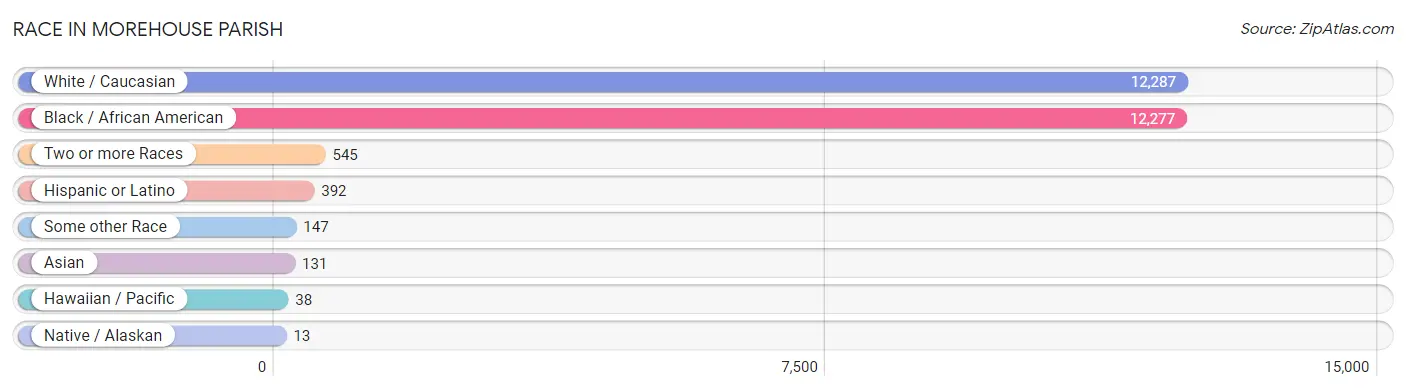
| Race | # Population | % Population |
| Asian | 131 | 0.5% |
| Black / African American | 12,277 | 48.3% |
| Hawaiian / Pacific | 38 | 0.2% |
| Hispanic or Latino | 392 | 1.5% |
| Native / Alaskan | 13 | 0.1% |
| White / Caucasian | 12,287 | 48.3% |
| Two or more Races | 545 | 2.1% |
| Some other Race | 147 | 0.6% |
| Total | 25,438 | 100.0% |
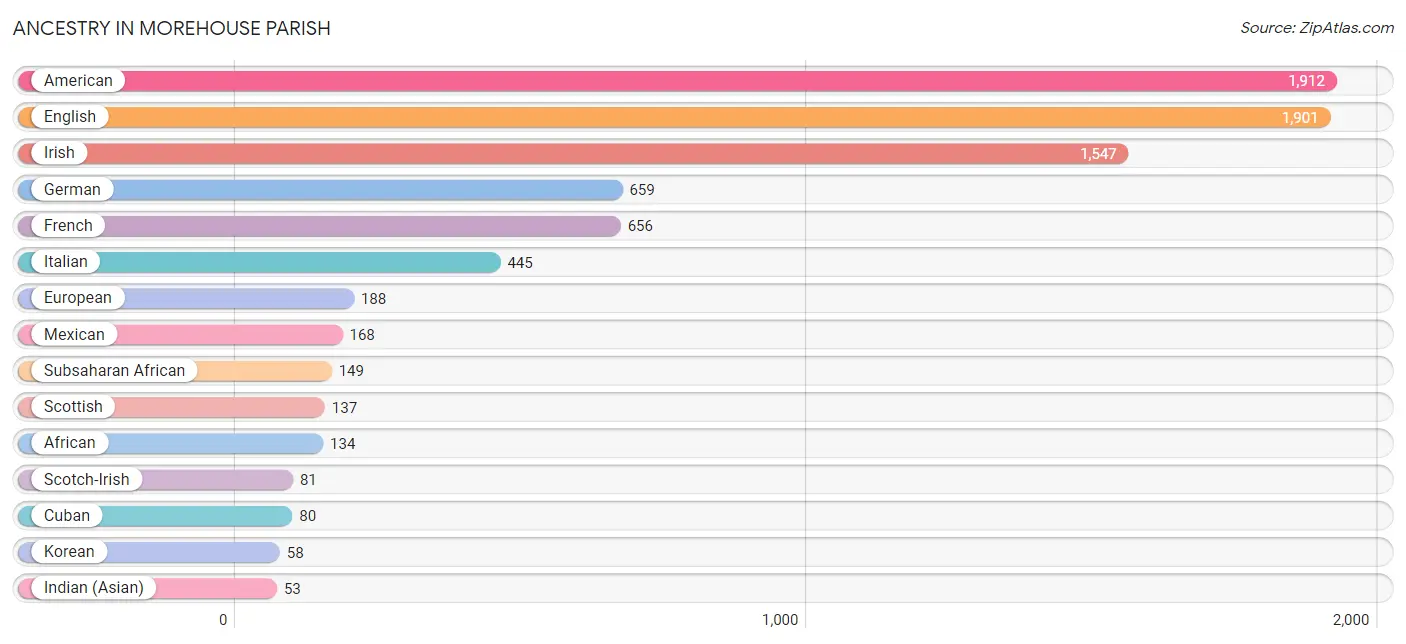
Ancestry in Morehouse Parish
The most populous ancestries reported in Morehouse Parish are American (1,912 | 7.5%), English (1,901 | 7.5%), Irish (1,547 | 6.1%), German (659 | 2.6%), and French (656 | 2.6%), together accounting for 26.2% of all Morehouse Parish residents.
| Ancestry | # Population | % Population |
| African | 134 | 0.5% |
| American | 1,912 | 7.5% |
| Arab | 36 | 0.1% |
| Bhutanese | 1 | 0.0% |
| Blackfeet | 5 | 0.0% |
| British | 35 | 0.1% |
| Cajun | 8 | 0.0% |
| Cherokee | 5 | 0.0% |
| Choctaw | 7 | 0.0% |
| Colombian | 21 | 0.1% |
| Comanche | 15 | 0.1% |
| Creek | 7 | 0.0% |
| Cuban | 80 | 0.3% |
| Dutch | 12 | 0.1% |
| English | 1,901 | 7.5% |
| European | 188 | 0.7% |
| Filipino | 10 | 0.0% |
| Finnish | 15 | 0.1% |
| French | 656 | 2.6% |
| French Canadian | 6 | 0.0% |
| German | 659 | 2.6% |
| Guamanian / Chamorro | 38 | 0.2% |
| Haitian | 29 | 0.1% |
| Indian (Asian) | 53 | 0.2% |
| Irish | 1,547 | 6.1% |
| Italian | 445 | 1.8% |
| Jordanian | 8 | 0.0% |
| Korean | 58 | 0.2% |
| Mexican | 168 | 0.7% |
| Moroccan | 8 | 0.0% |
| Nigerian | 15 | 0.1% |
| Northern European | 7 | 0.0% |
| Pakistani | 9 | 0.0% |
| Puerto Rican | 36 | 0.1% |
| Scandinavian | 1 | 0.0% |
| Scotch-Irish | 81 | 0.3% |
| Scottish | 137 | 0.5% |
| South American | 21 | 0.1% |
| Spanish | 2 | 0.0% |
| Subsaharan African | 149 | 0.6% |
| Swedish | 26 | 0.1% |
| Syrian | 28 | 0.1% |
| Welsh | 23 | 0.1% |
| Yugoslavian | 40 | 0.2% | View All 44 Rows |
Immigrants in Morehouse Parish
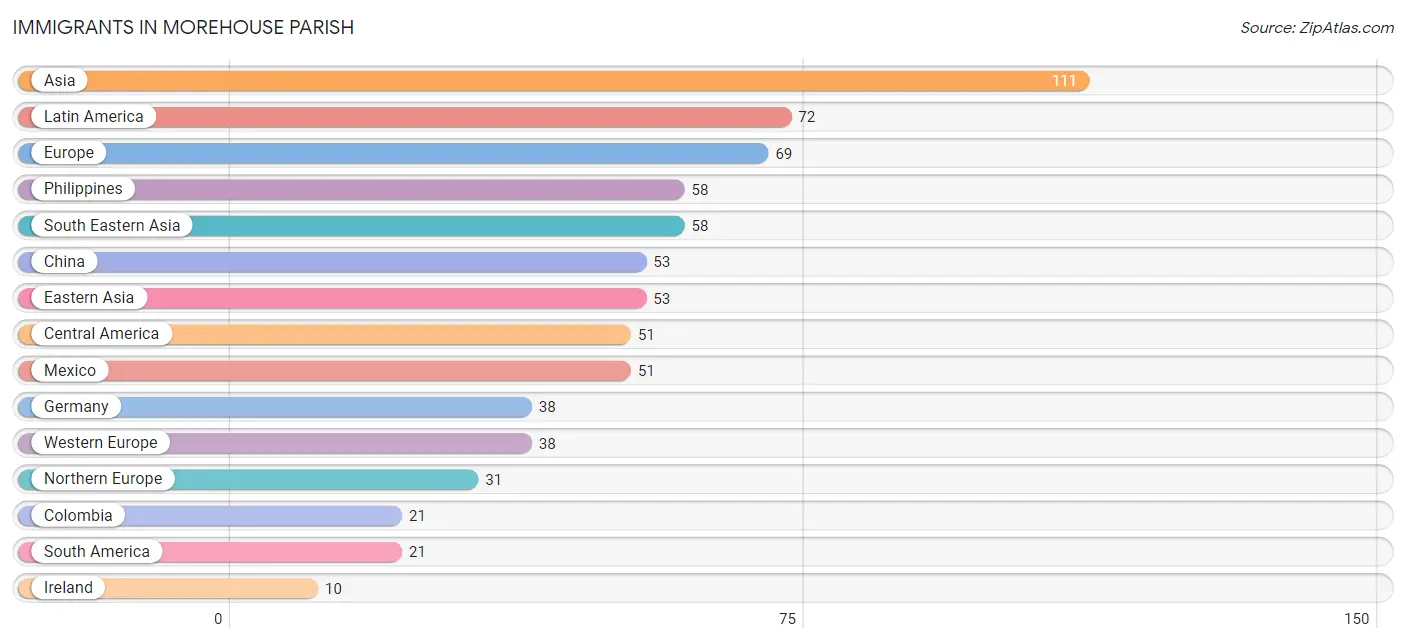
The most numerous immigrant groups reported in Morehouse Parish came from Asia (111 | 0.4%), Latin America (72 | 0.3%), Europe (69 | 0.3%), Philippines (58 | 0.2%), and South Eastern Asia (58 | 0.2%), together accounting for 1.4% of all Morehouse Parish residents.
| Immigration Origin | # Population | % Population |
| Asia | 111 | 0.4% |
| Central America | 51 | 0.2% |
| China | 53 | 0.2% |
| Colombia | 21 | 0.1% |
| Eastern Asia | 53 | 0.2% |
| Europe | 69 | 0.3% |
| Germany | 38 | 0.2% |
| Ireland | 10 | 0.0% |
| Latin America | 72 | 0.3% |
| Mexico | 51 | 0.2% |
| Northern Europe | 31 | 0.1% |
| Philippines | 58 | 0.2% |
| South America | 21 | 0.1% |
| South Eastern Asia | 58 | 0.2% |
| Taiwan | 10 | 0.0% |
| Western Europe | 38 | 0.2% | View All 16 Rows |
Sex and Age in Morehouse Parish
Sex and Age in Morehouse Parish
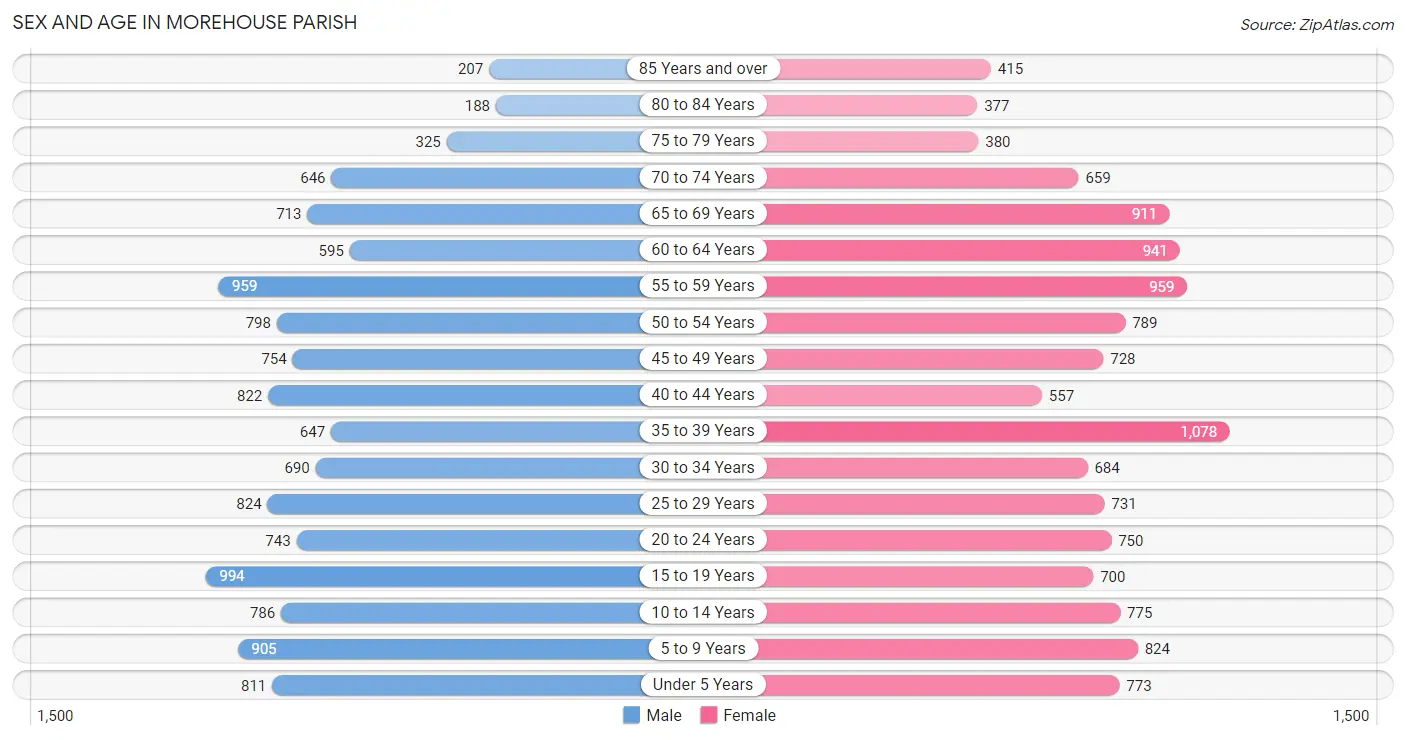
The most populous age groups in Morehouse Parish are 15 to 19 Years (994 | 8.0%) for men and 35 to 39 Years (1,078 | 8.3%) for women.
| Age Bracket | Male | Female |
| Under 5 Years | 811 (6.5%) | 773 (5.9%) |
| 5 to 9 Years | 905 (7.3%) | 824 (6.3%) |
| 10 to 14 Years | 786 (6.3%) | 775 (5.9%) |
| 15 to 19 Years | 994 (8.0%) | 700 (5.4%) |
| 20 to 24 Years | 743 (6.0%) | 750 (5.8%) |
| 25 to 29 Years | 824 (6.6%) | 731 (5.6%) |
| 30 to 34 Years | 690 (5.6%) | 684 (5.2%) |
| 35 to 39 Years | 647 (5.2%) | 1,078 (8.3%) |
| 40 to 44 Years | 822 (6.6%) | 557 (4.3%) |
| 45 to 49 Years | 754 (6.1%) | 728 (5.6%) |
| 50 to 54 Years | 798 (6.4%) | 789 (6.0%) |
| 55 to 59 Years | 959 (7.7%) | 959 (7.4%) |
| 60 to 64 Years | 595 (4.8%) | 941 (7.2%) |
| 65 to 69 Years | 713 (5.8%) | 911 (7.0%) |
| 70 to 74 Years | 646 (5.2%) | 659 (5.1%) |
| 75 to 79 Years | 325 (2.6%) | 380 (2.9%) |
| 80 to 84 Years | 188 (1.5%) | 377 (2.9%) |
| 85 Years and over | 207 (1.7%) | 415 (3.2%) |
| Total | 12,407 (100.0%) | 13,031 (100.0%) |
Families and Households in Morehouse Parish
Median Family Size in Morehouse Parish
The median family size in Morehouse Parish is 3.46 persons per family, with single female/mother families (1,433 | 24.9%) accounting for the largest median family size of 4.36 persons per family. On the other hand, single male/father families (497 | 8.6%) represent the smallest median family size with 2.77 persons per family.

| Family Type | # Families | Family Size |
| Married-Couple | 3,822 (66.4%) | 3.21 |
| Single Male/Father | 497 (8.6%) | 2.77 |
| Single Female/Mother | 1,433 (24.9%) | 4.36 |
| Total Families | 5,752 (100.0%) | 3.46 |
Median Household Size in Morehouse Parish
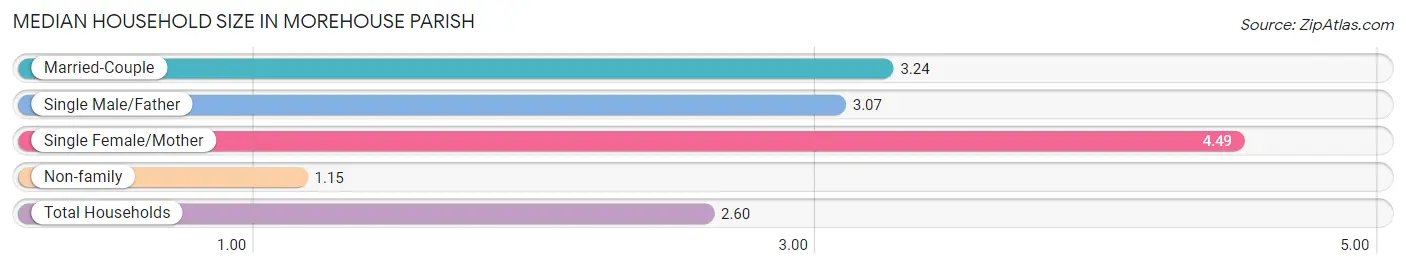
The median household size in Morehouse Parish is 2.60 persons per household, with single female/mother households (1,433 | 15.1%) accounting for the largest median household size of 4.49 persons per household. non-family households (3,722 | 39.3%) represent the smallest median household size with 1.15 persons per household.
| Household Type | # Households | Household Size |
| Married-Couple | 3,822 (40.3%) | 3.24 |
| Single Male/Father | 497 (5.2%) | 3.07 |
| Single Female/Mother | 1,433 (15.1%) | 4.49 |
| Non-family | 3,722 (39.3%) | 1.15 |
| Total Households | 9,474 (100.0%) | 2.60 |
Household Size by Marriage Status in Morehouse Parish
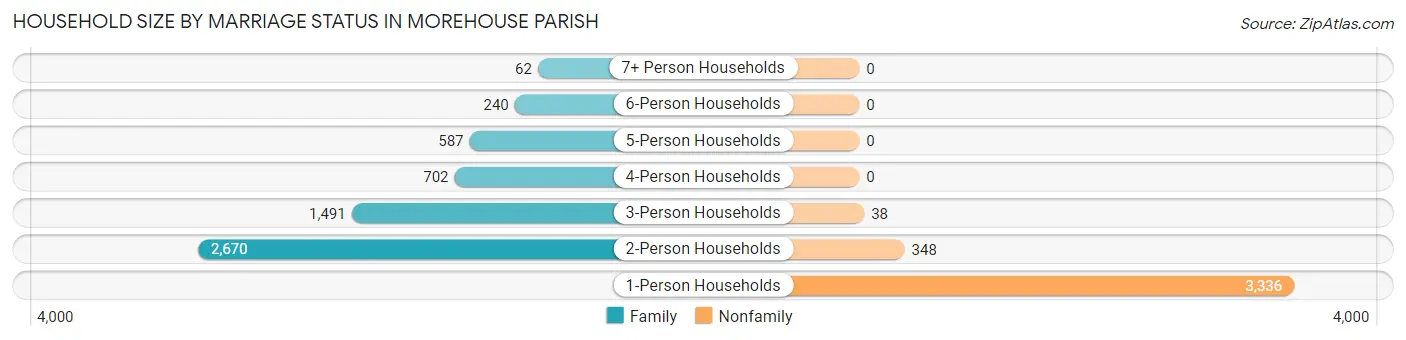
Out of a total of 9,474 households in Morehouse Parish, 5,752 (60.7%) are family households, while 3,722 (39.3%) are nonfamily households. The most numerous type of family households are 2-person households, comprising 2,670, and the most common type of nonfamily households are 1-person households, comprising 3,336.
| Household Size | Family Households | Nonfamily Households |
| 1-Person Households | - | 3,336 (35.2%) |
| 2-Person Households | 2,670 (28.2%) | 348 (3.7%) |
| 3-Person Households | 1,491 (15.7%) | 38 (0.4%) |
| 4-Person Households | 702 (7.4%) | 0 (0.0%) |
| 5-Person Households | 587 (6.2%) | 0 (0.0%) |
| 6-Person Households | 240 (2.5%) | 0 (0.0%) |
| 7+ Person Households | 62 (0.6%) | 0 (0.0%) |
| Total | 5,752 (60.7%) | 3,722 (39.3%) |
Female Fertility in Morehouse Parish
Fertility by Age in Morehouse Parish
Average fertility rate in Morehouse Parish is 52.0 births per 1,000 women. Women in the age bracket of 20 to 34 years have the highest fertility rate with 114.0 births per 1,000 women. Women in the age bracket of 20 to 34 years acount for 88.8% of all women with births.
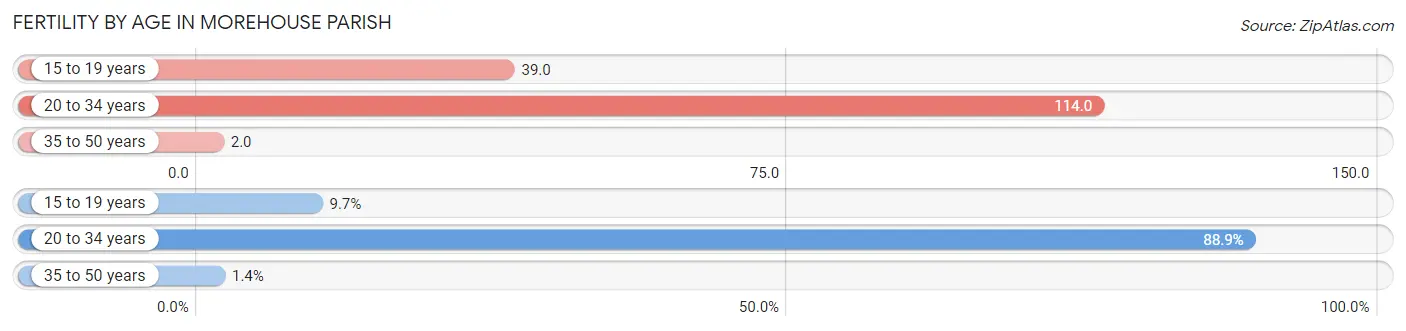
| Age Bracket | Women with Births | Births / 1,000 Women |
| 15 to 19 years | 27 (9.7%) | 39.0 |
| 20 to 34 years | 247 (88.8%) | 114.0 |
| 35 to 50 years | 4 (1.4%) | 2.0 |
| Total | 278 (100.0%) | 52.0 |
Fertility by Age by Marriage Status in Morehouse Parish
75.9% of women with births (278) in Morehouse Parish are married. The highest percentage of unmarried women with births falls into 15 to 19 years age bracket with 100.0% of them unmarried at the time of birth, while the lowest percentage of unmarried women with births belong to 20 to 34 years age bracket with 14.6% of them unmarried.
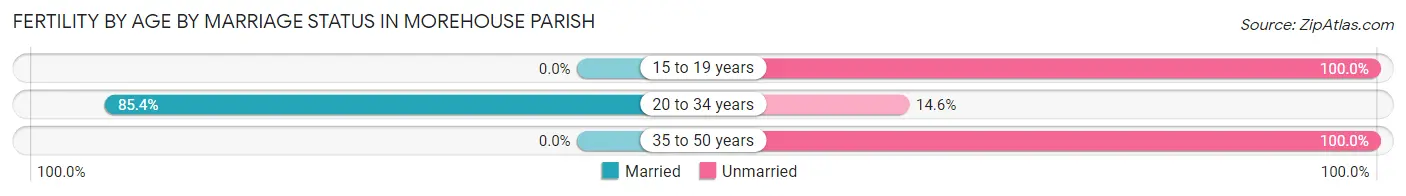
| Age Bracket | Married | Unmarried |
| 15 to 19 years | 0 (0.0%) | 27 (100.0%) |
| 20 to 34 years | 211 (85.4%) | 36 (14.6%) |
| 35 to 50 years | 0 (0.0%) | 4 (100.0%) |
| Total | 211 (75.9%) | 67 (24.1%) |
Fertility by Education in Morehouse Parish
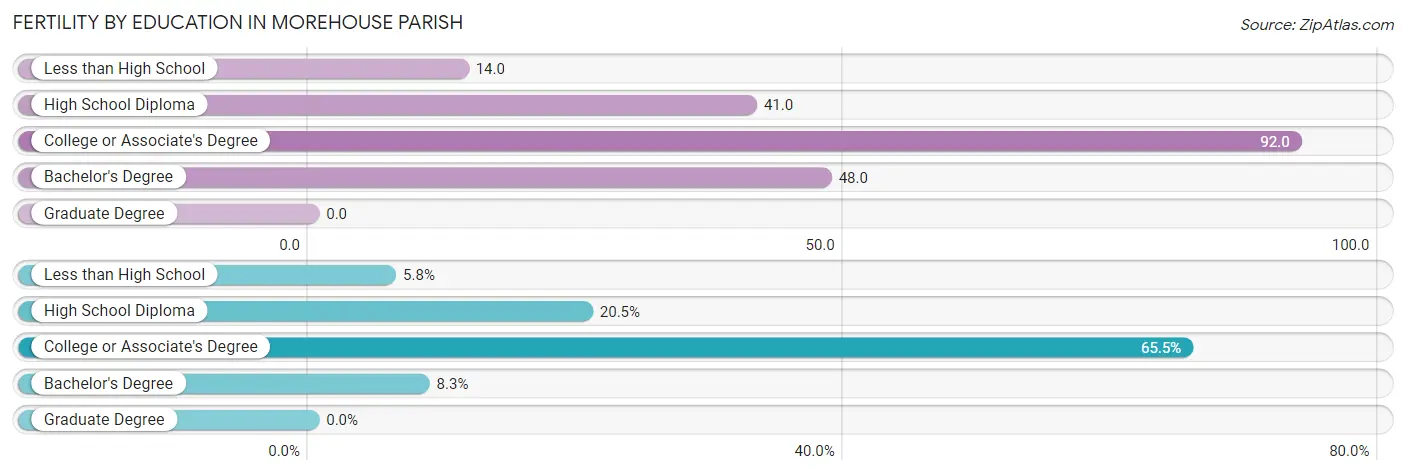
| Educational Attainment | Women with Births | Births / 1,000 Women |
| Less than High School | 16 (5.8%) | 14.0 |
| High School Diploma | 57 (20.5%) | 41.0 |
| College or Associate's Degree | 182 (65.5%) | 92.0 |
| Bachelor's Degree | 23 (8.3%) | 48.0 |
| Graduate Degree | 0 (0.0%) | 0.0 |
| Total | 278 (100.0%) | 52.0 |
Fertility by Education by Marriage Status in Morehouse Parish
24.1% of women with births in Morehouse Parish are unmarried. Women with the educational attainment of bachelor's degree are most likely to be married with 100.0% of them married at childbirth, while women with the educational attainment of less than high school are least likely to be married with 100.0% of them unmarried at childbirth.
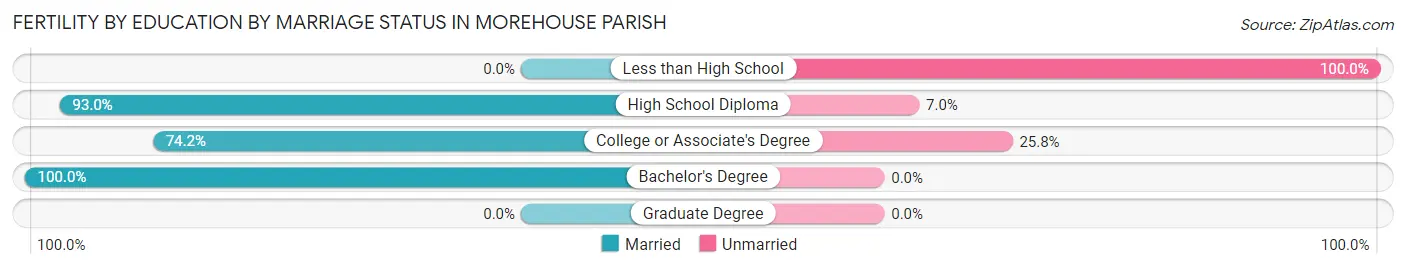
| Educational Attainment | Married | Unmarried |
| Less than High School | 0 (0.0%) | 16 (100.0%) |
| High School Diploma | 53 (93.0%) | 4 (7.0%) |
| College or Associate's Degree | 135 (74.2%) | 47 (25.8%) |
| Bachelor's Degree | 23 (100.0%) | 0 (0.0%) |
| Graduate Degree | 0 (0.0%) | 0 (0.0%) |
| Total | 211 (75.9%) | 67 (24.1%) |
Employment Characteristics in Morehouse Parish
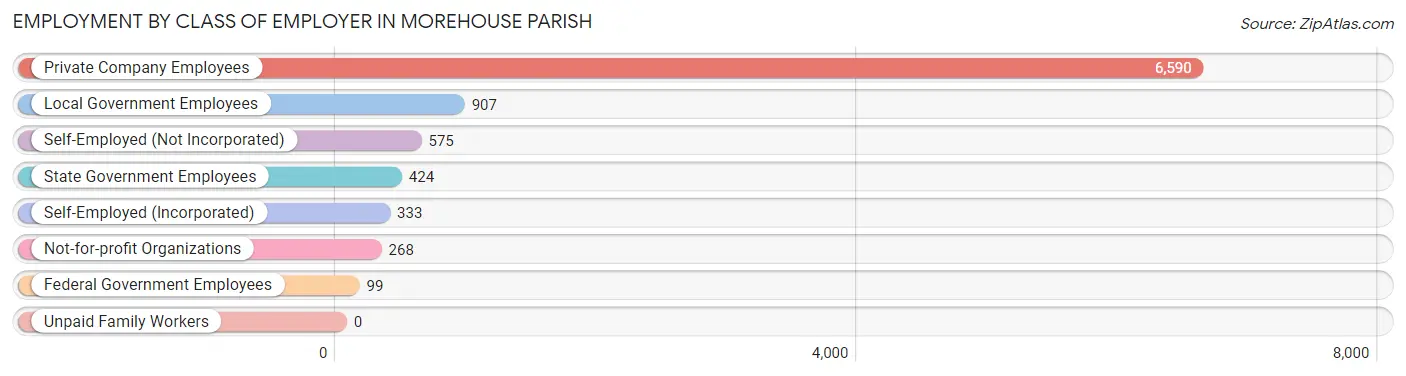
Employment by Class of Employer in Morehouse Parish
Among the 9,196 employed individuals in Morehouse Parish, private company employees (6,590 | 71.7%), local government employees (907 | 9.9%), and self-employed (not incorporated) (575 | 6.2%) make up the most common classes of employment.
| Employer Class | # Employees | % Employees |
| Private Company Employees | 6,590 | 71.7% |
| Self-Employed (Incorporated) | 333 | 3.6% |
| Self-Employed (Not Incorporated) | 575 | 6.2% |
| Not-for-profit Organizations | 268 | 2.9% |
| Local Government Employees | 907 | 9.9% |
| State Government Employees | 424 | 4.6% |
| Federal Government Employees | 99 | 1.1% |
| Unpaid Family Workers | 0 | 0.0% |
| Total | 9,196 | 100.0% |
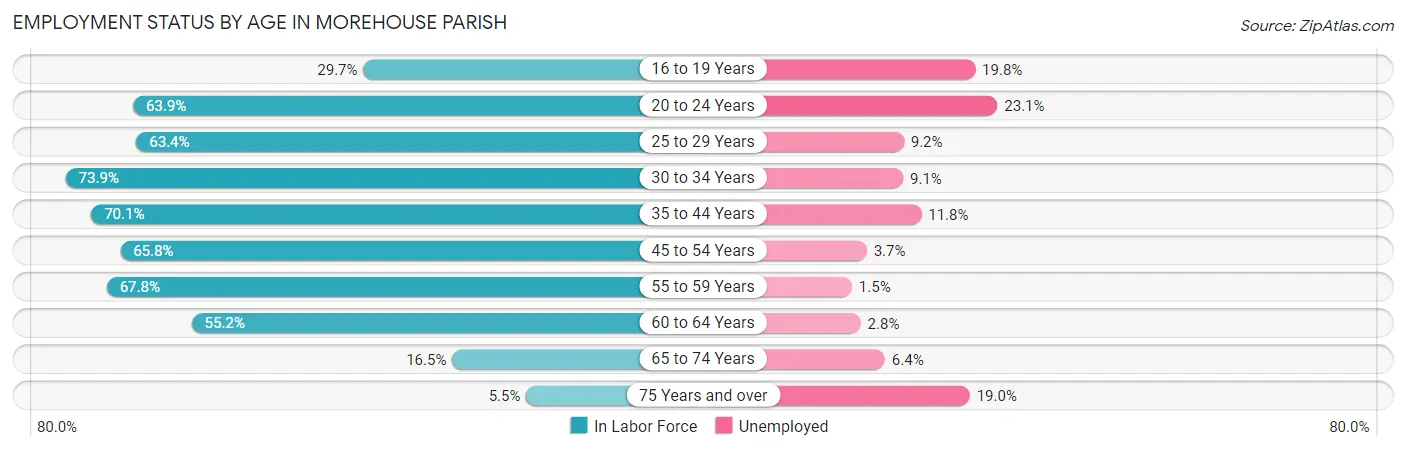
Employment Status by Age in Morehouse Parish
According to the labor force statistics for Morehouse Parish, out of the total population over 16 years of age (20,210), 50.9% or 10,287 individuals are in the labor force, with 8.8% or 905 of them unemployed. The age group with the highest labor force participation rate is 30 to 34 years, with 73.9% or 1,015 individuals in the labor force. Within the labor force, the 20 to 24 years age range has the highest percentage of unemployed individuals, with 23.1% or 220 of them being unemployed.
| Age Bracket | In Labor Force | Unemployed |
| 16 to 19 Years | 398 (29.7%) | 79 (19.8%) |
| 20 to 24 Years | 954 (63.9%) | 220 (23.1%) |
| 25 to 29 Years | 986 (63.4%) | 91 (9.2%) |
| 30 to 34 Years | 1,015 (73.9%) | 92 (9.1%) |
| 35 to 44 Years | 2,176 (70.1%) | 257 (11.8%) |
| 45 to 54 Years | 2,019 (65.8%) | 75 (3.7%) |
| 55 to 59 Years | 1,300 (67.8%) | 20 (1.5%) |
| 60 to 64 Years | 848 (55.2%) | 24 (2.8%) |
| 65 to 74 Years | 483 (16.5%) | 31 (6.4%) |
| 75 Years and over | 104 (5.5%) | 20 (19.0%) |
| Total | 10,287 (50.9%) | 905 (8.8%) |
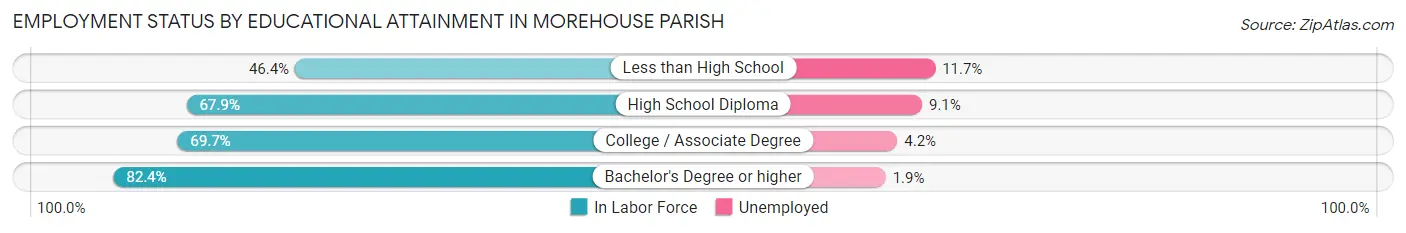
Employment Status by Educational Attainment in Morehouse Parish
According to labor force statistics for Morehouse Parish, 66.5% of individuals (8,350) out of the total population between 25 and 64 years of age (12,556) are in the labor force, with 6.7% or 559 of them being unemployed. The group with the highest labor force participation rate are those with the educational attainment of bachelor's degree or higher, with 82.4% or 1,329 individuals in the labor force. Within the labor force, individuals with less than high school education have the highest percentage of unemployment, with 11.7% or 123 of them being unemployed.
| Educational Attainment | In Labor Force | Unemployed |
| Less than High School | 1,050 (46.4%) | 265 (11.7%) |
| High School Diploma | 3,267 (67.9%) | 438 (9.1%) |
| College / Associate Degree | 2,696 (69.7%) | 162 (4.2%) |
| Bachelor's Degree or higher | 1,329 (82.4%) | 31 (1.9%) |
| Total | 8,350 (66.5%) | 841 (6.7%) |
Employment Occupations by Sex in Morehouse Parish
Management, Business, Science and Arts Occupations
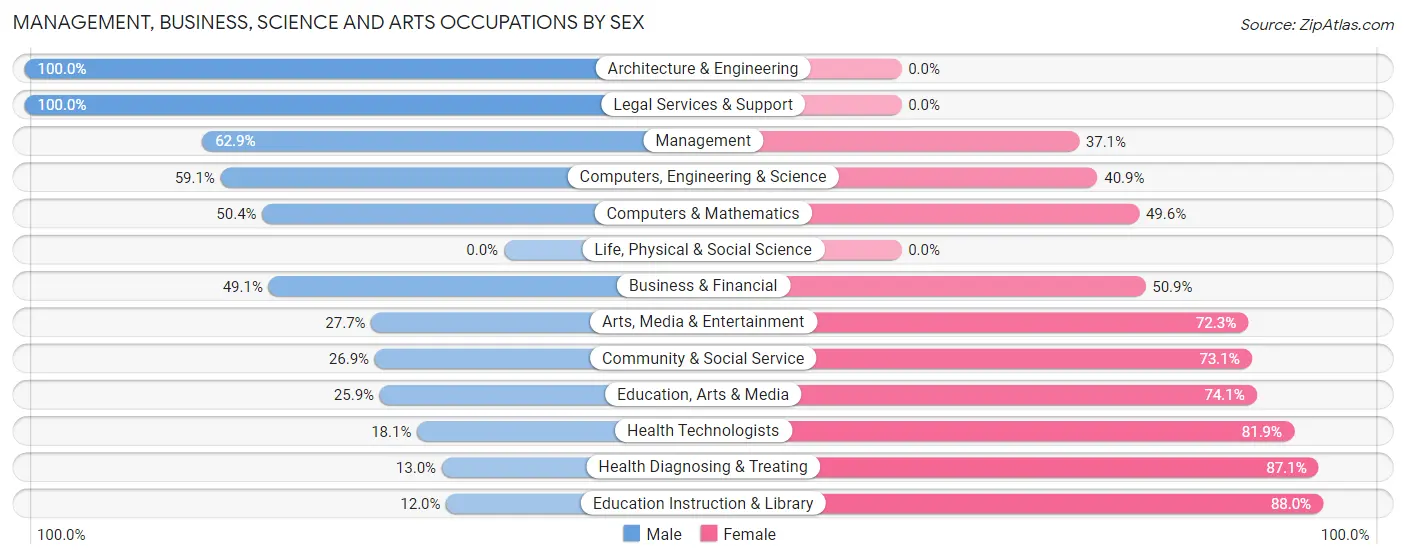
The most common Management, Business, Science and Arts occupations in Morehouse Parish are Community & Social Service (754 | 8.1%), Health Diagnosing & Treating (726 | 7.7%), Education Instruction & Library (516 | 5.5%), Management (510 | 5.4%), and Health Technologists (293 | 3.1%).
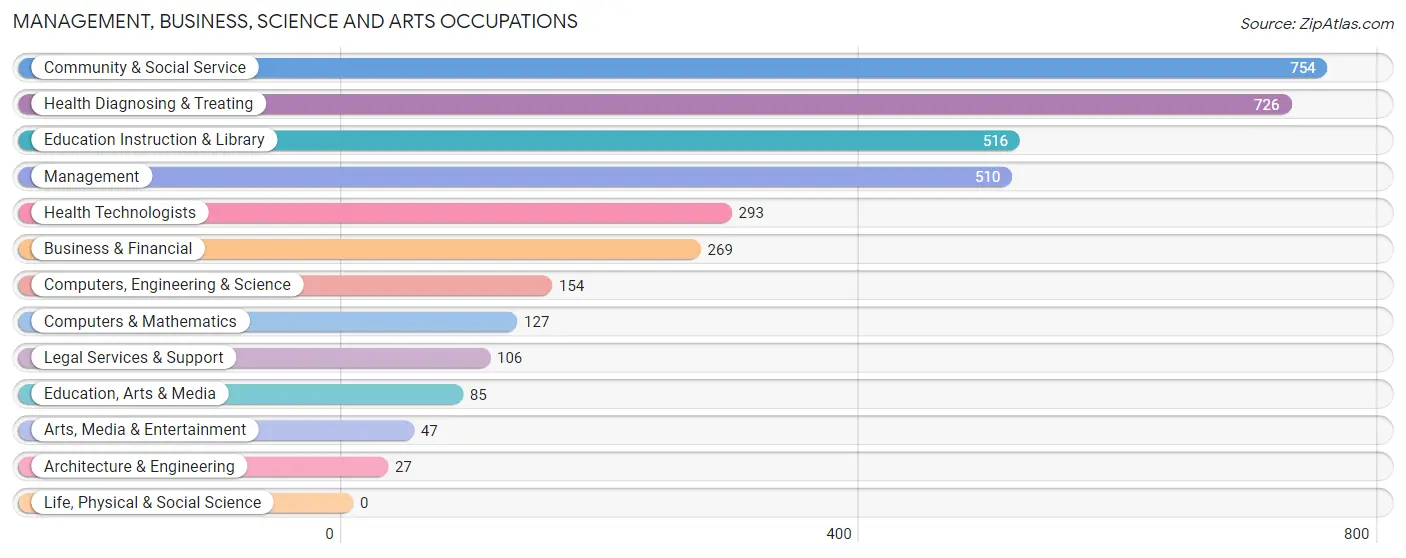
Management, Business, Science and Arts Occupations by Sex
Within the Management, Business, Science and Arts occupations in Morehouse Parish, the most male-oriented occupations are Architecture & Engineering (100.0%), Legal Services & Support (100.0%), and Management (62.9%), while the most female-oriented occupations are Education Instruction & Library (88.0%), Health Diagnosing & Treating (87.1%), and Health Technologists (81.9%).
| Occupation | Male | Female |
| Management | 321 (62.9%) | 189 (37.1%) |
| Business & Financial | 132 (49.1%) | 137 (50.9%) |
| Computers, Engineering & Science | 91 (59.1%) | 63 (40.9%) |
| Computers & Mathematics | 64 (50.4%) | 63 (49.6%) |
| Architecture & Engineering | 27 (100.0%) | 0 (0.0%) |
| Life, Physical & Social Science | 0 (0.0%) | 0 (0.0%) |
| Community & Social Service | 203 (26.9%) | 551 (73.1%) |
| Education, Arts & Media | 22 (25.9%) | 63 (74.1%) |
| Legal Services & Support | 106 (100.0%) | 0 (0.0%) |
| Education Instruction & Library | 62 (12.0%) | 454 (88.0%) |
| Arts, Media & Entertainment | 13 (27.7%) | 34 (72.3%) |
| Health Diagnosing & Treating | 94 (13.0%) | 632 (87.1%) |
| Health Technologists | 53 (18.1%) | 240 (81.9%) |
| Total (Category) | 841 (34.8%) | 1,572 (65.1%) |
| Total (Overall) | 4,729 (50.5%) | 4,642 (49.5%) |
Services Occupations
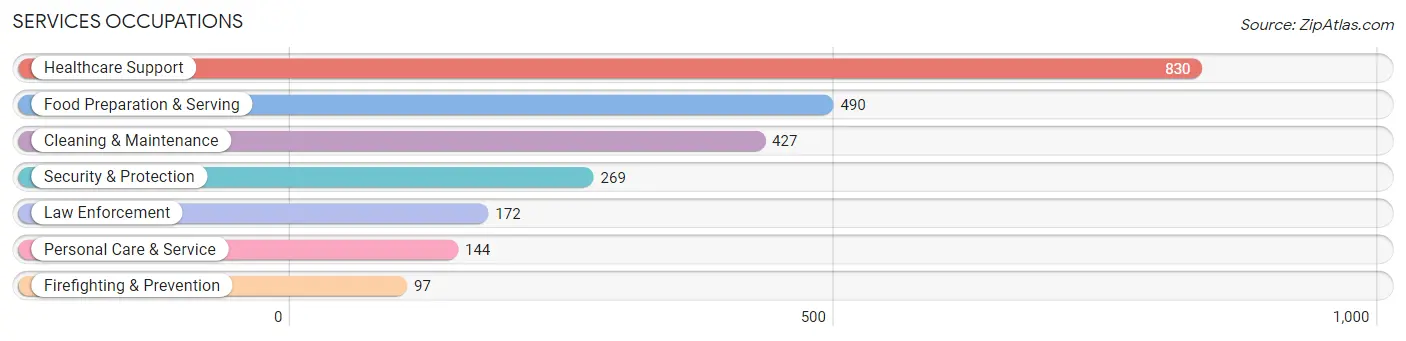
The most common Services occupations in Morehouse Parish are Healthcare Support (830 | 8.9%), Food Preparation & Serving (490 | 5.2%), Cleaning & Maintenance (427 | 4.6%), Security & Protection (269 | 2.9%), and Law Enforcement (172 | 1.8%).
Services Occupations by Sex
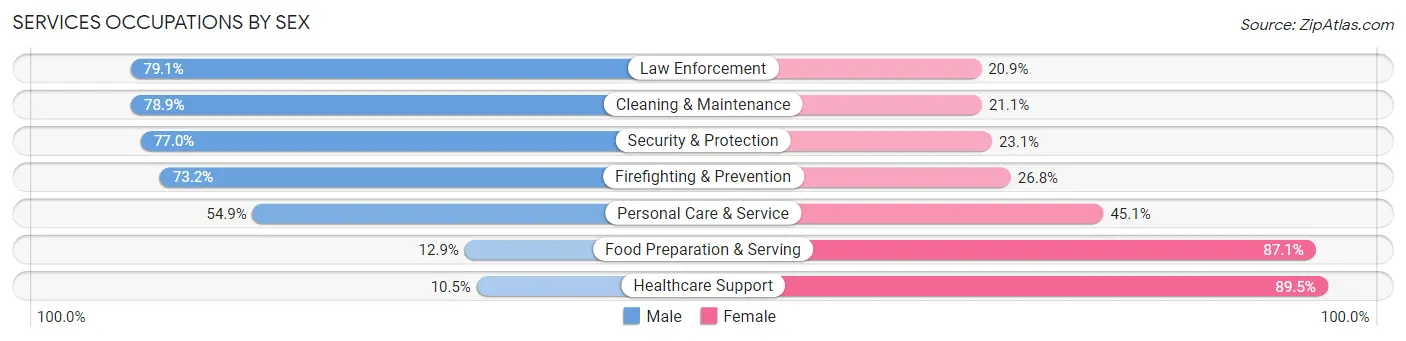
Within the Services occupations in Morehouse Parish, the most male-oriented occupations are Law Enforcement (79.1%), Cleaning & Maintenance (78.9%), and Security & Protection (76.9%), while the most female-oriented occupations are Healthcare Support (89.5%), Food Preparation & Serving (87.1%), and Personal Care & Service (45.1%).
| Occupation | Male | Female |
| Healthcare Support | 87 (10.5%) | 743 (89.5%) |
| Security & Protection | 207 (76.9%) | 62 (23.1%) |
| Firefighting & Prevention | 71 (73.2%) | 26 (26.8%) |
| Law Enforcement | 136 (79.1%) | 36 (20.9%) |
| Food Preparation & Serving | 63 (12.9%) | 427 (87.1%) |
| Cleaning & Maintenance | 337 (78.9%) | 90 (21.1%) |
| Personal Care & Service | 79 (54.9%) | 65 (45.1%) |
| Total (Category) | 773 (35.8%) | 1,387 (64.2%) |
| Total (Overall) | 4,729 (50.5%) | 4,642 (49.5%) |
Sales and Office Occupations
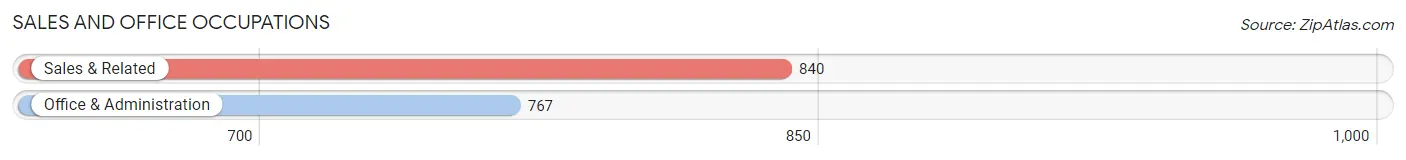
The most common Sales and Office occupations in Morehouse Parish are Sales & Related (840 | 9.0%), and Office & Administration (767 | 8.2%).
Sales and Office Occupations by Sex
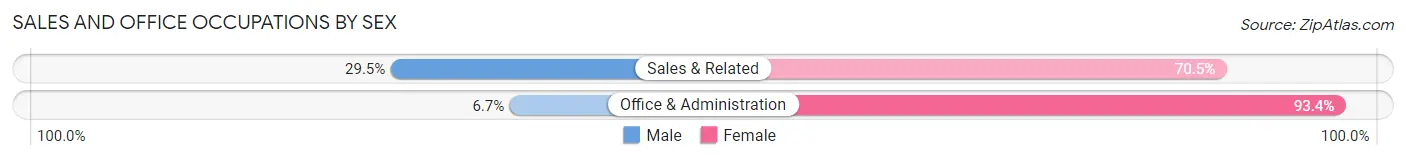
| Occupation | Male | Female |
| Sales & Related | 248 (29.5%) | 592 (70.5%) |
| Office & Administration | 51 (6.7%) | 716 (93.3%) |
| Total (Category) | 299 (18.6%) | 1,308 (81.4%) |
| Total (Overall) | 4,729 (50.5%) | 4,642 (49.5%) |
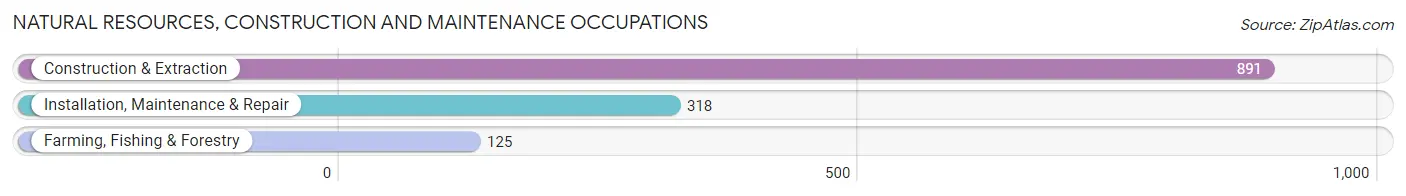
Natural Resources, Construction and Maintenance Occupations
The most common Natural Resources, Construction and Maintenance occupations in Morehouse Parish are Construction & Extraction (891 | 9.5%), Installation, Maintenance & Repair (318 | 3.4%), and Farming, Fishing & Forestry (125 | 1.3%).
Natural Resources, Construction and Maintenance Occupations by Sex
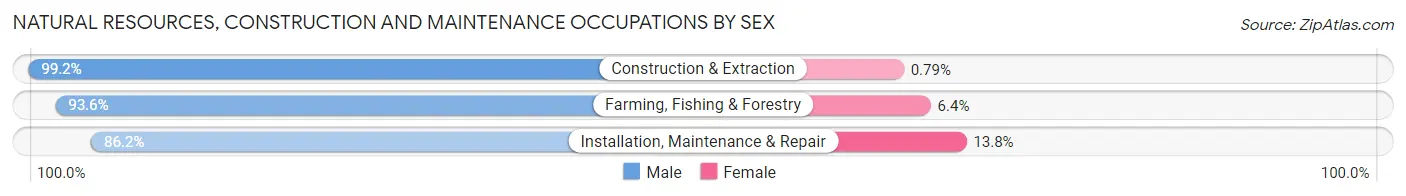
| Occupation | Male | Female |
| Farming, Fishing & Forestry | 117 (93.6%) | 8 (6.4%) |
| Construction & Extraction | 884 (99.2%) | 7 (0.8%) |
| Installation, Maintenance & Repair | 274 (86.2%) | 44 (13.8%) |
| Total (Category) | 1,275 (95.6%) | 59 (4.4%) |
| Total (Overall) | 4,729 (50.5%) | 4,642 (49.5%) |
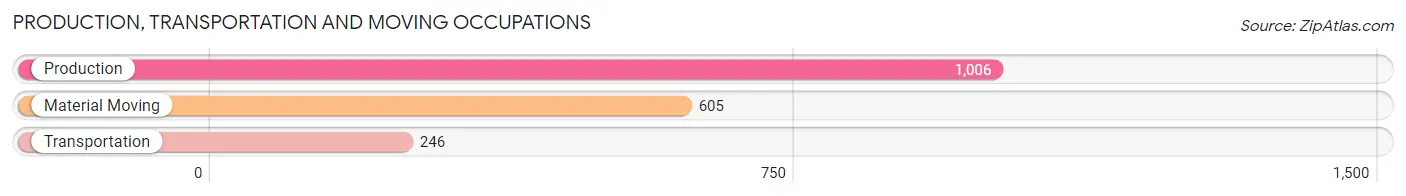
Production, Transportation and Moving Occupations
The most common Production, Transportation and Moving occupations in Morehouse Parish are Production (1,006 | 10.7%), Material Moving (605 | 6.5%), and Transportation (246 | 2.6%).
Production, Transportation and Moving Occupations by Sex
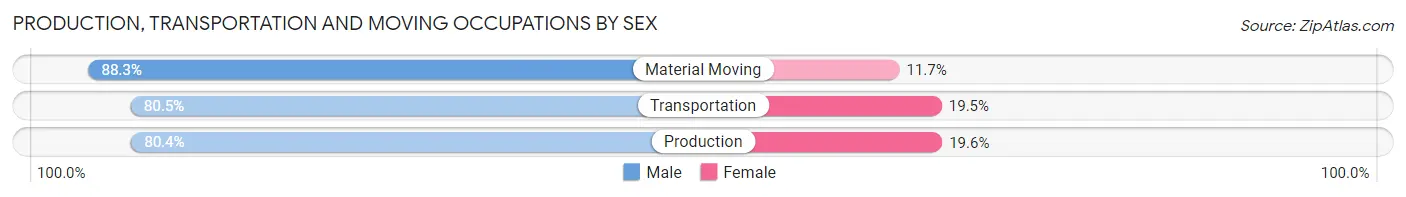
| Occupation | Male | Female |
| Production | 809 (80.4%) | 197 (19.6%) |
| Transportation | 198 (80.5%) | 48 (19.5%) |
| Material Moving | 534 (88.3%) | 71 (11.7%) |
| Total (Category) | 1,541 (83.0%) | 316 (17.0%) |
| Total (Overall) | 4,729 (50.5%) | 4,642 (49.5%) |
Employment Industries by Sex in Morehouse Parish
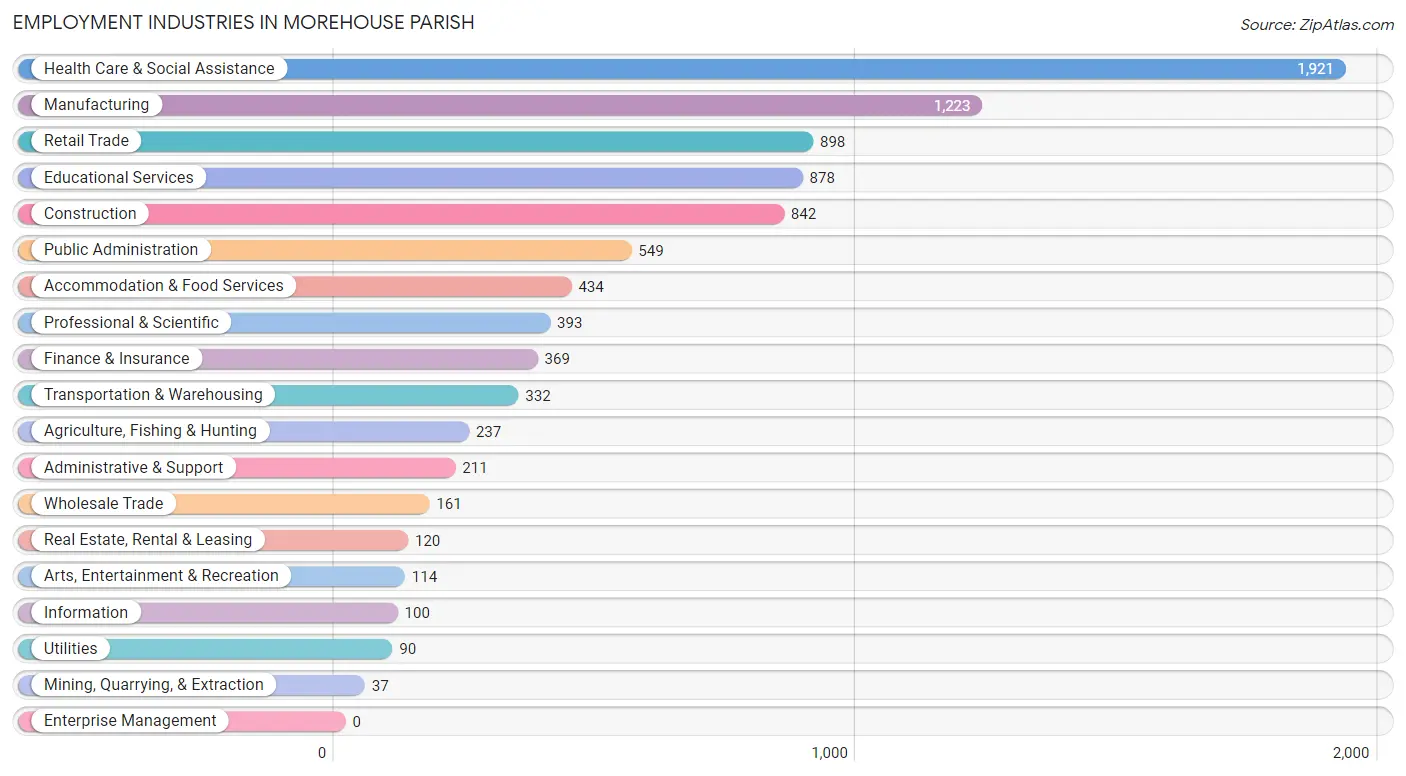
Employment Industries in Morehouse Parish
The major employment industries in Morehouse Parish include Health Care & Social Assistance (1,921 | 20.5%), Manufacturing (1,223 | 13.1%), Retail Trade (898 | 9.6%), Educational Services (878 | 9.4%), and Construction (842 | 9.0%).
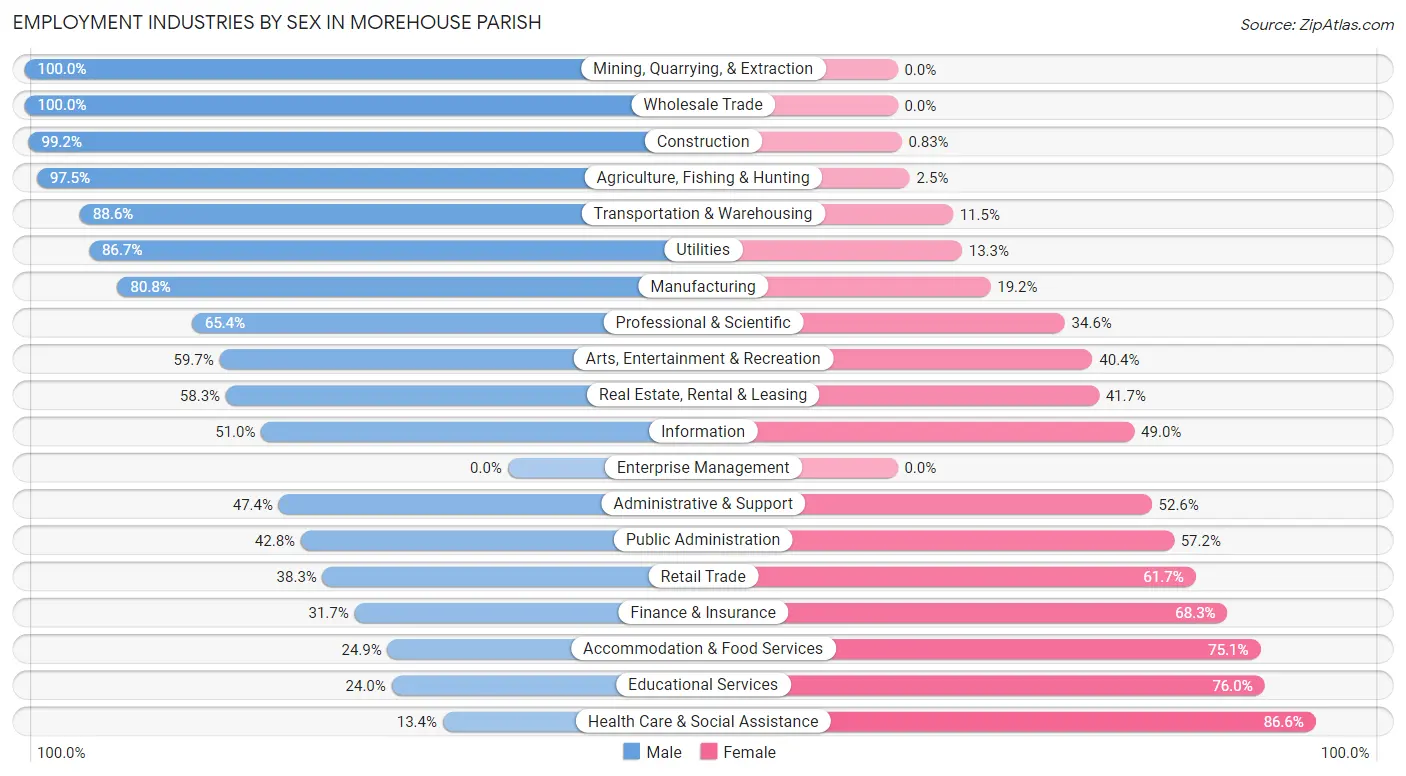
Employment Industries by Sex in Morehouse Parish
The Morehouse Parish industries that see more men than women are Mining, Quarrying, & Extraction (100.0%), Wholesale Trade (100.0%), and Construction (99.2%), whereas the industries that tend to have a higher number of women are Health Care & Social Assistance (86.6%), Educational Services (76.0%), and Accommodation & Food Services (75.1%).
| Industry | Male | Female |
| Agriculture, Fishing & Hunting | 231 (97.5%) | 6 (2.5%) |
| Mining, Quarrying, & Extraction | 37 (100.0%) | 0 (0.0%) |
| Construction | 835 (99.2%) | 7 (0.8%) |
| Manufacturing | 988 (80.8%) | 235 (19.2%) |
| Wholesale Trade | 161 (100.0%) | 0 (0.0%) |
| Retail Trade | 344 (38.3%) | 554 (61.7%) |
| Transportation & Warehousing | 294 (88.5%) | 38 (11.5%) |
| Utilities | 78 (86.7%) | 12 (13.3%) |
| Information | 51 (51.0%) | 49 (49.0%) |
| Finance & Insurance | 117 (31.7%) | 252 (68.3%) |
| Real Estate, Rental & Leasing | 70 (58.3%) | 50 (41.7%) |
| Professional & Scientific | 257 (65.4%) | 136 (34.6%) |
| Enterprise Management | 0 (0.0%) | 0 (0.0%) |
| Administrative & Support | 100 (47.4%) | 111 (52.6%) |
| Educational Services | 211 (24.0%) | 667 (76.0%) |
| Health Care & Social Assistance | 258 (13.4%) | 1,663 (86.6%) |
| Arts, Entertainment & Recreation | 68 (59.7%) | 46 (40.4%) |
| Accommodation & Food Services | 108 (24.9%) | 326 (75.1%) |
| Public Administration | 235 (42.8%) | 314 (57.2%) |
| Total | 4,729 (50.5%) | 4,642 (49.5%) |
Education in Morehouse Parish
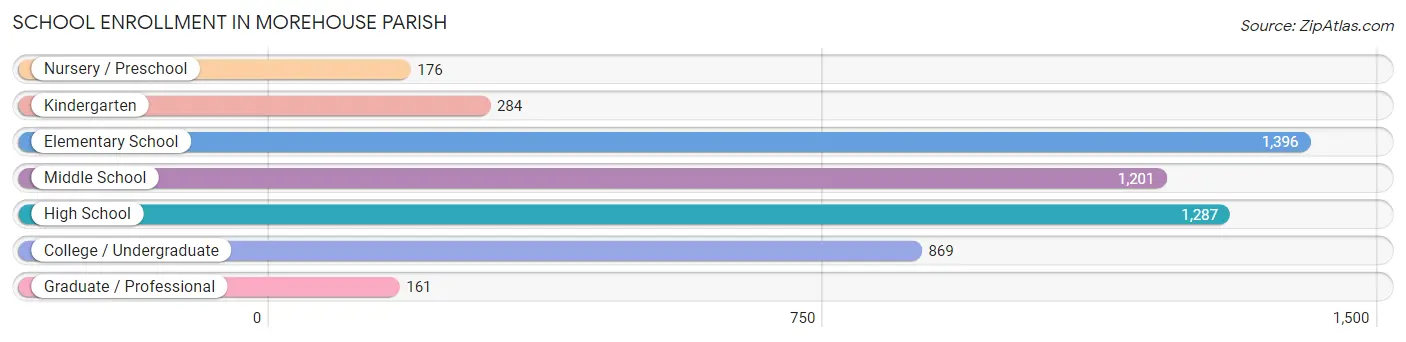
School Enrollment in Morehouse Parish
The most common levels of schooling among the 5,374 students in Morehouse Parish are elementary school (1,396 | 26.0%), high school (1,287 | 23.9%), and middle school (1,201 | 22.4%).
| School Level | # Students | % Students |
| Nursery / Preschool | 176 | 3.3% |
| Kindergarten | 284 | 5.3% |
| Elementary School | 1,396 | 26.0% |
| Middle School | 1,201 | 22.4% |
| High School | 1,287 | 23.9% |
| College / Undergraduate | 869 | 16.2% |
| Graduate / Professional | 161 | 3.0% |
| Total | 5,374 | 100.0% |
School Enrollment by Age by Funding Source in Morehouse Parish
Out of a total of 5,374 students who are enrolled in schools in Morehouse Parish, 731 (13.6%) attend a private institution, while the remaining 4,643 (86.4%) are enrolled in public schools. The age group of 3 to 4 year olds has the highest likelihood of being enrolled in private schools, with 54 (41.5% in the age bracket) enrolled. Conversely, the age group of 25 to 34 year olds has the lowest likelihood of being enrolled in a private school, with 204 (95.3% in the age bracket) attending a public institution.
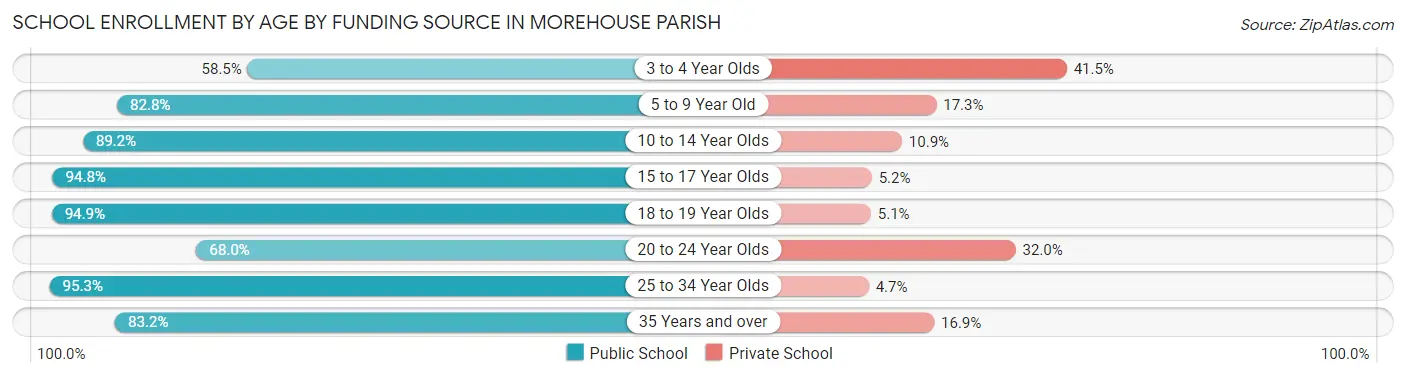
| Age Bracket | Public School | Private School |
| 3 to 4 Year Olds | 76 (58.5%) | 54 (41.5%) |
| 5 to 9 Year Old | 1,300 (82.8%) | 271 (17.2%) |
| 10 to 14 Year Olds | 1,241 (89.1%) | 151 (10.8%) |
| 15 to 17 Year Olds | 925 (94.8%) | 51 (5.2%) |
| 18 to 19 Year Olds | 394 (94.9%) | 21 (5.1%) |
| 20 to 24 Year Olds | 274 (68.0%) | 129 (32.0%) |
| 25 to 34 Year Olds | 204 (95.3%) | 10 (4.7%) |
| 35 Years and over | 227 (83.2%) | 46 (16.9%) |
| Total | 4,643 (86.4%) | 731 (13.6%) |
Educational Attainment by Field of Study in Morehouse Parish
Education (439 | 19.3%), arts & humanities (396 | 17.4%), science & technology (326 | 14.3%), business (322 | 14.1%), and liberal arts & history (182 | 8.0%) are the most common fields of study among 2,281 individuals in Morehouse Parish who have obtained a bachelor's degree or higher.
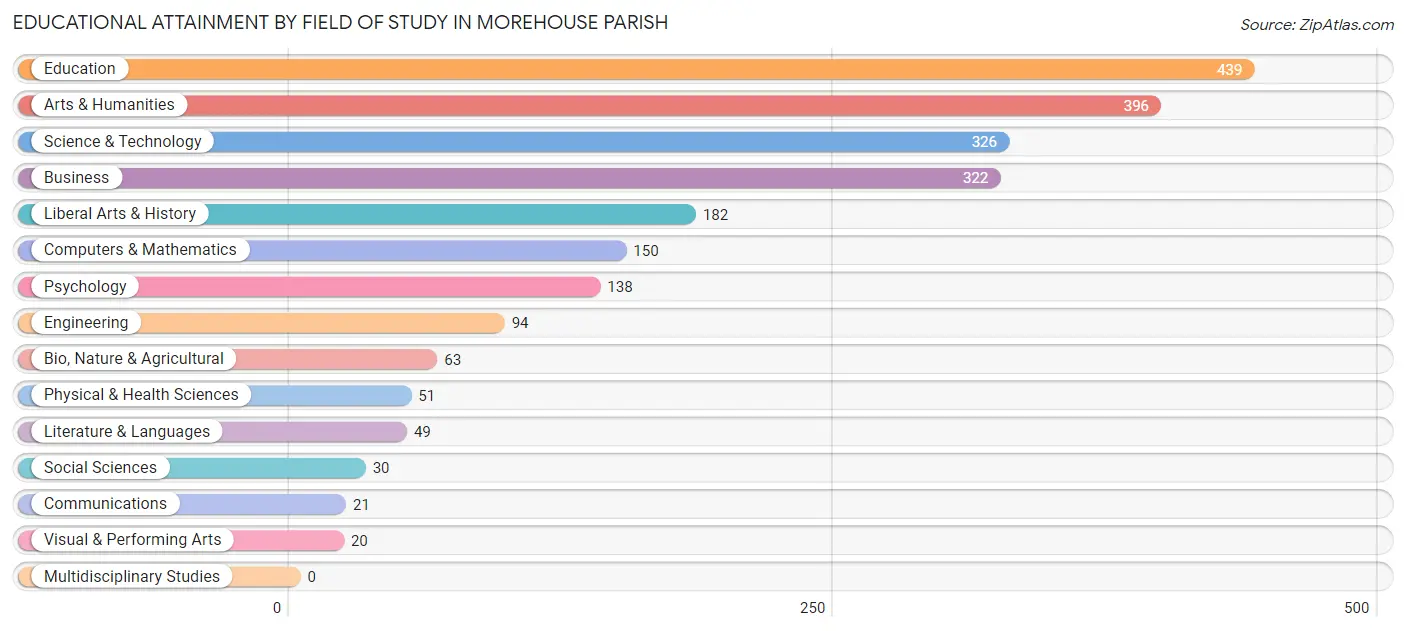
| Field of Study | # Graduates | % Graduates |
| Computers & Mathematics | 150 | 6.6% |
| Bio, Nature & Agricultural | 63 | 2.8% |
| Physical & Health Sciences | 51 | 2.2% |
| Psychology | 138 | 6.0% |
| Social Sciences | 30 | 1.3% |
| Engineering | 94 | 4.1% |
| Multidisciplinary Studies | 0 | 0.0% |
| Science & Technology | 326 | 14.3% |
| Business | 322 | 14.1% |
| Education | 439 | 19.3% |
| Literature & Languages | 49 | 2.1% |
| Liberal Arts & History | 182 | 8.0% |
| Visual & Performing Arts | 20 | 0.9% |
| Communications | 21 | 0.9% |
| Arts & Humanities | 396 | 17.4% |
| Total | 2,281 | 100.0% |
Transportation & Commute in Morehouse Parish
Vehicle Availability by Sex in Morehouse Parish
The most prevalent vehicle ownership categories in Morehouse Parish are males with 2 vehicles (1,617, accounting for 35.2%) and females with 2 vehicles (1,554, making up 35.1%).
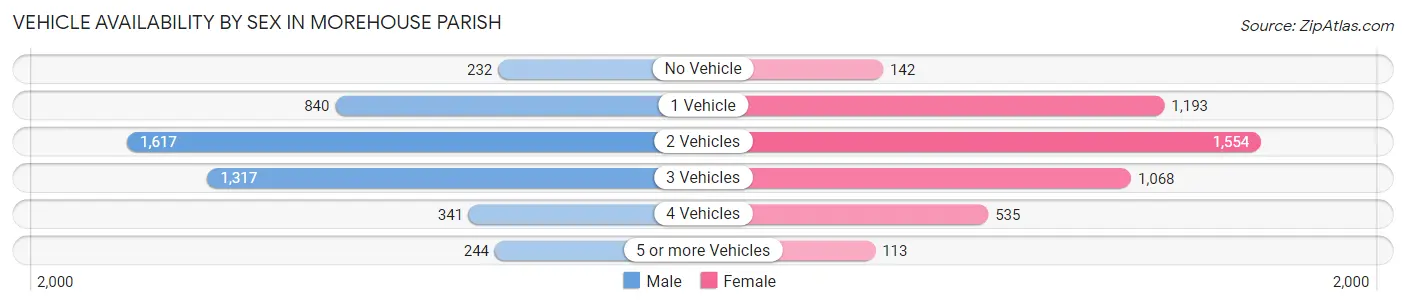
| Vehicles Available | Male | Female |
| No Vehicle | 232 (5.1%) | 142 (3.1%) |
| 1 Vehicle | 840 (18.3%) | 1,193 (25.9%) |
| 2 Vehicles | 1,617 (35.2%) | 1,554 (33.8%) |
| 3 Vehicles | 1,317 (28.7%) | 1,068 (23.2%) |
| 4 Vehicles | 341 (7.4%) | 535 (11.6%) |
| 5 or more Vehicles | 244 (5.3%) | 113 (2.5%) |
| Total | 4,591 (100.0%) | 4,605 (100.0%) |
Commute Time in Morehouse Parish
The most frequently occuring commute durations in Morehouse Parish are 10 to 14 minutes (1,494 commuters, 16.7%), 15 to 19 minutes (1,445 commuters, 16.1%), and 5 to 9 minutes (1,204 commuters, 13.4%).
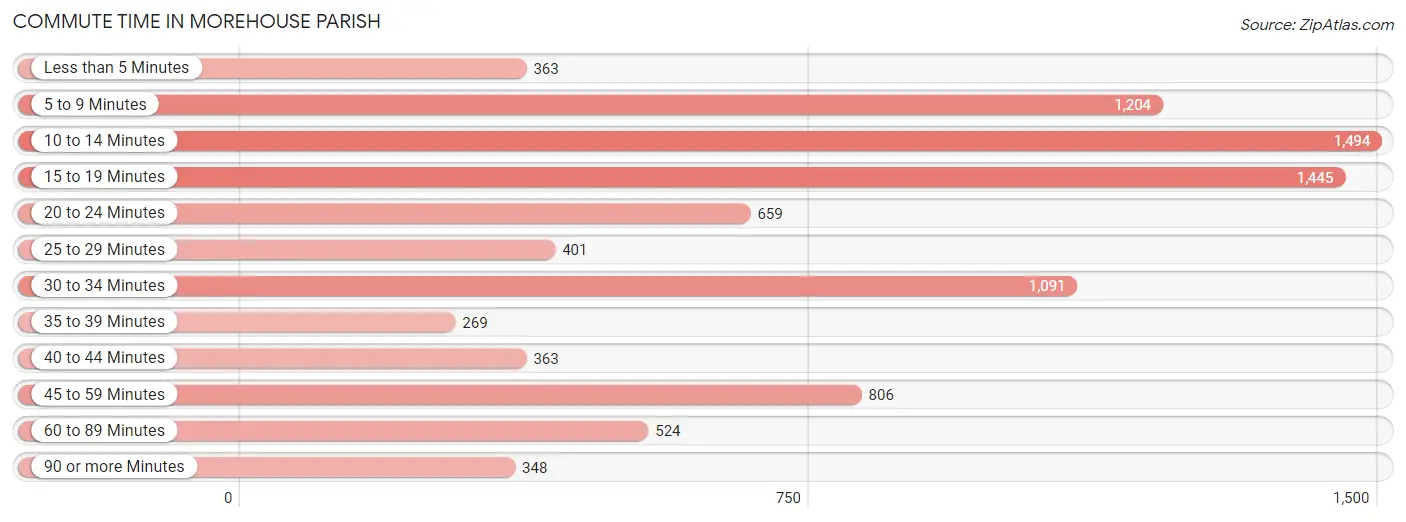
| Commute Time | # Commuters | % Commuters |
| Less than 5 Minutes | 363 | 4.1% |
| 5 to 9 Minutes | 1,204 | 13.4% |
| 10 to 14 Minutes | 1,494 | 16.7% |
| 15 to 19 Minutes | 1,445 | 16.1% |
| 20 to 24 Minutes | 659 | 7.3% |
| 25 to 29 Minutes | 401 | 4.5% |
| 30 to 34 Minutes | 1,091 | 12.2% |
| 35 to 39 Minutes | 269 | 3.0% |
| 40 to 44 Minutes | 363 | 4.1% |
| 45 to 59 Minutes | 806 | 9.0% |
| 60 to 89 Minutes | 524 | 5.8% |
| 90 or more Minutes | 348 | 3.9% |
Commute Time by Sex in Morehouse Parish
The most common commute times in Morehouse Parish are 15 to 19 minutes (665 commuters, 14.7%) for males and 10 to 14 minutes (831 commuters, 18.8%) for females.
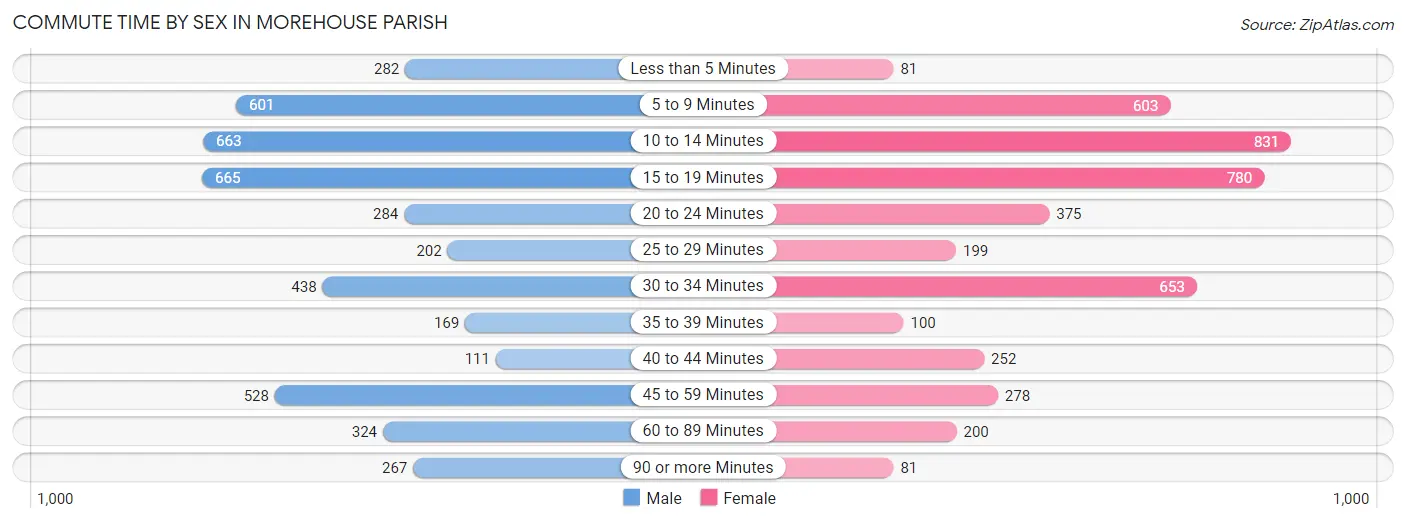
| Commute Time | Male | Female |
| Less than 5 Minutes | 282 (6.2%) | 81 (1.8%) |
| 5 to 9 Minutes | 601 (13.3%) | 603 (13.6%) |
| 10 to 14 Minutes | 663 (14.6%) | 831 (18.8%) |
| 15 to 19 Minutes | 665 (14.7%) | 780 (17.6%) |
| 20 to 24 Minutes | 284 (6.3%) | 375 (8.5%) |
| 25 to 29 Minutes | 202 (4.5%) | 199 (4.5%) |
| 30 to 34 Minutes | 438 (9.7%) | 653 (14.7%) |
| 35 to 39 Minutes | 169 (3.7%) | 100 (2.3%) |
| 40 to 44 Minutes | 111 (2.5%) | 252 (5.7%) |
| 45 to 59 Minutes | 528 (11.7%) | 278 (6.3%) |
| 60 to 89 Minutes | 324 (7.1%) | 200 (4.5%) |
| 90 or more Minutes | 267 (5.9%) | 81 (1.8%) |
Time of Departure to Work by Sex in Morehouse Parish
The most frequent times of departure to work in Morehouse Parish are 6:00 AM to 6:29 AM (1,132, 25.0%) for males and 7:00 AM to 7:29 AM (1,179, 26.6%) for females.
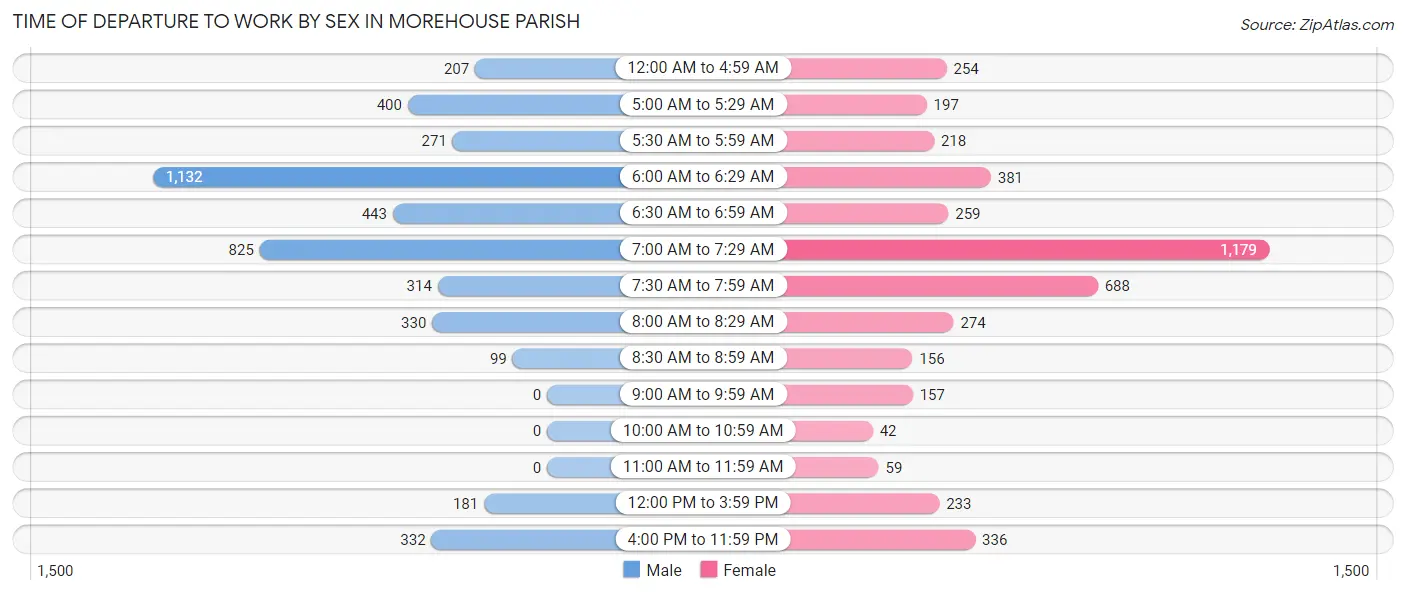
| Time of Departure | Male | Female |
| 12:00 AM to 4:59 AM | 207 (4.6%) | 254 (5.7%) |
| 5:00 AM to 5:29 AM | 400 (8.8%) | 197 (4.4%) |
| 5:30 AM to 5:59 AM | 271 (6.0%) | 218 (4.9%) |
| 6:00 AM to 6:29 AM | 1,132 (25.0%) | 381 (8.6%) |
| 6:30 AM to 6:59 AM | 443 (9.8%) | 259 (5.8%) |
| 7:00 AM to 7:29 AM | 825 (18.2%) | 1,179 (26.6%) |
| 7:30 AM to 7:59 AM | 314 (6.9%) | 688 (15.5%) |
| 8:00 AM to 8:29 AM | 330 (7.3%) | 274 (6.2%) |
| 8:30 AM to 8:59 AM | 99 (2.2%) | 156 (3.5%) |
| 9:00 AM to 9:59 AM | 0 (0.0%) | 157 (3.5%) |
| 10:00 AM to 10:59 AM | 0 (0.0%) | 42 (0.9%) |
| 11:00 AM to 11:59 AM | 0 (0.0%) | 59 (1.3%) |
| 12:00 PM to 3:59 PM | 181 (4.0%) | 233 (5.3%) |
| 4:00 PM to 11:59 PM | 332 (7.3%) | 336 (7.6%) |
| Total | 4,534 (100.0%) | 4,433 (100.0%) |
Housing Occupancy in Morehouse Parish
Occupancy by Ownership in Morehouse Parish
Of the total 9,474 dwellings in Morehouse Parish, owner-occupied units account for 6,323 (66.7%), while renter-occupied units make up 3,151 (33.3%).
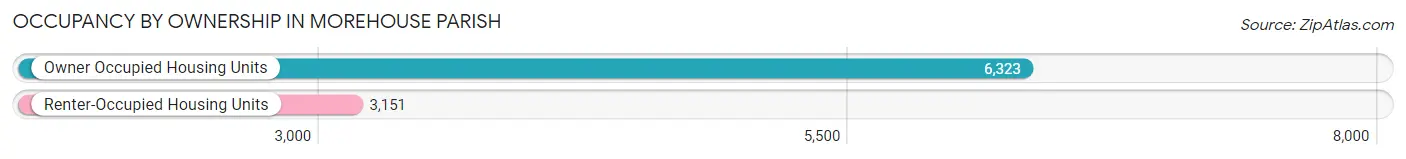
| Occupancy | # Housing Units | % Housing Units |
| Owner Occupied Housing Units | 6,323 | 66.7% |
| Renter-Occupied Housing Units | 3,151 | 33.3% |
| Total Occupied Housing Units | 9,474 | 100.0% |
Occupancy by Household Size in Morehouse Parish
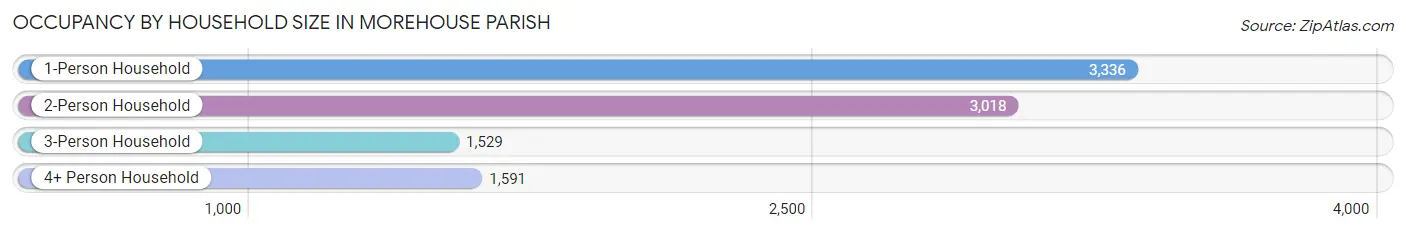
| Household Size | # Housing Units | % Housing Units |
| 1-Person Household | 3,336 | 35.2% |
| 2-Person Household | 3,018 | 31.9% |
| 3-Person Household | 1,529 | 16.1% |
| 4+ Person Household | 1,591 | 16.8% |
| Total Housing Units | 9,474 | 100.0% |
Occupancy by Ownership by Household Size in Morehouse Parish
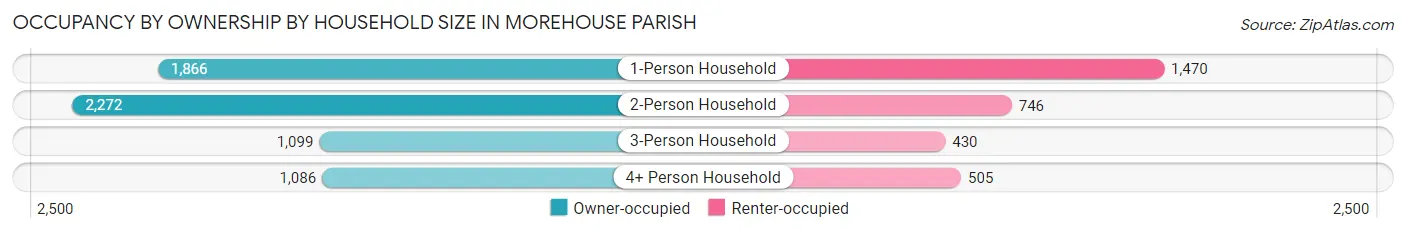
| Household Size | Owner-occupied | Renter-occupied |
| 1-Person Household | 1,866 (55.9%) | 1,470 (44.1%) |
| 2-Person Household | 2,272 (75.3%) | 746 (24.7%) |
| 3-Person Household | 1,099 (71.9%) | 430 (28.1%) |
| 4+ Person Household | 1,086 (68.3%) | 505 (31.7%) |
| Total Housing Units | 6,323 (66.7%) | 3,151 (33.3%) |
Occupancy by Educational Attainment in Morehouse Parish
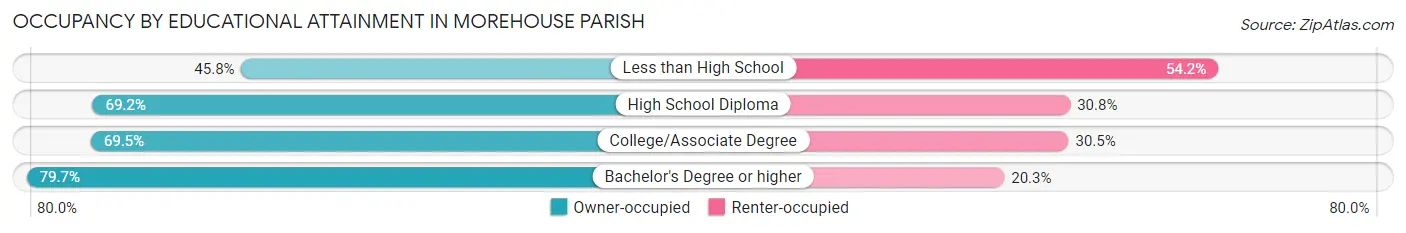
| Household Size | Owner-occupied | Renter-occupied |
| Less than High School | 731 (45.8%) | 866 (54.2%) |
| High School Diploma | 2,519 (69.2%) | 1,120 (30.8%) |
| College/Associate Degree | 2,069 (69.5%) | 909 (30.5%) |
| Bachelor's Degree or higher | 1,004 (79.7%) | 256 (20.3%) |
Occupancy by Age of Householder in Morehouse Parish
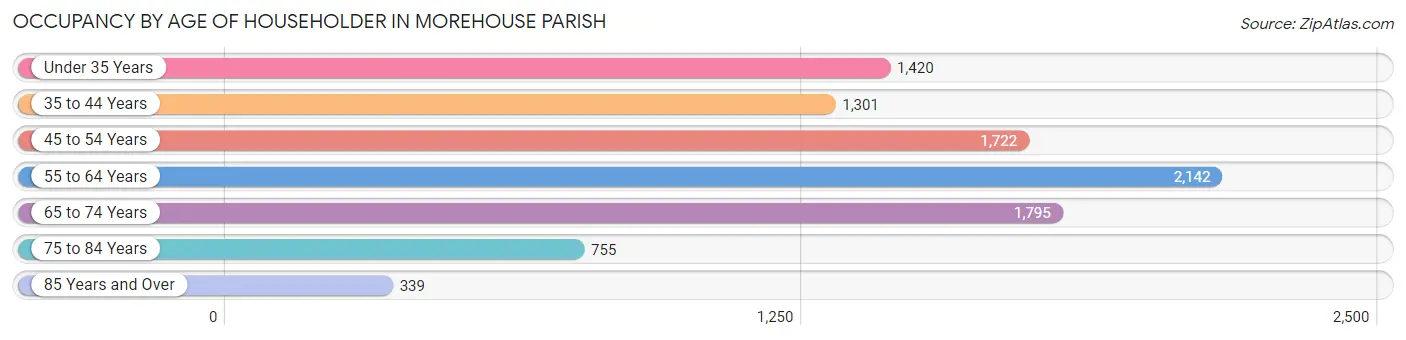
| Age Bracket | # Households | % Households |
| Under 35 Years | 1,420 | 15.0% |
| 35 to 44 Years | 1,301 | 13.7% |
| 45 to 54 Years | 1,722 | 18.2% |
| 55 to 64 Years | 2,142 | 22.6% |
| 65 to 74 Years | 1,795 | 19.0% |
| 75 to 84 Years | 755 | 8.0% |
| 85 Years and Over | 339 | 3.6% |
| Total | 9,474 | 100.0% |
Housing Finances in Morehouse Parish
Median Income by Occupancy in Morehouse Parish
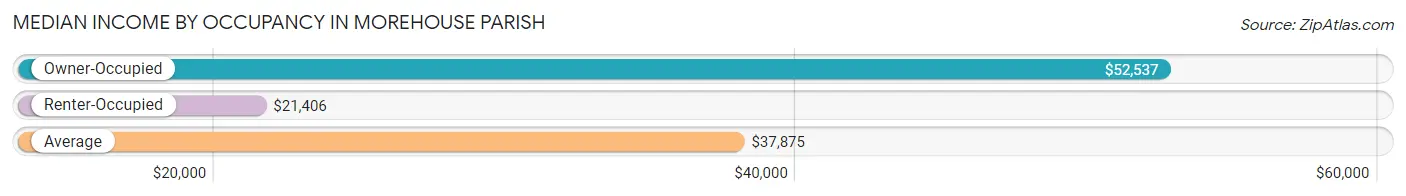
| Occupancy Type | # Households | Median Income |
| Owner-Occupied | 6,323 (66.7%) | $52,537 |
| Renter-Occupied | 3,151 (33.3%) | $21,406 |
| Average | 9,474 (100.0%) | $37,875 |
Occupancy by Householder Income Bracket in Morehouse Parish
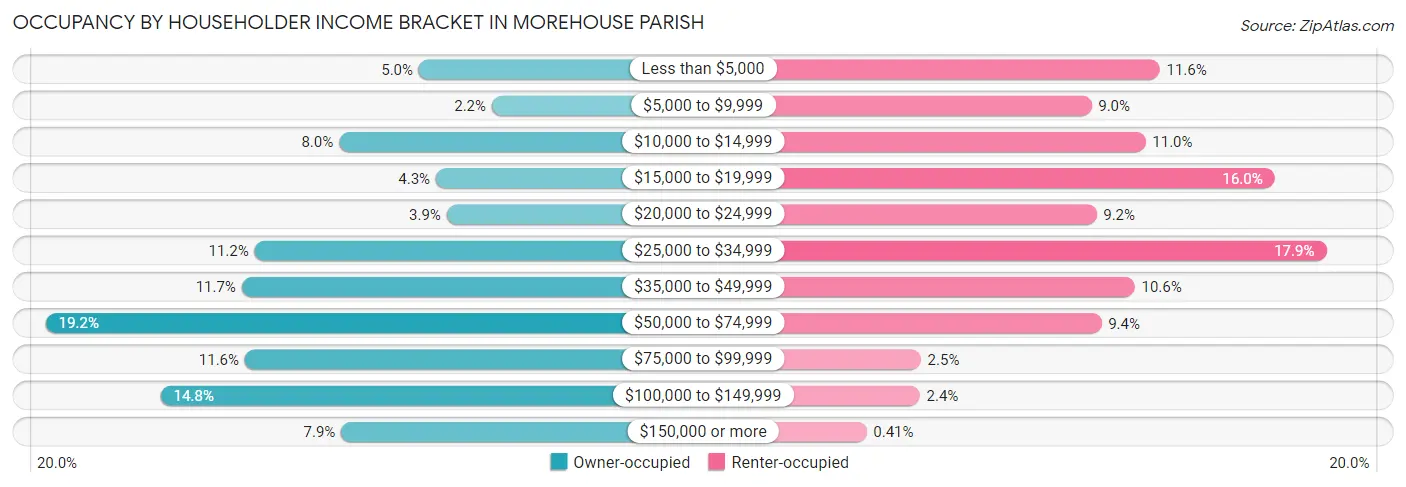
| Income Bracket | Owner-occupied | Renter-occupied |
| Less than $5,000 | 315 (5.0%) | 365 (11.6%) |
| $5,000 to $9,999 | 139 (2.2%) | 283 (9.0%) |
| $10,000 to $14,999 | 507 (8.0%) | 348 (11.0%) |
| $15,000 to $19,999 | 274 (4.3%) | 503 (16.0%) |
| $20,000 to $24,999 | 248 (3.9%) | 289 (9.2%) |
| $25,000 to $34,999 | 711 (11.2%) | 565 (17.9%) |
| $35,000 to $49,999 | 742 (11.7%) | 335 (10.6%) |
| $50,000 to $74,999 | 1,214 (19.2%) | 295 (9.4%) |
| $75,000 to $99,999 | 734 (11.6%) | 78 (2.5%) |
| $100,000 to $149,999 | 937 (14.8%) | 77 (2.4%) |
| $150,000 or more | 502 (7.9%) | 13 (0.4%) |
| Total | 6,323 (100.0%) | 3,151 (100.0%) |
Monthly Housing Cost Tiers in Morehouse Parish
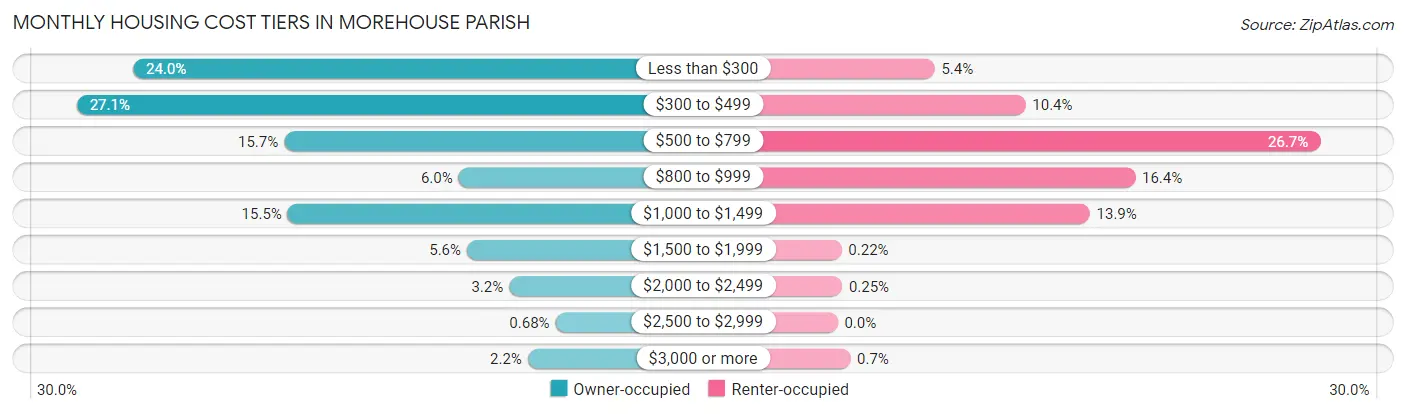
| Monthly Cost | Owner-occupied | Renter-occupied |
| Less than $300 | 1,518 (24.0%) | 169 (5.4%) |
| $300 to $499 | 1,715 (27.1%) | 327 (10.4%) |
| $500 to $799 | 991 (15.7%) | 840 (26.7%) |
| $800 to $999 | 381 (6.0%) | 518 (16.4%) |
| $1,000 to $1,499 | 978 (15.5%) | 439 (13.9%) |
| $1,500 to $1,999 | 352 (5.6%) | 7 (0.2%) |
| $2,000 to $2,499 | 205 (3.2%) | 8 (0.3%) |
| $2,500 to $2,999 | 43 (0.7%) | 0 (0.0%) |
| $3,000 or more | 140 (2.2%) | 22 (0.7%) |
| Total | 6,323 (100.0%) | 3,151 (100.0%) |
Physical Housing Characteristics in Morehouse Parish
Housing Structures in Morehouse Parish
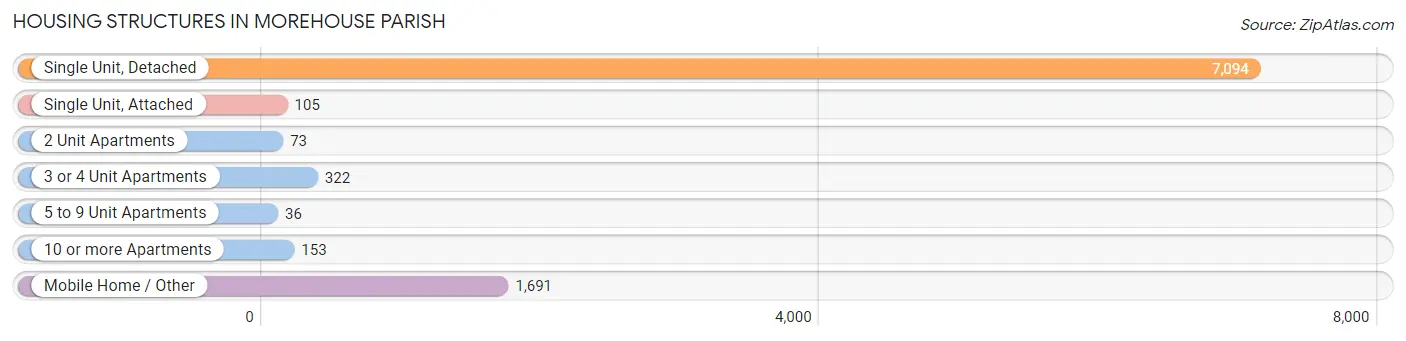
| Structure Type | # Housing Units | % Housing Units |
| Single Unit, Detached | 7,094 | 74.9% |
| Single Unit, Attached | 105 | 1.1% |
| 2 Unit Apartments | 73 | 0.8% |
| 3 or 4 Unit Apartments | 322 | 3.4% |
| 5 to 9 Unit Apartments | 36 | 0.4% |
| 10 or more Apartments | 153 | 1.6% |
| Mobile Home / Other | 1,691 | 17.8% |
| Total | 9,474 | 100.0% |
Housing Structures by Occupancy in Morehouse Parish
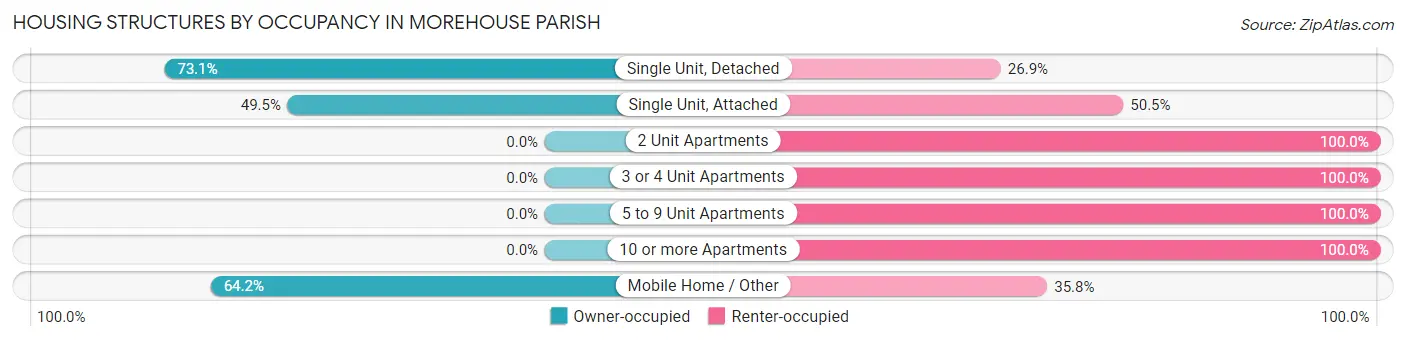
| Structure Type | Owner-occupied | Renter-occupied |
| Single Unit, Detached | 5,186 (73.1%) | 1,908 (26.9%) |
| Single Unit, Attached | 52 (49.5%) | 53 (50.5%) |
| 2 Unit Apartments | 0 (0.0%) | 73 (100.0%) |
| 3 or 4 Unit Apartments | 0 (0.0%) | 322 (100.0%) |
| 5 to 9 Unit Apartments | 0 (0.0%) | 36 (100.0%) |
| 10 or more Apartments | 0 (0.0%) | 153 (100.0%) |
| Mobile Home / Other | 1,085 (64.2%) | 606 (35.8%) |
| Total | 6,323 (66.7%) | 3,151 (33.3%) |
Housing Structures by Number of Rooms in Morehouse Parish
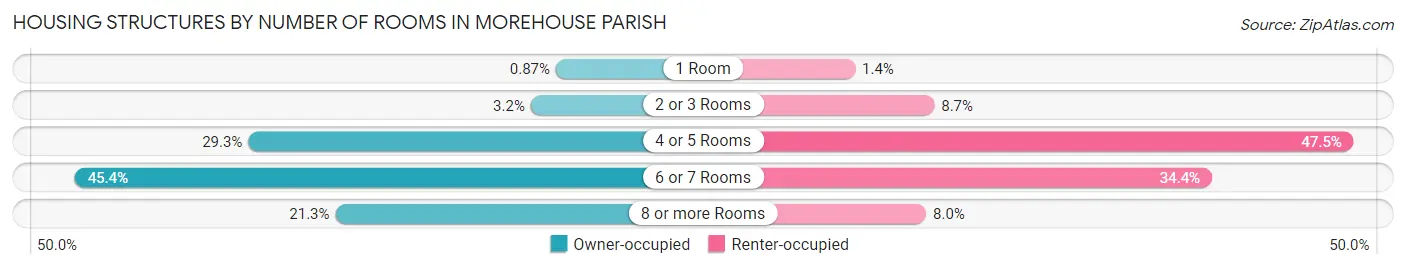
| Number of Rooms | Owner-occupied | Renter-occupied |
| 1 Room | 55 (0.9%) | 44 (1.4%) |
| 2 or 3 Rooms | 202 (3.2%) | 275 (8.7%) |
| 4 or 5 Rooms | 1,854 (29.3%) | 1,497 (47.5%) |
| 6 or 7 Rooms | 2,868 (45.4%) | 1,084 (34.4%) |
| 8 or more Rooms | 1,344 (21.3%) | 251 (8.0%) |
| Total | 6,323 (100.0%) | 3,151 (100.0%) |
Housing Structure by Heating Type in Morehouse Parish
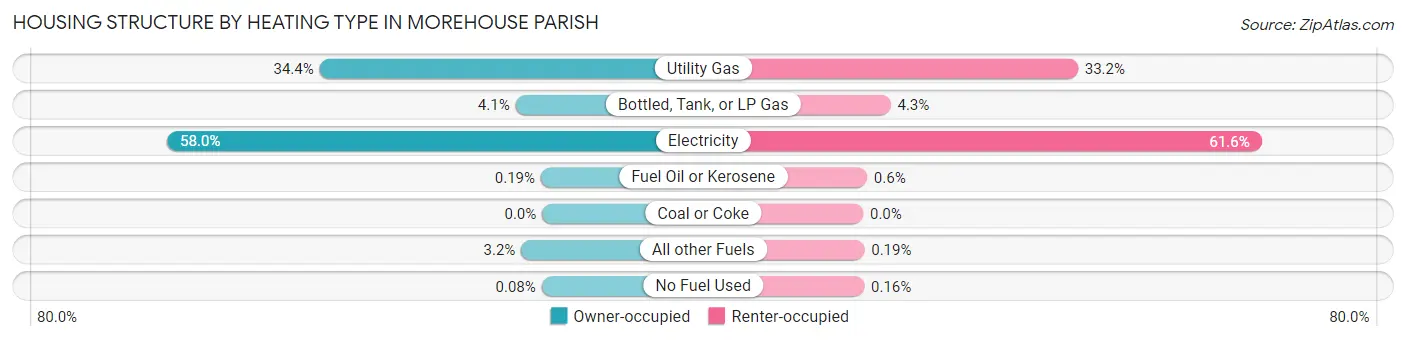
| Heating Type | Owner-occupied | Renter-occupied |
| Utility Gas | 2,176 (34.4%) | 1,046 (33.2%) |
| Bottled, Tank, or LP Gas | 260 (4.1%) | 134 (4.3%) |
| Electricity | 3,666 (58.0%) | 1,941 (61.6%) |
| Fuel Oil or Kerosene | 12 (0.2%) | 19 (0.6%) |
| Coal or Coke | 0 (0.0%) | 0 (0.0%) |
| All other Fuels | 204 (3.2%) | 6 (0.2%) |
| No Fuel Used | 5 (0.1%) | 5 (0.2%) |
| Total | 6,323 (100.0%) | 3,151 (100.0%) |
Household Vehicle Usage in Morehouse Parish
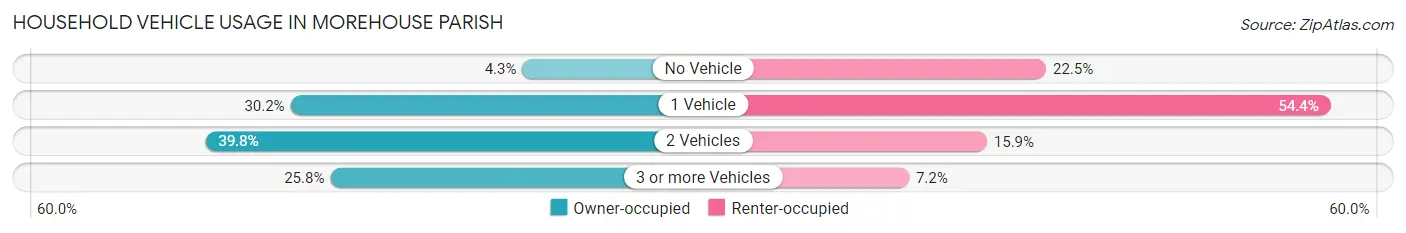
| Vehicles per Household | Owner-occupied | Renter-occupied |
| No Vehicle | 269 (4.3%) | 710 (22.5%) |
| 1 Vehicle | 1,911 (30.2%) | 1,714 (54.4%) |
| 2 Vehicles | 2,514 (39.8%) | 501 (15.9%) |
| 3 or more Vehicles | 1,629 (25.8%) | 226 (7.2%) |
| Total | 6,323 (100.0%) | 3,151 (100.0%) |
Real Estate & Mortgages in Morehouse Parish
Real Estate and Mortgage Overview in Morehouse Parish
| Characteristic | Without Mortgage | With Mortgage |
| Housing Units | 3,854 | 2,469 |
| Median Property Value | $81,000 | $147,200 |
| Median Household Income | $39,514 | $344 |
| Monthly Housing Costs | $334 | $94 |
| Real Estate Taxes | $299 | $393 |
Property Value by Mortgage Status in Morehouse Parish
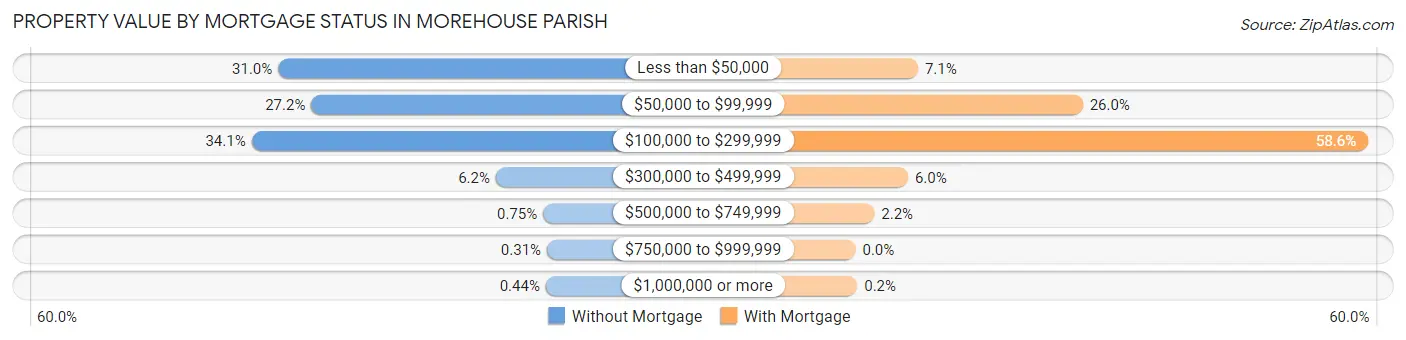
| Property Value | Without Mortgage | With Mortgage |
| Less than $50,000 | 1,196 (31.0%) | 176 (7.1%) |
| $50,000 to $99,999 | 1,050 (27.2%) | 641 (26.0%) |
| $100,000 to $299,999 | 1,313 (34.1%) | 1,446 (58.6%) |
| $300,000 to $499,999 | 237 (6.1%) | 148 (6.0%) |
| $500,000 to $749,999 | 29 (0.7%) | 53 (2.1%) |
| $750,000 to $999,999 | 12 (0.3%) | 0 (0.0%) |
| $1,000,000 or more | 17 (0.4%) | 5 (0.2%) |
| Total | 3,854 (100.0%) | 2,469 (100.0%) |
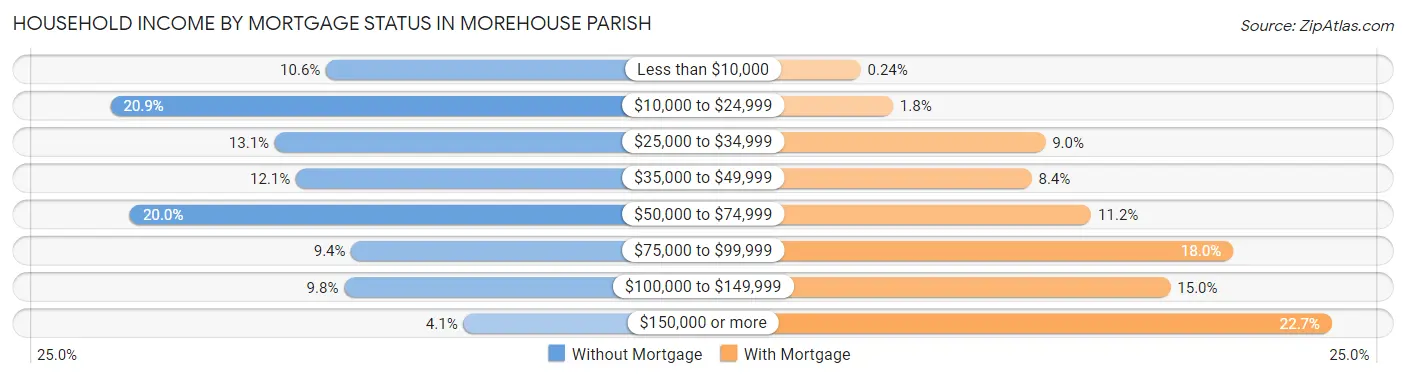
Household Income by Mortgage Status in Morehouse Parish
| Household Income | Without Mortgage | With Mortgage |
| Less than $10,000 | 410 (10.6%) | 6 (0.2%) |
| $10,000 to $24,999 | 806 (20.9%) | 44 (1.8%) |
| $25,000 to $34,999 | 504 (13.1%) | 223 (9.0%) |
| $35,000 to $49,999 | 465 (12.1%) | 207 (8.4%) |
| $50,000 to $74,999 | 770 (20.0%) | 277 (11.2%) |
| $75,000 to $99,999 | 364 (9.4%) | 444 (18.0%) |
| $100,000 to $149,999 | 377 (9.8%) | 370 (15.0%) |
| $150,000 or more | 158 (4.1%) | 560 (22.7%) |
| Total | 3,854 (100.0%) | 2,469 (100.0%) |
Property Value to Household Income Ratio in Morehouse Parish
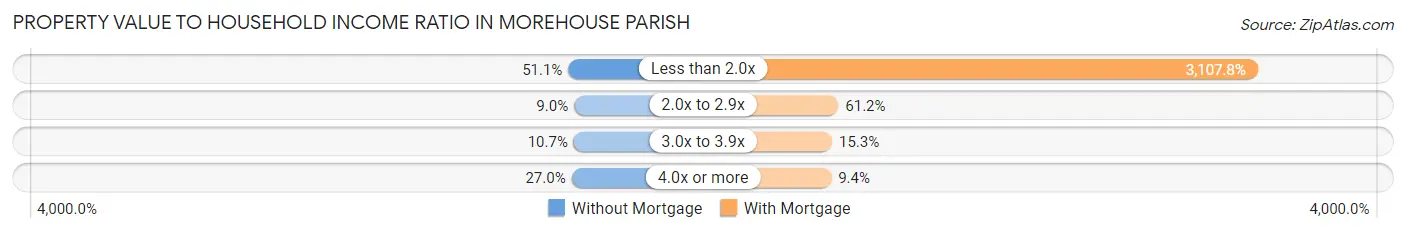
| Value-to-Income Ratio | Without Mortgage | With Mortgage |
| Less than 2.0x | 1,968 (51.1%) | 76,732 (3,107.8%) |
| 2.0x to 2.9x | 347 (9.0%) | 1,510 (61.2%) |
| 3.0x to 3.9x | 412 (10.7%) | 377 (15.3%) |
| 4.0x or more | 1,040 (27.0%) | 232 (9.4%) |
| Total | 3,854 (100.0%) | 2,469 (100.0%) |
Real Estate Taxes by Mortgage Status in Morehouse Parish
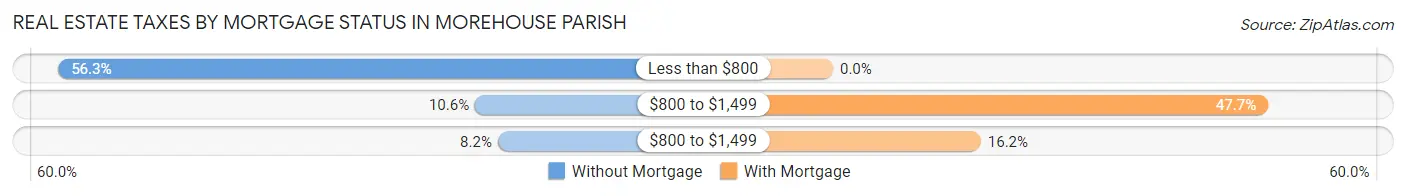
| Property Taxes | Without Mortgage | With Mortgage |
| Less than $800 | 2,170 (56.3%) | 0 (0.0%) |
| $800 to $1,499 | 410 (10.6%) | 1,177 (47.7%) |
| $800 to $1,499 | 314 (8.2%) | 400 (16.2%) |
| Total | 3,854 (100.0%) | 2,469 (100.0%) |
Health & Disability in Morehouse Parish
Health Insurance Coverage by Age in Morehouse Parish
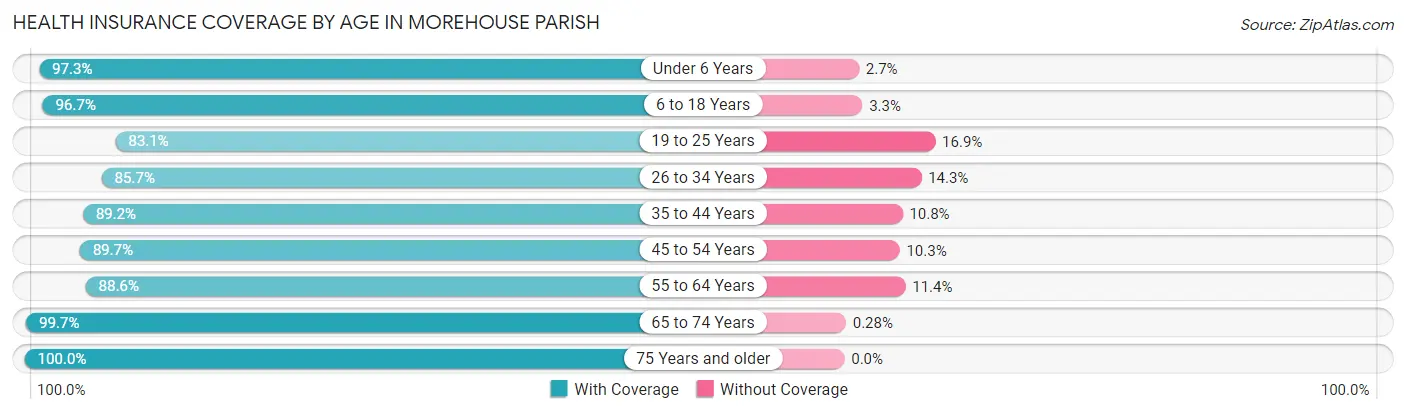
| Age Bracket | With Coverage | Without Coverage |
| Under 6 Years | 1,759 (97.3%) | 49 (2.7%) |
| 6 to 18 Years | 4,254 (96.7%) | 147 (3.3%) |
| 19 to 25 Years | 1,599 (83.1%) | 326 (16.9%) |
| 26 to 34 Years | 2,300 (85.7%) | 385 (14.3%) |
| 35 to 44 Years | 2,632 (89.2%) | 320 (10.8%) |
| 45 to 54 Years | 2,597 (89.7%) | 298 (10.3%) |
| 55 to 64 Years | 3,022 (88.6%) | 388 (11.4%) |
| 65 to 74 Years | 2,838 (99.7%) | 8 (0.3%) |
| 75 Years and older | 1,746 (100.0%) | 0 (0.0%) |
| Total | 22,747 (92.2%) | 1,921 (7.8%) |
Health Insurance Coverage by Citizenship Status in Morehouse Parish
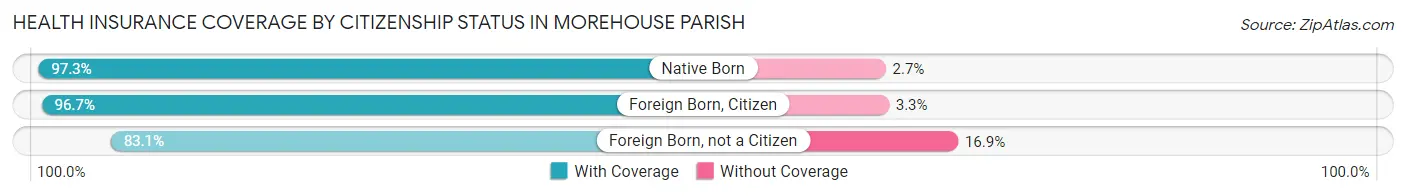
| Citizenship Status | With Coverage | Without Coverage |
| Native Born | 1,759 (97.3%) | 49 (2.7%) |
| Foreign Born, Citizen | 4,254 (96.7%) | 147 (3.3%) |
| Foreign Born, not a Citizen | 1,599 (83.1%) | 326 (16.9%) |
Health Insurance Coverage by Household Income in Morehouse Parish
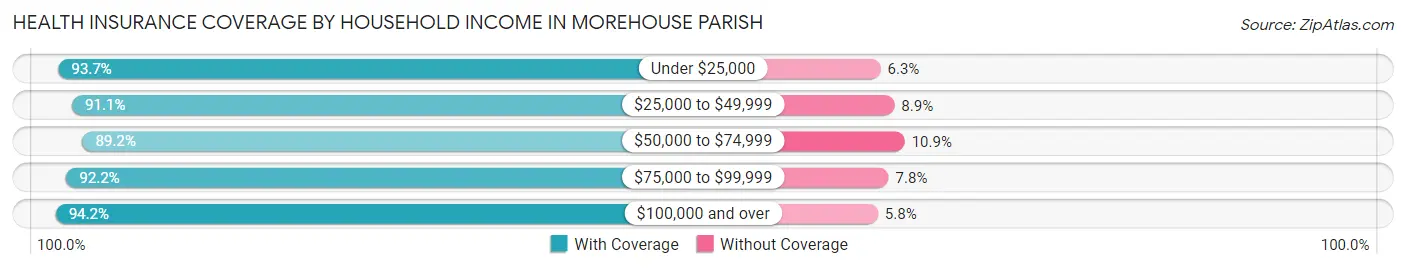
| Household Income | With Coverage | Without Coverage |
| Under $25,000 | 6,072 (93.7%) | 411 (6.3%) |
| $25,000 to $49,999 | 5,780 (91.1%) | 566 (8.9%) |
| $50,000 to $74,999 | 3,590 (89.1%) | 437 (10.8%) |
| $75,000 to $99,999 | 2,505 (92.2%) | 213 (7.8%) |
| $100,000 and over | 4,746 (94.2%) | 294 (5.8%) |
Public vs Private Health Insurance Coverage by Age in Morehouse Parish
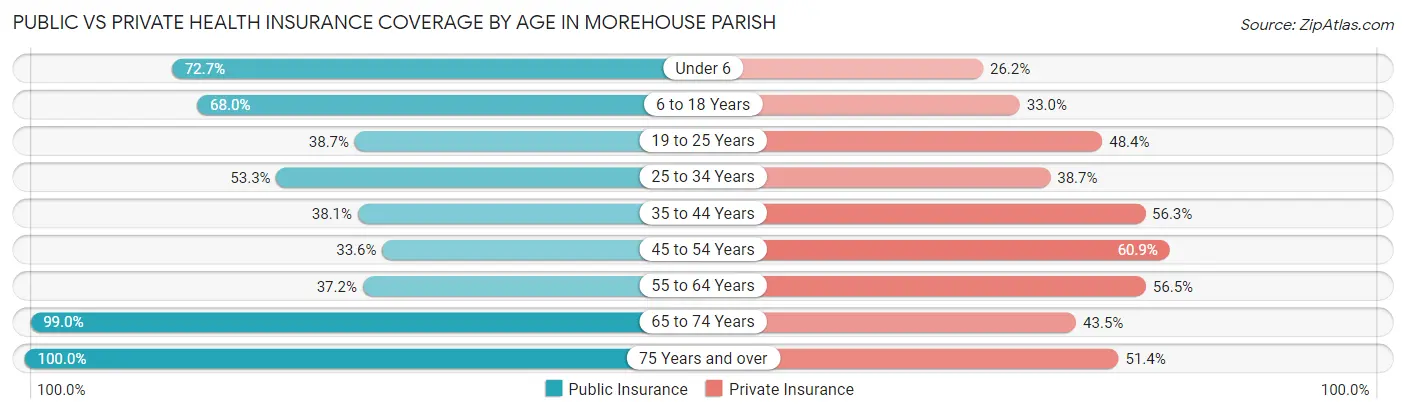
| Age Bracket | Public Insurance | Private Insurance |
| Under 6 | 1,314 (72.7%) | 474 (26.2%) |
| 6 to 18 Years | 2,991 (68.0%) | 1,454 (33.0%) |
| 19 to 25 Years | 745 (38.7%) | 931 (48.4%) |
| 25 to 34 Years | 1,430 (53.3%) | 1,039 (38.7%) |
| 35 to 44 Years | 1,126 (38.1%) | 1,662 (56.3%) |
| 45 to 54 Years | 973 (33.6%) | 1,762 (60.9%) |
| 55 to 64 Years | 1,270 (37.2%) | 1,925 (56.5%) |
| 65 to 74 Years | 2,816 (99.0%) | 1,238 (43.5%) |
| 75 Years and over | 1,746 (100.0%) | 897 (51.4%) |
| Total | 14,411 (58.4%) | 11,382 (46.1%) |
Disability Status by Sex by Age in Morehouse Parish
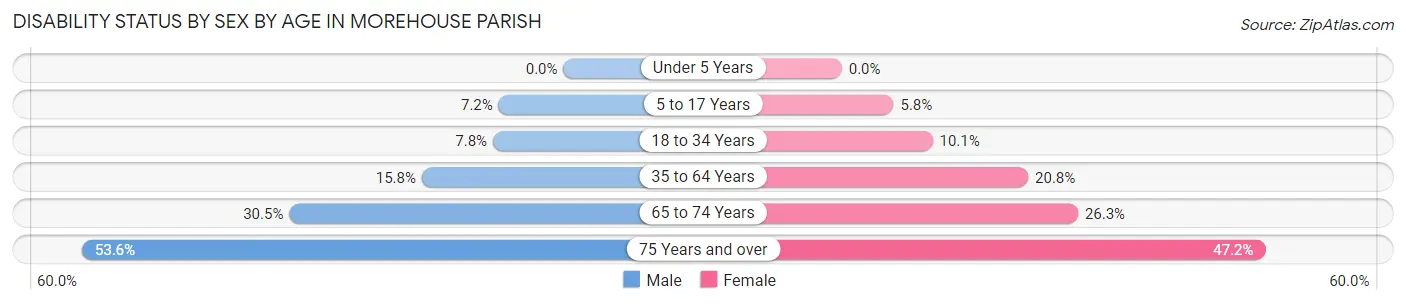
| Age Bracket | Male | Female |
| Under 5 Years | 0 (0.0%) | 0 (0.0%) |
| 5 to 17 Years | 159 (7.2%) | 121 (5.8%) |
| 18 to 34 Years | 201 (7.8%) | 239 (10.1%) |
| 35 to 64 Years | 674 (15.8%) | 1,034 (20.7%) |
| 65 to 74 Years | 400 (30.5%) | 404 (26.3%) |
| 75 Years and over | 378 (53.6%) | 491 (47.2%) |
Disability Class by Sex by Age in Morehouse Parish
Disability Class: Hearing Difficulty
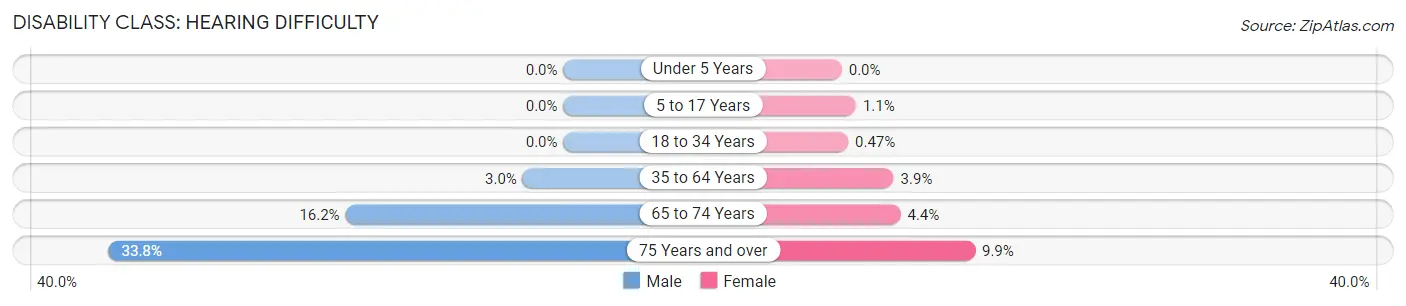
| Age Bracket | Male | Female |
| Under 5 Years | 0 (0.0%) | 0 (0.0%) |
| 5 to 17 Years | 0 (0.0%) | 22 (1.1%) |
| 18 to 34 Years | 0 (0.0%) | 11 (0.5%) |
| 35 to 64 Years | 129 (3.0%) | 192 (3.8%) |
| 65 to 74 Years | 212 (16.2%) | 67 (4.4%) |
| 75 Years and over | 238 (33.8%) | 103 (9.9%) |
Disability Class: Vision Difficulty
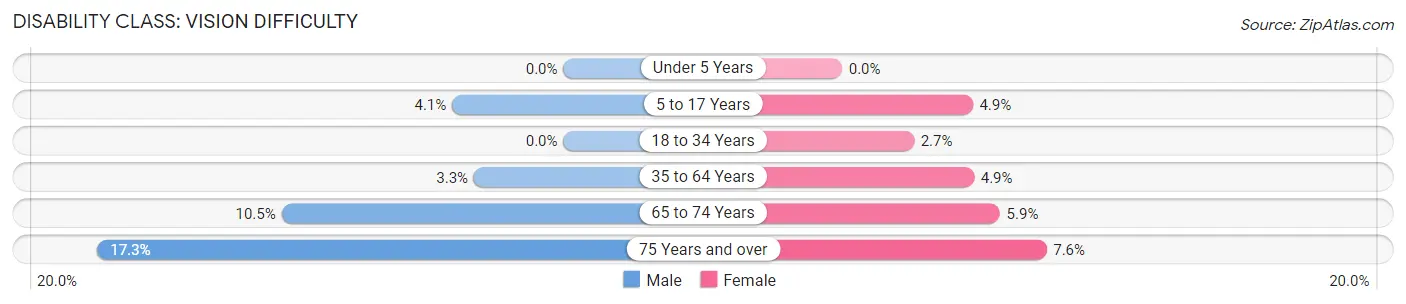
| Age Bracket | Male | Female |
| Under 5 Years | 0 (0.0%) | 0 (0.0%) |
| 5 to 17 Years | 91 (4.1%) | 102 (4.9%) |
| 18 to 34 Years | 0 (0.0%) | 63 (2.7%) |
| 35 to 64 Years | 142 (3.3%) | 244 (4.9%) |
| 65 to 74 Years | 137 (10.5%) | 90 (5.9%) |
| 75 Years and over | 122 (17.3%) | 79 (7.6%) |
Disability Class: Cognitive Difficulty
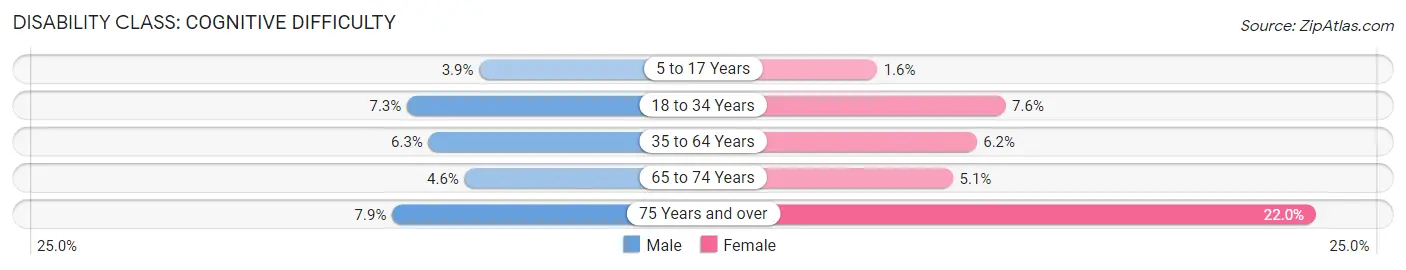
| Age Bracket | Male | Female |
| 5 to 17 Years | 86 (3.9%) | 34 (1.6%) |
| 18 to 34 Years | 186 (7.2%) | 179 (7.6%) |
| 35 to 64 Years | 267 (6.2%) | 311 (6.2%) |
| 65 to 74 Years | 60 (4.6%) | 79 (5.1%) |
| 75 Years and over | 56 (7.9%) | 229 (22.0%) |
Disability Class: Ambulatory Difficulty
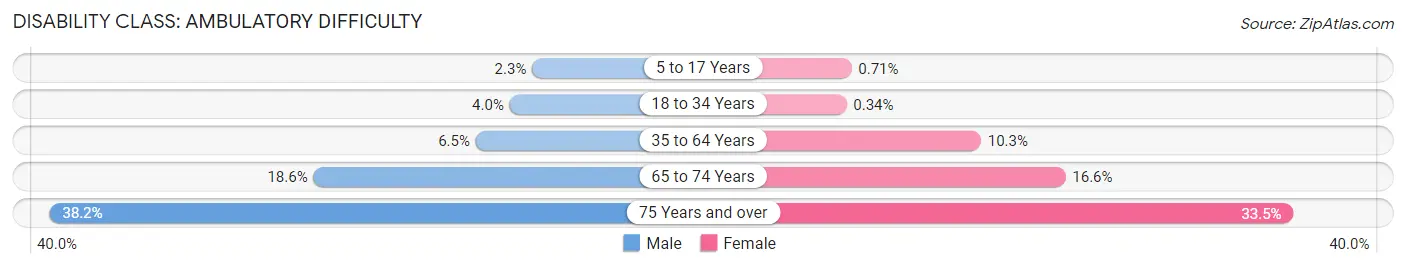
| Age Bracket | Male | Female |
| 5 to 17 Years | 51 (2.3%) | 15 (0.7%) |
| 18 to 34 Years | 102 (4.0%) | 8 (0.3%) |
| 35 to 64 Years | 278 (6.5%) | 514 (10.3%) |
| 65 to 74 Years | 243 (18.5%) | 255 (16.6%) |
| 75 Years and over | 269 (38.2%) | 349 (33.5%) |
Disability Class: Self-Care Difficulty
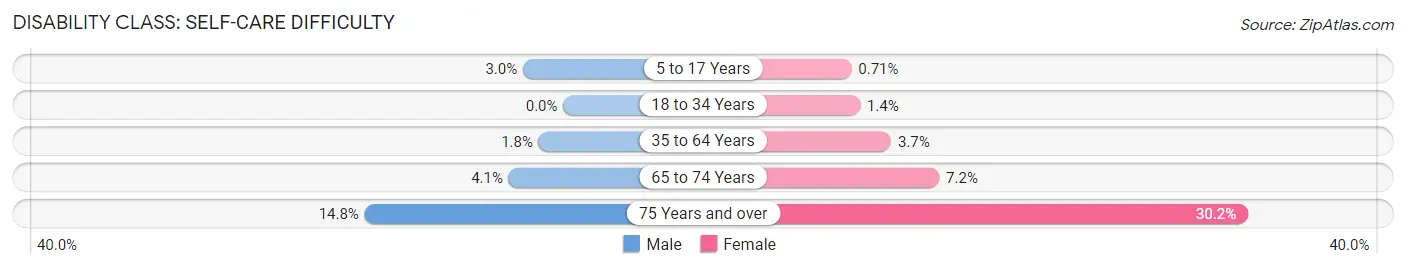
| Age Bracket | Male | Female |
| 5 to 17 Years | 66 (3.0%) | 15 (0.7%) |
| 18 to 34 Years | 0 (0.0%) | 32 (1.3%) |
| 35 to 64 Years | 78 (1.8%) | 182 (3.6%) |
| 65 to 74 Years | 53 (4.1%) | 111 (7.2%) |
| 75 Years and over | 104 (14.7%) | 314 (30.2%) |
Technology Access in Morehouse Parish
Computing Device Access in Morehouse Parish
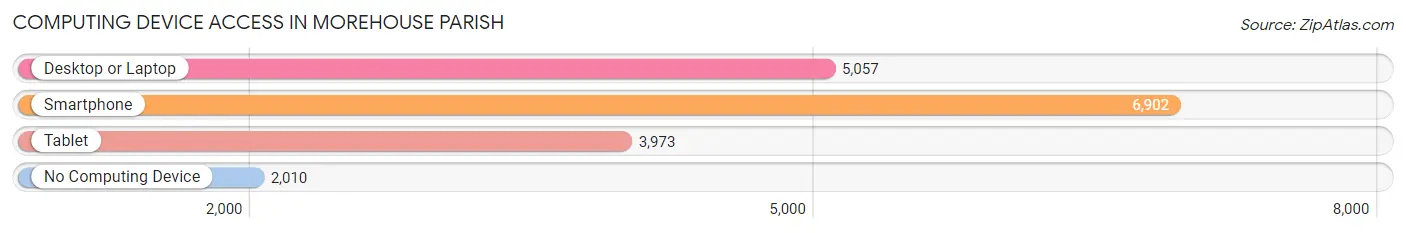
| Device Type | # Households | % Households |
| Desktop or Laptop | 5,057 | 53.4% |
| Smartphone | 6,902 | 72.9% |
| Tablet | 3,973 | 41.9% |
| No Computing Device | 2,010 | 21.2% |
| Total | 9,474 | 100.0% |
Internet Access in Morehouse Parish
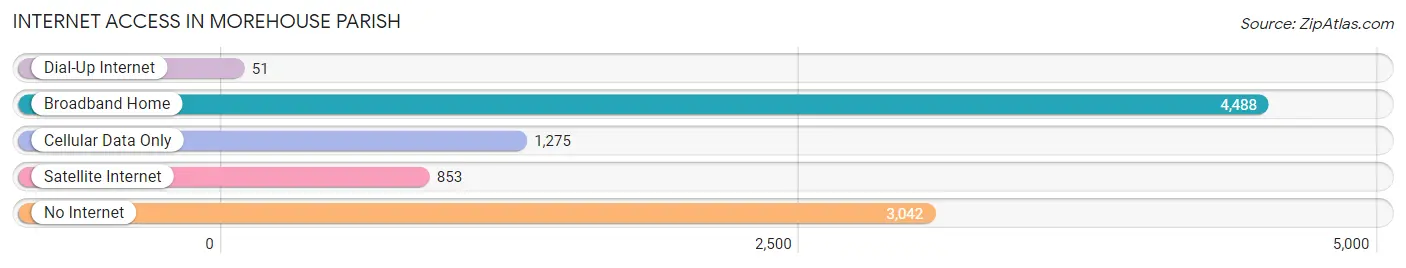
| Internet Type | # Households | % Households |
| Dial-Up Internet | 51 | 0.5% |
| Broadband Home | 4,488 | 47.4% |
| Cellular Data Only | 1,275 | 13.5% |
| Satellite Internet | 853 | 9.0% |
| No Internet | 3,042 | 32.1% |
| Total | 9,474 | 100.0% |
Morehouse Parish Summary
Introduction
Morehouse Parish is located in the northeastern part of Louisiana, and is part of the Ark-La-Tex region. It is bordered by Ouachita Parish to the north, Union Parish to the east, East Carroll Parish to the south, and Richland Parish to the west. The parish seat is Bastrop, and the largest city is Bastrop. The parish has a total area of 590 square miles, and a population of 29,979 as of the 2010 census.
History
Morehouse Parish was created in 1844 from parts of Ouachita and Union Parishes. It was named for Alexander Morehouse, a former governor of Louisiana. The parish was originally settled by Native Americans, and later by French and Spanish settlers. The parish was an important center of cotton production during the antebellum period, and the town of Bastrop was an important trading center.
During the Civil War, Morehouse Parish was the site of several battles, including the Battle of Monroe, which was fought in 1864. After the war, the parish was the site of several Reconstruction-era conflicts, including the Colfax Massacre in 1873.
Geography
Morehouse Parish is located in the northeastern part of Louisiana, and is part of the Ark-La-Tex region. It is bordered by Ouachita Parish to the north, Union Parish to the east, East Carroll Parish to the south, and Richland Parish to the west. The parish has a total area of 590 square miles, and a population of 29,979 as of the 2010 census.
The terrain of Morehouse Parish is mostly flat, with some rolling hills in the northern part of the parish. The parish is drained by the Ouachita River, which forms its western boundary. The parish is also home to several small lakes, including Lake Bruin and Lake St. John.
Economy
Morehouse Parish is primarily an agricultural area, with cotton, soybeans, and corn being the main crops. The parish is also home to several timber and paper mills, as well as a number of manufacturing plants. The parish is also home to several oil and gas fields, and is an important center for oil and gas production in the state.
Demographics
As of the 2010 census, Morehouse Parish had a population of 29,979. The racial makeup of the parish was 63.3% White, 34.2% African American, 0.4% Native American, 0.3% Asian, 0.2% from other races, and 1.6% from two or more races. Hispanic or Latino of any race were 1.3% of the population.
The median income for a household in the parish was $30,945, and the median income for a family was $37,945. The per capita income for the parish was $16,845. About 22.2% of families and 25.7% of the population were below the poverty line, including 36.2% of those under age 18 and 19.2% of those age 65 or over.
Conclusion
Morehouse Parish is a rural parish located in the northeastern part of Louisiana. It is bordered by Ouachita Parish to the north, Union Parish to the east, East Carroll Parish to the south, and Richland Parish to the west. The parish has a total area of 590 square miles, and a population of 29,979 as of the 2010 census. The economy of the parish is primarily agricultural, with cotton, soybeans, and corn being the main crops. The parish is also home to several timber and paper mills, as well as a number of manufacturing plants. The median income for a household in the parish was $30,945, and the median income for a family was $37,945. About 22.2% of families and 25.7% of the population were below the poverty line.
Common Questions
What is Per Capita Income in Morehouse Parish?
Per Capita income in Morehouse Parish is $22,534.
What is the Median Family Income in Morehouse Parish?
Median Family Income in Morehouse Parish is $51,925.
What is the Median Household income in Morehouse Parish?
Median Household Income in Morehouse Parish is $37,875.
What is Income or Wage Gap in Morehouse Parish?
Income or Wage Gap in Morehouse Parish is 33.0%.
Women in Morehouse Parish earn 67.0 cents for every dollar earned by a man.
What is Family Income Deficit in Morehouse Parish?
Family Income Deficit in Morehouse Parish is $10,688.
Families that are below poverty line in Morehouse Parish earn $10,688 less on average than the poverty threshold level.
What is Inequality or Gini Index in Morehouse Parish?
Inequality or Gini Index in Morehouse Parish is 0.51.
What is the Total Population of Morehouse Parish?
Total Population of Morehouse Parish is 25,438.
What is the Total Male Population of Morehouse Parish?
Total Male Population of Morehouse Parish is 12,407.
What is the Total Female Population of Morehouse Parish?
Total Female Population of Morehouse Parish is 13,031.
What is the Ratio of Males per 100 Females in Morehouse Parish?
There are 95.21 Males per 100 Females in Morehouse Parish.
What is the Ratio of Females per 100 Males in Morehouse Parish?
There are 105.03 Females per 100 Males in Morehouse Parish.
What is the Median Population Age in Morehouse Parish?
Median Population Age in Morehouse Parish is 40.0 Years.
What is the Average Family Size in Morehouse Parish
Average Family Size in Morehouse Parish is 3.5 People.
What is the Average Household Size in Morehouse Parish
Average Household Size in Morehouse Parish is 2.6 People.
How Large is the Labor Force in Morehouse Parish?
There are 10,287 People in the Labor Forcein in Morehouse Parish.
What is the Percentage of People in the Labor Force in Morehouse Parish?
50.9% of People are in the Labor Force in Morehouse Parish.
What is the Unemployment Rate in Morehouse Parish?
Unemployment Rate in Morehouse Parish is 8.8%.