Iberville Parish, LA Map & Demographics
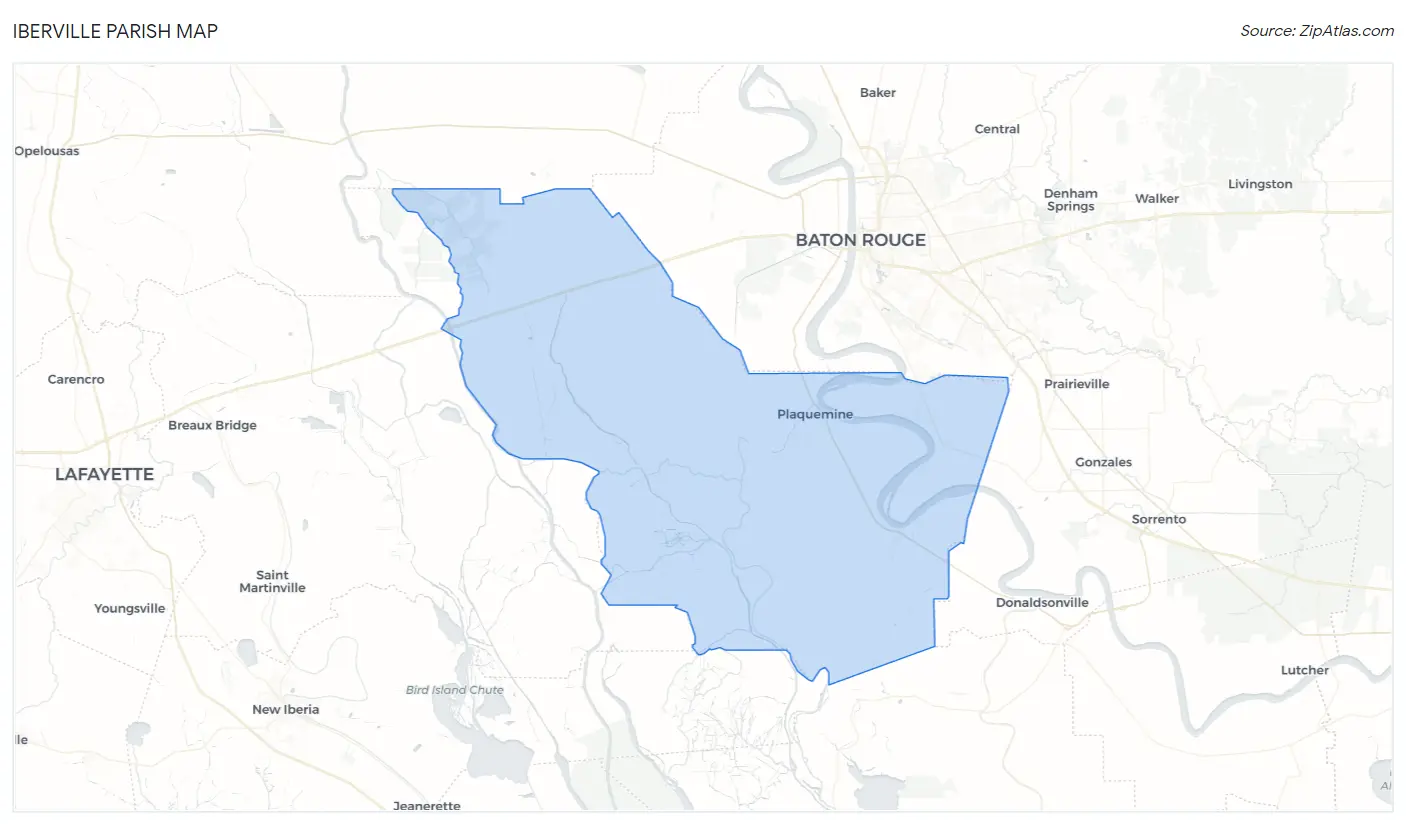
Iberville Parish Map
Iberville Parish Overview
$28,538
PER CAPITA INCOME
$69,352
AVG FAMILY INCOME
$59,410
AVG HOUSEHOLD INCOME
38.3%
WAGE / INCOME GAP [ % ]
61.7¢/ $1
WAGE / INCOME GAP [ $ ]
$13,154
FAMILY INCOME DEFICIT
0.46
INEQUALITY / GINI INDEX
30,210
TOTAL POPULATION
15,365
MALE POPULATION
14,845
FEMALE POPULATION
103.50
MALES / 100 FEMALES
96.62
FEMALES / 100 MALES
39.9
MEDIAN AGE
3.0
AVG FAMILY SIZE
2.5
AVG HOUSEHOLD SIZE
13,347
LABOR FORCE [ PEOPLE ]
54.0%
PERCENT IN LABOR FORCE
7.5%
UNEMPLOYMENT RATE
Iberville Parish Area Codes
Income in Iberville Parish
Income Overview in Iberville Parish
Per Capita Income in Iberville Parish is $28,538, while median incomes of families and households are $69,352 and $59,410 respectively.
| Characteristic | Number | Measure |
| Per Capita Income | 30,210 | $28,538 |
| Median Family Income | 7,492 | $69,352 |
| Mean Family Income | 7,492 | $92,560 |
| Median Household Income | 11,042 | $59,410 |
| Mean Household Income | 11,042 | $77,666 |
| Income Deficit | 7,492 | $13,154 |
| Wage / Income Gap (%) | 30,210 | 38.29% |
| Wage / Income Gap ($) | 30,210 | 61.71¢ per $1 |
| Gini / Inequality Index | 30,210 | 0.46 |
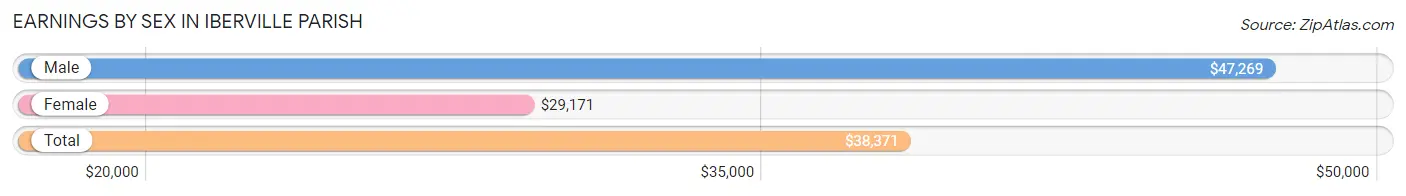
Earnings by Sex in Iberville Parish
Average Earnings in Iberville Parish are $38,371, $47,269 for men and $29,171 for women, a difference of 38.3%.
| Sex | Number | Average Earnings |
| Male | 6,953 (50.1%) | $47,269 |
| Female | 6,936 (49.9%) | $29,171 |
| Total | 13,889 (100.0%) | $38,371 |
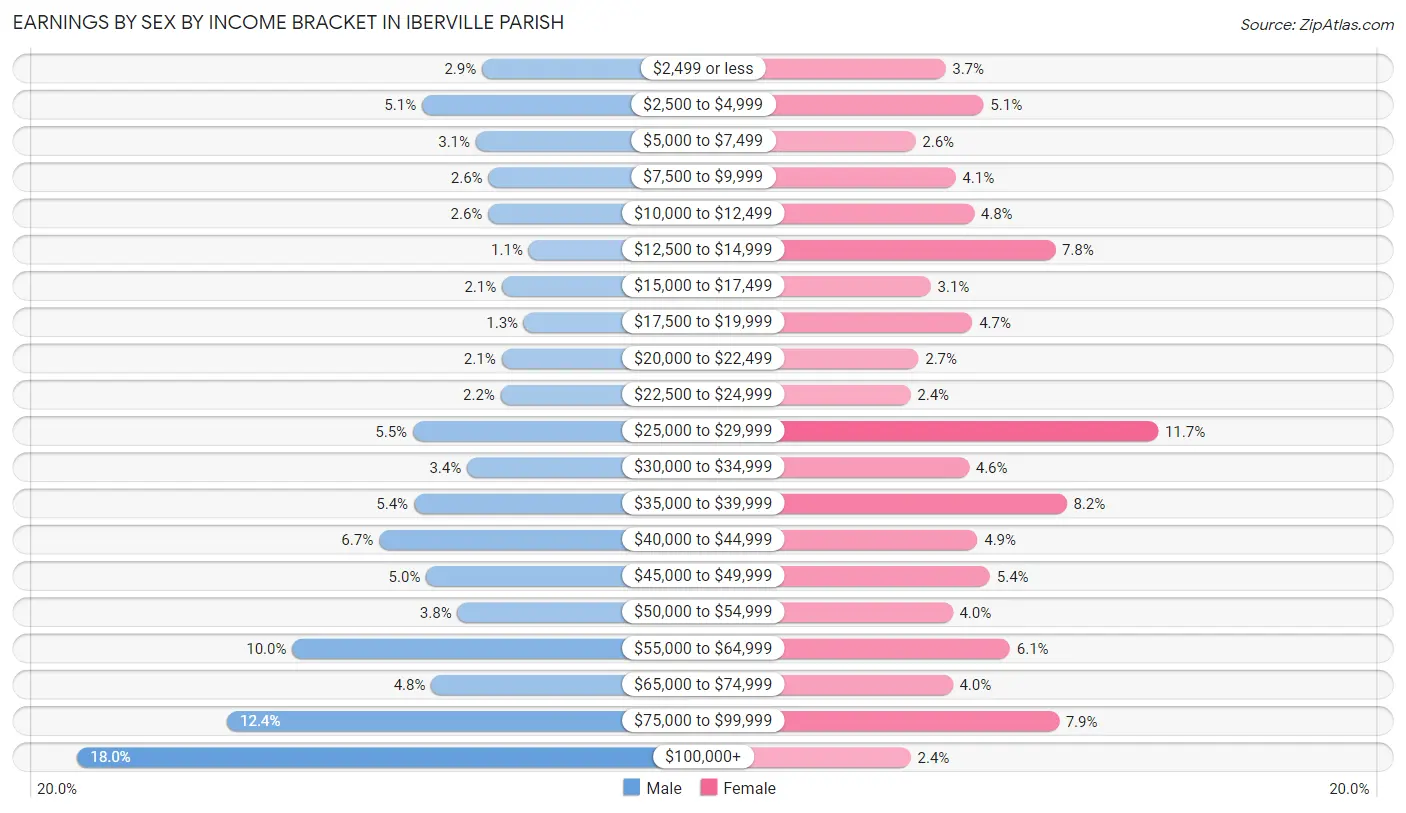
Earnings by Sex by Income Bracket in Iberville Parish
The most common earnings brackets in Iberville Parish are $100,000+ for men (1,253 | 18.0%) and $25,000 to $29,999 for women (809 | 11.7%).
| Income | Male | Female |
| $2,499 or less | 199 (2.9%) | 256 (3.7%) |
| $2,500 to $4,999 | 355 (5.1%) | 355 (5.1%) |
| $5,000 to $7,499 | 215 (3.1%) | 178 (2.6%) |
| $7,500 to $9,999 | 182 (2.6%) | 282 (4.1%) |
| $10,000 to $12,499 | 183 (2.6%) | 330 (4.8%) |
| $12,500 to $14,999 | 77 (1.1%) | 541 (7.8%) |
| $15,000 to $17,499 | 147 (2.1%) | 218 (3.1%) |
| $17,500 to $19,999 | 90 (1.3%) | 326 (4.7%) |
| $20,000 to $22,499 | 148 (2.1%) | 186 (2.7%) |
| $22,500 to $24,999 | 150 (2.2%) | 165 (2.4%) |
| $25,000 to $29,999 | 379 (5.4%) | 809 (11.7%) |
| $30,000 to $34,999 | 238 (3.4%) | 317 (4.6%) |
| $35,000 to $39,999 | 376 (5.4%) | 571 (8.2%) |
| $40,000 to $44,999 | 467 (6.7%) | 339 (4.9%) |
| $45,000 to $49,999 | 344 (5.0%) | 372 (5.4%) |
| $50,000 to $54,999 | 263 (3.8%) | 275 (4.0%) |
| $55,000 to $64,999 | 693 (10.0%) | 424 (6.1%) |
| $65,000 to $74,999 | 331 (4.8%) | 275 (4.0%) |
| $75,000 to $99,999 | 863 (12.4%) | 551 (7.9%) |
| $100,000+ | 1,253 (18.0%) | 166 (2.4%) |
| Total | 6,953 (100.0%) | 6,936 (100.0%) |
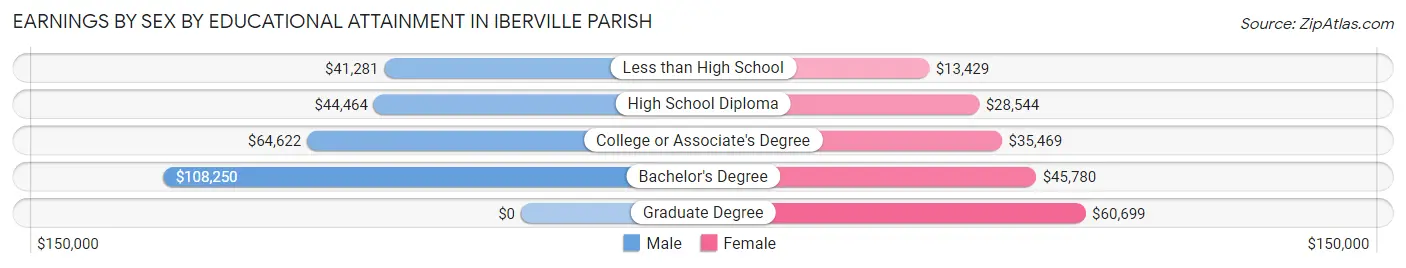
Earnings by Sex by Educational Attainment in Iberville Parish
Average earnings in Iberville Parish are $54,684 for men and $32,975 for women, a difference of 39.7%. Men with an educational attainment of bachelor's degree enjoy the highest average annual earnings of $108,250, while those with less than high school education earn the least with $41,281. Women with an educational attainment of graduate degree earn the most with the average annual earnings of $60,699, while those with less than high school education have the smallest earnings of $13,429.
| Educational Attainment | Male Income | Female Income |
| Less than High School | $41,281 | $13,429 |
| High School Diploma | $44,464 | $28,544 |
| College or Associate's Degree | $64,622 | $35,469 |
| Bachelor's Degree | $108,250 | $45,780 |
| Graduate Degree | - | - |
| Total | $54,684 | $32,975 |
Family Income in Iberville Parish
Family Income Brackets in Iberville Parish
According to the Iberville Parish family income data, there are 1,401 families falling into the $50,000 to $74,999 income range, which is the most common income bracket and makes up 18.7% of all families. Conversely, the $10,000 to $14,999 income bracket is the least frequent group with only 105 families (1.4%) belonging to this category.
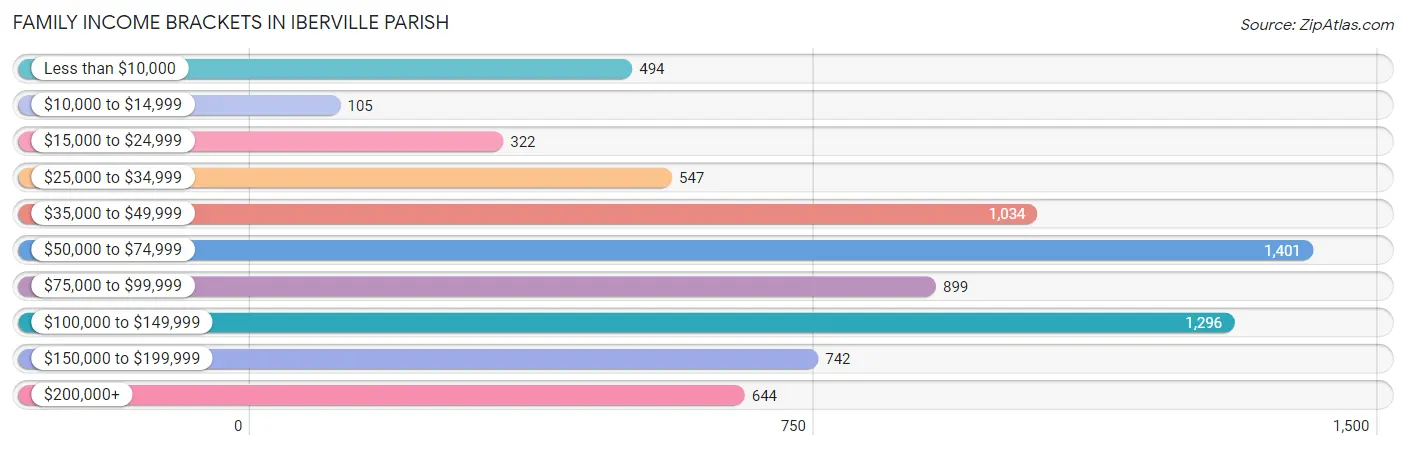
| Income Bracket | # Families | % Families |
| Less than $10,000 | 494 | 6.6% |
| $10,000 to $14,999 | 105 | 1.4% |
| $15,000 to $24,999 | 322 | 4.3% |
| $25,000 to $34,999 | 547 | 7.3% |
| $35,000 to $49,999 | 1,034 | 13.8% |
| $50,000 to $74,999 | 1,401 | 18.7% |
| $75,000 to $99,999 | 899 | 12.0% |
| $100,000 to $149,999 | 1,296 | 17.3% |
| $150,000 to $199,999 | 742 | 9.9% |
| $200,000+ | 644 | 8.6% |
Family Income by Famaliy Size in Iberville Parish
6-person families (181 | 2.4%) account for the highest median family income in Iberville Parish with $106,985 per family, while 2-person families (3,694 | 49.3%) have the highest median income of $31,512 per family member.
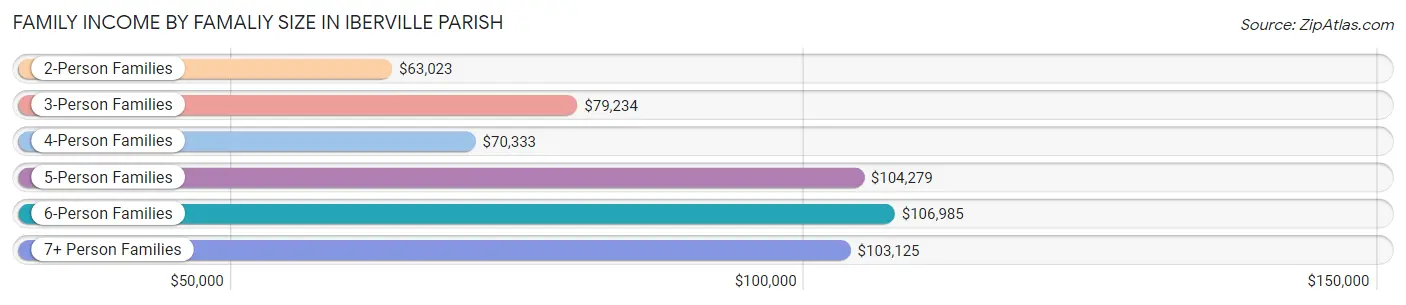
| Income Bracket | # Families | Median Income |
| 2-Person Families | 3,694 (49.3%) | $63,023 |
| 3-Person Families | 1,495 (20.0%) | $79,234 |
| 4-Person Families | 1,444 (19.3%) | $70,333 |
| 5-Person Families | 605 (8.1%) | $104,279 |
| 6-Person Families | 181 (2.4%) | $106,985 |
| 7+ Person Families | 73 (1.0%) | $103,125 |
| Total | 7,492 (100.0%) | $69,352 |
Family Income by Number of Earners in Iberville Parish
The median family income in Iberville Parish is $69,352, with families comprising 3+ earners (766) having the highest median family income of $143,507, while families with no earners (1,500) have the lowest median family income of $31,300, accounting for 10.2% and 20.0% of families, respectively.
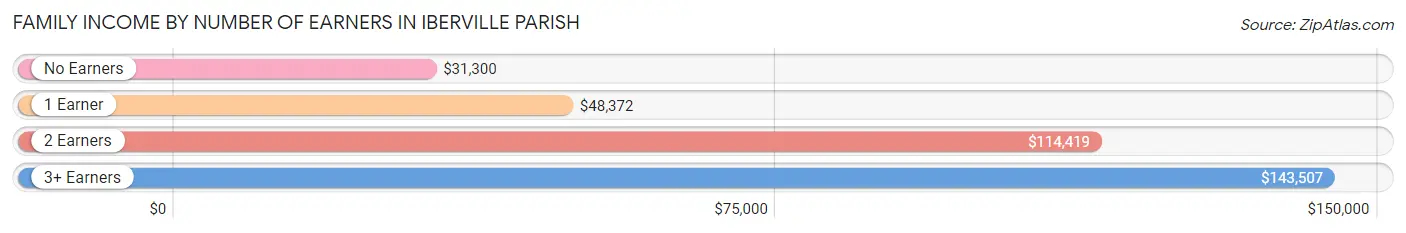
| Number of Earners | # Families | Median Income |
| No Earners | 1,500 (20.0%) | $31,300 |
| 1 Earner | 2,057 (27.5%) | $48,372 |
| 2 Earners | 3,169 (42.3%) | $114,419 |
| 3+ Earners | 766 (10.2%) | $143,507 |
| Total | 7,492 (100.0%) | $69,352 |
Household Income in Iberville Parish
Household Income Brackets in Iberville Parish
With 1,999 households falling in the category, the $50,000 to $74,999 income range is the most frequent in Iberville Parish, accounting for 18.1% of all households. In contrast, only 618 households (5.6%) fall into the $10,000 to $14,999 income bracket, making it the least populous group.
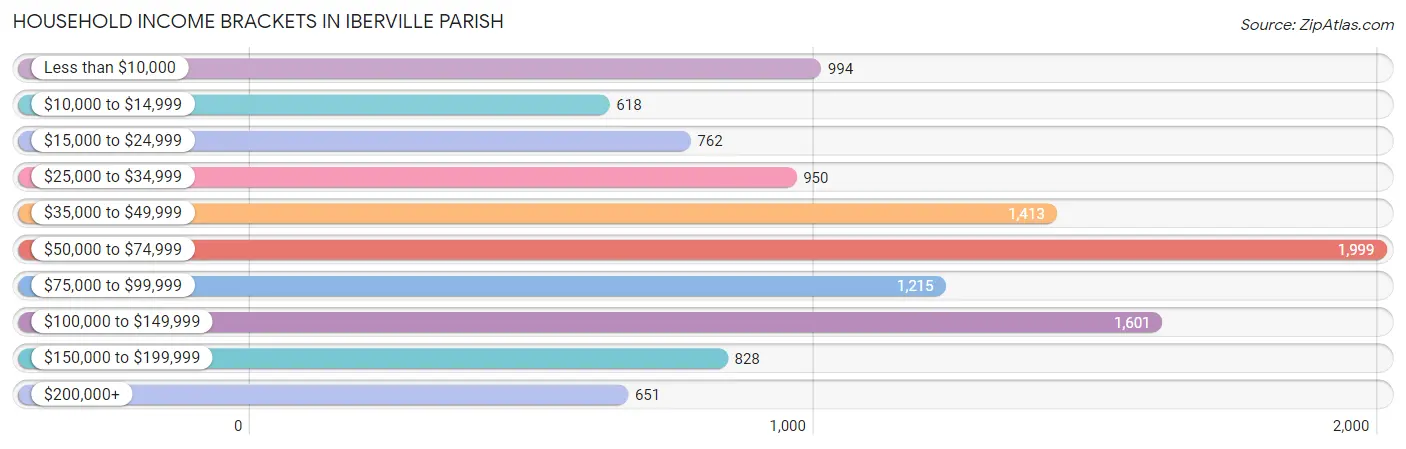
| Income Bracket | # Households | % Households |
| Less than $10,000 | 994 | 9.0% |
| $10,000 to $14,999 | 618 | 5.6% |
| $15,000 to $24,999 | 762 | 6.9% |
| $25,000 to $34,999 | 950 | 8.6% |
| $35,000 to $49,999 | 1,413 | 12.8% |
| $50,000 to $74,999 | 1,999 | 18.1% |
| $75,000 to $99,999 | 1,215 | 11.0% |
| $100,000 to $149,999 | 1,601 | 14.5% |
| $150,000 to $199,999 | 828 | 7.5% |
| $200,000+ | 651 | 5.9% |
Household Income by Householder Age in Iberville Parish
The median household income in Iberville Parish is $59,410, with the highest median household income of $69,620 found in the 45 to 64 years age bracket for the primary householder. A total of 4,434 households (40.2%) fall into this category. Meanwhile, the 15 to 24 years age bracket for the primary householder has the lowest median household income of $0, with 410 households (3.7%) in this group.
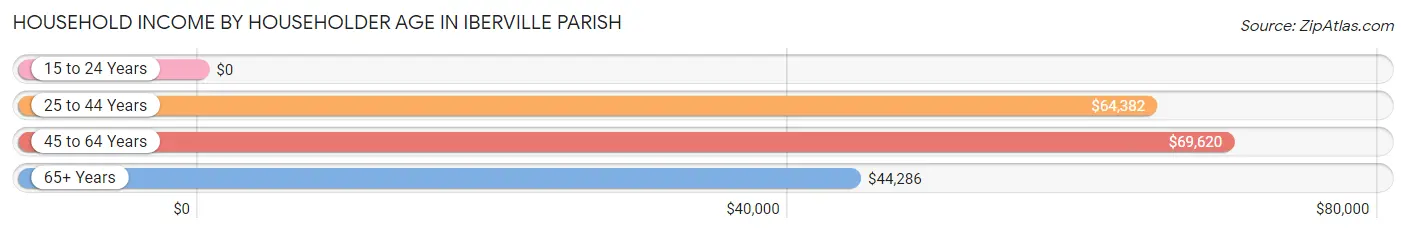
| Income Bracket | # Households | Median Income |
| 15 to 24 Years | 410 (3.7%) | $0 |
| 25 to 44 Years | 3,264 (29.6%) | $64,382 |
| 45 to 64 Years | 4,434 (40.2%) | $69,620 |
| 65+ Years | 2,934 (26.6%) | $44,286 |
| Total | 11,042 (100.0%) | $59,410 |
Poverty in Iberville Parish
Income Below Poverty by Sex and Age in Iberville Parish
With 14.8% poverty level for males and 18.7% for females among the residents of Iberville Parish, 16 and 17 year old males and 5 year old females are the most vulnerable to poverty, with 161 males (41.7%) and 8 females (80.0%) in their respective age groups living below the poverty level.
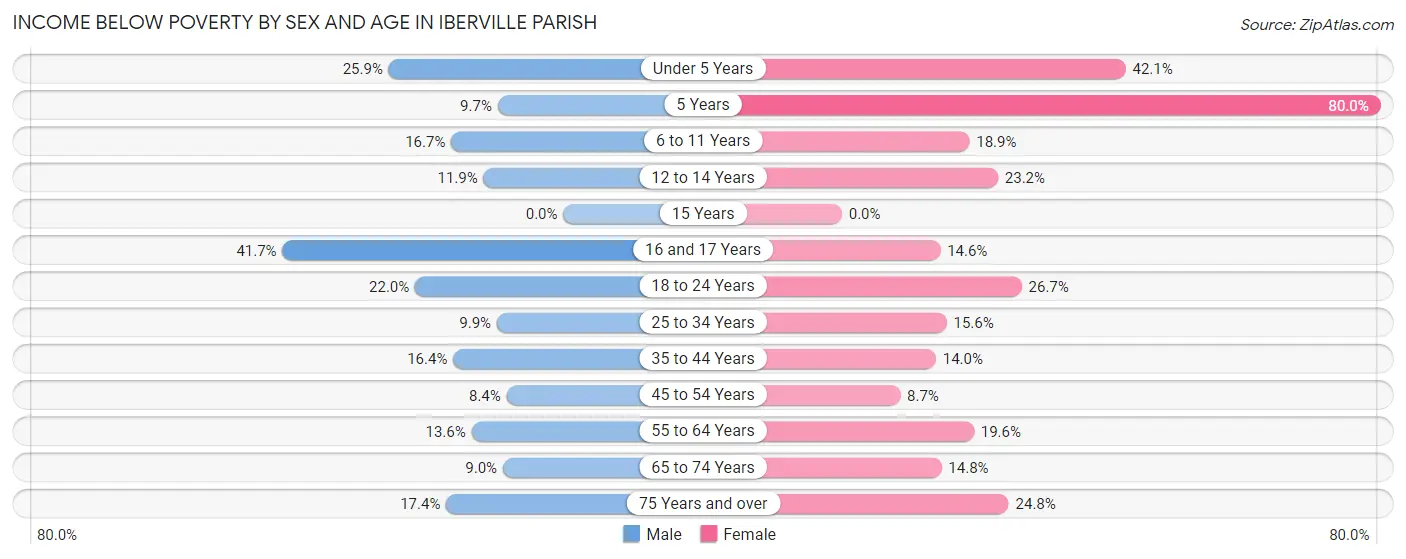
| Age Bracket | Male | Female |
| Under 5 Years | 202 (25.9%) | 338 (42.1%) |
| 5 Years | 19 (9.7%) | 8 (80.0%) |
| 6 to 11 Years | 172 (16.7%) | 202 (18.9%) |
| 12 to 14 Years | 68 (11.8%) | 149 (23.2%) |
| 15 Years | 0 (0.0%) | 0 (0.0%) |
| 16 and 17 Years | 161 (41.7%) | 45 (14.6%) |
| 18 to 24 Years | 289 (22.0%) | 295 (26.7%) |
| 25 to 34 Years | 192 (9.9%) | 288 (15.5%) |
| 35 to 44 Years | 250 (16.4%) | 232 (14.0%) |
| 45 to 54 Years | 124 (8.4%) | 153 (8.7%) |
| 55 to 64 Years | 233 (13.6%) | 404 (19.6%) |
| 65 to 74 Years | 112 (9.0%) | 239 (14.8%) |
| 75 Years and over | 128 (17.4%) | 294 (24.8%) |
| Total | 1,950 (14.8%) | 2,647 (18.7%) |
Income Above Poverty by Sex and Age in Iberville Parish
According to the poverty statistics in Iberville Parish, males aged 15 years and females aged 15 years are the age groups that are most secure financially, with 100.0% of males and 100.0% of females in these age groups living above the poverty line.
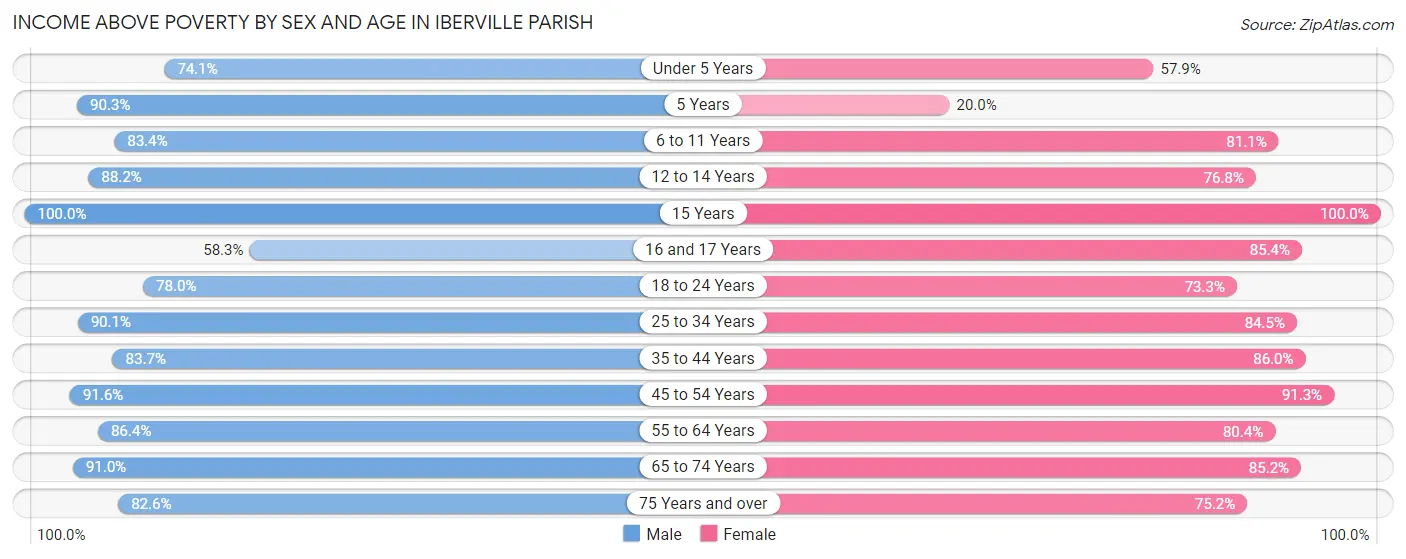
| Age Bracket | Male | Female |
| Under 5 Years | 577 (74.1%) | 464 (57.9%) |
| 5 Years | 176 (90.3%) | 2 (20.0%) |
| 6 to 11 Years | 861 (83.4%) | 865 (81.1%) |
| 12 to 14 Years | 506 (88.1%) | 494 (76.8%) |
| 15 Years | 261 (100.0%) | 49 (100.0%) |
| 16 and 17 Years | 225 (58.3%) | 263 (85.4%) |
| 18 to 24 Years | 1,024 (78.0%) | 810 (73.3%) |
| 25 to 34 Years | 1,755 (90.1%) | 1,564 (84.5%) |
| 35 to 44 Years | 1,279 (83.7%) | 1,430 (86.0%) |
| 45 to 54 Years | 1,348 (91.6%) | 1,614 (91.3%) |
| 55 to 64 Years | 1,476 (86.4%) | 1,657 (80.4%) |
| 65 to 74 Years | 1,136 (91.0%) | 1,377 (85.2%) |
| 75 Years and over | 608 (82.6%) | 893 (75.2%) |
| Total | 11,232 (85.2%) | 11,482 (81.3%) |
Income Below Poverty Among Married-Couple Families in Iberville Parish
The poverty statistics for married-couple families in Iberville Parish show that 3.9% or 181 of the total 4,592 families live below the poverty line. Families with no children have the highest poverty rate of 4.0%, comprising of 122 families. On the other hand, families with 5 or more children have the lowest poverty rate of 0.0%, which includes 0 families.
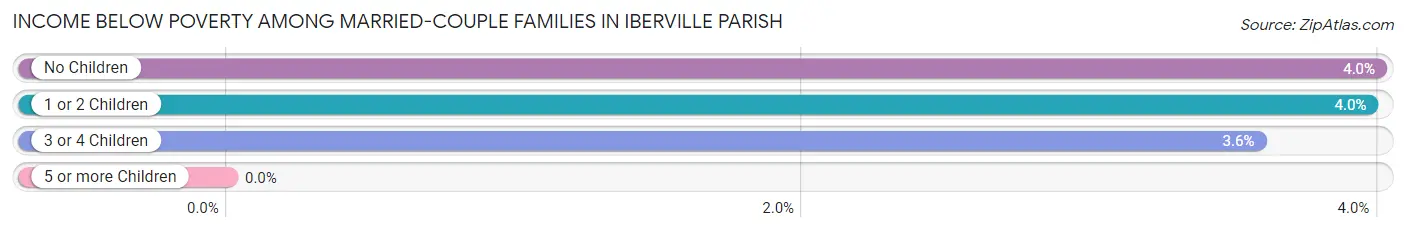
| Children | Above Poverty | Below Poverty |
| No Children | 2,927 (96.0%) | 122 (4.0%) |
| 1 or 2 Children | 1,161 (96.0%) | 48 (4.0%) |
| 3 or 4 Children | 296 (96.4%) | 11 (3.6%) |
| 5 or more Children | 27 (100.0%) | 0 (0.0%) |
| Total | 4,411 (96.1%) | 181 (3.9%) |
Income Below Poverty Among Single-Parent Households in Iberville Parish
According to the poverty data in Iberville Parish, 19.5% or 166 single-father households and 26.7% or 547 single-mother households are living below the poverty line. Among single-father households, those with 1 or 2 children have the highest poverty rate, with 106 households (23.9%) experiencing poverty. Likewise, among single-mother households, those with 5 or more children have the highest poverty rate, with 8 households (100.0%) falling below the poverty line.
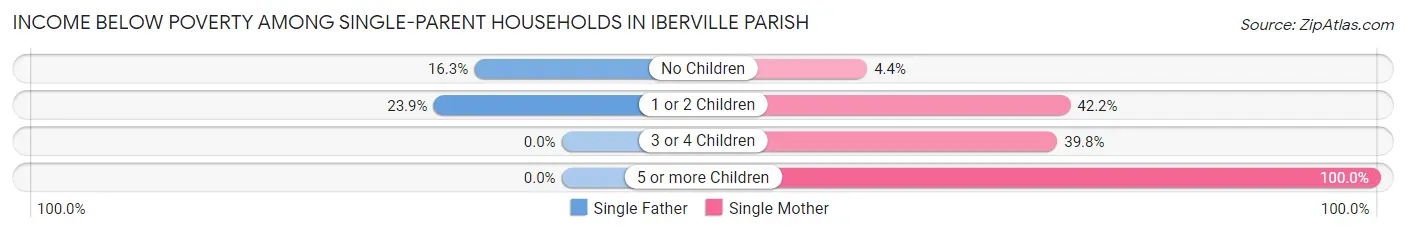
| Children | Single Father | Single Mother |
| No Children | 60 (16.3%) | 37 (4.4%) |
| 1 or 2 Children | 106 (23.9%) | 426 (42.2%) |
| 3 or 4 Children | 0 (0.0%) | 76 (39.8%) |
| 5 or more Children | 0 (0.0%) | 8 (100.0%) |
| Total | 166 (19.5%) | 547 (26.7%) |
Income Below Poverty Among Married-Couple vs Single-Parent Households in Iberville Parish
The poverty data for Iberville Parish shows that 181 of the married-couple family households (3.9%) and 713 of the single-parent households (24.6%) are living below the poverty level. Within the married-couple family households, those with no children have the highest poverty rate, with 122 households (4.0%) falling below the poverty line. Among the single-parent households, those with 5 or more children have the highest poverty rate, with 8 household (100.0%) living below poverty.
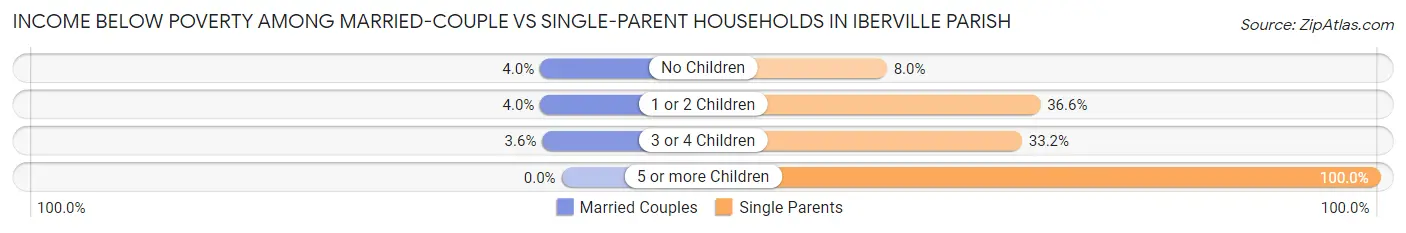
| Children | Married-Couple Families | Single-Parent Households |
| No Children | 122 (4.0%) | 97 (8.0%) |
| 1 or 2 Children | 48 (4.0%) | 532 (36.6%) |
| 3 or 4 Children | 11 (3.6%) | 76 (33.2%) |
| 5 or more Children | 0 (0.0%) | 8 (100.0%) |
| Total | 181 (3.9%) | 713 (24.6%) |
Race in Iberville Parish
The most populous races in Iberville Parish are White / Caucasian (14,575 | 48.2%), Black / African American (13,717 | 45.4%), and Two or more Races (1,551 | 5.1%).
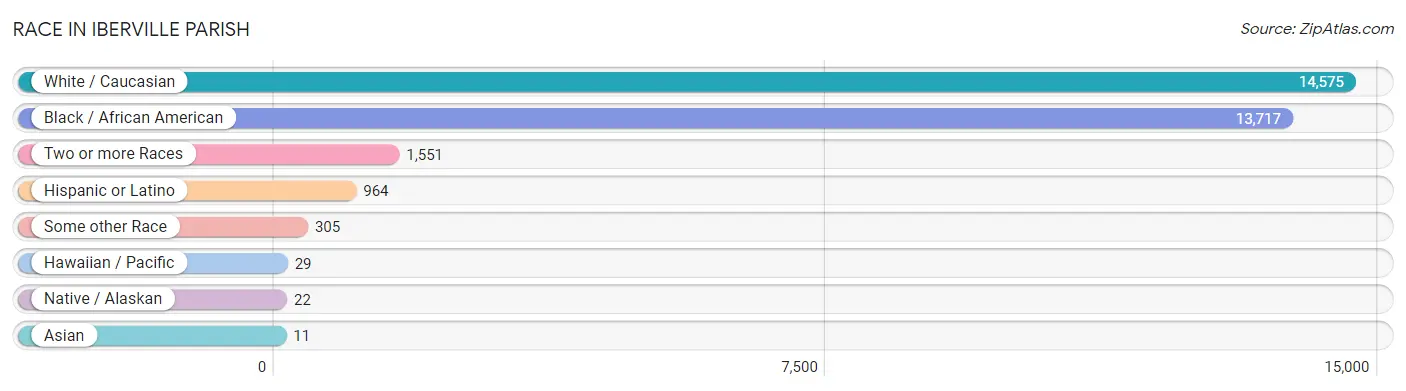
| Race | # Population | % Population |
| Asian | 11 | 0.0% |
| Black / African American | 13,717 | 45.4% |
| Hawaiian / Pacific | 29 | 0.1% |
| Hispanic or Latino | 964 | 3.2% |
| Native / Alaskan | 22 | 0.1% |
| White / Caucasian | 14,575 | 48.2% |
| Two or more Races | 1,551 | 5.1% |
| Some other Race | 305 | 1.0% |
| Total | 30,210 | 100.0% |
Ancestry in Iberville Parish
The most populous ancestries reported in Iberville Parish are American (3,593 | 11.9%), French (3,145 | 10.4%), Irish (1,717 | 5.7%), German (1,676 | 5.6%), and Italian (1,478 | 4.9%), together accounting for 38.4% of all Iberville Parish residents.
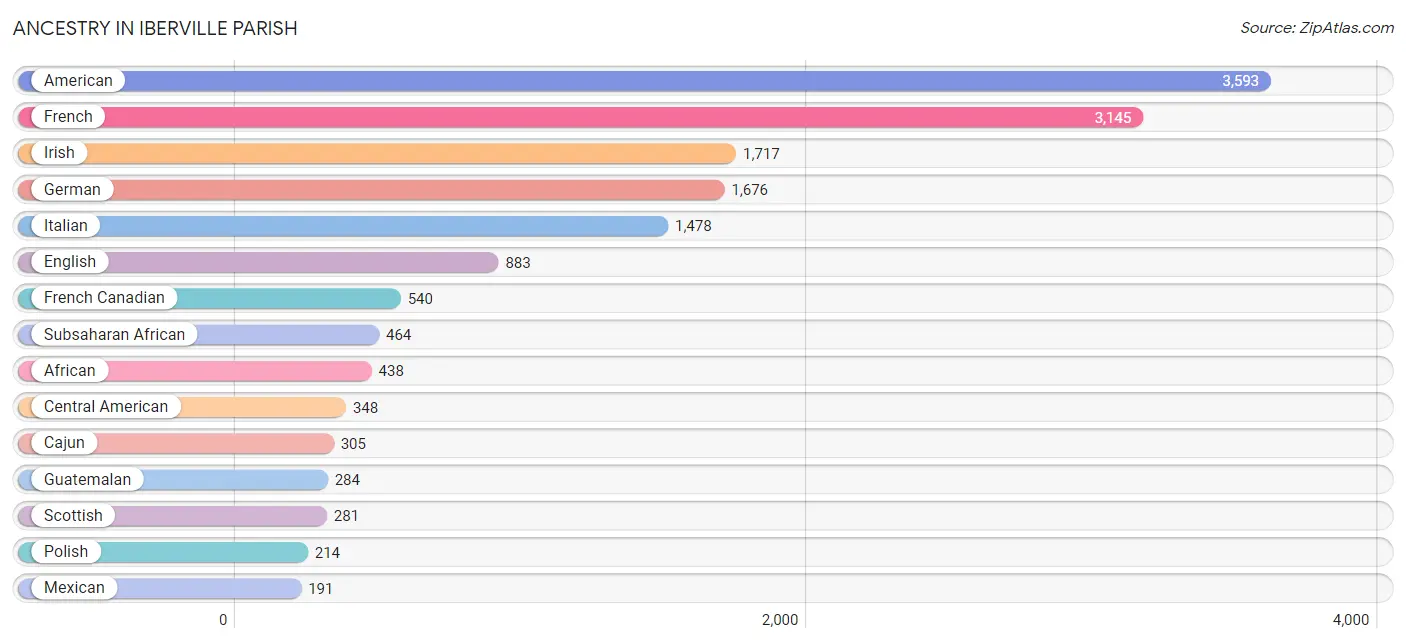
| Ancestry | # Population | % Population |
| African | 438 | 1.5% |
| Alaska Native | 5 | 0.0% |
| American | 3,593 | 11.9% |
| Apache | 3 | 0.0% |
| Arab | 33 | 0.1% |
| Argentinean | 4 | 0.0% |
| Bhutanese | 11 | 0.0% |
| Blackfeet | 22 | 0.1% |
| British | 103 | 0.3% |
| Burmese | 2 | 0.0% |
| Cajun | 305 | 1.0% |
| Central American | 348 | 1.1% |
| Cherokee | 62 | 0.2% |
| Choctaw | 16 | 0.1% |
| Colombian | 7 | 0.0% |
| Cuban | 114 | 0.4% |
| Danish | 3 | 0.0% |
| Dominican | 10 | 0.0% |
| Dutch | 18 | 0.1% |
| Eastern European | 33 | 0.1% |
| English | 883 | 2.9% |
| European | 161 | 0.5% |
| Finnish | 3 | 0.0% |
| French | 3,145 | 10.4% |
| French Canadian | 540 | 1.8% |
| German | 1,676 | 5.6% |
| Greek | 36 | 0.1% |
| Guatemalan | 284 | 0.9% |
| Honduran | 59 | 0.2% |
| Houma | 37 | 0.1% |
| Hungarian | 6 | 0.0% |
| Irish | 1,717 | 5.7% |
| Iroquois | 33 | 0.1% |
| Israeli | 27 | 0.1% |
| Italian | 1,478 | 4.9% |
| Jamaican | 67 | 0.2% |
| Korean | 166 | 0.5% |
| Lebanese | 19 | 0.1% |
| Mexican | 191 | 0.6% |
| Native Hawaiian | 39 | 0.1% |
| Navajo | 10 | 0.0% |
| Nigerian | 8 | 0.0% |
| Northern European | 7 | 0.0% |
| Norwegian | 60 | 0.2% |
| Paiute | 3 | 0.0% |
| Pakistani | 1 | 0.0% |
| Polish | 214 | 0.7% |
| Pueblo | 3 | 0.0% |
| Puerto Rican | 115 | 0.4% |
| Russian | 5 | 0.0% |
| Salvadoran | 5 | 0.0% |
| Scandinavian | 19 | 0.1% |
| Scotch-Irish | 74 | 0.2% |
| Scottish | 281 | 0.9% |
| Seminole | 3 | 0.0% |
| South American | 11 | 0.0% |
| Spaniard | 80 | 0.3% |
| Spanish | 18 | 0.1% |
| Sri Lankan | 5 | 0.0% |
| Subsaharan African | 464 | 1.5% |
| Swedish | 105 | 0.4% |
| Syrian | 9 | 0.0% |
| Thai | 5 | 0.0% |
| Welsh | 12 | 0.0% | View All 64 Rows |
Immigrants in Iberville Parish
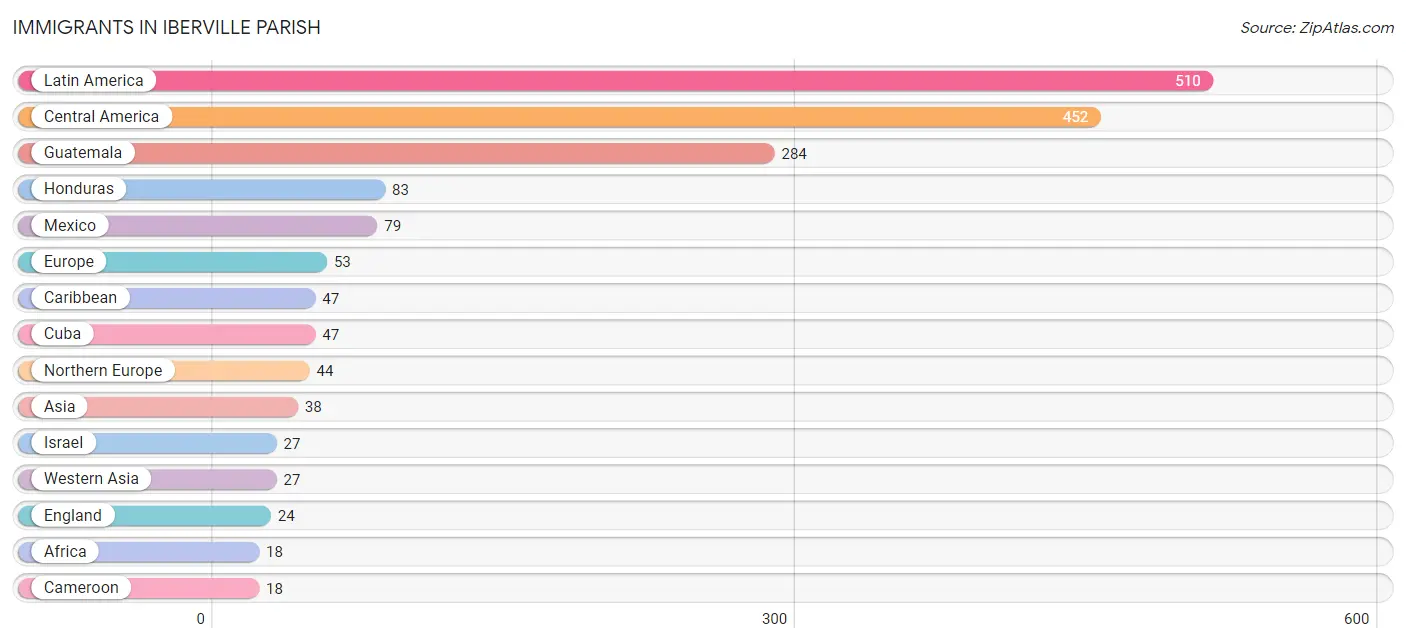
The most numerous immigrant groups reported in Iberville Parish came from Latin America (510 | 1.7%), Central America (452 | 1.5%), Guatemala (284 | 0.9%), Honduras (83 | 0.3%), and Mexico (79 | 0.3%), together accounting for 4.7% of all Iberville Parish residents.
| Immigration Origin | # Population | % Population |
| Africa | 18 | 0.1% |
| Argentina | 4 | 0.0% |
| Asia | 38 | 0.1% |
| Belize | 1 | 0.0% |
| Cameroon | 18 | 0.1% |
| Caribbean | 47 | 0.2% |
| Central America | 452 | 1.5% |
| Colombia | 7 | 0.0% |
| Cuba | 47 | 0.2% |
| England | 24 | 0.1% |
| Europe | 53 | 0.2% |
| Germany | 6 | 0.0% |
| Greece | 3 | 0.0% |
| Guatemala | 284 | 0.9% |
| Honduras | 83 | 0.3% |
| Israel | 27 | 0.1% |
| Latin America | 510 | 1.7% |
| Mexico | 79 | 0.3% |
| Middle Africa | 18 | 0.1% |
| Northern Europe | 44 | 0.2% |
| Panama | 5 | 0.0% |
| Philippines | 5 | 0.0% |
| South America | 11 | 0.0% |
| South Eastern Asia | 11 | 0.0% |
| Southern Europe | 3 | 0.0% |
| Thailand | 1 | 0.0% |
| Vietnam | 5 | 0.0% |
| Western Asia | 27 | 0.1% |
| Western Europe | 6 | 0.0% | View All 29 Rows |
Sex and Age in Iberville Parish
Sex and Age in Iberville Parish
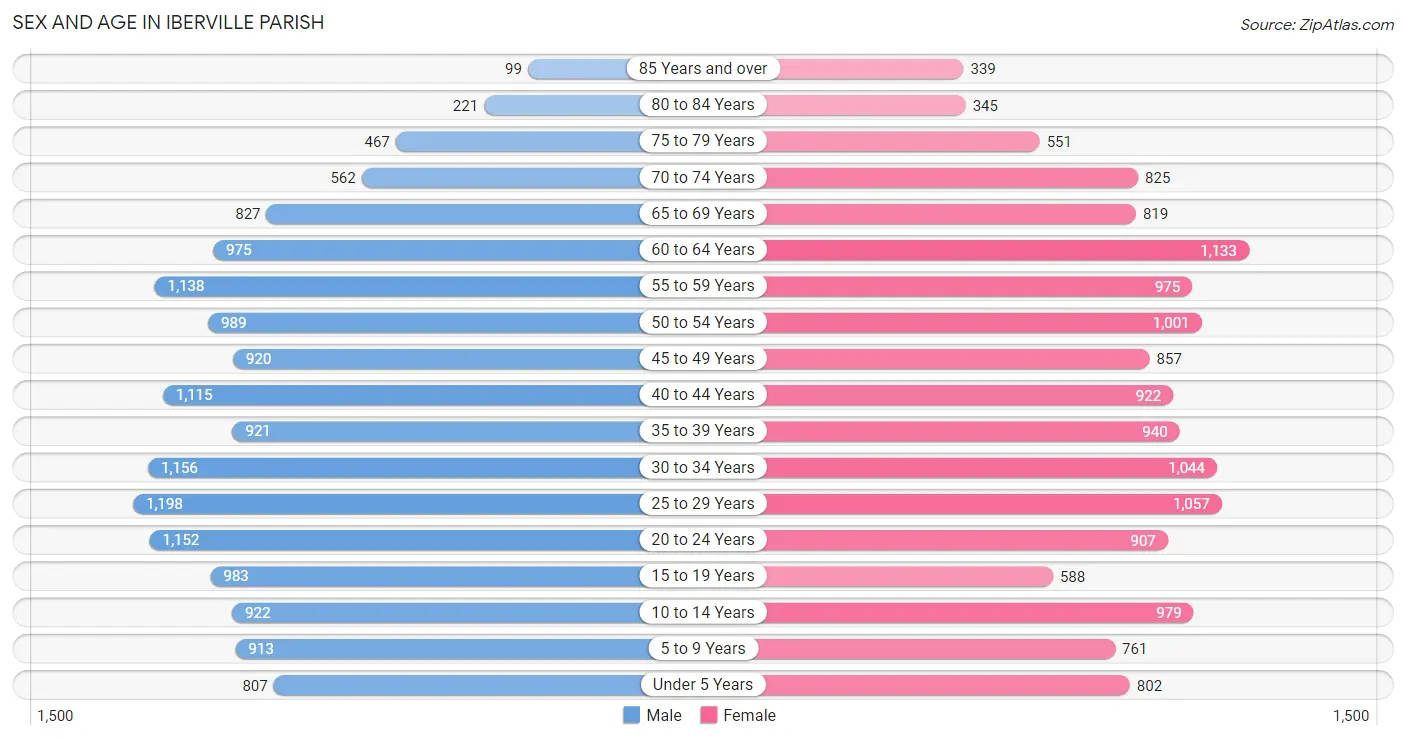
The most populous age groups in Iberville Parish are 25 to 29 Years (1,198 | 7.8%) for men and 60 to 64 Years (1,133 | 7.6%) for women.
| Age Bracket | Male | Female |
| Under 5 Years | 807 (5.2%) | 802 (5.4%) |
| 5 to 9 Years | 913 (5.9%) | 761 (5.1%) |
| 10 to 14 Years | 922 (6.0%) | 979 (6.6%) |
| 15 to 19 Years | 983 (6.4%) | 588 (4.0%) |
| 20 to 24 Years | 1,152 (7.5%) | 907 (6.1%) |
| 25 to 29 Years | 1,198 (7.8%) | 1,057 (7.1%) |
| 30 to 34 Years | 1,156 (7.5%) | 1,044 (7.0%) |
| 35 to 39 Years | 921 (6.0%) | 940 (6.3%) |
| 40 to 44 Years | 1,115 (7.3%) | 922 (6.2%) |
| 45 to 49 Years | 920 (6.0%) | 857 (5.8%) |
| 50 to 54 Years | 989 (6.4%) | 1,001 (6.7%) |
| 55 to 59 Years | 1,138 (7.4%) | 975 (6.6%) |
| 60 to 64 Years | 975 (6.4%) | 1,133 (7.6%) |
| 65 to 69 Years | 827 (5.4%) | 819 (5.5%) |
| 70 to 74 Years | 562 (3.7%) | 825 (5.6%) |
| 75 to 79 Years | 467 (3.0%) | 551 (3.7%) |
| 80 to 84 Years | 221 (1.4%) | 345 (2.3%) |
| 85 Years and over | 99 (0.6%) | 339 (2.3%) |
| Total | 15,365 (100.0%) | 14,845 (100.0%) |
Families and Households in Iberville Parish
Median Family Size in Iberville Parish
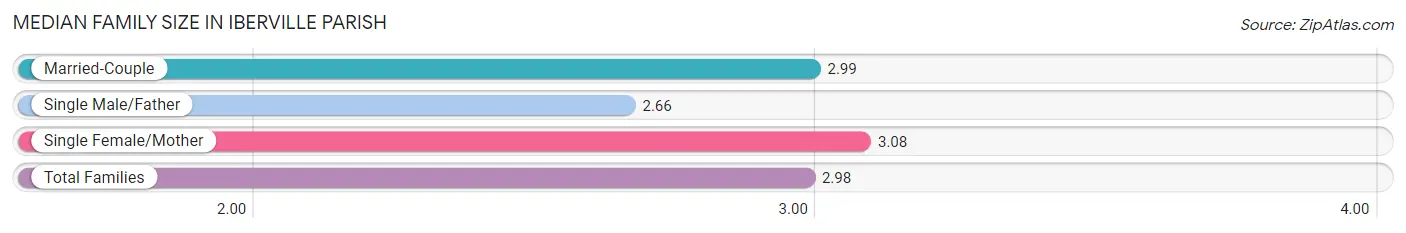
The median family size in Iberville Parish is 2.98 persons per family, with single female/mother families (2,050 | 27.4%) accounting for the largest median family size of 3.08 persons per family. On the other hand, single male/father families (850 | 11.4%) represent the smallest median family size with 2.66 persons per family.
| Family Type | # Families | Family Size |
| Married-Couple | 4,592 (61.3%) | 2.99 |
| Single Male/Father | 850 (11.4%) | 2.66 |
| Single Female/Mother | 2,050 (27.4%) | 3.08 |
| Total Families | 7,492 (100.0%) | 2.98 |
Median Household Size in Iberville Parish
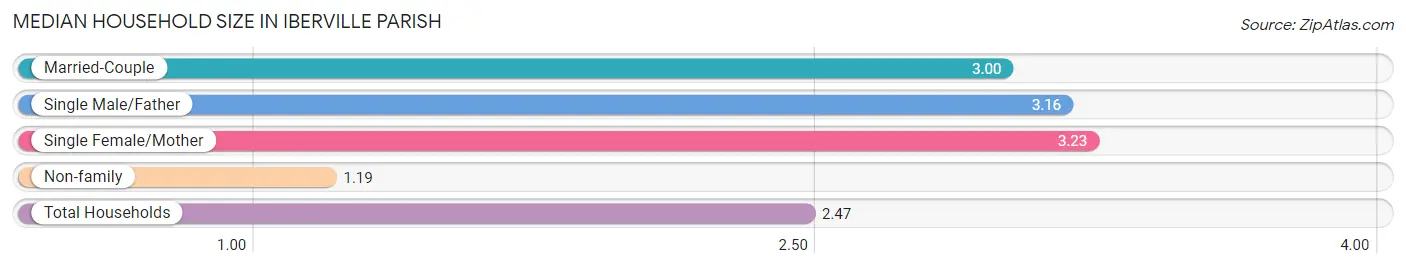
The median household size in Iberville Parish is 2.47 persons per household, with single female/mother households (2,050 | 18.6%) accounting for the largest median household size of 3.23 persons per household. non-family households (3,550 | 32.2%) represent the smallest median household size with 1.19 persons per household.
| Household Type | # Households | Household Size |
| Married-Couple | 4,592 (41.6%) | 3.00 |
| Single Male/Father | 850 (7.7%) | 3.16 |
| Single Female/Mother | 2,050 (18.6%) | 3.23 |
| Non-family | 3,550 (32.2%) | 1.19 |
| Total Households | 11,042 (100.0%) | 2.47 |
Household Size by Marriage Status in Iberville Parish
Out of a total of 11,042 households in Iberville Parish, 7,492 (67.8%) are family households, while 3,550 (32.2%) are nonfamily households. The most numerous type of family households are 2-person households, comprising 3,409, and the most common type of nonfamily households are 1-person households, comprising 3,063.
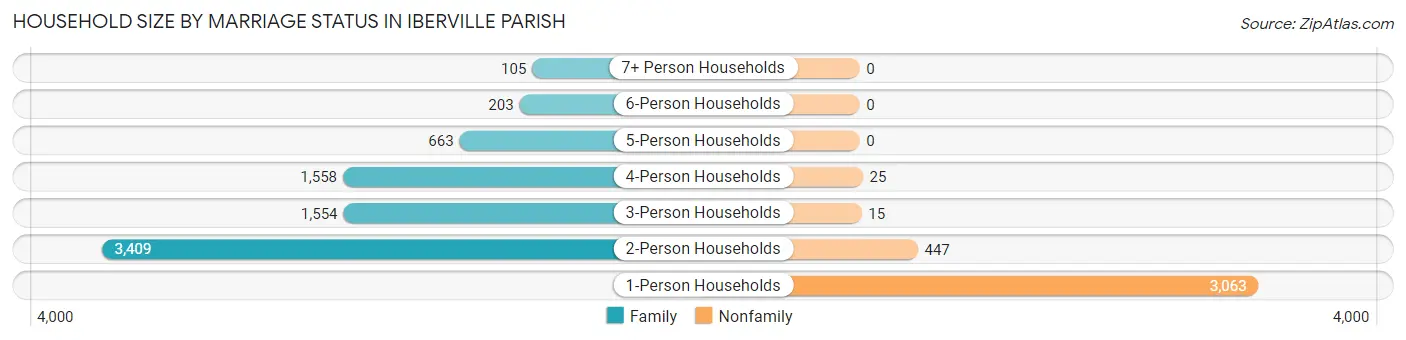
| Household Size | Family Households | Nonfamily Households |
| 1-Person Households | - | 3,063 (27.7%) |
| 2-Person Households | 3,409 (30.9%) | 447 (4.1%) |
| 3-Person Households | 1,554 (14.1%) | 15 (0.1%) |
| 4-Person Households | 1,558 (14.1%) | 25 (0.2%) |
| 5-Person Households | 663 (6.0%) | 0 (0.0%) |
| 6-Person Households | 203 (1.8%) | 0 (0.0%) |
| 7+ Person Households | 105 (0.9%) | 0 (0.0%) |
| Total | 7,492 (67.8%) | 3,550 (32.2%) |
Female Fertility in Iberville Parish
Fertility by Age in Iberville Parish
Average fertility rate in Iberville Parish is 71.0 births per 1,000 women. Women in the age bracket of 20 to 34 years have the highest fertility rate with 127.0 births per 1,000 women. Women in the age bracket of 20 to 34 years acount for 83.8% of all women with births.
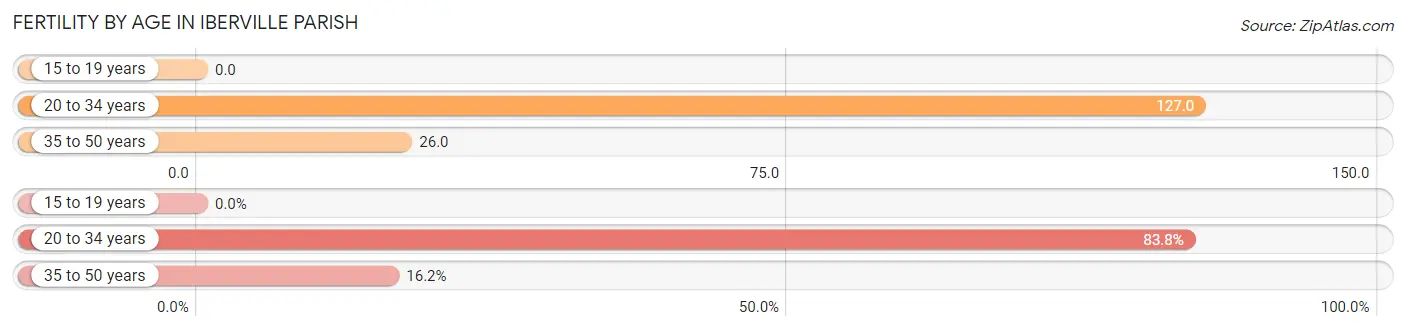
| Age Bracket | Women with Births | Births / 1,000 Women |
| 15 to 19 years | 0 (0.0%) | 0.0 |
| 20 to 34 years | 382 (83.8%) | 127.0 |
| 35 to 50 years | 74 (16.2%) | 26.0 |
| Total | 456 (100.0%) | 71.0 |
Fertility by Age by Marriage Status in Iberville Parish
33.8% of women with births (456) in Iberville Parish are married. The highest percentage of unmarried women with births falls into 20 to 34 years age bracket with 74.4% of them unmarried at the time of birth, while the lowest percentage of unmarried women with births belong to 35 to 50 years age bracket with 24.3% of them unmarried.
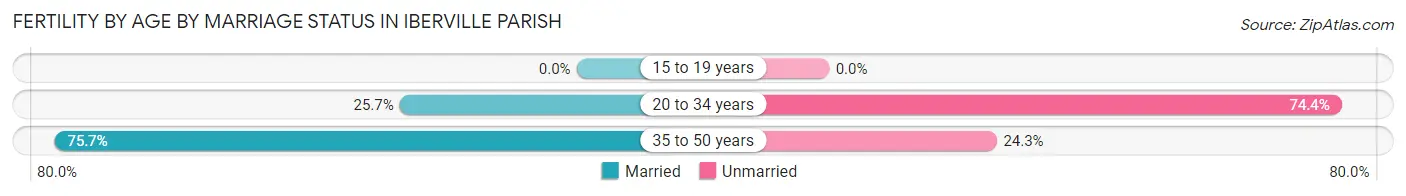
| Age Bracket | Married | Unmarried |
| 15 to 19 years | 0 (0.0%) | 0 (0.0%) |
| 20 to 34 years | 98 (25.7%) | 284 (74.4%) |
| 35 to 50 years | 56 (75.7%) | 18 (24.3%) |
| Total | 154 (33.8%) | 302 (66.2%) |
Fertility by Education in Iberville Parish
Average fertility rate in Iberville Parish is 71.0 births per 1,000 women. Women with the education attainment of high school diploma have the highest fertility rate of 106.0 births per 1,000 women, while women with the education attainment of graduate degree have the lowest fertility at 37.0 births per 1,000 women. Women with the education attainment of high school diploma represent 42.5% of all women with births.
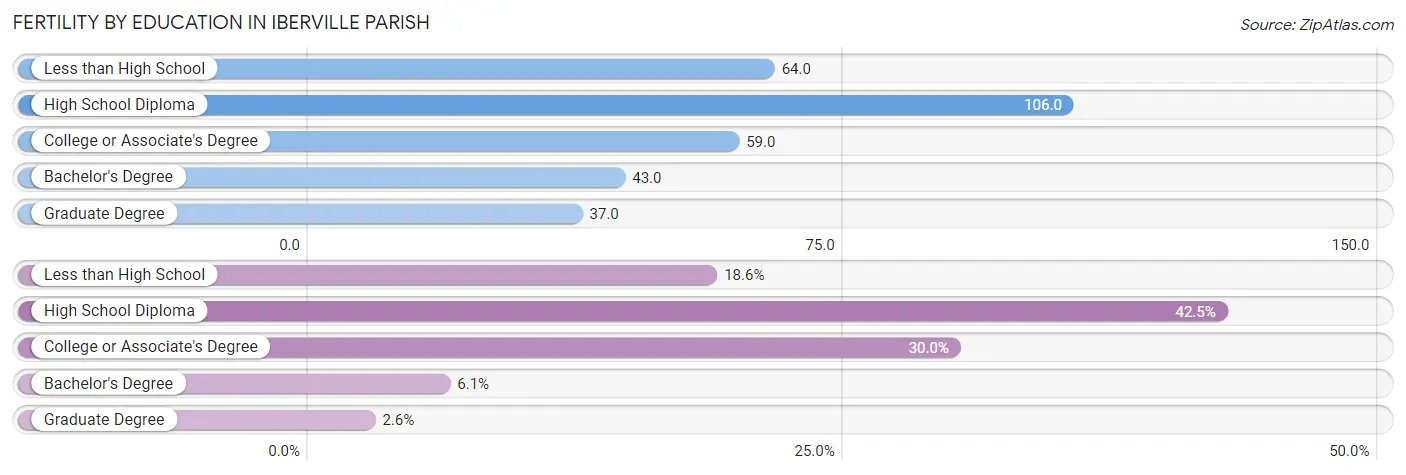
| Educational Attainment | Women with Births | Births / 1,000 Women |
| Less than High School | 85 (18.6%) | 64.0 |
| High School Diploma | 194 (42.5%) | 106.0 |
| College or Associate's Degree | 137 (30.0%) | 59.0 |
| Bachelor's Degree | 28 (6.1%) | 43.0 |
| Graduate Degree | 12 (2.6%) | 37.0 |
| Total | 456 (100.0%) | 71.0 |
Fertility by Education by Marriage Status in Iberville Parish
66.2% of women with births in Iberville Parish are unmarried. Women with the educational attainment of graduate degree are most likely to be married with 100.0% of them married at childbirth, while women with the educational attainment of less than high school are least likely to be married with 100.0% of them unmarried at childbirth.
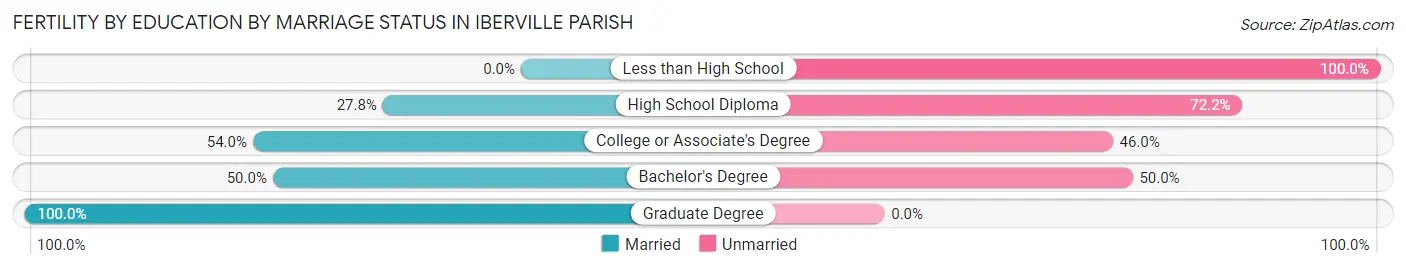
| Educational Attainment | Married | Unmarried |
| Less than High School | 0 (0.0%) | 85 (100.0%) |
| High School Diploma | 54 (27.8%) | 140 (72.2%) |
| College or Associate's Degree | 74 (54.0%) | 63 (46.0%) |
| Bachelor's Degree | 14 (50.0%) | 14 (50.0%) |
| Graduate Degree | 12 (100.0%) | 0 (0.0%) |
| Total | 154 (33.8%) | 302 (66.2%) |
Employment Characteristics in Iberville Parish
Employment by Class of Employer in Iberville Parish
Among the 12,009 employed individuals in Iberville Parish, private company employees (7,423 | 61.8%), local government employees (1,269 | 10.6%), and state government employees (1,034 | 8.6%) make up the most common classes of employment.
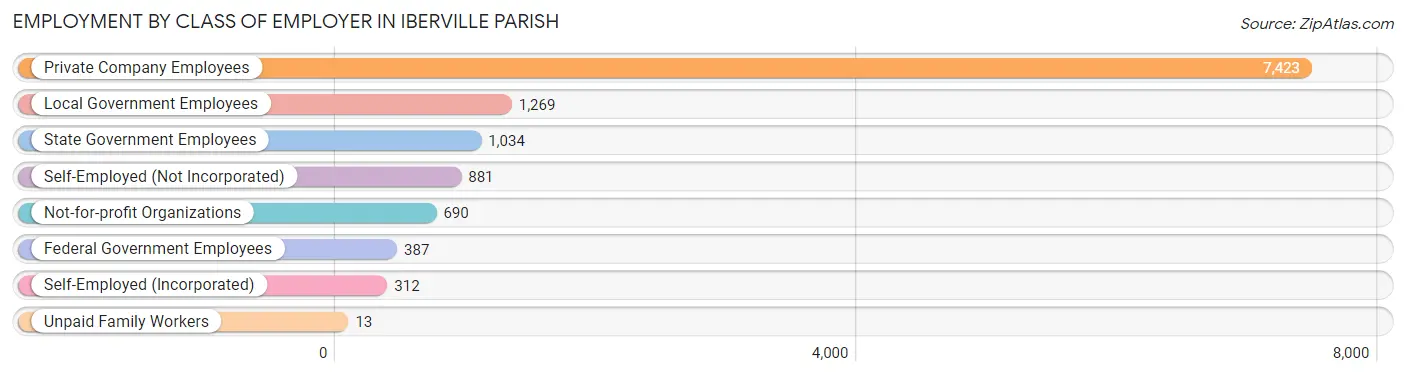
| Employer Class | # Employees | % Employees |
| Private Company Employees | 7,423 | 61.8% |
| Self-Employed (Incorporated) | 312 | 2.6% |
| Self-Employed (Not Incorporated) | 881 | 7.3% |
| Not-for-profit Organizations | 690 | 5.8% |
| Local Government Employees | 1,269 | 10.6% |
| State Government Employees | 1,034 | 8.6% |
| Federal Government Employees | 387 | 3.2% |
| Unpaid Family Workers | 13 | 0.1% |
| Total | 12,009 | 100.0% |
Employment Status by Age in Iberville Parish
According to the labor force statistics for Iberville Parish, out of the total population over 16 years of age (24,716), 54.0% or 13,347 individuals are in the labor force, with 7.5% or 1,001 of them unemployed. The age group with the highest labor force participation rate is 25 to 29 years, with 74.1% or 1,671 individuals in the labor force. Within the labor force, the 16 to 19 years age range has the highest percentage of unemployed individuals, with 22.3% or 89 of them being unemployed.
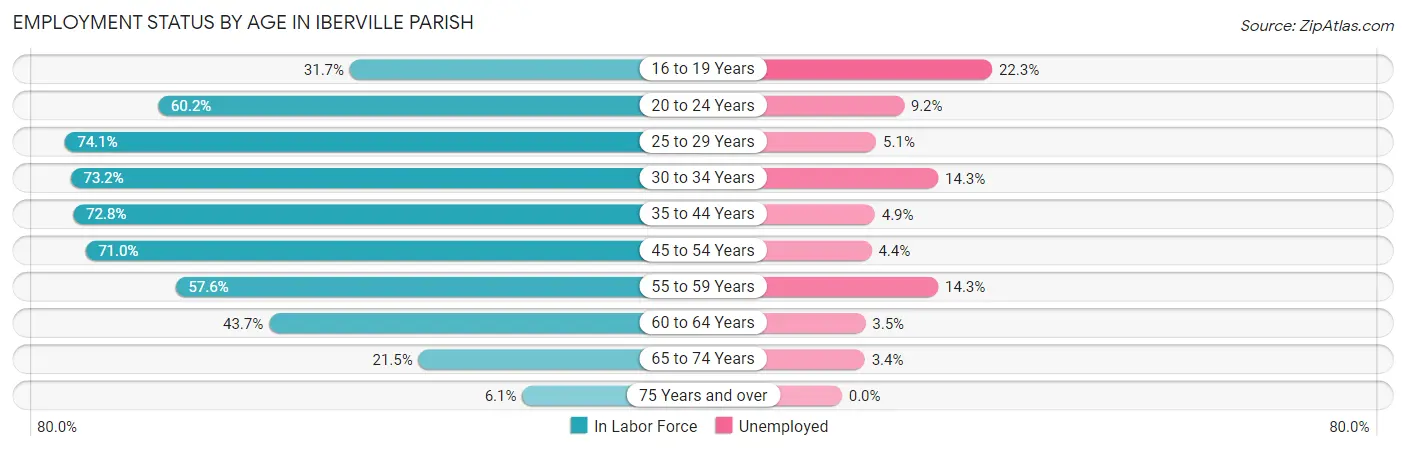
| Age Bracket | In Labor Force | Unemployed |
| 16 to 19 Years | 400 (31.7%) | 89 (22.3%) |
| 20 to 24 Years | 1,240 (60.2%) | 114 (9.2%) |
| 25 to 29 Years | 1,671 (74.1%) | 85 (5.1%) |
| 30 to 34 Years | 1,610 (73.2%) | 230 (14.3%) |
| 35 to 44 Years | 2,838 (72.8%) | 139 (4.9%) |
| 45 to 54 Years | 2,675 (71.0%) | 118 (4.4%) |
| 55 to 59 Years | 1,217 (57.6%) | 174 (14.3%) |
| 60 to 64 Years | 921 (43.7%) | 32 (3.5%) |
| 65 to 74 Years | 652 (21.5%) | 22 (3.4%) |
| 75 Years and over | 123 (6.1%) | 0 (0.0%) |
| Total | 13,347 (54.0%) | 1,001 (7.5%) |
Employment Status by Educational Attainment in Iberville Parish
According to labor force statistics for Iberville Parish, 66.9% of individuals (10,932) out of the total population between 25 and 64 years of age (16,341) are in the labor force, with 7.1% or 776 of them being unemployed. The group with the highest labor force participation rate are those with the educational attainment of bachelor's degree or higher, with 85.6% or 2,186 individuals in the labor force. Within the labor force, individuals with high school diploma education have the highest percentage of unemployment, with 11.2% or 399 of them being unemployed.
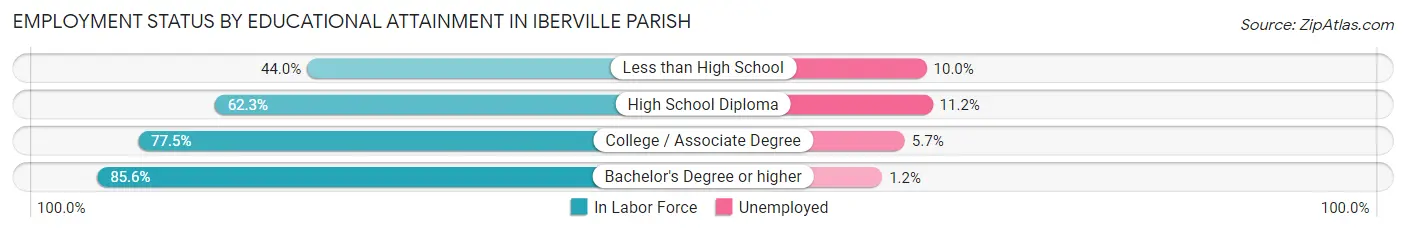
| Educational Attainment | In Labor Force | Unemployed |
| Less than High School | 1,408 (44.0%) | 320 (10.0%) |
| High School Diploma | 3,564 (62.3%) | 641 (11.2%) |
| College / Associate Degree | 3,772 (77.5%) | 277 (5.7%) |
| Bachelor's Degree or higher | 2,186 (85.6%) | 31 (1.2%) |
| Total | 10,932 (66.9%) | 1,160 (7.1%) |
Employment Occupations by Sex in Iberville Parish
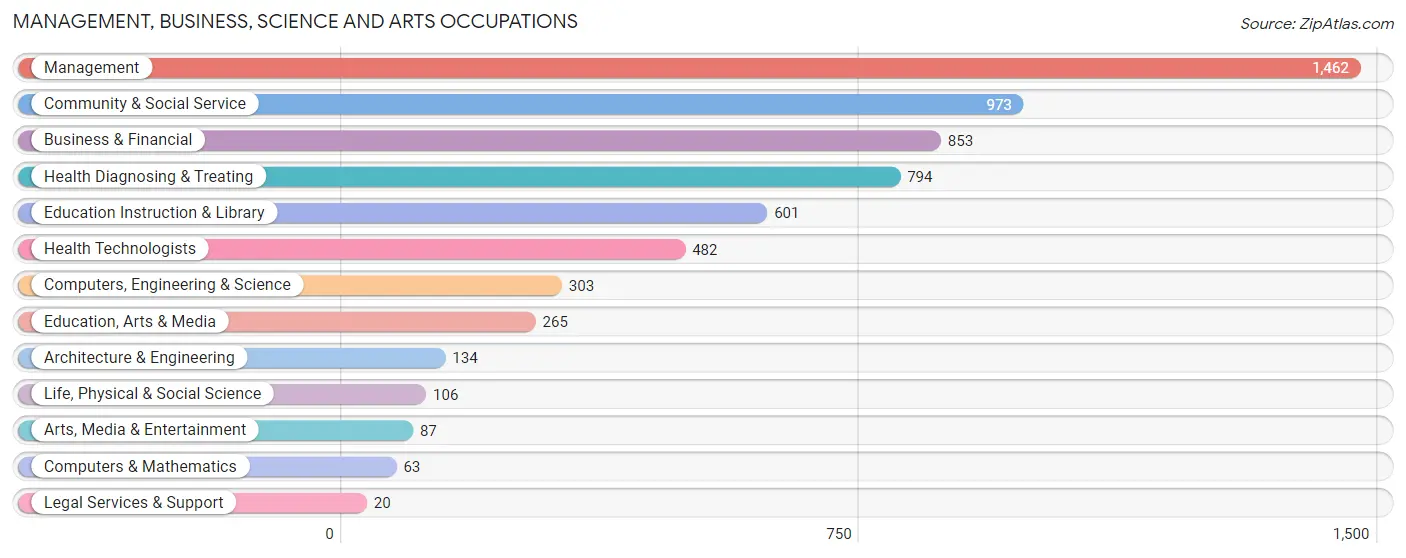
Management, Business, Science and Arts Occupations
The most common Management, Business, Science and Arts occupations in Iberville Parish are Management (1,462 | 12.0%), Community & Social Service (973 | 8.0%), Business & Financial (853 | 7.0%), Health Diagnosing & Treating (794 | 6.5%), and Education Instruction & Library (601 | 4.9%).
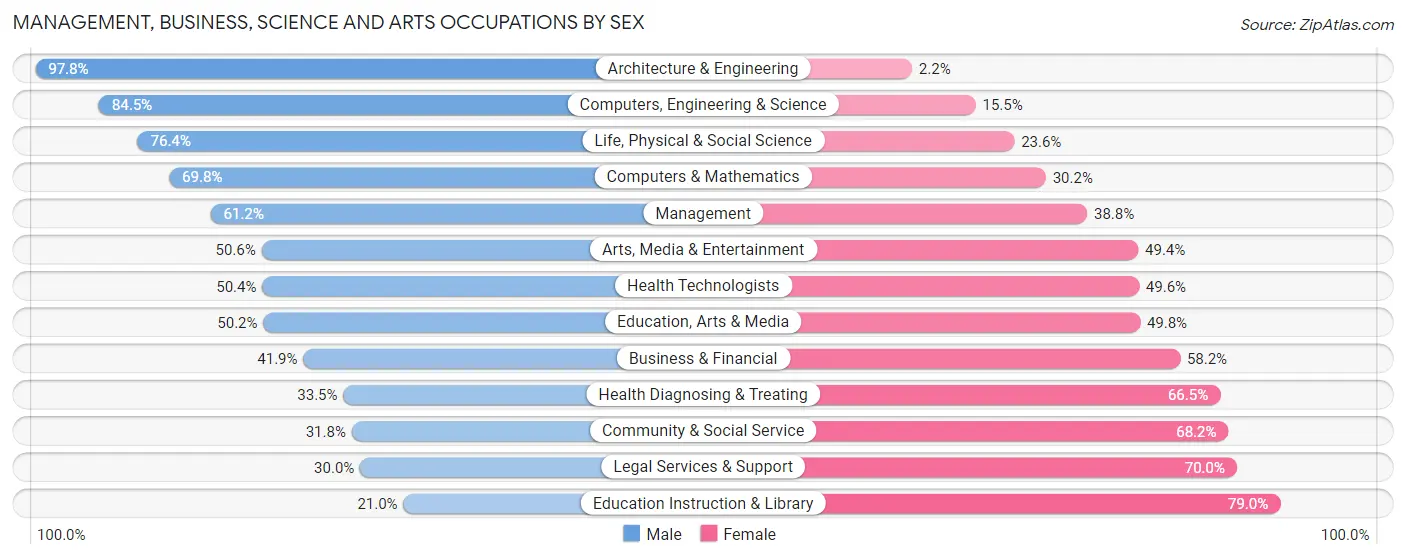
Management, Business, Science and Arts Occupations by Sex
Within the Management, Business, Science and Arts occupations in Iberville Parish, the most male-oriented occupations are Architecture & Engineering (97.8%), Computers, Engineering & Science (84.5%), and Life, Physical & Social Science (76.4%), while the most female-oriented occupations are Education Instruction & Library (79.0%), Legal Services & Support (70.0%), and Community & Social Service (68.2%).
| Occupation | Male | Female |
| Management | 895 (61.2%) | 567 (38.8%) |
| Business & Financial | 357 (41.8%) | 496 (58.2%) |
| Computers, Engineering & Science | 256 (84.5%) | 47 (15.5%) |
| Computers & Mathematics | 44 (69.8%) | 19 (30.2%) |
| Architecture & Engineering | 131 (97.8%) | 3 (2.2%) |
| Life, Physical & Social Science | 81 (76.4%) | 25 (23.6%) |
| Community & Social Service | 309 (31.8%) | 664 (68.2%) |
| Education, Arts & Media | 133 (50.2%) | 132 (49.8%) |
| Legal Services & Support | 6 (30.0%) | 14 (70.0%) |
| Education Instruction & Library | 126 (21.0%) | 475 (79.0%) |
| Arts, Media & Entertainment | 44 (50.6%) | 43 (49.4%) |
| Health Diagnosing & Treating | 266 (33.5%) | 528 (66.5%) |
| Health Technologists | 243 (50.4%) | 239 (49.6%) |
| Total (Category) | 2,083 (47.5%) | 2,302 (52.5%) |
| Total (Overall) | 6,254 (51.2%) | 5,969 (48.8%) |
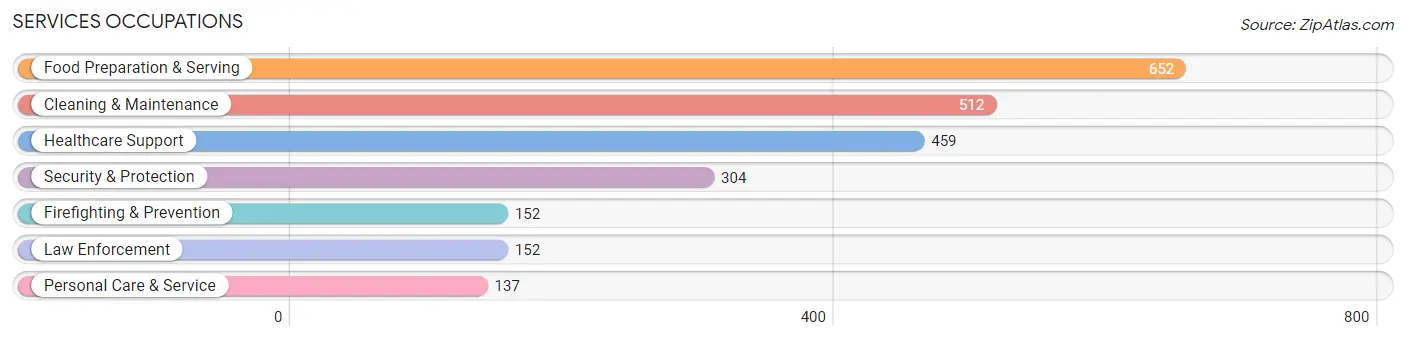
Services Occupations
The most common Services occupations in Iberville Parish are Food Preparation & Serving (652 | 5.3%), Cleaning & Maintenance (512 | 4.2%), Healthcare Support (459 | 3.8%), Security & Protection (304 | 2.5%), and Firefighting & Prevention (152 | 1.2%).
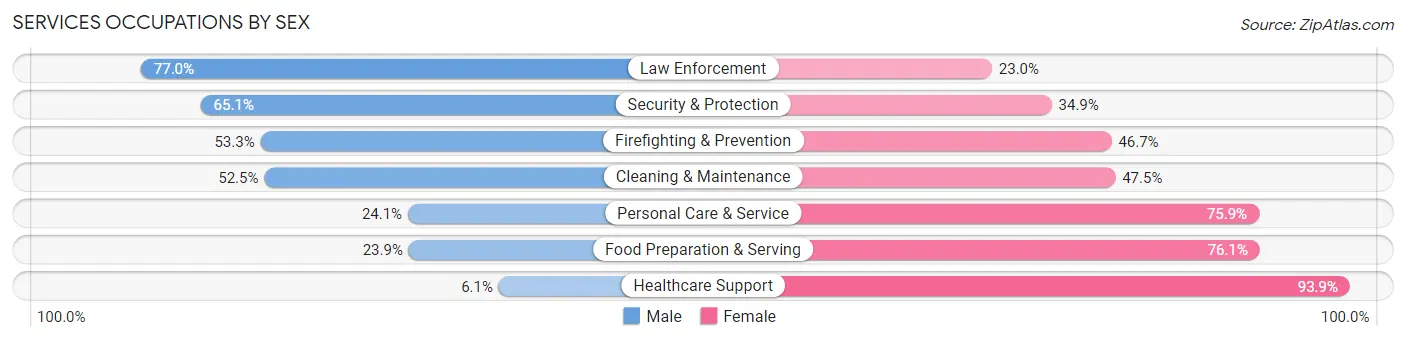
Services Occupations by Sex
Within the Services occupations in Iberville Parish, the most male-oriented occupations are Law Enforcement (77.0%), Security & Protection (65.1%), and Firefighting & Prevention (53.3%), while the most female-oriented occupations are Healthcare Support (93.9%), Food Preparation & Serving (76.1%), and Personal Care & Service (75.9%).
| Occupation | Male | Female |
| Healthcare Support | 28 (6.1%) | 431 (93.9%) |
| Security & Protection | 198 (65.1%) | 106 (34.9%) |
| Firefighting & Prevention | 81 (53.3%) | 71 (46.7%) |
| Law Enforcement | 117 (77.0%) | 35 (23.0%) |
| Food Preparation & Serving | 156 (23.9%) | 496 (76.1%) |
| Cleaning & Maintenance | 269 (52.5%) | 243 (47.5%) |
| Personal Care & Service | 33 (24.1%) | 104 (75.9%) |
| Total (Category) | 684 (33.1%) | 1,380 (66.9%) |
| Total (Overall) | 6,254 (51.2%) | 5,969 (48.8%) |
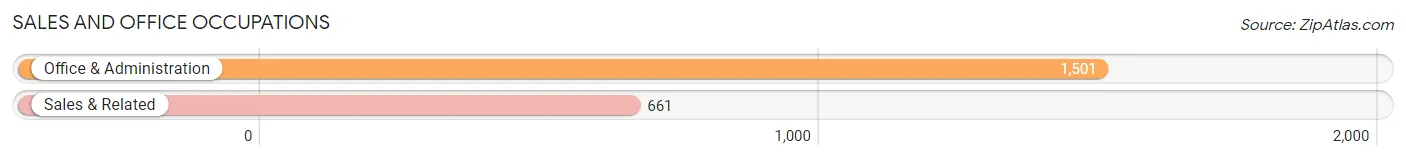
Sales and Office Occupations
The most common Sales and Office occupations in Iberville Parish are Office & Administration (1,501 | 12.3%), and Sales & Related (661 | 5.4%).
Sales and Office Occupations by Sex
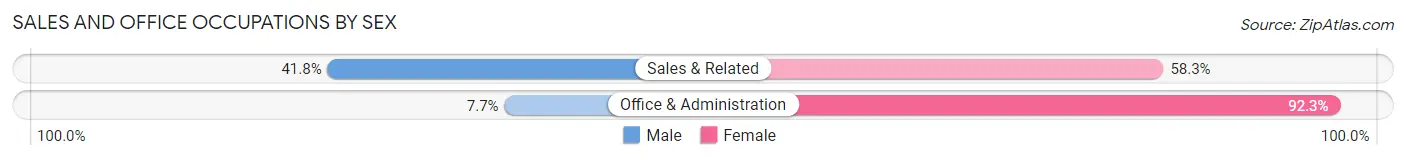
| Occupation | Male | Female |
| Sales & Related | 276 (41.7%) | 385 (58.3%) |
| Office & Administration | 116 (7.7%) | 1,385 (92.3%) |
| Total (Category) | 392 (18.1%) | 1,770 (81.9%) |
| Total (Overall) | 6,254 (51.2%) | 5,969 (48.8%) |
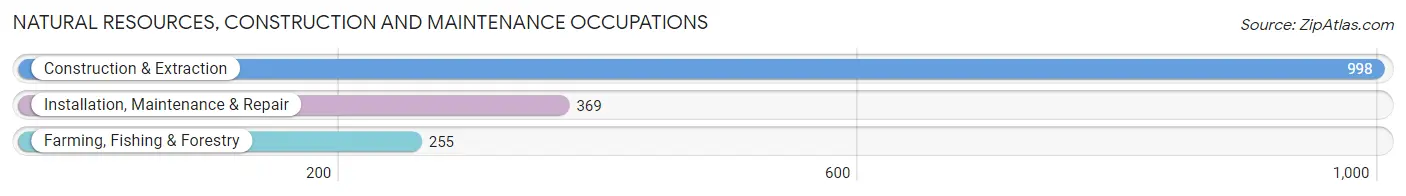
Natural Resources, Construction and Maintenance Occupations
The most common Natural Resources, Construction and Maintenance occupations in Iberville Parish are Construction & Extraction (998 | 8.2%), Installation, Maintenance & Repair (369 | 3.0%), and Farming, Fishing & Forestry (255 | 2.1%).
Natural Resources, Construction and Maintenance Occupations by Sex
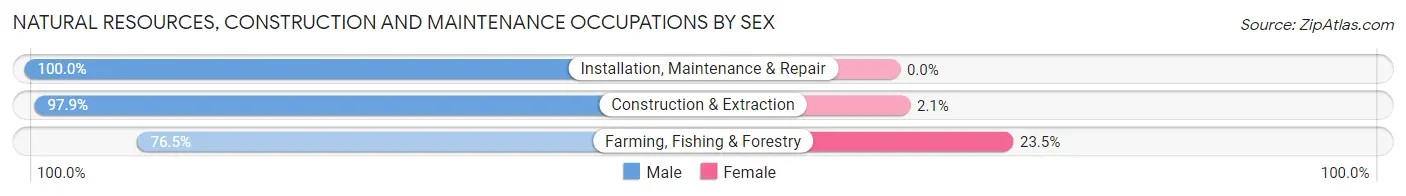
| Occupation | Male | Female |
| Farming, Fishing & Forestry | 195 (76.5%) | 60 (23.5%) |
| Construction & Extraction | 977 (97.9%) | 21 (2.1%) |
| Installation, Maintenance & Repair | 369 (100.0%) | 0 (0.0%) |
| Total (Category) | 1,541 (95.0%) | 81 (5.0%) |
| Total (Overall) | 6,254 (51.2%) | 5,969 (48.8%) |
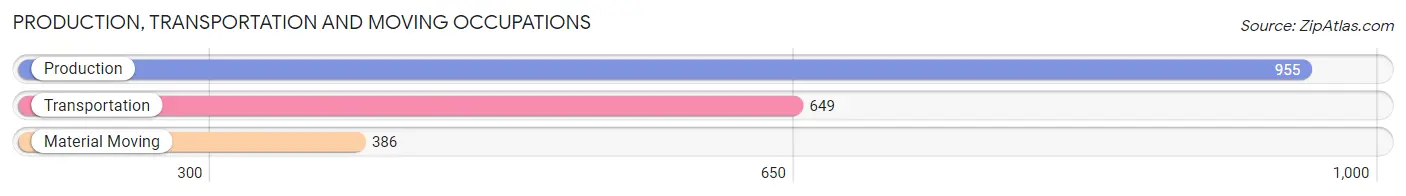
Production, Transportation and Moving Occupations
The most common Production, Transportation and Moving occupations in Iberville Parish are Production (955 | 7.8%), Transportation (649 | 5.3%), and Material Moving (386 | 3.2%).
Production, Transportation and Moving Occupations by Sex
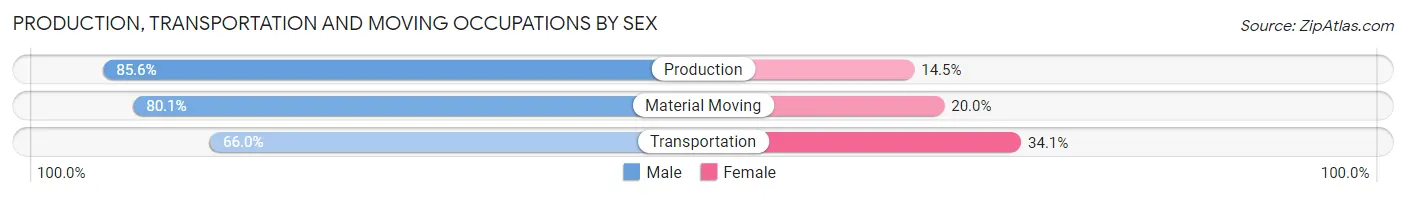
| Occupation | Male | Female |
| Production | 817 (85.6%) | 138 (14.4%) |
| Transportation | 428 (65.9%) | 221 (34.1%) |
| Material Moving | 309 (80.0%) | 77 (20.0%) |
| Total (Category) | 1,554 (78.1%) | 436 (21.9%) |
| Total (Overall) | 6,254 (51.2%) | 5,969 (48.8%) |
Employment Industries by Sex in Iberville Parish
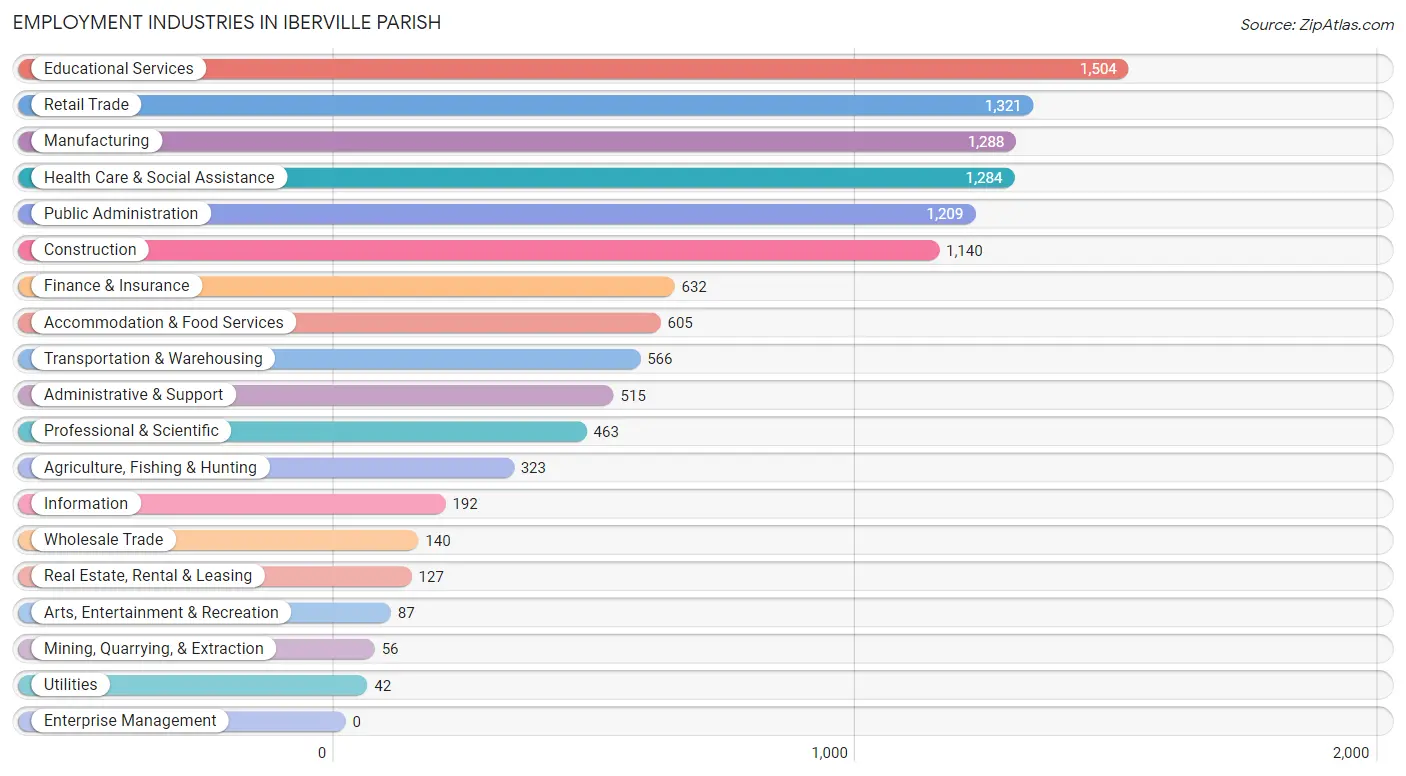
Employment Industries in Iberville Parish
The major employment industries in Iberville Parish include Educational Services (1,504 | 12.3%), Retail Trade (1,321 | 10.8%), Manufacturing (1,288 | 10.5%), Health Care & Social Assistance (1,284 | 10.5%), and Public Administration (1,209 | 9.9%).
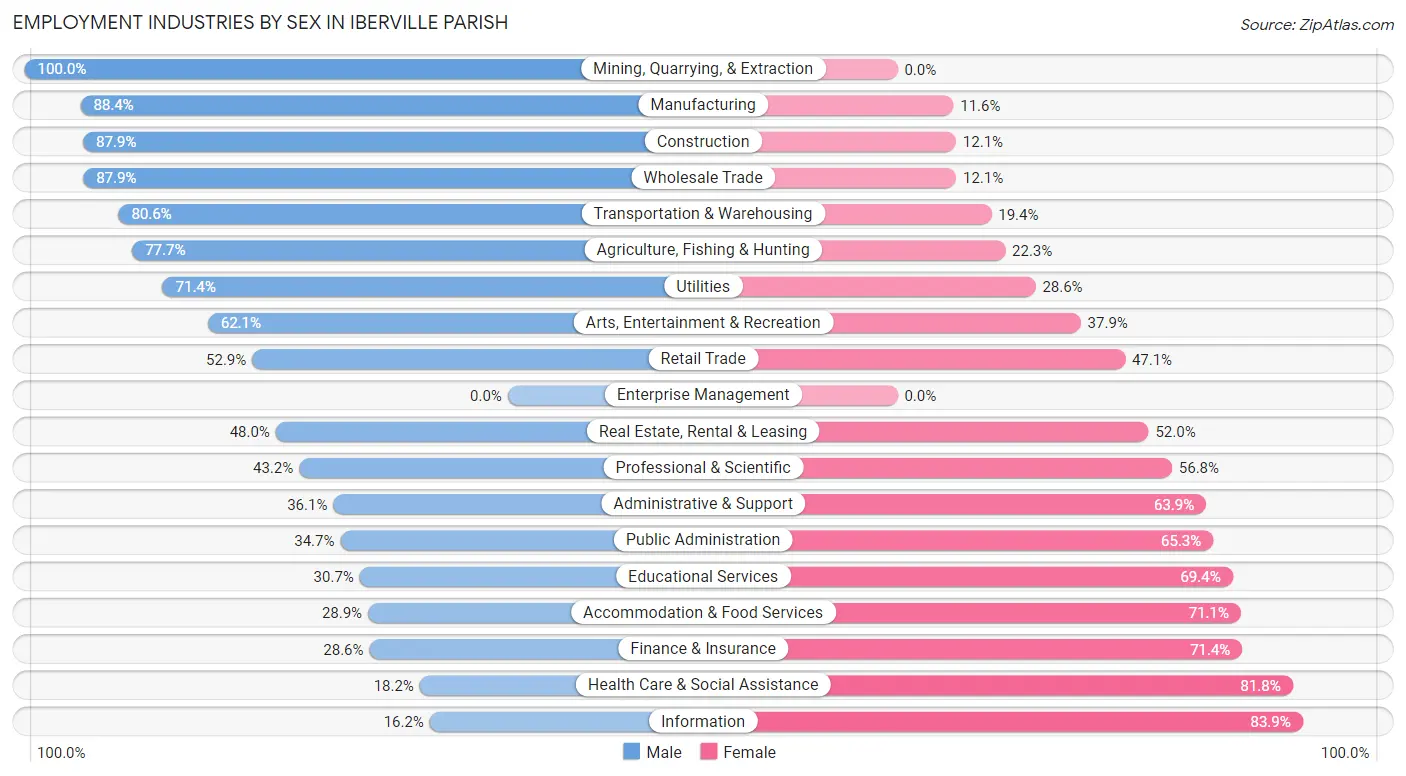
Employment Industries by Sex in Iberville Parish
The Iberville Parish industries that see more men than women are Mining, Quarrying, & Extraction (100.0%), Manufacturing (88.4%), and Construction (87.9%), whereas the industries that tend to have a higher number of women are Information (83.9%), Health Care & Social Assistance (81.8%), and Finance & Insurance (71.4%).
| Industry | Male | Female |
| Agriculture, Fishing & Hunting | 251 (77.7%) | 72 (22.3%) |
| Mining, Quarrying, & Extraction | 56 (100.0%) | 0 (0.0%) |
| Construction | 1,002 (87.9%) | 138 (12.1%) |
| Manufacturing | 1,139 (88.4%) | 149 (11.6%) |
| Wholesale Trade | 123 (87.9%) | 17 (12.1%) |
| Retail Trade | 699 (52.9%) | 622 (47.1%) |
| Transportation & Warehousing | 456 (80.6%) | 110 (19.4%) |
| Utilities | 30 (71.4%) | 12 (28.6%) |
| Information | 31 (16.2%) | 161 (83.9%) |
| Finance & Insurance | 181 (28.6%) | 451 (71.4%) |
| Real Estate, Rental & Leasing | 61 (48.0%) | 66 (52.0%) |
| Professional & Scientific | 200 (43.2%) | 263 (56.8%) |
| Enterprise Management | 0 (0.0%) | 0 (0.0%) |
| Administrative & Support | 186 (36.1%) | 329 (63.9%) |
| Educational Services | 461 (30.6%) | 1,043 (69.4%) |
| Health Care & Social Assistance | 234 (18.2%) | 1,050 (81.8%) |
| Arts, Entertainment & Recreation | 54 (62.1%) | 33 (37.9%) |
| Accommodation & Food Services | 175 (28.9%) | 430 (71.1%) |
| Public Administration | 419 (34.7%) | 790 (65.3%) |
| Total | 6,254 (51.2%) | 5,969 (48.8%) |
Education in Iberville Parish
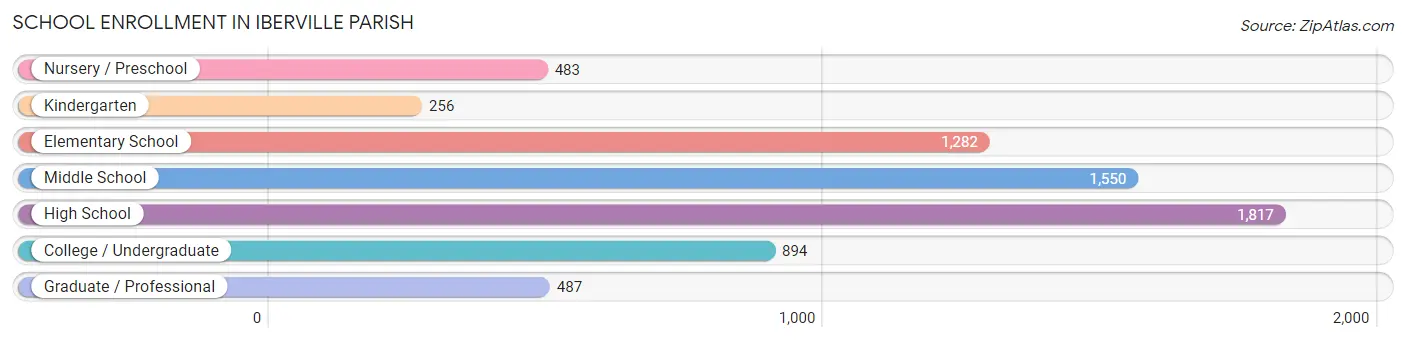
School Enrollment in Iberville Parish
The most common levels of schooling among the 6,769 students in Iberville Parish are high school (1,817 | 26.8%), middle school (1,550 | 22.9%), and elementary school (1,282 | 18.9%).
| School Level | # Students | % Students |
| Nursery / Preschool | 483 | 7.1% |
| Kindergarten | 256 | 3.8% |
| Elementary School | 1,282 | 18.9% |
| Middle School | 1,550 | 22.9% |
| High School | 1,817 | 26.8% |
| College / Undergraduate | 894 | 13.2% |
| Graduate / Professional | 487 | 7.2% |
| Total | 6,769 | 100.0% |
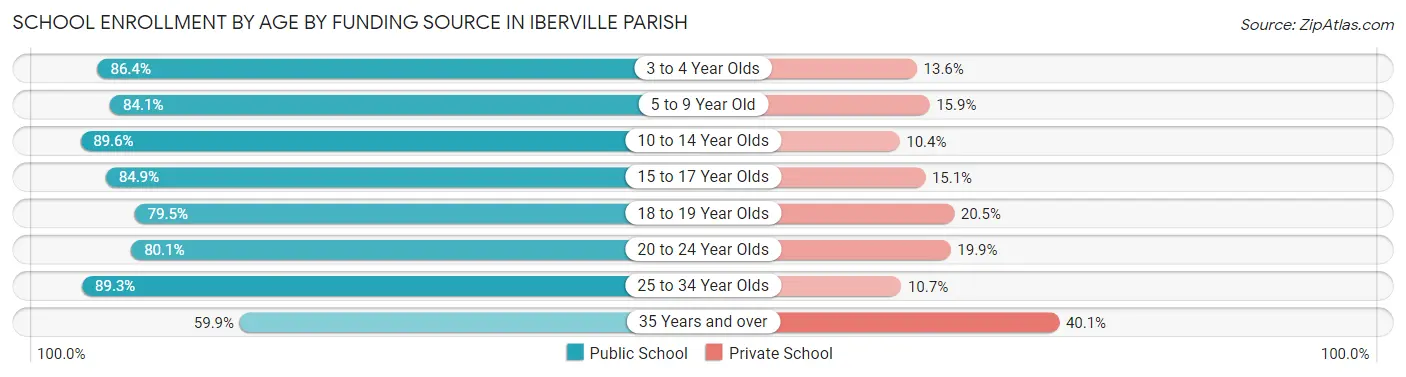
School Enrollment by Age by Funding Source in Iberville Parish
Out of a total of 6,769 students who are enrolled in schools in Iberville Parish, 1,110 (16.4%) attend a private institution, while the remaining 5,659 (83.6%) are enrolled in public schools. The age group of 35 years and over has the highest likelihood of being enrolled in private schools, with 231 (40.1% in the age bracket) enrolled. Conversely, the age group of 10 to 14 year olds has the lowest likelihood of being enrolled in a private school, with 1,704 (89.6% in the age bracket) attending a public institution.
| Age Bracket | Public School | Private School |
| 3 to 4 Year Olds | 318 (86.4%) | 50 (13.6%) |
| 5 to 9 Year Old | 1,339 (84.1%) | 254 (15.9%) |
| 10 to 14 Year Olds | 1,704 (89.6%) | 197 (10.4%) |
| 15 to 17 Year Olds | 852 (84.9%) | 152 (15.1%) |
| 18 to 19 Year Olds | 345 (79.5%) | 89 (20.5%) |
| 20 to 24 Year Olds | 363 (80.1%) | 90 (19.9%) |
| 25 to 34 Year Olds | 393 (89.3%) | 47 (10.7%) |
| 35 Years and over | 345 (59.9%) | 231 (40.1%) |
| Total | 5,659 (83.6%) | 1,110 (16.4%) |
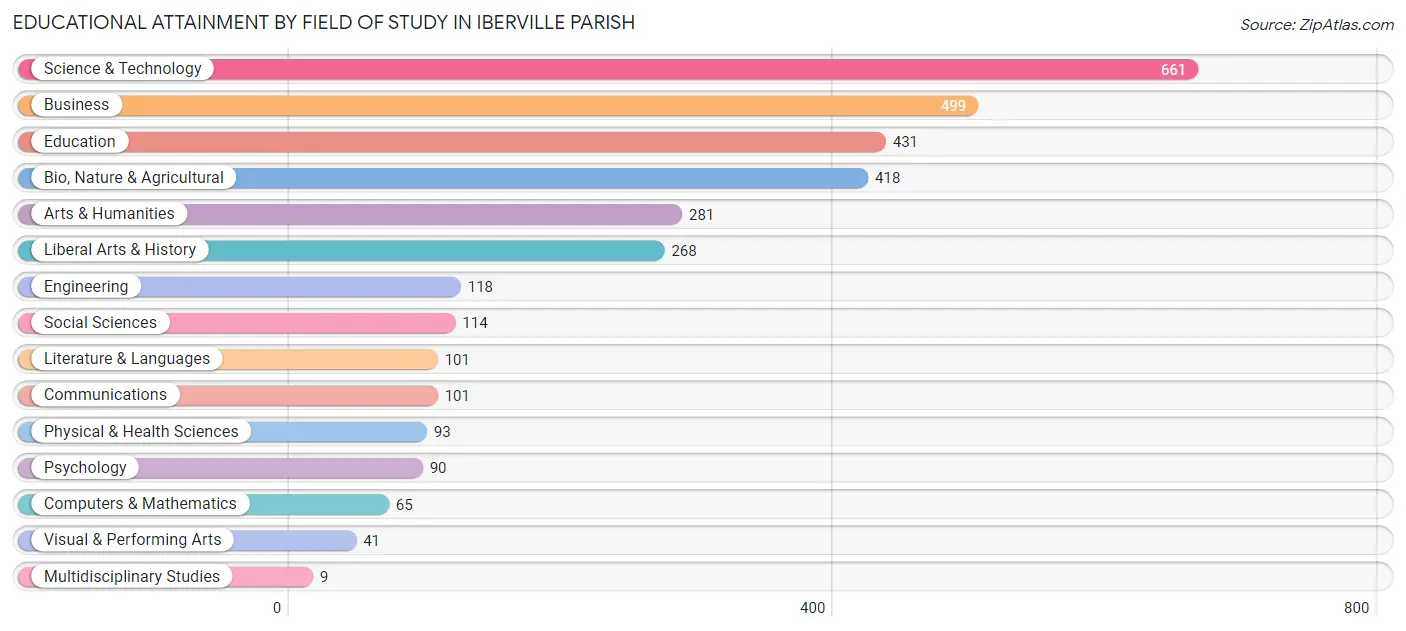
Educational Attainment by Field of Study in Iberville Parish
Science & technology (661 | 20.1%), business (499 | 15.2%), education (431 | 13.1%), bio, nature & agricultural (418 | 12.7%), and arts & humanities (281 | 8.5%) are the most common fields of study among 3,290 individuals in Iberville Parish who have obtained a bachelor's degree or higher.
| Field of Study | # Graduates | % Graduates |
| Computers & Mathematics | 65 | 2.0% |
| Bio, Nature & Agricultural | 418 | 12.7% |
| Physical & Health Sciences | 93 | 2.8% |
| Psychology | 90 | 2.7% |
| Social Sciences | 114 | 3.5% |
| Engineering | 118 | 3.6% |
| Multidisciplinary Studies | 9 | 0.3% |
| Science & Technology | 661 | 20.1% |
| Business | 499 | 15.2% |
| Education | 431 | 13.1% |
| Literature & Languages | 101 | 3.1% |
| Liberal Arts & History | 268 | 8.2% |
| Visual & Performing Arts | 41 | 1.3% |
| Communications | 101 | 3.1% |
| Arts & Humanities | 281 | 8.5% |
| Total | 3,290 | 100.0% |
Transportation & Commute in Iberville Parish
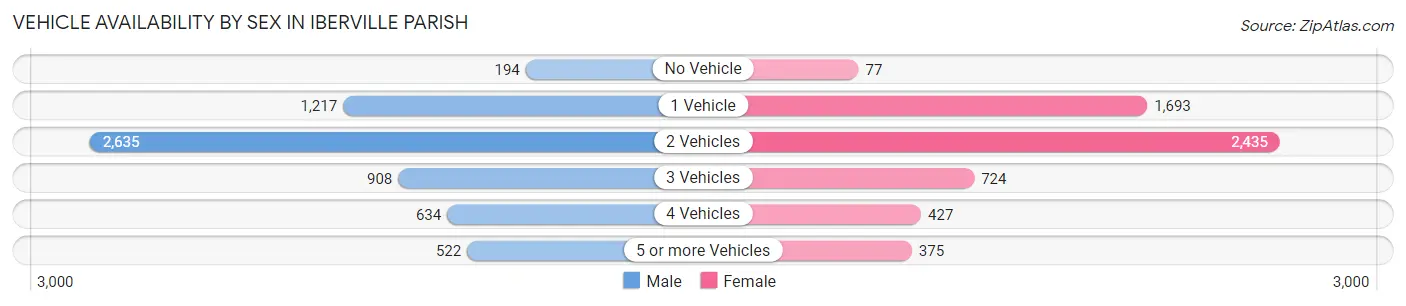
Vehicle Availability by Sex in Iberville Parish
The most prevalent vehicle ownership categories in Iberville Parish are males with 2 vehicles (2,635, accounting for 43.1%) and females with 2 vehicles (2,435, making up 46.0%).
| Vehicles Available | Male | Female |
| No Vehicle | 194 (3.2%) | 77 (1.3%) |
| 1 Vehicle | 1,217 (19.9%) | 1,693 (29.5%) |
| 2 Vehicles | 2,635 (43.1%) | 2,435 (42.5%) |
| 3 Vehicles | 908 (14.9%) | 724 (12.6%) |
| 4 Vehicles | 634 (10.4%) | 427 (7.4%) |
| 5 or more Vehicles | 522 (8.5%) | 375 (6.5%) |
| Total | 6,110 (100.0%) | 5,731 (100.0%) |
Commute Time in Iberville Parish
The most frequently occuring commute durations in Iberville Parish are 5 to 9 minutes (2,023 commuters, 17.7%), 30 to 34 minutes (1,469 commuters, 12.9%), and 20 to 24 minutes (1,418 commuters, 12.4%).
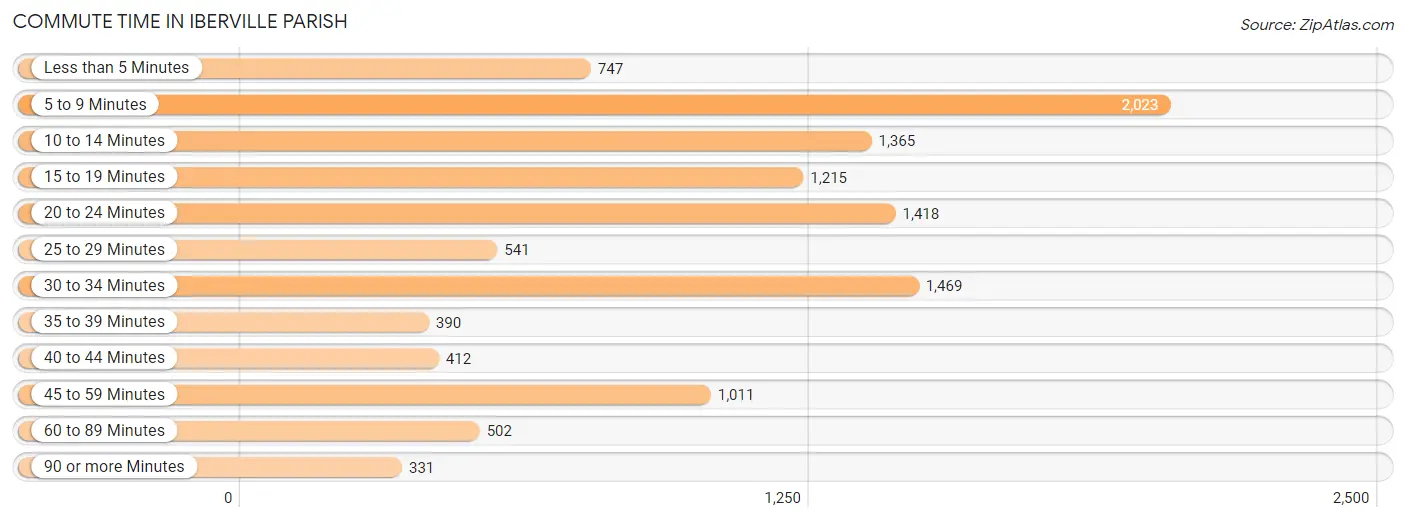
| Commute Time | # Commuters | % Commuters |
| Less than 5 Minutes | 747 | 6.5% |
| 5 to 9 Minutes | 2,023 | 17.7% |
| 10 to 14 Minutes | 1,365 | 11.9% |
| 15 to 19 Minutes | 1,215 | 10.6% |
| 20 to 24 Minutes | 1,418 | 12.4% |
| 25 to 29 Minutes | 541 | 4.7% |
| 30 to 34 Minutes | 1,469 | 12.9% |
| 35 to 39 Minutes | 390 | 3.4% |
| 40 to 44 Minutes | 412 | 3.6% |
| 45 to 59 Minutes | 1,011 | 8.8% |
| 60 to 89 Minutes | 502 | 4.4% |
| 90 or more Minutes | 331 | 2.9% |
Commute Time by Sex in Iberville Parish
The most common commute times in Iberville Parish are 5 to 9 minutes (1,011 commuters, 16.6%) for males and 5 to 9 minutes (1,012 commuters, 18.9%) for females.
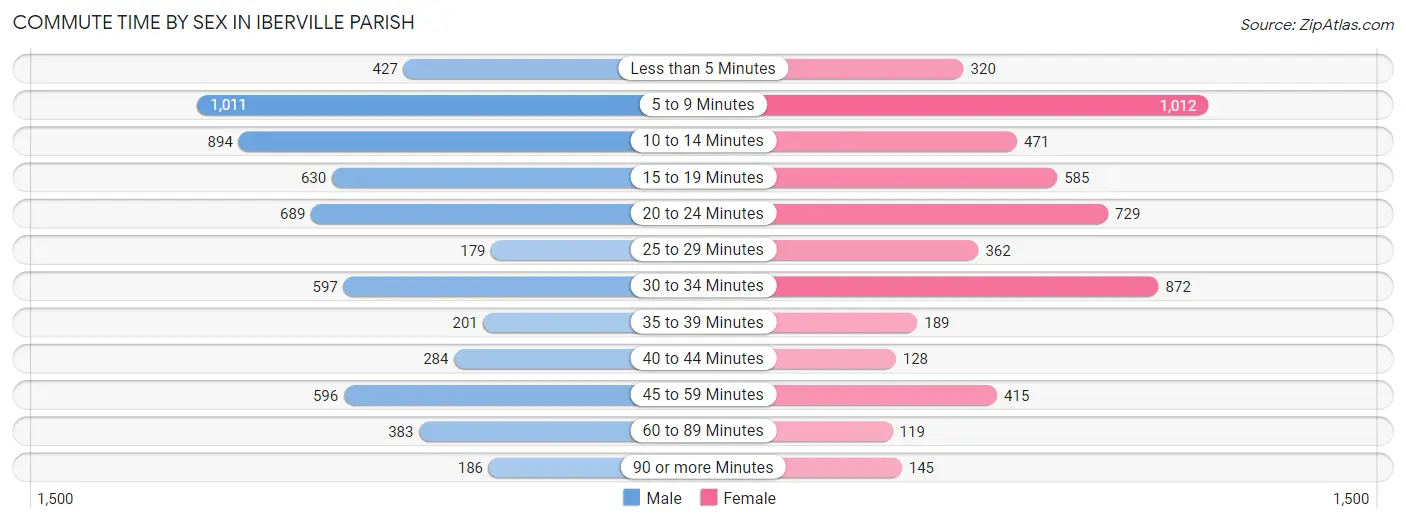
| Commute Time | Male | Female |
| Less than 5 Minutes | 427 (7.0%) | 320 (6.0%) |
| 5 to 9 Minutes | 1,011 (16.6%) | 1,012 (18.9%) |
| 10 to 14 Minutes | 894 (14.7%) | 471 (8.8%) |
| 15 to 19 Minutes | 630 (10.4%) | 585 (10.9%) |
| 20 to 24 Minutes | 689 (11.3%) | 729 (13.6%) |
| 25 to 29 Minutes | 179 (2.9%) | 362 (6.8%) |
| 30 to 34 Minutes | 597 (9.8%) | 872 (16.3%) |
| 35 to 39 Minutes | 201 (3.3%) | 189 (3.5%) |
| 40 to 44 Minutes | 284 (4.7%) | 128 (2.4%) |
| 45 to 59 Minutes | 596 (9.8%) | 415 (7.8%) |
| 60 to 89 Minutes | 383 (6.3%) | 119 (2.2%) |
| 90 or more Minutes | 186 (3.1%) | 145 (2.7%) |
Time of Departure to Work by Sex in Iberville Parish
The most frequent times of departure to work in Iberville Parish are 12:00 AM to 4:59 AM (1,097, 18.0%) for males and 7:00 AM to 7:29 AM (1,066, 19.9%) for females.
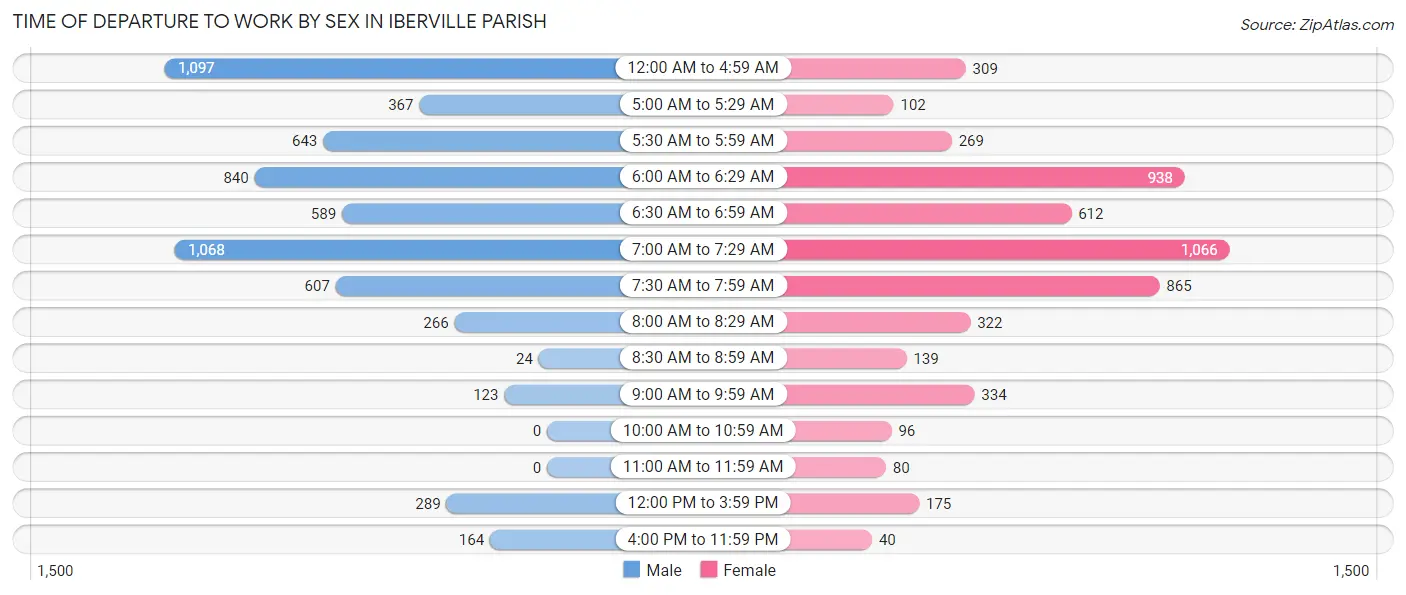
| Time of Departure | Male | Female |
| 12:00 AM to 4:59 AM | 1,097 (18.0%) | 309 (5.8%) |
| 5:00 AM to 5:29 AM | 367 (6.0%) | 102 (1.9%) |
| 5:30 AM to 5:59 AM | 643 (10.6%) | 269 (5.0%) |
| 6:00 AM to 6:29 AM | 840 (13.8%) | 938 (17.5%) |
| 6:30 AM to 6:59 AM | 589 (9.7%) | 612 (11.5%) |
| 7:00 AM to 7:29 AM | 1,068 (17.6%) | 1,066 (19.9%) |
| 7:30 AM to 7:59 AM | 607 (10.0%) | 865 (16.2%) |
| 8:00 AM to 8:29 AM | 266 (4.4%) | 322 (6.0%) |
| 8:30 AM to 8:59 AM | 24 (0.4%) | 139 (2.6%) |
| 9:00 AM to 9:59 AM | 123 (2.0%) | 334 (6.2%) |
| 10:00 AM to 10:59 AM | 0 (0.0%) | 96 (1.8%) |
| 11:00 AM to 11:59 AM | 0 (0.0%) | 80 (1.5%) |
| 12:00 PM to 3:59 PM | 289 (4.8%) | 175 (3.3%) |
| 4:00 PM to 11:59 PM | 164 (2.7%) | 40 (0.7%) |
| Total | 6,077 (100.0%) | 5,347 (100.0%) |
Housing Occupancy in Iberville Parish
Occupancy by Ownership in Iberville Parish
Of the total 11,042 dwellings in Iberville Parish, owner-occupied units account for 8,228 (74.5%), while renter-occupied units make up 2,814 (25.5%).
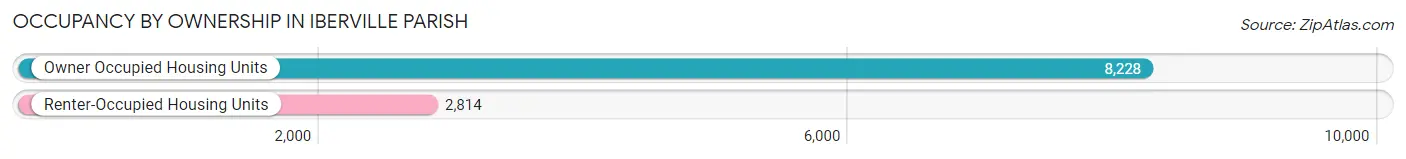
| Occupancy | # Housing Units | % Housing Units |
| Owner Occupied Housing Units | 8,228 | 74.5% |
| Renter-Occupied Housing Units | 2,814 | 25.5% |
| Total Occupied Housing Units | 11,042 | 100.0% |
Occupancy by Household Size in Iberville Parish
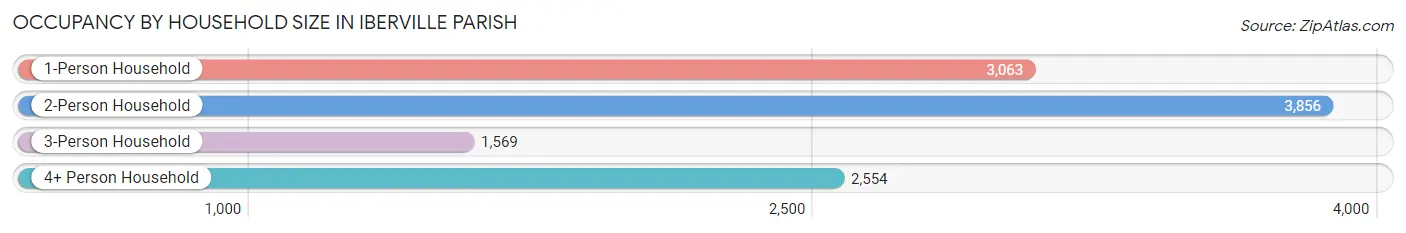
| Household Size | # Housing Units | % Housing Units |
| 1-Person Household | 3,063 | 27.7% |
| 2-Person Household | 3,856 | 34.9% |
| 3-Person Household | 1,569 | 14.2% |
| 4+ Person Household | 2,554 | 23.1% |
| Total Housing Units | 11,042 | 100.0% |
Occupancy by Ownership by Household Size in Iberville Parish
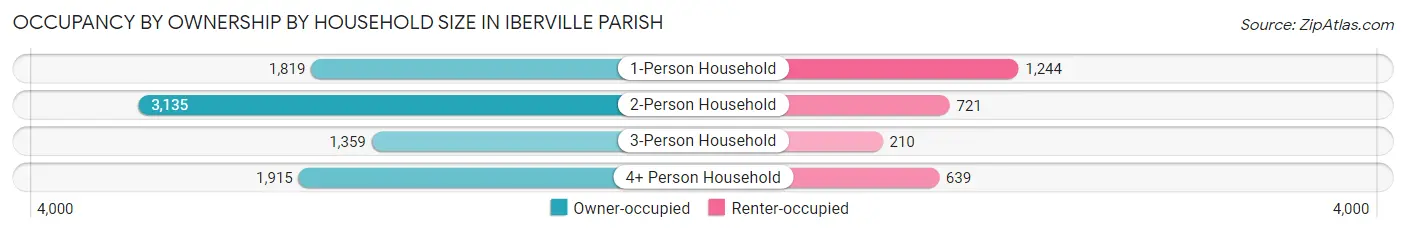
| Household Size | Owner-occupied | Renter-occupied |
| 1-Person Household | 1,819 (59.4%) | 1,244 (40.6%) |
| 2-Person Household | 3,135 (81.3%) | 721 (18.7%) |
| 3-Person Household | 1,359 (86.6%) | 210 (13.4%) |
| 4+ Person Household | 1,915 (75.0%) | 639 (25.0%) |
| Total Housing Units | 8,228 (74.5%) | 2,814 (25.5%) |
Occupancy by Educational Attainment in Iberville Parish
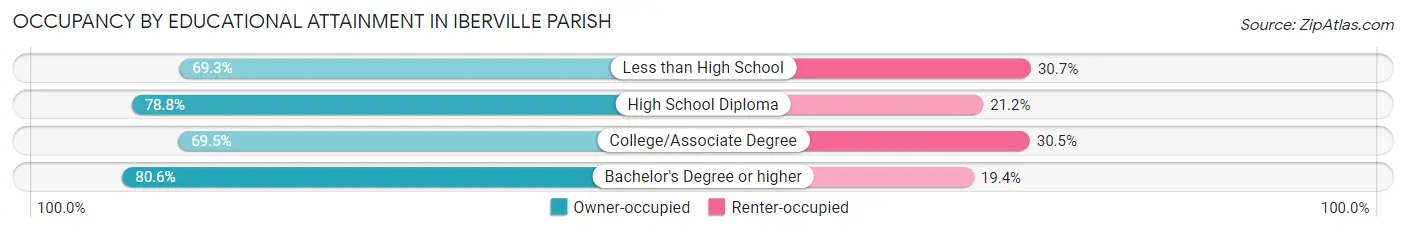
| Household Size | Owner-occupied | Renter-occupied |
| Less than High School | 1,287 (69.3%) | 570 (30.7%) |
| High School Diploma | 2,955 (78.8%) | 797 (21.2%) |
| College/Associate Degree | 2,472 (69.5%) | 1,083 (30.5%) |
| Bachelor's Degree or higher | 1,514 (80.6%) | 364 (19.4%) |
Occupancy by Age of Householder in Iberville Parish
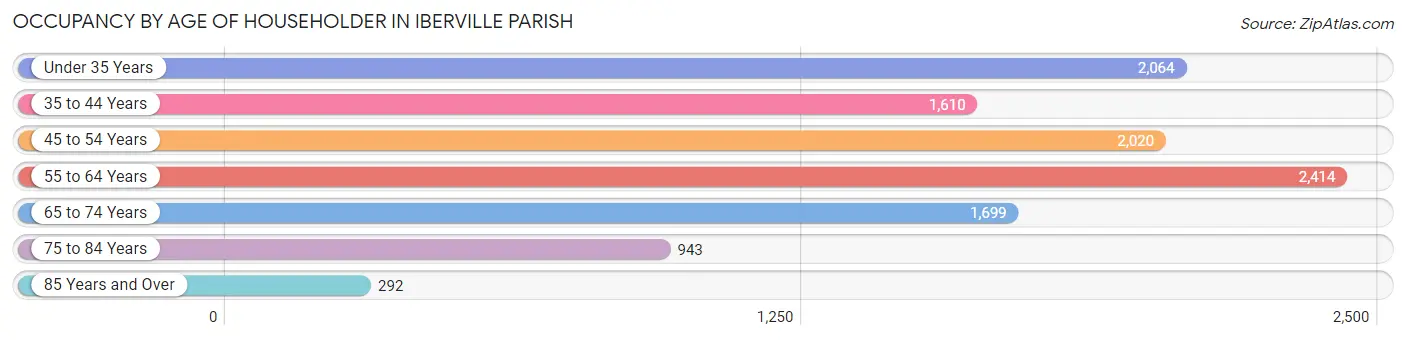
| Age Bracket | # Households | % Households |
| Under 35 Years | 2,064 | 18.7% |
| 35 to 44 Years | 1,610 | 14.6% |
| 45 to 54 Years | 2,020 | 18.3% |
| 55 to 64 Years | 2,414 | 21.9% |
| 65 to 74 Years | 1,699 | 15.4% |
| 75 to 84 Years | 943 | 8.5% |
| 85 Years and Over | 292 | 2.6% |
| Total | 11,042 | 100.0% |
Housing Finances in Iberville Parish
Median Income by Occupancy in Iberville Parish
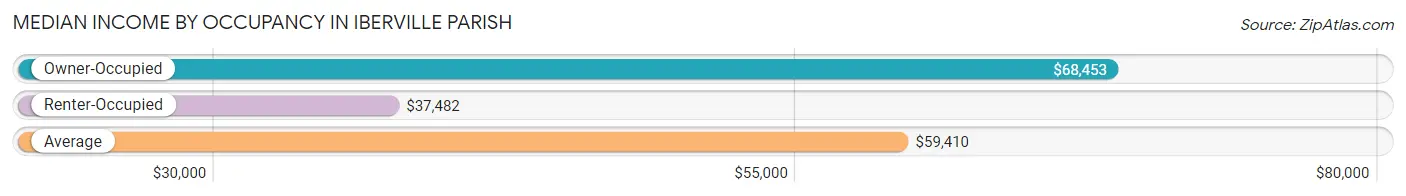
| Occupancy Type | # Households | Median Income |
| Owner-Occupied | 8,228 (74.5%) | $68,453 |
| Renter-Occupied | 2,814 (25.5%) | $37,482 |
| Average | 11,042 (100.0%) | $59,410 |
Occupancy by Householder Income Bracket in Iberville Parish
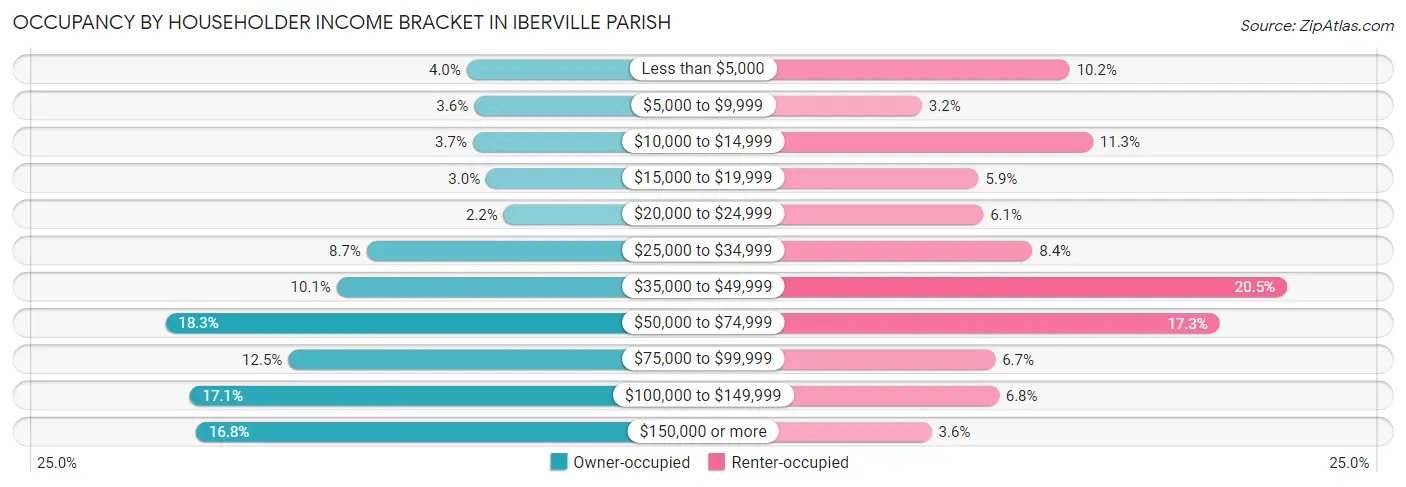
| Income Bracket | Owner-occupied | Renter-occupied |
| Less than $5,000 | 325 (4.0%) | 287 (10.2%) |
| $5,000 to $9,999 | 296 (3.6%) | 89 (3.2%) |
| $10,000 to $14,999 | 301 (3.7%) | 318 (11.3%) |
| $15,000 to $19,999 | 249 (3.0%) | 165 (5.9%) |
| $20,000 to $24,999 | 180 (2.2%) | 171 (6.1%) |
| $25,000 to $34,999 | 717 (8.7%) | 237 (8.4%) |
| $35,000 to $49,999 | 834 (10.1%) | 578 (20.5%) |
| $50,000 to $74,999 | 1,506 (18.3%) | 488 (17.3%) |
| $75,000 to $99,999 | 1,024 (12.4%) | 187 (6.7%) |
| $100,000 to $149,999 | 1,410 (17.1%) | 192 (6.8%) |
| $150,000 or more | 1,386 (16.8%) | 102 (3.6%) |
| Total | 8,228 (100.0%) | 2,814 (100.0%) |
Monthly Housing Cost Tiers in Iberville Parish
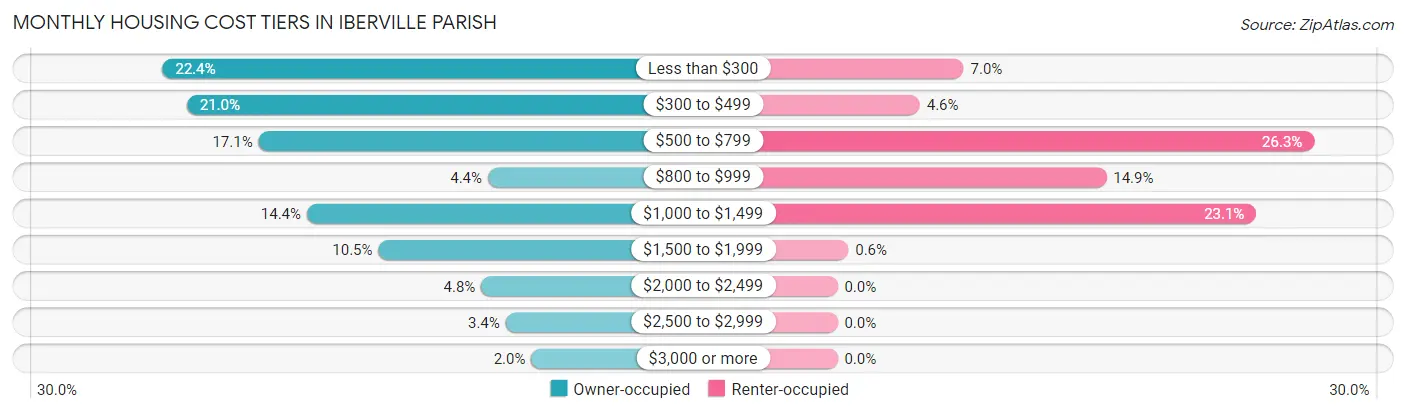
| Monthly Cost | Owner-occupied | Renter-occupied |
| Less than $300 | 1,842 (22.4%) | 196 (7.0%) |
| $300 to $499 | 1,731 (21.0%) | 128 (4.5%) |
| $500 to $799 | 1,405 (17.1%) | 741 (26.3%) |
| $800 to $999 | 363 (4.4%) | 418 (14.8%) |
| $1,000 to $1,499 | 1,186 (14.4%) | 651 (23.1%) |
| $1,500 to $1,999 | 861 (10.5%) | 17 (0.6%) |
| $2,000 to $2,499 | 393 (4.8%) | 0 (0.0%) |
| $2,500 to $2,999 | 282 (3.4%) | 0 (0.0%) |
| $3,000 or more | 165 (2.0%) | 0 (0.0%) |
| Total | 8,228 (100.0%) | 2,814 (100.0%) |
Physical Housing Characteristics in Iberville Parish
Housing Structures in Iberville Parish
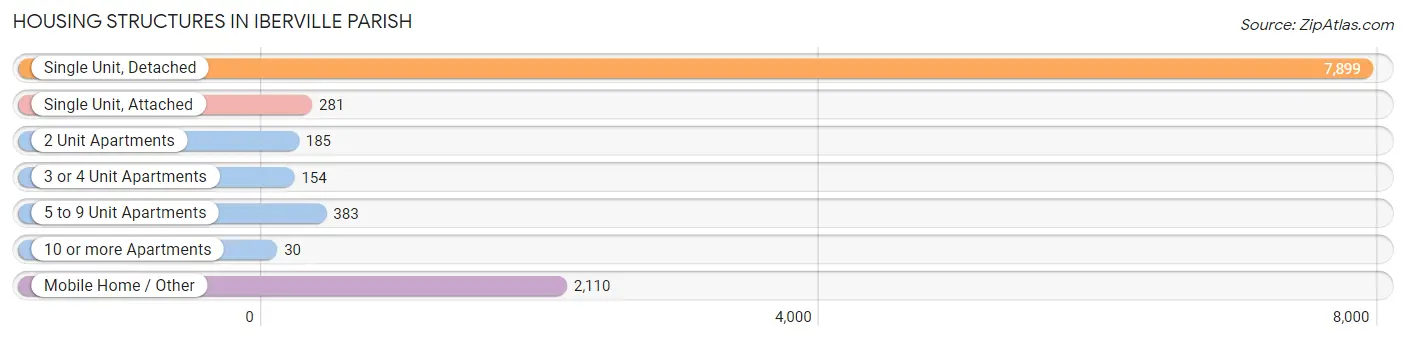
| Structure Type | # Housing Units | % Housing Units |
| Single Unit, Detached | 7,899 | 71.5% |
| Single Unit, Attached | 281 | 2.5% |
| 2 Unit Apartments | 185 | 1.7% |
| 3 or 4 Unit Apartments | 154 | 1.4% |
| 5 to 9 Unit Apartments | 383 | 3.5% |
| 10 or more Apartments | 30 | 0.3% |
| Mobile Home / Other | 2,110 | 19.1% |
| Total | 11,042 | 100.0% |
Housing Structures by Occupancy in Iberville Parish
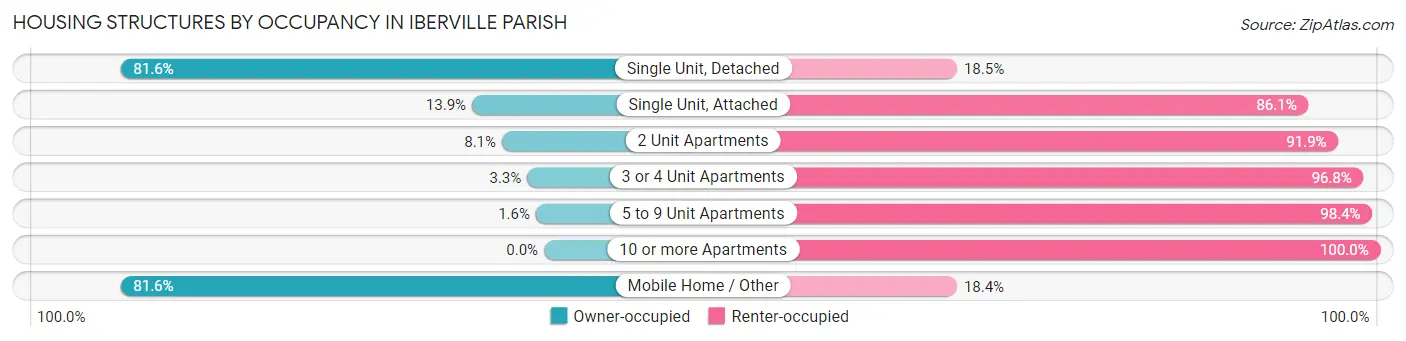
| Structure Type | Owner-occupied | Renter-occupied |
| Single Unit, Detached | 6,442 (81.6%) | 1,457 (18.4%) |
| Single Unit, Attached | 39 (13.9%) | 242 (86.1%) |
| 2 Unit Apartments | 15 (8.1%) | 170 (91.9%) |
| 3 or 4 Unit Apartments | 5 (3.3%) | 149 (96.8%) |
| 5 to 9 Unit Apartments | 6 (1.6%) | 377 (98.4%) |
| 10 or more Apartments | 0 (0.0%) | 30 (100.0%) |
| Mobile Home / Other | 1,721 (81.6%) | 389 (18.4%) |
| Total | 8,228 (74.5%) | 2,814 (25.5%) |
Housing Structures by Number of Rooms in Iberville Parish
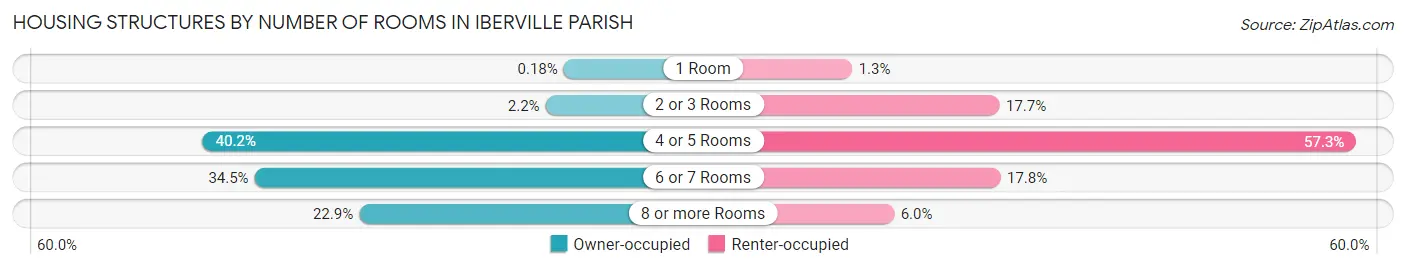
| Number of Rooms | Owner-occupied | Renter-occupied |
| 1 Room | 15 (0.2%) | 37 (1.3%) |
| 2 or 3 Rooms | 181 (2.2%) | 497 (17.7%) |
| 4 or 5 Rooms | 3,311 (40.2%) | 1,612 (57.3%) |
| 6 or 7 Rooms | 2,838 (34.5%) | 500 (17.8%) |
| 8 or more Rooms | 1,883 (22.9%) | 168 (6.0%) |
| Total | 8,228 (100.0%) | 2,814 (100.0%) |
Housing Structure by Heating Type in Iberville Parish
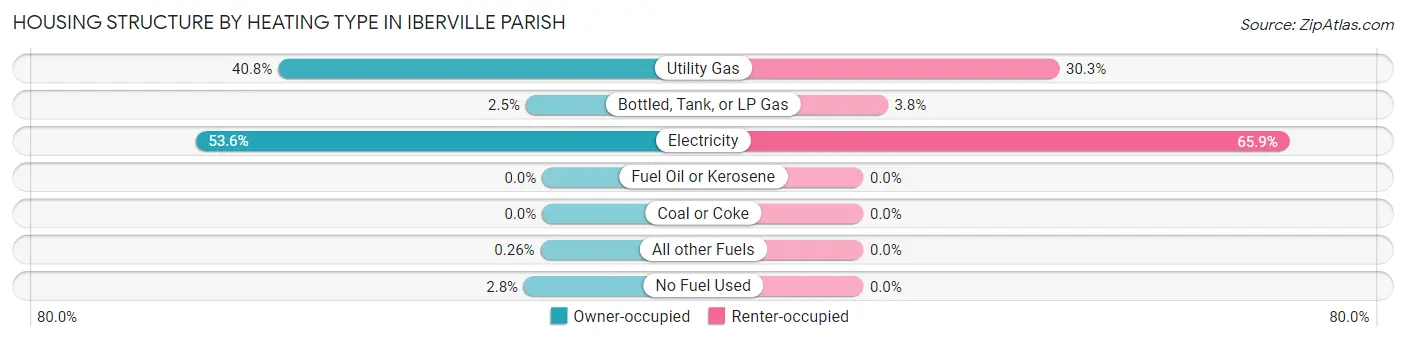
| Heating Type | Owner-occupied | Renter-occupied |
| Utility Gas | 3,358 (40.8%) | 853 (30.3%) |
| Bottled, Tank, or LP Gas | 208 (2.5%) | 106 (3.8%) |
| Electricity | 4,410 (53.6%) | 1,855 (65.9%) |
| Fuel Oil or Kerosene | 0 (0.0%) | 0 (0.0%) |
| Coal or Coke | 0 (0.0%) | 0 (0.0%) |
| All other Fuels | 21 (0.3%) | 0 (0.0%) |
| No Fuel Used | 231 (2.8%) | 0 (0.0%) |
| Total | 8,228 (100.0%) | 2,814 (100.0%) |
Household Vehicle Usage in Iberville Parish
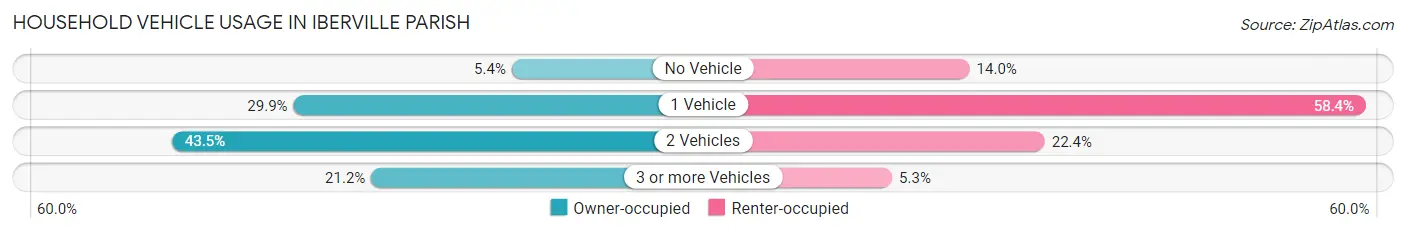
| Vehicles per Household | Owner-occupied | Renter-occupied |
| No Vehicle | 447 (5.4%) | 393 (14.0%) |
| 1 Vehicle | 2,459 (29.9%) | 1,642 (58.4%) |
| 2 Vehicles | 3,579 (43.5%) | 630 (22.4%) |
| 3 or more Vehicles | 1,743 (21.2%) | 149 (5.3%) |
| Total | 8,228 (100.0%) | 2,814 (100.0%) |
Real Estate & Mortgages in Iberville Parish
Real Estate and Mortgage Overview in Iberville Parish
| Characteristic | Without Mortgage | With Mortgage |
| Housing Units | 4,257 | 3,971 |
| Median Property Value | $140,100 | $196,300 |
| Median Household Income | $58,386 | $973 |
| Monthly Housing Costs | $333 | $165 |
| Real Estate Taxes | $305 | $598 |
Property Value by Mortgage Status in Iberville Parish
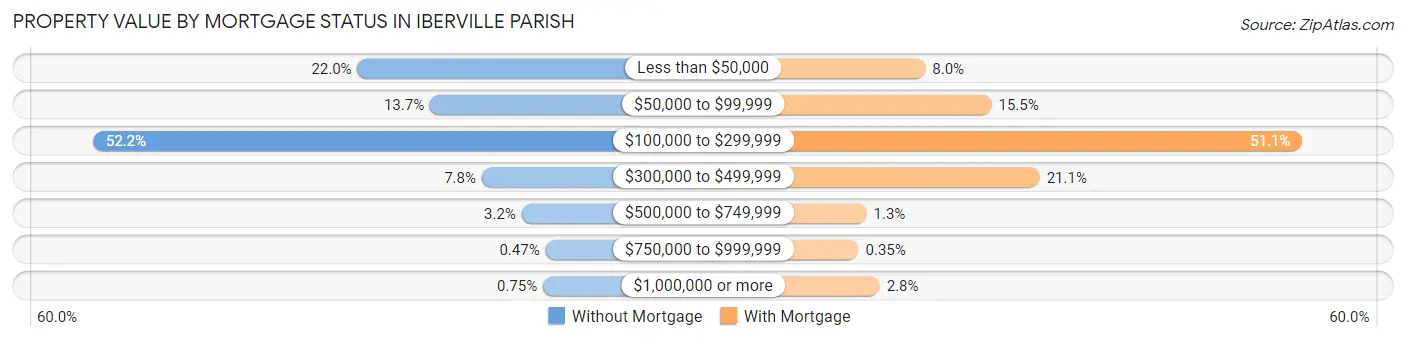
| Property Value | Without Mortgage | With Mortgage |
| Less than $50,000 | 935 (22.0%) | 317 (8.0%) |
| $50,000 to $99,999 | 582 (13.7%) | 617 (15.5%) |
| $100,000 to $299,999 | 2,222 (52.2%) | 2,027 (51.0%) |
| $300,000 to $499,999 | 330 (7.7%) | 836 (21.0%) |
| $500,000 to $749,999 | 136 (3.2%) | 50 (1.3%) |
| $750,000 to $999,999 | 20 (0.5%) | 14 (0.4%) |
| $1,000,000 or more | 32 (0.7%) | 110 (2.8%) |
| Total | 4,257 (100.0%) | 3,971 (100.0%) |
Household Income by Mortgage Status in Iberville Parish
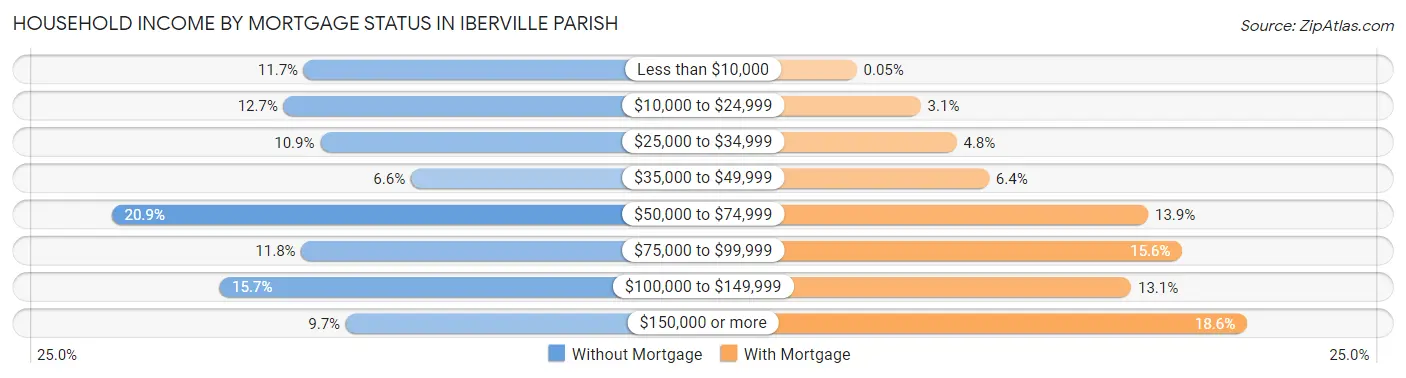
| Household Income | Without Mortgage | With Mortgage |
| Less than $10,000 | 498 (11.7%) | 2 (0.1%) |
| $10,000 to $24,999 | 539 (12.7%) | 123 (3.1%) |
| $25,000 to $34,999 | 465 (10.9%) | 191 (4.8%) |
| $35,000 to $49,999 | 281 (6.6%) | 252 (6.4%) |
| $50,000 to $74,999 | 888 (20.9%) | 553 (13.9%) |
| $75,000 to $99,999 | 503 (11.8%) | 618 (15.6%) |
| $100,000 to $149,999 | 670 (15.7%) | 521 (13.1%) |
| $150,000 or more | 413 (9.7%) | 740 (18.6%) |
| Total | 4,257 (100.0%) | 3,971 (100.0%) |
Property Value to Household Income Ratio in Iberville Parish
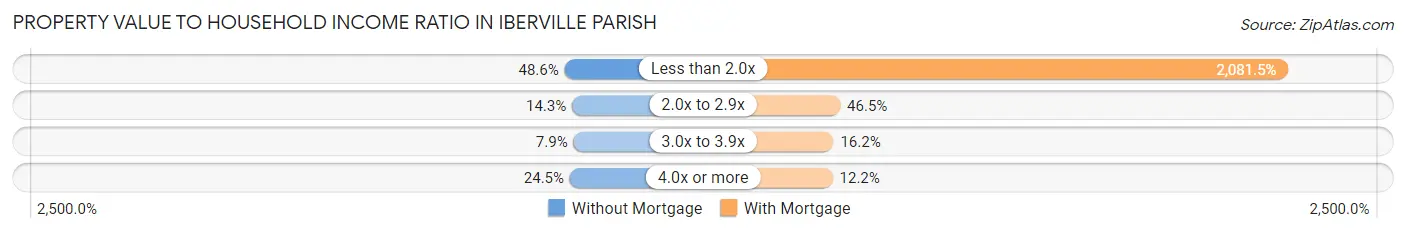
| Value-to-Income Ratio | Without Mortgage | With Mortgage |
| Less than 2.0x | 2,069 (48.6%) | 82,656 (2,081.5%) |
| 2.0x to 2.9x | 610 (14.3%) | 1,845 (46.5%) |
| 3.0x to 3.9x | 335 (7.9%) | 644 (16.2%) |
| 4.0x or more | 1,041 (24.4%) | 486 (12.2%) |
| Total | 4,257 (100.0%) | 3,971 (100.0%) |
Real Estate Taxes by Mortgage Status in Iberville Parish
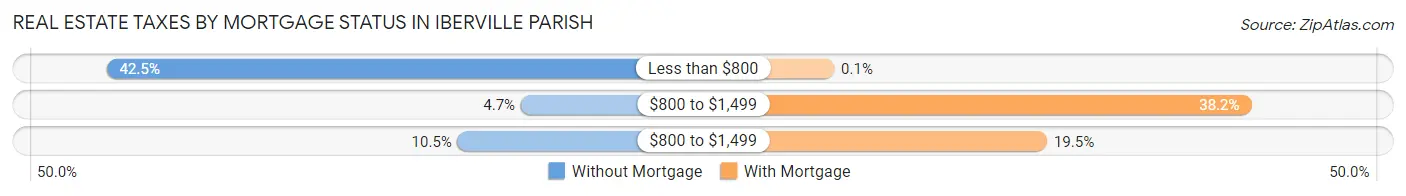
| Property Taxes | Without Mortgage | With Mortgage |
| Less than $800 | 1,810 (42.5%) | 4 (0.1%) |
| $800 to $1,499 | 199 (4.7%) | 1,517 (38.2%) |
| $800 to $1,499 | 445 (10.4%) | 776 (19.5%) |
| Total | 4,257 (100.0%) | 3,971 (100.0%) |
Health & Disability in Iberville Parish
Health Insurance Coverage by Age in Iberville Parish
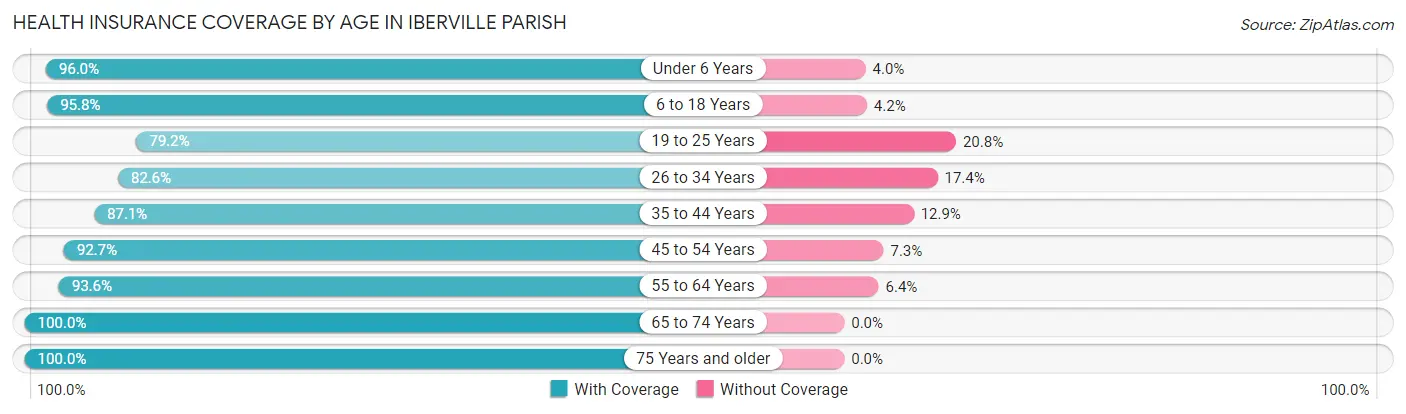
| Age Bracket | With Coverage | Without Coverage |
| Under 6 Years | 1,743 (96.0%) | 72 (4.0%) |
| 6 to 18 Years | 4,558 (95.8%) | 201 (4.2%) |
| 19 to 25 Years | 1,923 (79.2%) | 506 (20.8%) |
| 26 to 34 Years | 2,807 (82.6%) | 591 (17.4%) |
| 35 to 44 Years | 2,778 (87.1%) | 413 (12.9%) |
| 45 to 54 Years | 3,002 (92.7%) | 237 (7.3%) |
| 55 to 64 Years | 3,529 (93.6%) | 241 (6.4%) |
| 65 to 74 Years | 2,864 (100.0%) | 0 (0.0%) |
| 75 Years and older | 1,923 (100.0%) | 0 (0.0%) |
| Total | 25,127 (91.7%) | 2,261 (8.3%) |
Health Insurance Coverage by Citizenship Status in Iberville Parish
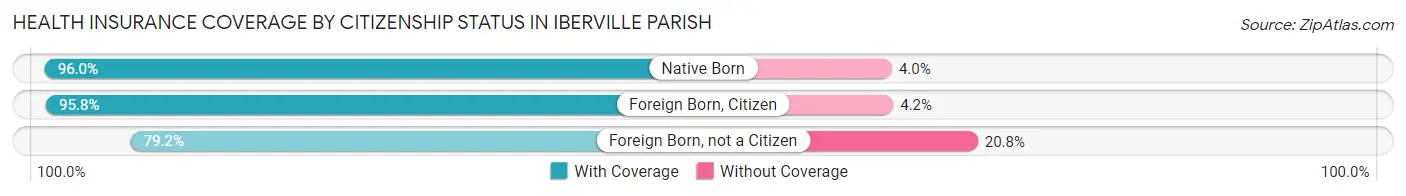
| Citizenship Status | With Coverage | Without Coverage |
| Native Born | 1,743 (96.0%) | 72 (4.0%) |
| Foreign Born, Citizen | 4,558 (95.8%) | 201 (4.2%) |
| Foreign Born, not a Citizen | 1,923 (79.2%) | 506 (20.8%) |
Health Insurance Coverage by Household Income in Iberville Parish
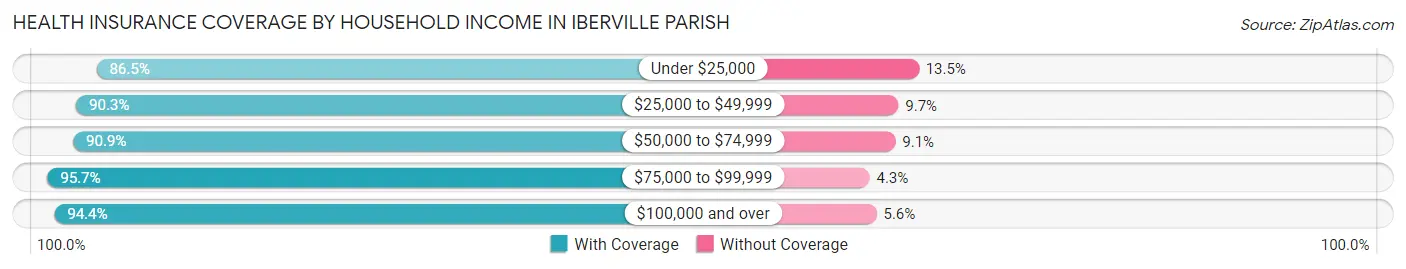
| Household Income | With Coverage | Without Coverage |
| Under $25,000 | 3,881 (86.5%) | 604 (13.5%) |
| $25,000 to $49,999 | 4,469 (90.3%) | 478 (9.7%) |
| $50,000 to $74,999 | 4,449 (90.9%) | 445 (9.1%) |
| $75,000 to $99,999 | 2,945 (95.7%) | 131 (4.3%) |
| $100,000 and over | 9,319 (94.4%) | 550 (5.6%) |
Public vs Private Health Insurance Coverage by Age in Iberville Parish
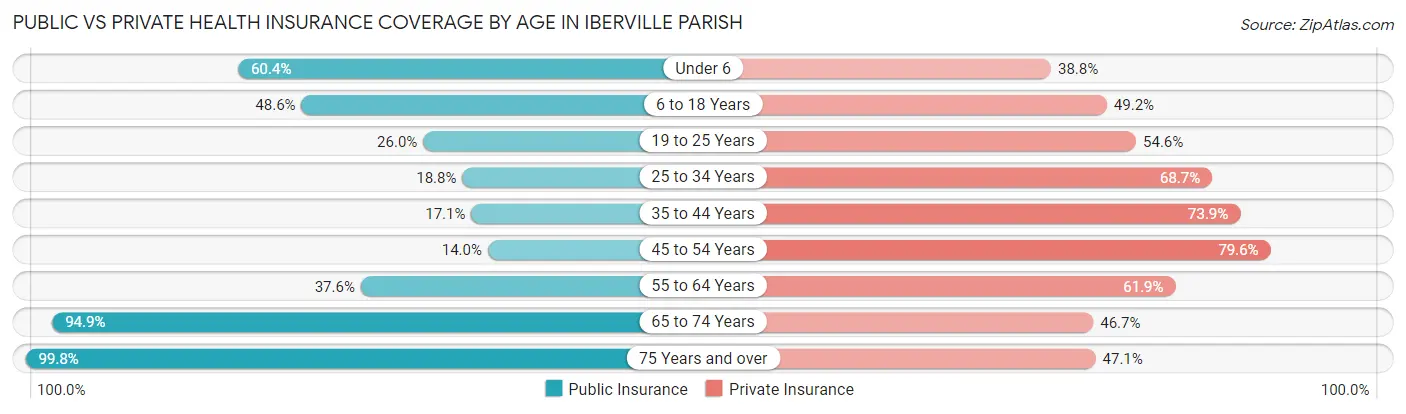
| Age Bracket | Public Insurance | Private Insurance |
| Under 6 | 1,096 (60.4%) | 705 (38.8%) |
| 6 to 18 Years | 2,314 (48.6%) | 2,342 (49.2%) |
| 19 to 25 Years | 632 (26.0%) | 1,327 (54.6%) |
| 25 to 34 Years | 637 (18.8%) | 2,335 (68.7%) |
| 35 to 44 Years | 545 (17.1%) | 2,359 (73.9%) |
| 45 to 54 Years | 454 (14.0%) | 2,577 (79.6%) |
| 55 to 64 Years | 1,418 (37.6%) | 2,334 (61.9%) |
| 65 to 74 Years | 2,717 (94.9%) | 1,337 (46.7%) |
| 75 Years and over | 1,920 (99.8%) | 906 (47.1%) |
| Total | 11,733 (42.8%) | 16,222 (59.2%) |
Disability Status by Sex by Age in Iberville Parish
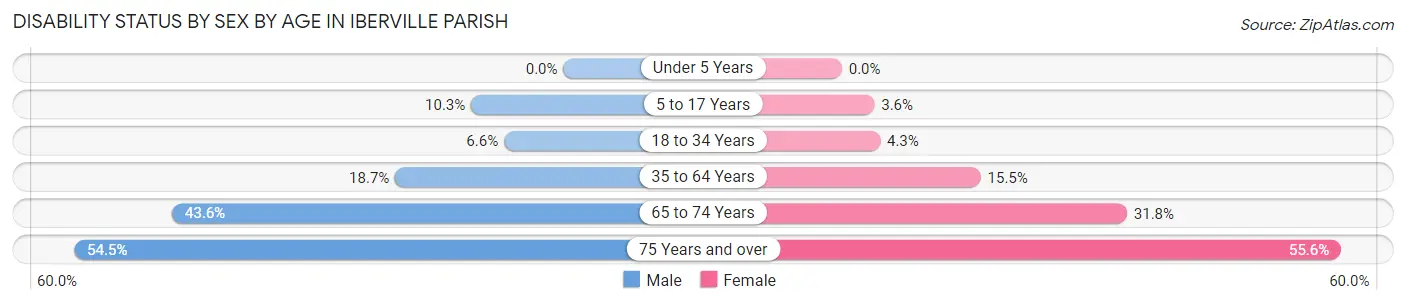
| Age Bracket | Male | Female |
| Under 5 Years | 0 (0.0%) | 0 (0.0%) |
| 5 to 17 Years | 255 (10.3%) | 76 (3.6%) |
| 18 to 34 Years | 215 (6.6%) | 126 (4.3%) |
| 35 to 64 Years | 882 (18.7%) | 849 (15.5%) |
| 65 to 74 Years | 544 (43.6%) | 513 (31.8%) |
| 75 Years and over | 401 (54.5%) | 660 (55.6%) |
Disability Class by Sex by Age in Iberville Parish
Disability Class: Hearing Difficulty
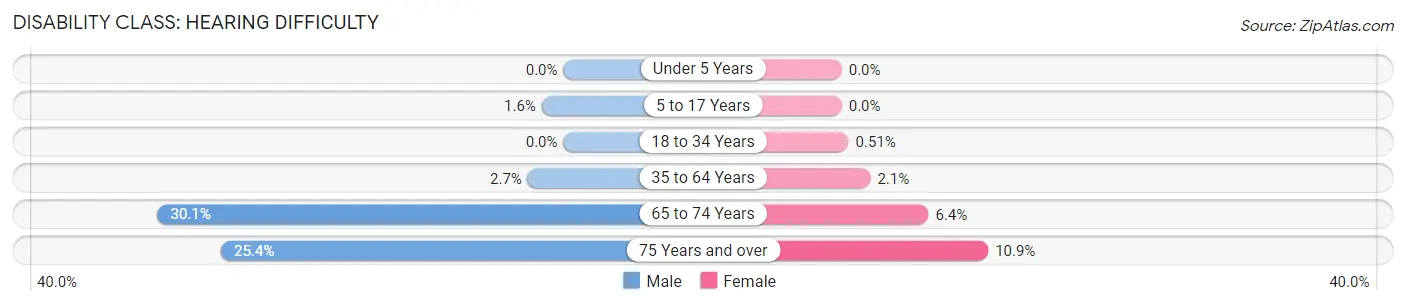
| Age Bracket | Male | Female |
| Under 5 Years | 0 (0.0%) | 0 (0.0%) |
| 5 to 17 Years | 40 (1.6%) | 0 (0.0%) |
| 18 to 34 Years | 0 (0.0%) | 15 (0.5%) |
| 35 to 64 Years | 125 (2.6%) | 117 (2.1%) |
| 65 to 74 Years | 376 (30.1%) | 104 (6.4%) |
| 75 Years and over | 187 (25.4%) | 129 (10.9%) |
Disability Class: Vision Difficulty
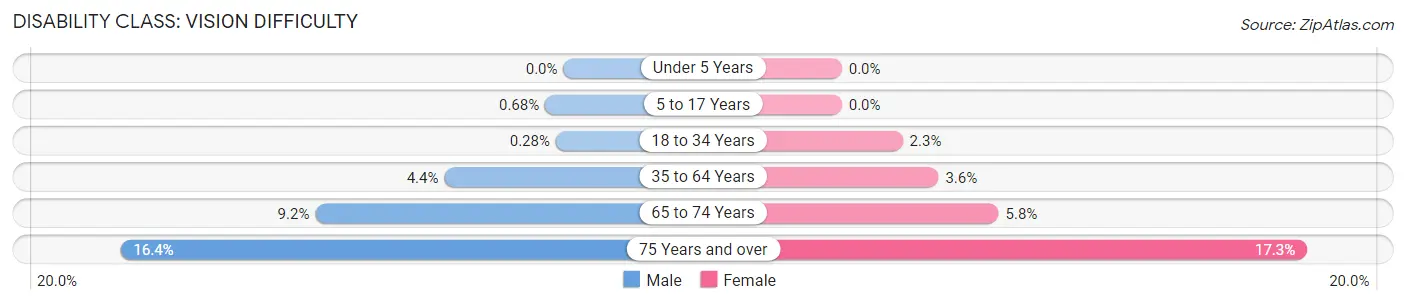
| Age Bracket | Male | Female |
| Under 5 Years | 0 (0.0%) | 0 (0.0%) |
| 5 to 17 Years | 17 (0.7%) | 0 (0.0%) |
| 18 to 34 Years | 9 (0.3%) | 67 (2.3%) |
| 35 to 64 Years | 208 (4.4%) | 197 (3.6%) |
| 65 to 74 Years | 115 (9.2%) | 94 (5.8%) |
| 75 Years and over | 121 (16.4%) | 205 (17.3%) |
Disability Class: Cognitive Difficulty
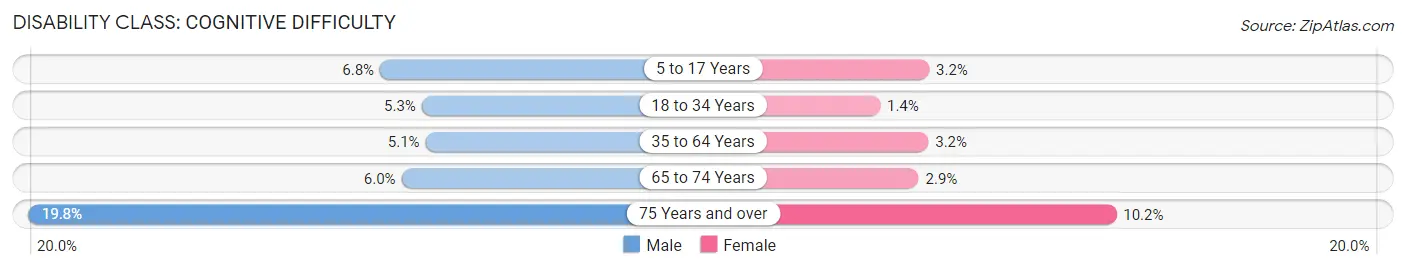
| Age Bracket | Male | Female |
| 5 to 17 Years | 169 (6.8%) | 68 (3.2%) |
| 18 to 34 Years | 171 (5.3%) | 42 (1.4%) |
| 35 to 64 Years | 241 (5.1%) | 176 (3.2%) |
| 65 to 74 Years | 75 (6.0%) | 46 (2.9%) |
| 75 Years and over | 146 (19.8%) | 121 (10.2%) |
Disability Class: Ambulatory Difficulty
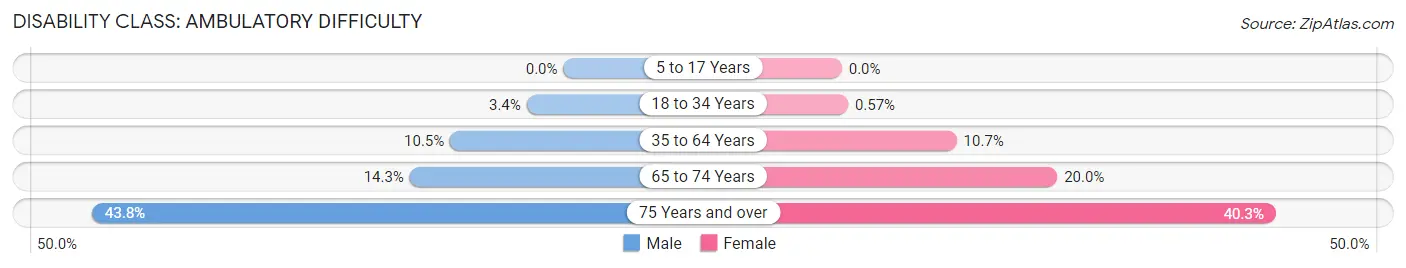
| Age Bracket | Male | Female |
| 5 to 17 Years | 0 (0.0%) | 0 (0.0%) |
| 18 to 34 Years | 111 (3.4%) | 17 (0.6%) |
| 35 to 64 Years | 495 (10.5%) | 585 (10.7%) |
| 65 to 74 Years | 178 (14.3%) | 323 (20.0%) |
| 75 Years and over | 322 (43.8%) | 478 (40.3%) |
Disability Class: Self-Care Difficulty
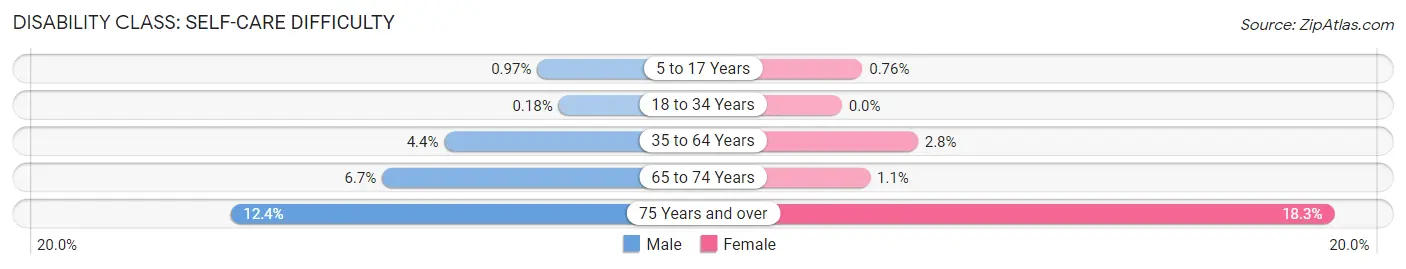
| Age Bracket | Male | Female |
| 5 to 17 Years | 24 (1.0%) | 16 (0.8%) |
| 18 to 34 Years | 6 (0.2%) | 0 (0.0%) |
| 35 to 64 Years | 208 (4.4%) | 155 (2.8%) |
| 65 to 74 Years | 84 (6.7%) | 17 (1.1%) |
| 75 Years and over | 91 (12.4%) | 217 (18.3%) |
Technology Access in Iberville Parish
Computing Device Access in Iberville Parish
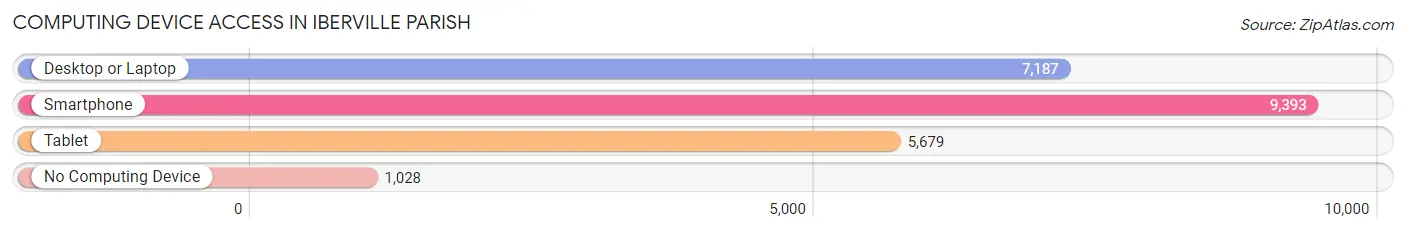
| Device Type | # Households | % Households |
| Desktop or Laptop | 7,187 | 65.1% |
| Smartphone | 9,393 | 85.1% |
| Tablet | 5,679 | 51.4% |
| No Computing Device | 1,028 | 9.3% |
| Total | 11,042 | 100.0% |
Internet Access in Iberville Parish
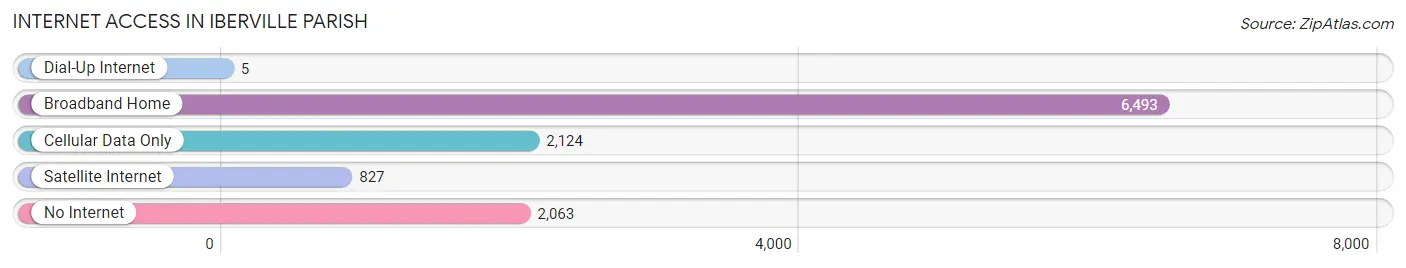
| Internet Type | # Households | % Households |
| Dial-Up Internet | 5 | 0.1% |
| Broadband Home | 6,493 | 58.8% |
| Cellular Data Only | 2,124 | 19.2% |
| Satellite Internet | 827 | 7.5% |
| No Internet | 2,063 | 18.7% |
| Total | 11,042 | 100.0% |
Iberville Parish Summary
Iberville Parish is located in the southeastern part of Louisiana, and is part of the Baton Rouge Metropolitan Statistical Area. It is bordered by Ascension Parish to the north, East Baton Rouge Parish to the east, West Baton Rouge Parish to the west, and the Atchafalaya River to the south. The parish seat is Plaquemine, and the largest city is St. Gabriel.
History
Iberville Parish was created in 1807, and is named after Pierre Le Moyne d'Iberville, a French explorer who explored the area in the late 1600s. The parish was originally part of West Baton Rouge Parish, but was split off in 1807.
The parish has a long history of agriculture, with sugar cane, cotton, and rice being the main crops. The area was also home to many Native American tribes, including the Chitimacha, Houma, and Tunica.
Geography
Iberville Parish covers an area of 545 square miles, and is located in the southeastern part of Louisiana. The parish is bordered by Ascension Parish to the north, East Baton Rouge Parish to the east, West Baton Rouge Parish to the west, and the Atchafalaya River to the south. The parish seat is Plaquemine, and the largest city is St. Gabriel.
The parish is mostly flat, with some rolling hills in the northern part. The terrain is mostly covered in swamps and marshes, with some areas of hardwood forests. The parish is home to several rivers, including the Atchafalaya River, the Mississippi River, and the Amite River.
Economy
The economy of Iberville Parish is largely based on agriculture, with sugar cane, cotton, and rice being the main crops. The area is also home to several oil and gas fields, as well as a number of chemical plants.
The parish is home to several large employers, including the Dow Chemical Company, ExxonMobil, and the Louisiana State Penitentiary. The parish also has a thriving tourism industry, with many visitors coming to the area to enjoy the natural beauty and outdoor activities.
Demographics
As of the 2010 census, Iberville Parish had a population of 33,387. The population was 53.2% White, 44.2% African American, 0.6% Native American, 0.4% Asian, 0.1% Pacific Islander, 0.7% from other races, and 1.0% from two or more races. Hispanic or Latino of any race were 2.2% of the population.
The median household income was $41,945, and the median family income was $50,945. The per capita income was $20,945. About 17.2% of the population was below the poverty line.
The largest ancestry groups in Iberville Parish are French (25.3%), African (24.2%), Irish (10.2%), German (7.2%), and English (6.2%). The largest religious denominations are Catholic (50.2%), Baptist (25.2%), and Methodist (7.2%).
Common Questions
What is Per Capita Income in Iberville Parish?
Per Capita income in Iberville Parish is $28,538.
What is the Median Family Income in Iberville Parish?
Median Family Income in Iberville Parish is $69,352.
What is the Median Household income in Iberville Parish?
Median Household Income in Iberville Parish is $59,410.
What is Income or Wage Gap in Iberville Parish?
Income or Wage Gap in Iberville Parish is 38.3%.
Women in Iberville Parish earn 61.7 cents for every dollar earned by a man.
What is Family Income Deficit in Iberville Parish?
Family Income Deficit in Iberville Parish is $13,154.
Families that are below poverty line in Iberville Parish earn $13,154 less on average than the poverty threshold level.
What is Inequality or Gini Index in Iberville Parish?
Inequality or Gini Index in Iberville Parish is 0.46.
What is the Total Population of Iberville Parish?
Total Population of Iberville Parish is 30,210.
What is the Total Male Population of Iberville Parish?
Total Male Population of Iberville Parish is 15,365.
What is the Total Female Population of Iberville Parish?
Total Female Population of Iberville Parish is 14,845.
What is the Ratio of Males per 100 Females in Iberville Parish?
There are 103.50 Males per 100 Females in Iberville Parish.
What is the Ratio of Females per 100 Males in Iberville Parish?
There are 96.62 Females per 100 Males in Iberville Parish.
What is the Median Population Age in Iberville Parish?
Median Population Age in Iberville Parish is 39.9 Years.
What is the Average Family Size in Iberville Parish
Average Family Size in Iberville Parish is 3.0 People.
What is the Average Household Size in Iberville Parish
Average Household Size in Iberville Parish is 2.5 People.
How Large is the Labor Force in Iberville Parish?
There are 13,347 People in the Labor Forcein in Iberville Parish.
What is the Percentage of People in the Labor Force in Iberville Parish?
54.0% of People are in the Labor Force in Iberville Parish.
What is the Unemployment Rate in Iberville Parish?
Unemployment Rate in Iberville Parish is 7.5%.