Claiborne Parish, LA Map & Demographics
Claiborne Parish Map
Claiborne Parish Overview
$18,721
PER CAPITA INCOME
$39,791
AVG FAMILY INCOME
$32,034
AVG HOUSEHOLD INCOME
20.8%
WAGE / INCOME GAP [ % ]
79.2¢/ $1
WAGE / INCOME GAP [ $ ]
$8,483
FAMILY INCOME DEFICIT
0.51
INEQUALITY / GINI INDEX
14,203
TOTAL POPULATION
7,656
MALE POPULATION
6,547
FEMALE POPULATION
116.94
MALES / 100 FEMALES
85.51
FEMALES / 100 MALES
42.3
MEDIAN AGE
3.3
AVG FAMILY SIZE
2.4
AVG HOUSEHOLD SIZE
4,501
LABOR FORCE [ PEOPLE ]
38.4%
PERCENT IN LABOR FORCE
5.2%
UNEMPLOYMENT RATE
Claiborne Parish Area Codes
Income in Claiborne Parish
Income Overview in Claiborne Parish
Per Capita Income in Claiborne Parish is $18,721, while median incomes of families and households are $39,791 and $32,034 respectively.
| Characteristic | Number | Measure |
| Per Capita Income | 14,203 | $18,721 |
| Median Family Income | 2,971 | $39,791 |
| Mean Family Income | 2,971 | $61,055 |
| Median Household Income | 5,060 | $32,034 |
| Mean Household Income | 5,060 | $49,243 |
| Income Deficit | 2,971 | $8,483 |
| Wage / Income Gap (%) | 14,203 | 20.84% |
| Wage / Income Gap ($) | 14,203 | 79.16¢ per $1 |
| Gini / Inequality Index | 14,203 | 0.51 |
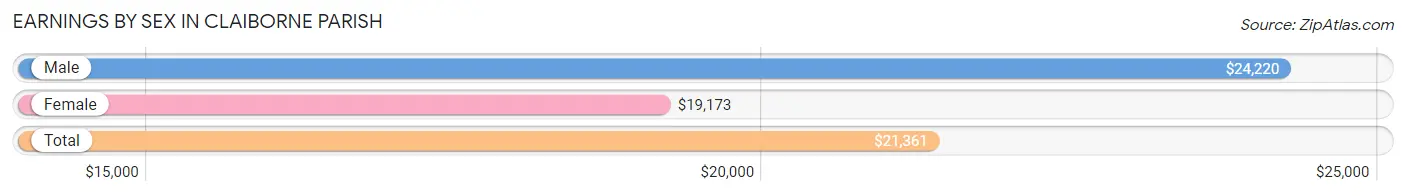
Earnings by Sex in Claiborne Parish
Average Earnings in Claiborne Parish are $21,361, $24,220 for men and $19,173 for women, a difference of 20.8%.
| Sex | Number | Average Earnings |
| Male | 2,288 (48.2%) | $24,220 |
| Female | 2,463 (51.8%) | $19,173 |
| Total | 4,751 (100.0%) | $21,361 |
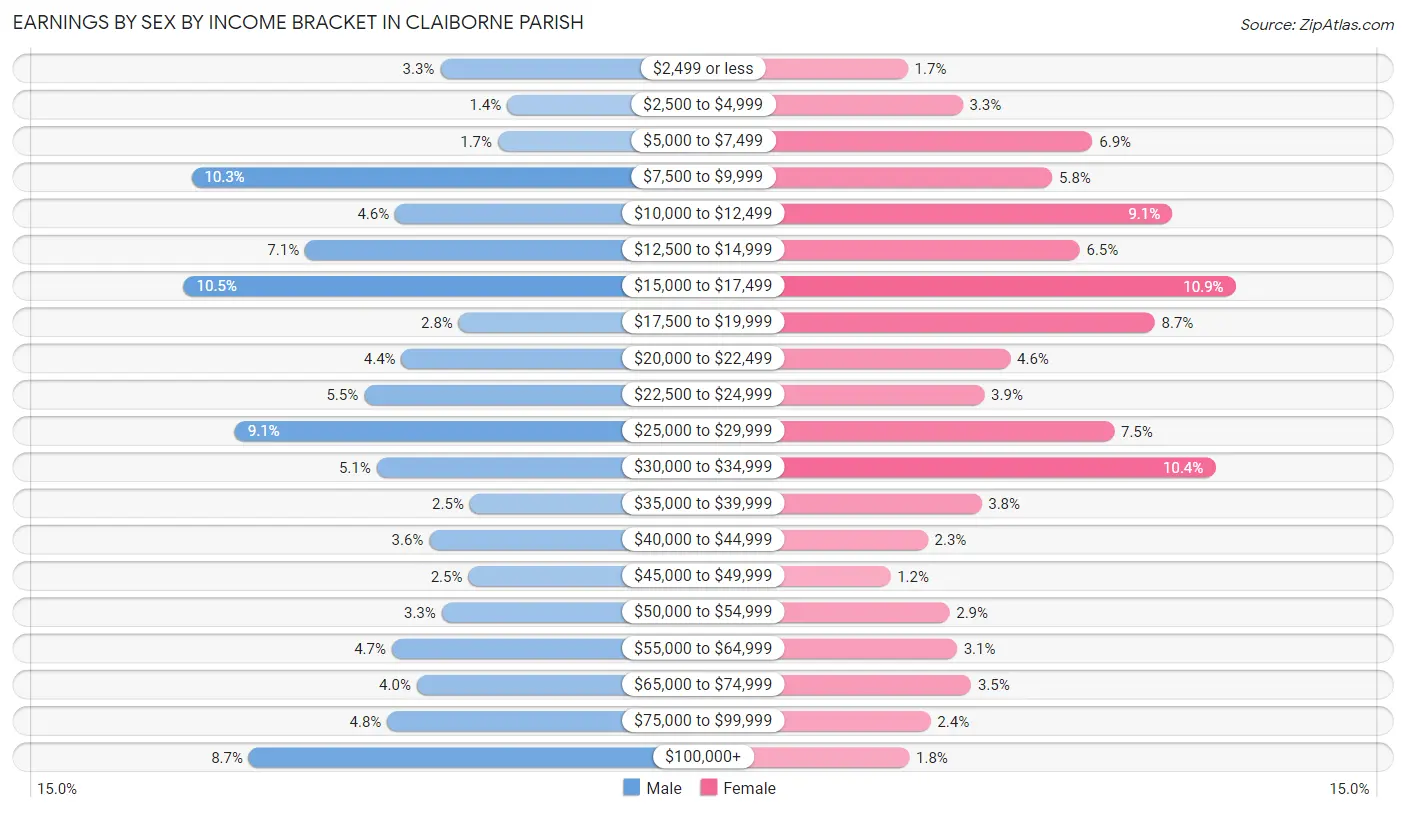
Earnings by Sex by Income Bracket in Claiborne Parish
The most common earnings brackets in Claiborne Parish are $15,000 to $17,499 for men (241 | 10.5%) and $15,000 to $17,499 for women (269 | 10.9%).
| Income | Male | Female |
| $2,499 or less | 76 (3.3%) | 42 (1.7%) |
| $2,500 to $4,999 | 33 (1.4%) | 80 (3.3%) |
| $5,000 to $7,499 | 39 (1.7%) | 170 (6.9%) |
| $7,500 to $9,999 | 236 (10.3%) | 142 (5.8%) |
| $10,000 to $12,499 | 105 (4.6%) | 225 (9.1%) |
| $12,500 to $14,999 | 163 (7.1%) | 161 (6.5%) |
| $15,000 to $17,499 | 241 (10.5%) | 269 (10.9%) |
| $17,500 to $19,999 | 64 (2.8%) | 213 (8.6%) |
| $20,000 to $22,499 | 101 (4.4%) | 113 (4.6%) |
| $22,500 to $24,999 | 125 (5.5%) | 95 (3.9%) |
| $25,000 to $29,999 | 208 (9.1%) | 185 (7.5%) |
| $30,000 to $34,999 | 117 (5.1%) | 255 (10.3%) |
| $35,000 to $39,999 | 57 (2.5%) | 93 (3.8%) |
| $40,000 to $44,999 | 83 (3.6%) | 56 (2.3%) |
| $45,000 to $49,999 | 58 (2.5%) | 30 (1.2%) |
| $50,000 to $54,999 | 75 (3.3%) | 71 (2.9%) |
| $55,000 to $64,999 | 107 (4.7%) | 76 (3.1%) |
| $65,000 to $74,999 | 91 (4.0%) | 86 (3.5%) |
| $75,000 to $99,999 | 110 (4.8%) | 58 (2.4%) |
| $100,000+ | 199 (8.7%) | 43 (1.8%) |
| Total | 2,288 (100.0%) | 2,463 (100.0%) |
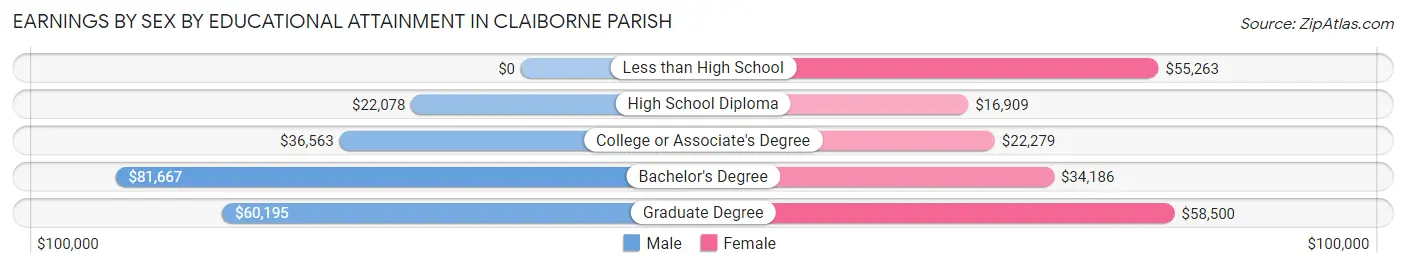
Earnings by Sex by Educational Attainment in Claiborne Parish
Average earnings in Claiborne Parish are $25,232 for men and $21,261 for women, a difference of 15.7%. Men with an educational attainment of bachelor's degree enjoy the highest average annual earnings of $81,667, while those with high school diploma education earn the least with $22,078. Women with an educational attainment of graduate degree earn the most with the average annual earnings of $58,500, while those with high school diploma education have the smallest earnings of $16,909.
| Educational Attainment | Male Income | Female Income |
| Less than High School | - | - |
| High School Diploma | $22,078 | $16,909 |
| College or Associate's Degree | $36,563 | $22,279 |
| Bachelor's Degree | $81,667 | $34,186 |
| Graduate Degree | $60,195 | $58,500 |
| Total | $25,232 | $21,261 |
Family Income in Claiborne Parish
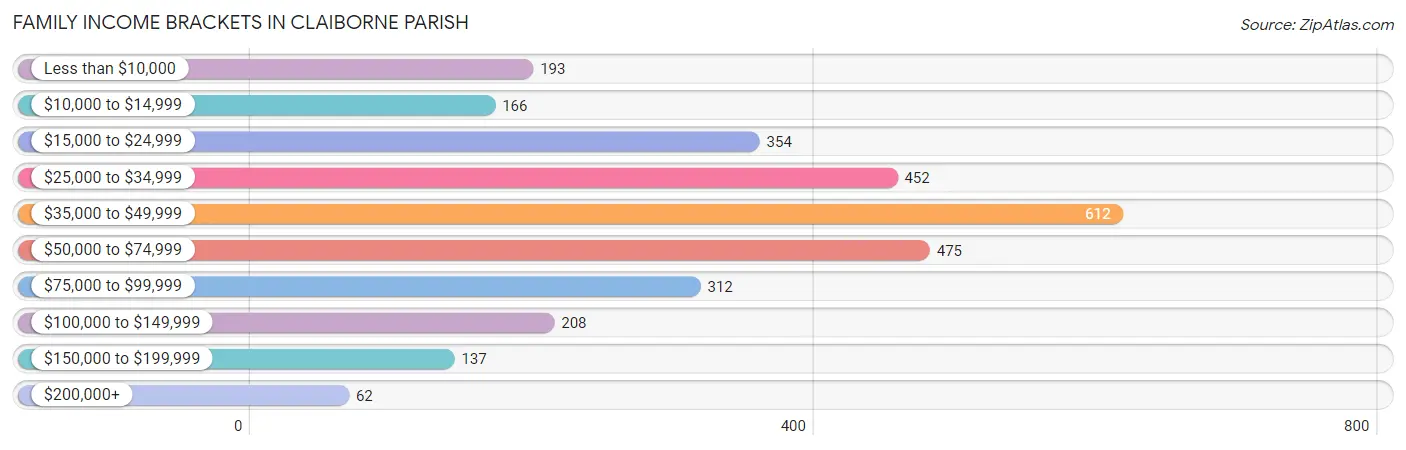
Family Income Brackets in Claiborne Parish
According to the Claiborne Parish family income data, there are 612 families falling into the $35,000 to $49,999 income range, which is the most common income bracket and makes up 20.6% of all families. Conversely, the $200,000+ income bracket is the least frequent group with only 62 families (2.1%) belonging to this category.
| Income Bracket | # Families | % Families |
| Less than $10,000 | 193 | 6.5% |
| $10,000 to $14,999 | 166 | 5.6% |
| $15,000 to $24,999 | 354 | 11.9% |
| $25,000 to $34,999 | 452 | 15.2% |
| $35,000 to $49,999 | 612 | 20.6% |
| $50,000 to $74,999 | 475 | 16.0% |
| $75,000 to $99,999 | 312 | 10.5% |
| $100,000 to $149,999 | 208 | 7.0% |
| $150,000 to $199,999 | 137 | 4.6% |
| $200,000+ | 62 | 2.1% |
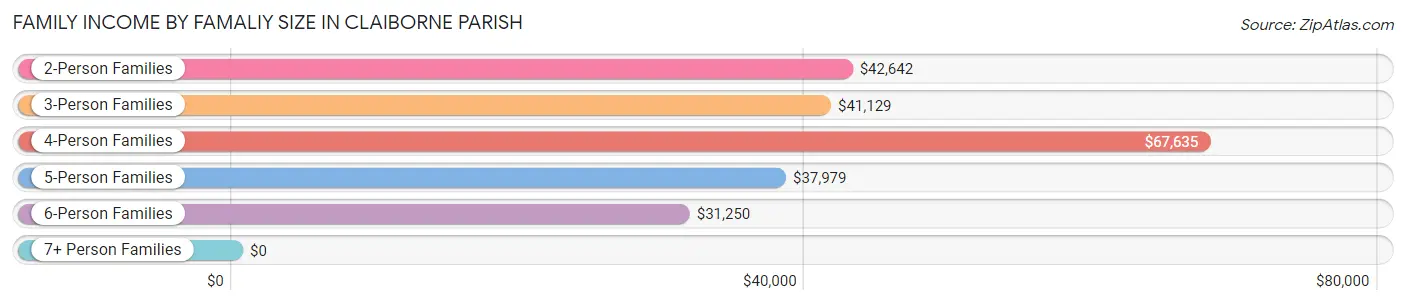
Family Income by Famaliy Size in Claiborne Parish
4-person families (278 | 9.4%) account for the highest median family income in Claiborne Parish with $67,635 per family, while 2-person families (1,632 | 54.9%) have the highest median income of $21,321 per family member.
| Income Bracket | # Families | Median Income |
| 2-Person Families | 1,632 (54.9%) | $42,642 |
| 3-Person Families | 732 (24.6%) | $41,129 |
| 4-Person Families | 278 (9.4%) | $67,635 |
| 5-Person Families | 263 (8.8%) | $37,979 |
| 6-Person Families | 62 (2.1%) | $31,250 |
| 7+ Person Families | 4 (0.1%) | $0 |
| Total | 2,971 (100.0%) | $39,791 |
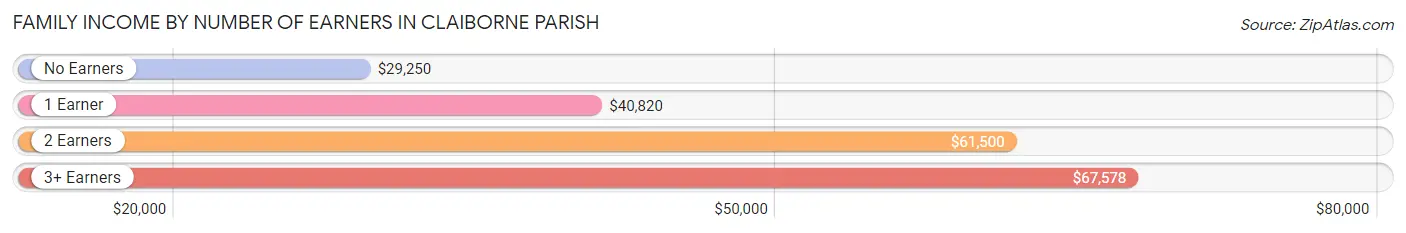
Family Income by Number of Earners in Claiborne Parish
The median family income in Claiborne Parish is $39,791, with families comprising 3+ earners (138) having the highest median family income of $67,578, while families with no earners (888) have the lowest median family income of $29,250, accounting for 4.6% and 29.9% of families, respectively.
| Number of Earners | # Families | Median Income |
| No Earners | 888 (29.9%) | $29,250 |
| 1 Earner | 1,167 (39.3%) | $40,820 |
| 2 Earners | 778 (26.2%) | $61,500 |
| 3+ Earners | 138 (4.6%) | $67,578 |
| Total | 2,971 (100.0%) | $39,791 |
Household Income in Claiborne Parish
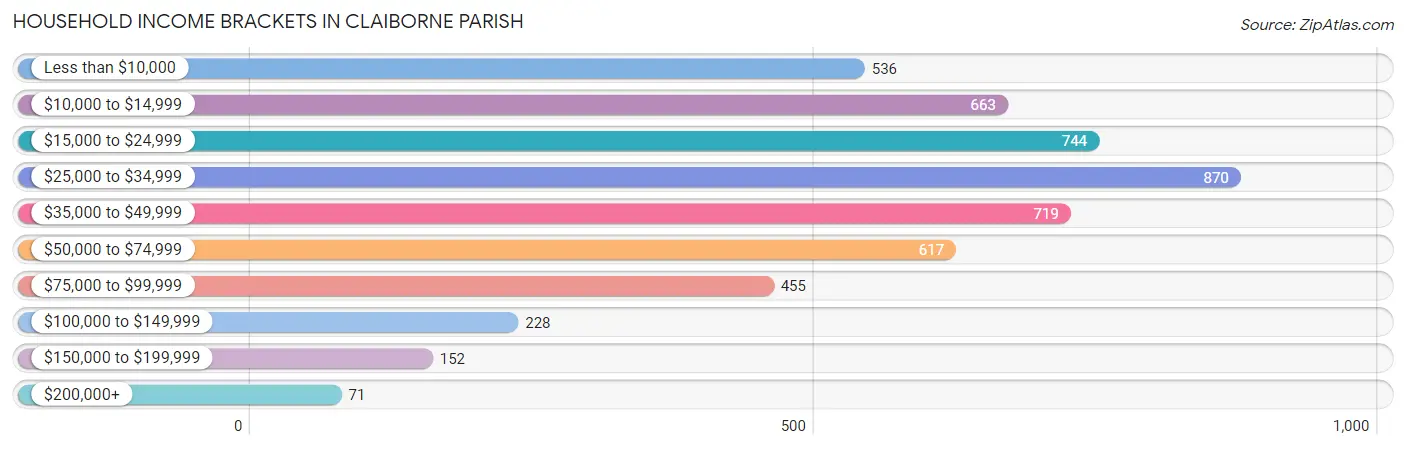
Household Income Brackets in Claiborne Parish
With 870 households falling in the category, the $25,000 to $34,999 income range is the most frequent in Claiborne Parish, accounting for 17.2% of all households. In contrast, only 71 households (1.4%) fall into the $200,000+ income bracket, making it the least populous group.
| Income Bracket | # Households | % Households |
| Less than $10,000 | 536 | 10.6% |
| $10,000 to $14,999 | 663 | 13.1% |
| $15,000 to $24,999 | 744 | 14.7% |
| $25,000 to $34,999 | 870 | 17.2% |
| $35,000 to $49,999 | 719 | 14.2% |
| $50,000 to $74,999 | 617 | 12.2% |
| $75,000 to $99,999 | 455 | 9.0% |
| $100,000 to $149,999 | 228 | 4.5% |
| $150,000 to $199,999 | 152 | 3.0% |
| $200,000+ | 71 | 1.4% |
Household Income by Householder Age in Claiborne Parish
The median household income in Claiborne Parish is $32,034, with the highest median household income of $36,453 found in the 45 to 64 years age bracket for the primary householder. A total of 1,888 households (37.3%) fall into this category. Meanwhile, the 15 to 24 years age bracket for the primary householder has the lowest median household income of $12,826, with 104 households (2.1%) in this group.
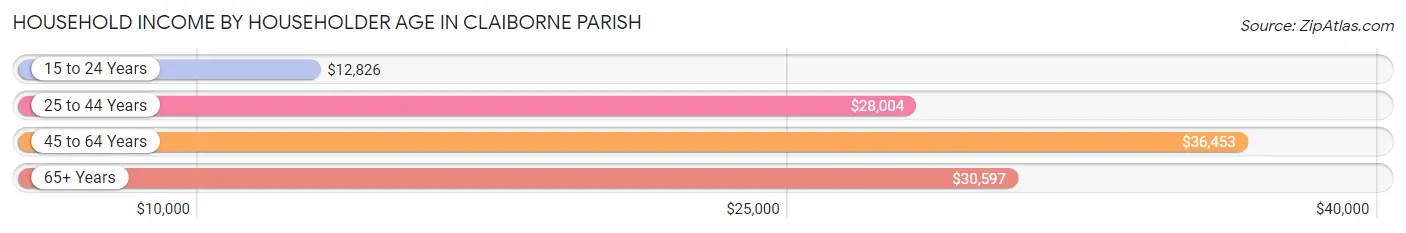
| Income Bracket | # Households | Median Income |
| 15 to 24 Years | 104 (2.1%) | $12,826 |
| 25 to 44 Years | 1,035 (20.4%) | $28,004 |
| 45 to 64 Years | 1,888 (37.3%) | $36,453 |
| 65+ Years | 2,033 (40.2%) | $30,597 |
| Total | 5,060 (100.0%) | $32,034 |
Poverty in Claiborne Parish
Income Below Poverty by Sex and Age in Claiborne Parish
With 28.5% poverty level for males and 36.4% for females among the residents of Claiborne Parish, 5 year old males and under 5 year old females are the most vulnerable to poverty, with 132 males (96.4%) and 242 females (62.5%) in their respective age groups living below the poverty level.
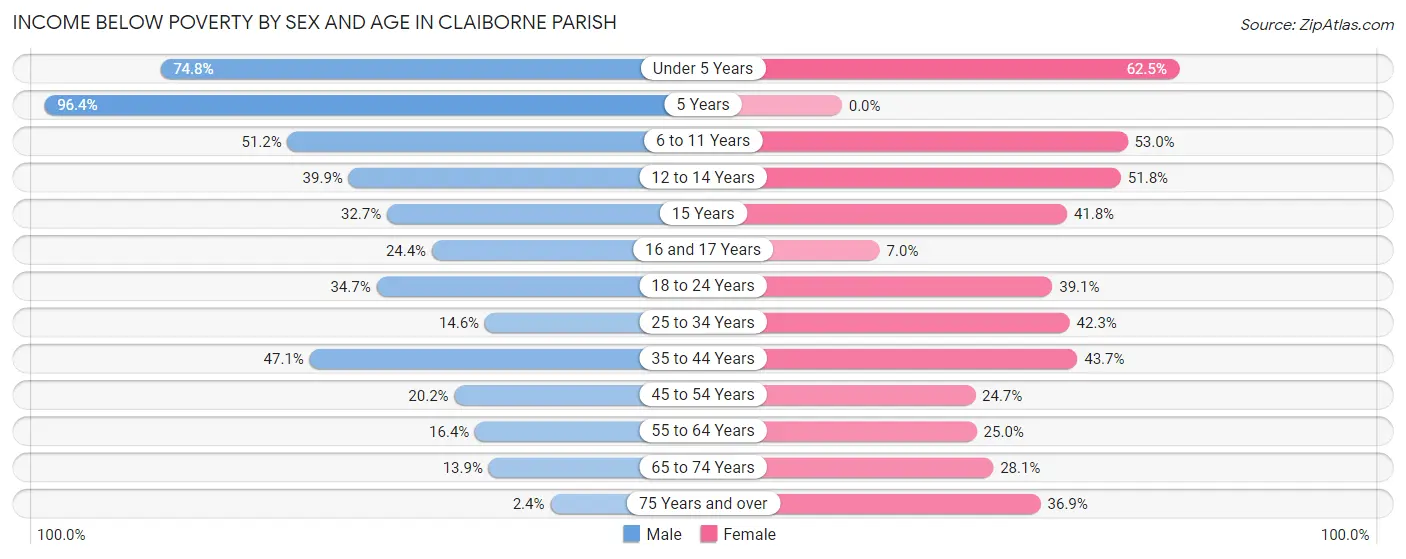
| Age Bracket | Male | Female |
| Under 5 Years | 211 (74.8%) | 242 (62.5%) |
| 5 Years | 132 (96.4%) | 0 (0.0%) |
| 6 to 11 Years | 193 (51.2%) | 281 (53.0%) |
| 12 to 14 Years | 104 (39.9%) | 129 (51.8%) |
| 15 Years | 53 (32.7%) | 28 (41.8%) |
| 16 and 17 Years | 20 (24.4%) | 9 (7.0%) |
| 18 to 24 Years | 196 (34.7%) | 193 (39.1%) |
| 25 to 34 Years | 104 (14.5%) | 233 (42.3%) |
| 35 to 44 Years | 283 (47.1%) | 309 (43.7%) |
| 45 to 54 Years | 131 (20.2%) | 189 (24.7%) |
| 55 to 64 Years | 138 (16.4%) | 242 (25.0%) |
| 65 to 74 Years | 99 (13.9%) | 288 (28.1%) |
| 75 Years and over | 12 (2.4%) | 186 (36.9%) |
| Total | 1,676 (28.5%) | 2,329 (36.4%) |
Income Above Poverty by Sex and Age in Claiborne Parish
According to the poverty statistics in Claiborne Parish, males aged 75 years and over and females aged 5 years are the age groups that are most secure financially, with 97.6% of males and 100.0% of females in these age groups living above the poverty line.
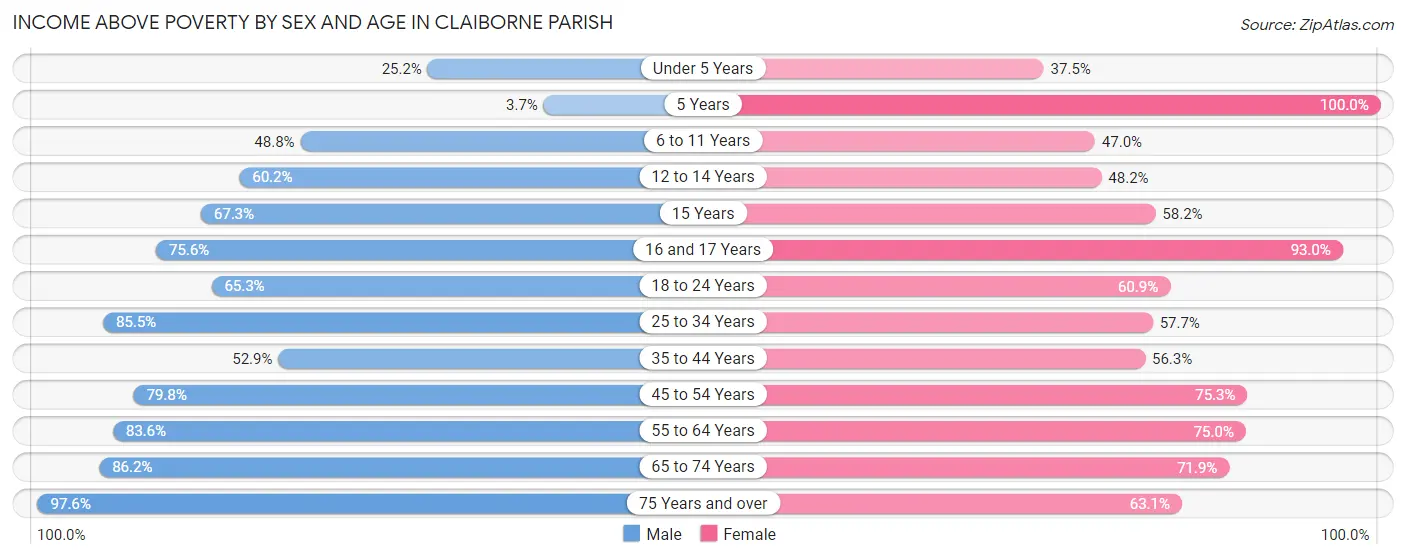
| Age Bracket | Male | Female |
| Under 5 Years | 71 (25.2%) | 145 (37.5%) |
| 5 Years | 5 (3.6%) | 23 (100.0%) |
| 6 to 11 Years | 184 (48.8%) | 249 (47.0%) |
| 12 to 14 Years | 157 (60.2%) | 120 (48.2%) |
| 15 Years | 109 (67.3%) | 39 (58.2%) |
| 16 and 17 Years | 62 (75.6%) | 119 (93.0%) |
| 18 to 24 Years | 369 (65.3%) | 301 (60.9%) |
| 25 to 34 Years | 611 (85.5%) | 318 (57.7%) |
| 35 to 44 Years | 318 (52.9%) | 398 (56.3%) |
| 45 to 54 Years | 517 (79.8%) | 575 (75.3%) |
| 55 to 64 Years | 705 (83.6%) | 725 (75.0%) |
| 65 to 74 Years | 616 (86.2%) | 737 (71.9%) |
| 75 Years and over | 484 (97.6%) | 318 (63.1%) |
| Total | 4,208 (71.5%) | 4,067 (63.6%) |
Income Below Poverty Among Married-Couple Families in Claiborne Parish
The poverty statistics for married-couple families in Claiborne Parish show that 11.8% or 209 of the total 1,777 families live below the poverty line. Families with 3 or 4 children have the highest poverty rate of 59.7%, comprising of 71 families. On the other hand, families with no children have the lowest poverty rate of 8.1%, which includes 106 families.
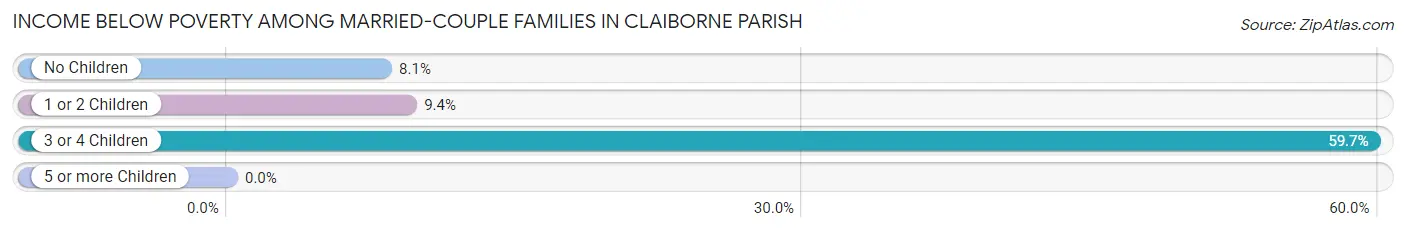
| Children | Above Poverty | Below Poverty |
| No Children | 1,210 (91.9%) | 106 (8.1%) |
| 1 or 2 Children | 310 (90.6%) | 32 (9.4%) |
| 3 or 4 Children | 48 (40.3%) | 71 (59.7%) |
| 5 or more Children | 0 (0.0%) | 0 (0.0%) |
| Total | 1,568 (88.2%) | 209 (11.8%) |
Income Below Poverty Among Single-Parent Households in Claiborne Parish
According to the poverty data in Claiborne Parish, 30.1% or 90 single-father households and 47.8% or 428 single-mother households are living below the poverty line. Among single-father households, those with 3 or 4 children have the highest poverty rate, with 22 households (100.0%) experiencing poverty. Likewise, among single-mother households, those with 5 or more children have the highest poverty rate, with 22 households (100.0%) falling below the poverty line.
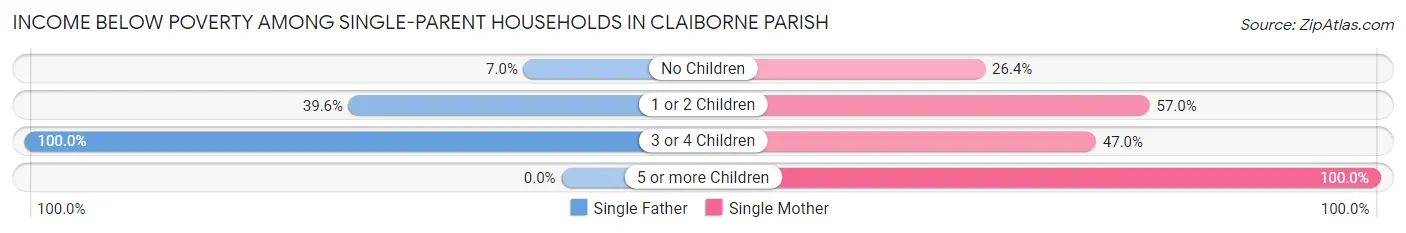
| Children | Single Father | Single Mother |
| No Children | 9 (7.0%) | 73 (26.4%) |
| 1 or 2 Children | 59 (39.6%) | 302 (57.0%) |
| 3 or 4 Children | 22 (100.0%) | 31 (47.0%) |
| 5 or more Children | 0 (0.0%) | 22 (100.0%) |
| Total | 90 (30.1%) | 428 (47.8%) |
Income Below Poverty Among Married-Couple vs Single-Parent Households in Claiborne Parish
The poverty data for Claiborne Parish shows that 209 of the married-couple family households (11.8%) and 518 of the single-parent households (43.4%) are living below the poverty level. Within the married-couple family households, those with 3 or 4 children have the highest poverty rate, with 71 households (59.7%) falling below the poverty line. Among the single-parent households, those with 5 or more children have the highest poverty rate, with 22 household (100.0%) living below poverty.
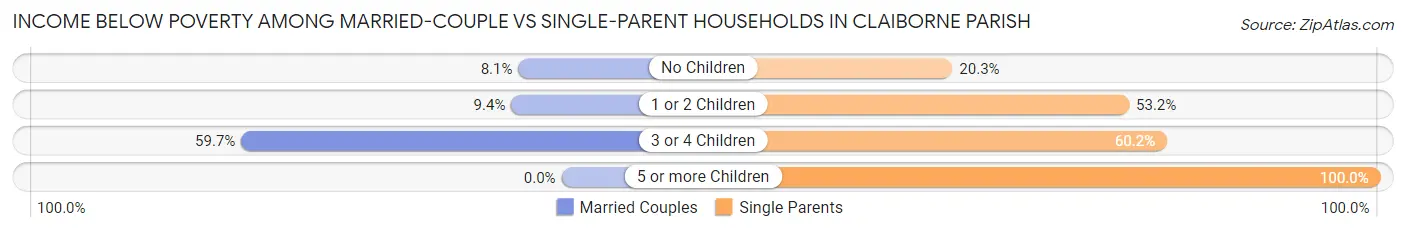
| Children | Married-Couple Families | Single-Parent Households |
| No Children | 106 (8.1%) | 82 (20.3%) |
| 1 or 2 Children | 32 (9.4%) | 361 (53.2%) |
| 3 or 4 Children | 71 (59.7%) | 53 (60.2%) |
| 5 or more Children | 0 (0.0%) | 22 (100.0%) |
| Total | 209 (11.8%) | 518 (43.4%) |
Race in Claiborne Parish
The most populous races in Claiborne Parish are Black / African American (7,051 | 49.6%), White / Caucasian (6,479 | 45.6%), and Two or more Races (483 | 3.4%).
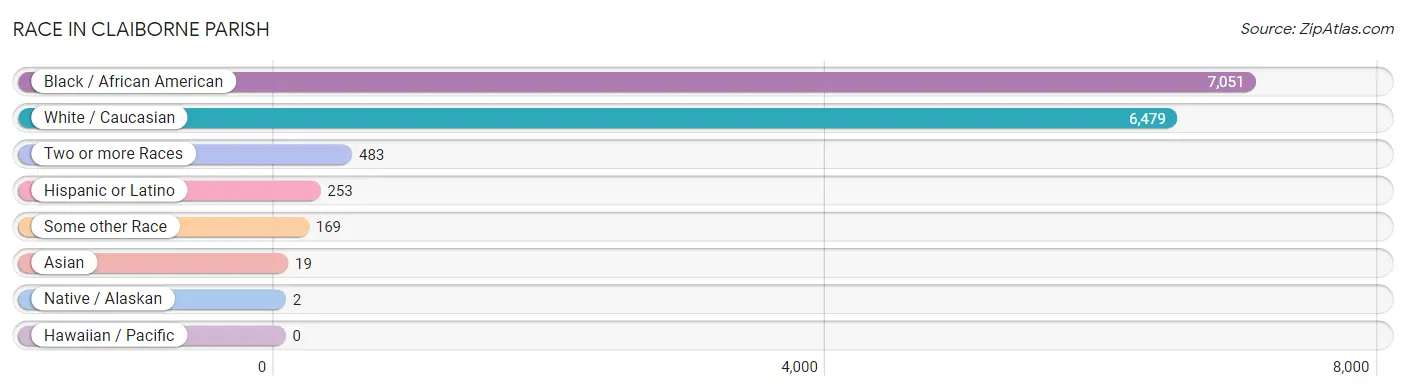
| Race | # Population | % Population |
| Asian | 19 | 0.1% |
| Black / African American | 7,051 | 49.6% |
| Hawaiian / Pacific | 0 | 0.0% |
| Hispanic or Latino | 253 | 1.8% |
| Native / Alaskan | 2 | 0.0% |
| White / Caucasian | 6,479 | 45.6% |
| Two or more Races | 483 | 3.4% |
| Some other Race | 169 | 1.2% |
| Total | 14,203 | 100.0% |
Ancestry in Claiborne Parish
The most populous ancestries reported in Claiborne Parish are American (4,633 | 32.6%), English (800 | 5.6%), Irish (431 | 3.0%), German (354 | 2.5%), and African (280 | 2.0%), together accounting for 45.7% of all Claiborne Parish residents.
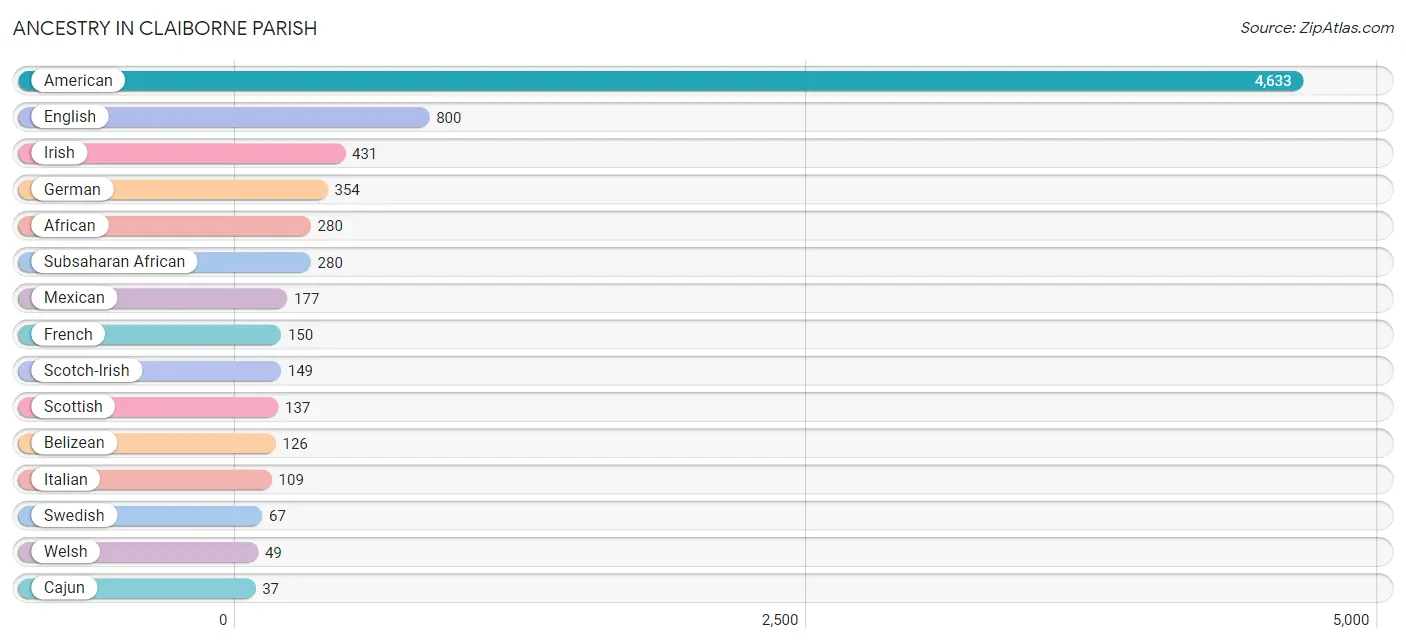
| Ancestry | # Population | % Population |
| African | 280 | 2.0% |
| American | 4,633 | 32.6% |
| Arab | 4 | 0.0% |
| Austrian | 6 | 0.0% |
| Belgian | 2 | 0.0% |
| Belizean | 126 | 0.9% |
| Blackfeet | 7 | 0.1% |
| British | 29 | 0.2% |
| British West Indian | 7 | 0.1% |
| Cajun | 37 | 0.3% |
| Central American | 11 | 0.1% |
| Choctaw | 20 | 0.1% |
| Dutch | 31 | 0.2% |
| English | 800 | 5.6% |
| European | 29 | 0.2% |
| French | 150 | 1.1% |
| French Canadian | 21 | 0.2% |
| German | 354 | 2.5% |
| Honduran | 11 | 0.1% |
| Irish | 431 | 3.0% |
| Italian | 109 | 0.8% |
| Korean | 15 | 0.1% |
| Malaysian | 10 | 0.1% |
| Mexican | 177 | 1.3% |
| Northern European | 15 | 0.1% |
| Polish | 10 | 0.1% |
| Puerto Rican | 11 | 0.1% |
| Russian | 10 | 0.1% |
| Scandinavian | 3 | 0.0% |
| Scotch-Irish | 149 | 1.1% |
| Scottish | 137 | 1.0% |
| Seminole | 3 | 0.0% |
| Sioux | 5 | 0.0% |
| Spaniard | 9 | 0.1% |
| Spanish | 11 | 0.1% |
| Subsaharan African | 280 | 2.0% |
| Swedish | 67 | 0.5% |
| Welsh | 49 | 0.3% | View All 38 Rows |
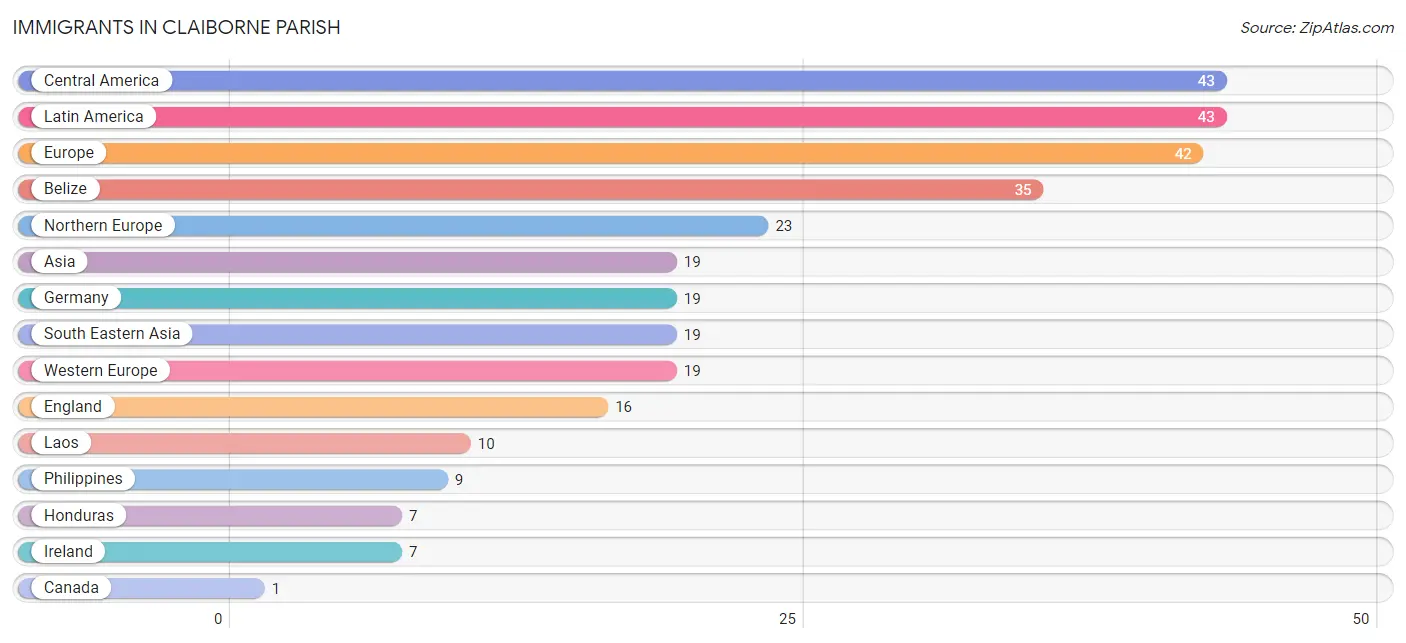
Immigrants in Claiborne Parish
The most numerous immigrant groups reported in Claiborne Parish came from Central America (43 | 0.3%), Latin America (43 | 0.3%), Europe (42 | 0.3%), Belize (35 | 0.3%), and Northern Europe (23 | 0.2%), together accounting for 1.3% of all Claiborne Parish residents.
| Immigration Origin | # Population | % Population |
| Asia | 19 | 0.1% |
| Belize | 35 | 0.3% |
| Canada | 1 | 0.0% |
| Central America | 43 | 0.3% |
| El Salvador | 1 | 0.0% |
| England | 16 | 0.1% |
| Europe | 42 | 0.3% |
| Germany | 19 | 0.1% |
| Honduras | 7 | 0.1% |
| Ireland | 7 | 0.1% |
| Laos | 10 | 0.1% |
| Latin America | 43 | 0.3% |
| Northern Europe | 23 | 0.2% |
| Philippines | 9 | 0.1% |
| South Eastern Asia | 19 | 0.1% |
| Western Europe | 19 | 0.1% | View All 16 Rows |
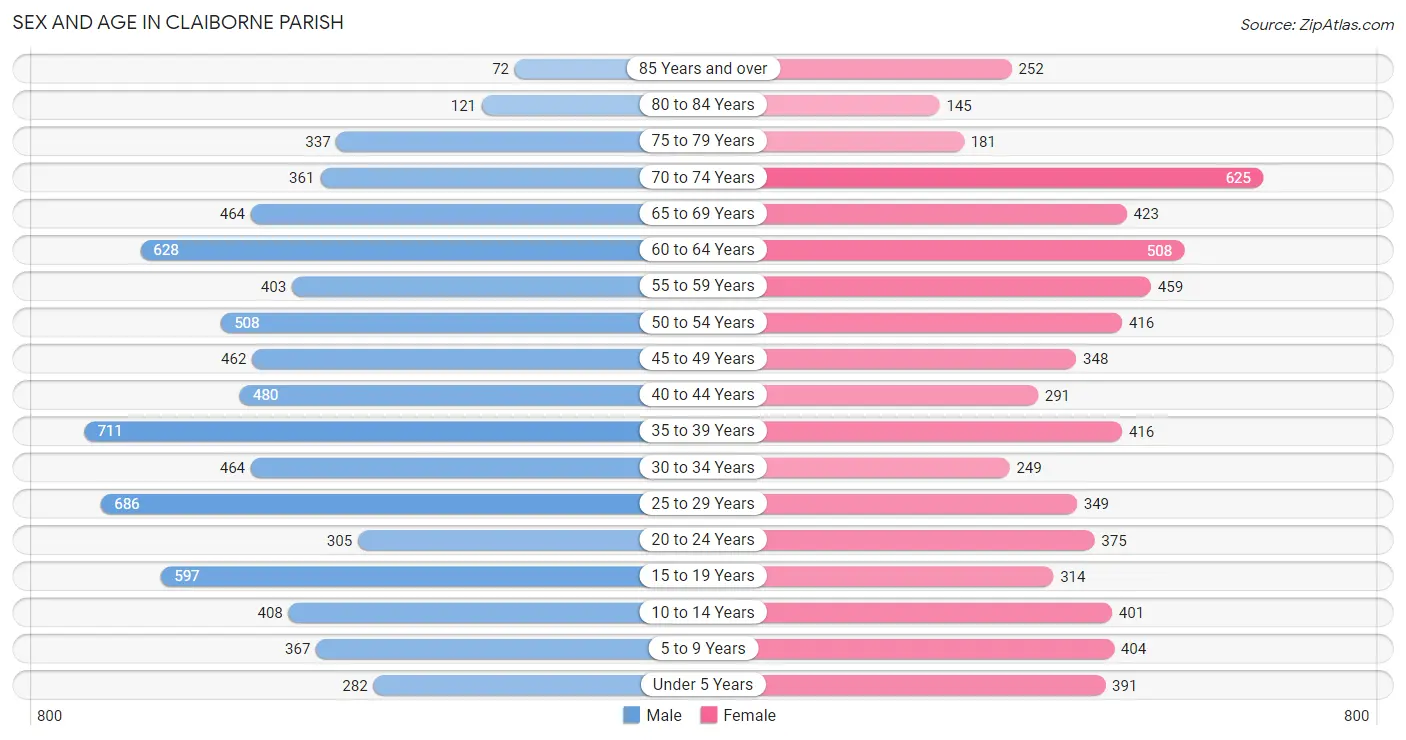
Sex and Age in Claiborne Parish
Sex and Age in Claiborne Parish
The most populous age groups in Claiborne Parish are 35 to 39 Years (711 | 9.3%) for men and 70 to 74 Years (625 | 9.6%) for women.
| Age Bracket | Male | Female |
| Under 5 Years | 282 (3.7%) | 391 (6.0%) |
| 5 to 9 Years | 367 (4.8%) | 404 (6.2%) |
| 10 to 14 Years | 408 (5.3%) | 401 (6.1%) |
| 15 to 19 Years | 597 (7.8%) | 314 (4.8%) |
| 20 to 24 Years | 305 (4.0%) | 375 (5.7%) |
| 25 to 29 Years | 686 (9.0%) | 349 (5.3%) |
| 30 to 34 Years | 464 (6.1%) | 249 (3.8%) |
| 35 to 39 Years | 711 (9.3%) | 416 (6.4%) |
| 40 to 44 Years | 480 (6.3%) | 291 (4.4%) |
| 45 to 49 Years | 462 (6.0%) | 348 (5.3%) |
| 50 to 54 Years | 508 (6.6%) | 416 (6.4%) |
| 55 to 59 Years | 403 (5.3%) | 459 (7.0%) |
| 60 to 64 Years | 628 (8.2%) | 508 (7.8%) |
| 65 to 69 Years | 464 (6.1%) | 423 (6.5%) |
| 70 to 74 Years | 361 (4.7%) | 625 (9.6%) |
| 75 to 79 Years | 337 (4.4%) | 181 (2.8%) |
| 80 to 84 Years | 121 (1.6%) | 145 (2.2%) |
| 85 Years and over | 72 (0.9%) | 252 (3.8%) |
| Total | 7,656 (100.0%) | 6,547 (100.0%) |
Families and Households in Claiborne Parish
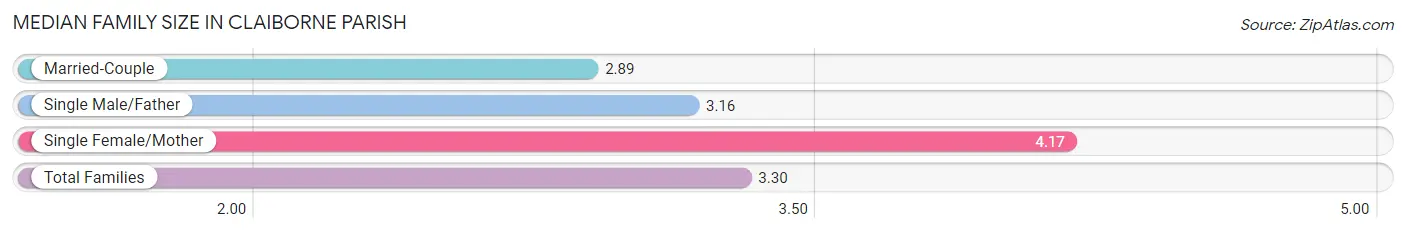
Median Family Size in Claiborne Parish
The median family size in Claiborne Parish is 3.30 persons per family, with single female/mother families (895 | 30.1%) accounting for the largest median family size of 4.17 persons per family. On the other hand, married-couple families (1,777 | 59.8%) represent the smallest median family size with 2.89 persons per family.
| Family Type | # Families | Family Size |
| Married-Couple | 1,777 (59.8%) | 2.89 |
| Single Male/Father | 299 (10.1%) | 3.16 |
| Single Female/Mother | 895 (30.1%) | 4.17 |
| Total Families | 2,971 (100.0%) | 3.30 |
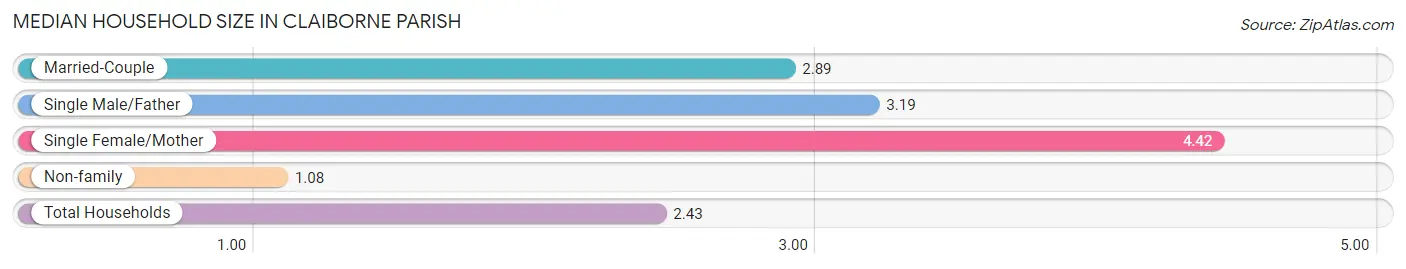
Median Household Size in Claiborne Parish
The median household size in Claiborne Parish is 2.43 persons per household, with single female/mother households (895 | 17.7%) accounting for the largest median household size of 4.42 persons per household. non-family households (2,089 | 41.3%) represent the smallest median household size with 1.08 persons per household.
| Household Type | # Households | Household Size |
| Married-Couple | 1,777 (35.1%) | 2.89 |
| Single Male/Father | 299 (5.9%) | 3.19 |
| Single Female/Mother | 895 (17.7%) | 4.42 |
| Non-family | 2,089 (41.3%) | 1.08 |
| Total Households | 5,060 (100.0%) | 2.43 |
Household Size by Marriage Status in Claiborne Parish
Out of a total of 5,060 households in Claiborne Parish, 2,971 (58.7%) are family households, while 2,089 (41.3%) are nonfamily households. The most numerous type of family households are 2-person households, comprising 1,547, and the most common type of nonfamily households are 1-person households, comprising 1,887.
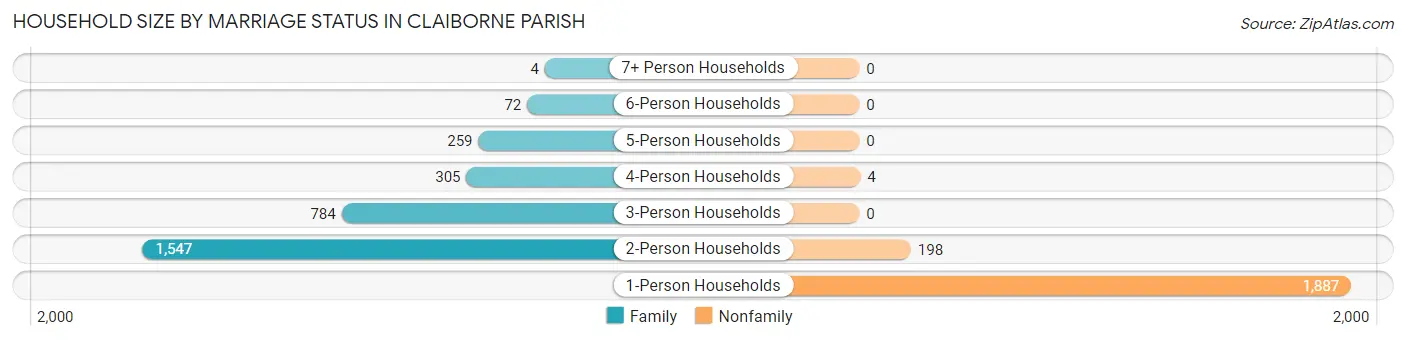
| Household Size | Family Households | Nonfamily Households |
| 1-Person Households | - | 1,887 (37.3%) |
| 2-Person Households | 1,547 (30.6%) | 198 (3.9%) |
| 3-Person Households | 784 (15.5%) | 0 (0.0%) |
| 4-Person Households | 305 (6.0%) | 4 (0.1%) |
| 5-Person Households | 259 (5.1%) | 0 (0.0%) |
| 6-Person Households | 72 (1.4%) | 0 (0.0%) |
| 7+ Person Households | 4 (0.1%) | 0 (0.0%) |
| Total | 2,971 (58.7%) | 2,089 (41.3%) |
Female Fertility in Claiborne Parish
Fertility by Age in Claiborne Parish
Average fertility rate in Claiborne Parish is 75.0 births per 1,000 women. Women in the age bracket of 35 to 50 years have the highest fertility rate with 106.0 births per 1,000 women. Women in the age bracket of 35 to 50 years acount for 64.4% of all women with births.
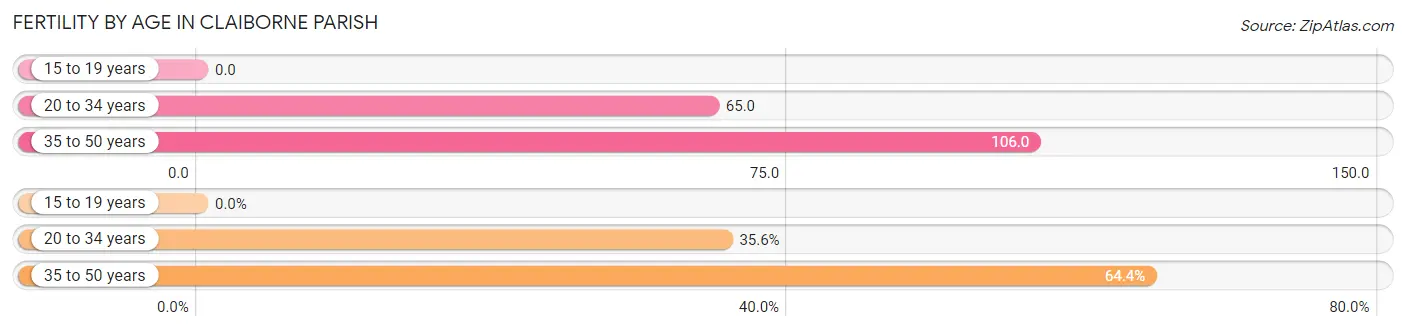
| Age Bracket | Women with Births | Births / 1,000 Women |
| 15 to 19 years | 0 (0.0%) | 0.0 |
| 20 to 34 years | 63 (35.6%) | 65.0 |
| 35 to 50 years | 114 (64.4%) | 106.0 |
| Total | 177 (100.0%) | 75.0 |
Fertility by Age by Marriage Status in Claiborne Parish
68.9% of women with births (177) in Claiborne Parish are married. The highest percentage of unmarried women with births falls into 20 to 34 years age bracket with 87.3% of them unmarried at the time of birth, while the lowest percentage of unmarried women with births belong to 35 to 50 years age bracket with 0.0% of them unmarried.
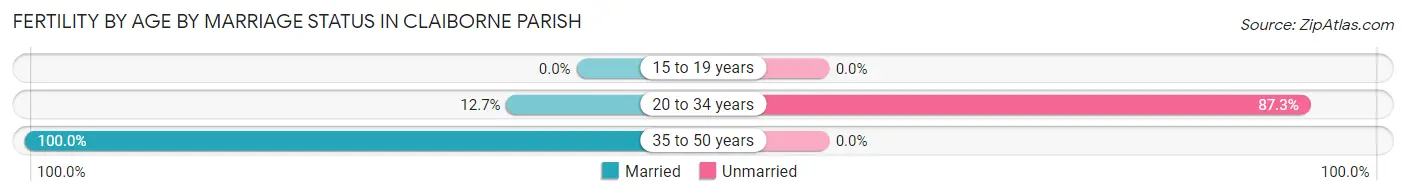
| Age Bracket | Married | Unmarried |
| 15 to 19 years | 0 (0.0%) | 0 (0.0%) |
| 20 to 34 years | 8 (12.7%) | 55 (87.3%) |
| 35 to 50 years | 114 (100.0%) | 0 (0.0%) |
| Total | 122 (68.9%) | 55 (31.1%) |
Fertility by Education in Claiborne Parish
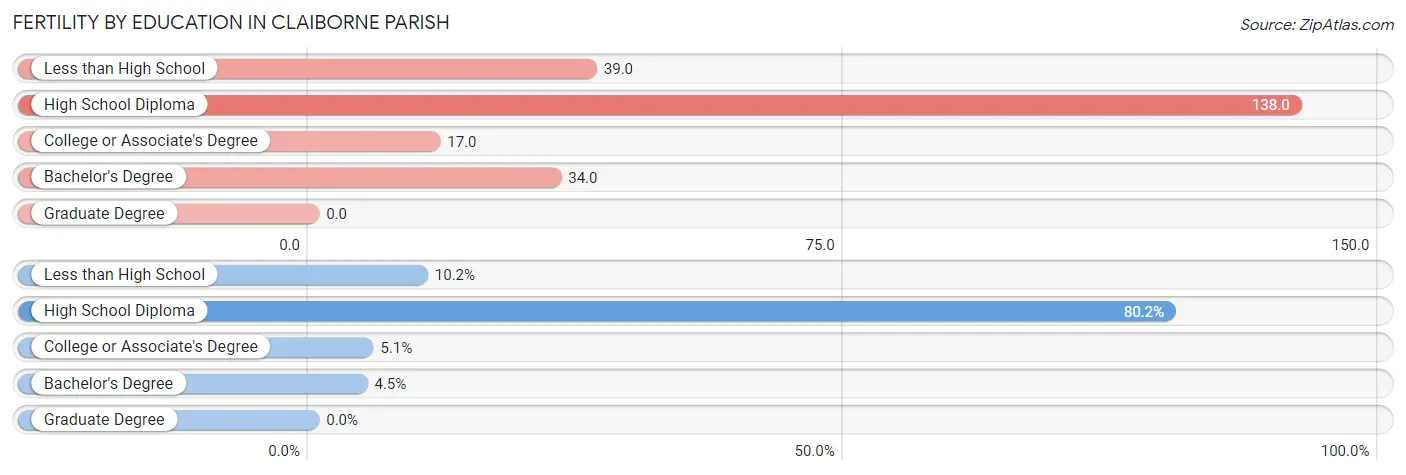
| Educational Attainment | Women with Births | Births / 1,000 Women |
| Less than High School | 18 (10.2%) | 39.0 |
| High School Diploma | 142 (80.2%) | 138.0 |
| College or Associate's Degree | 9 (5.1%) | 17.0 |
| Bachelor's Degree | 8 (4.5%) | 34.0 |
| Graduate Degree | 0 (0.0%) | 0.0 |
| Total | 177 (100.0%) | 75.0 |
Fertility by Education by Marriage Status in Claiborne Parish
31.1% of women with births in Claiborne Parish are unmarried. Women with the educational attainment of bachelor's degree are most likely to be married with 100.0% of them married at childbirth, while women with the educational attainment of less than high school are least likely to be married with 100.0% of them unmarried at childbirth.
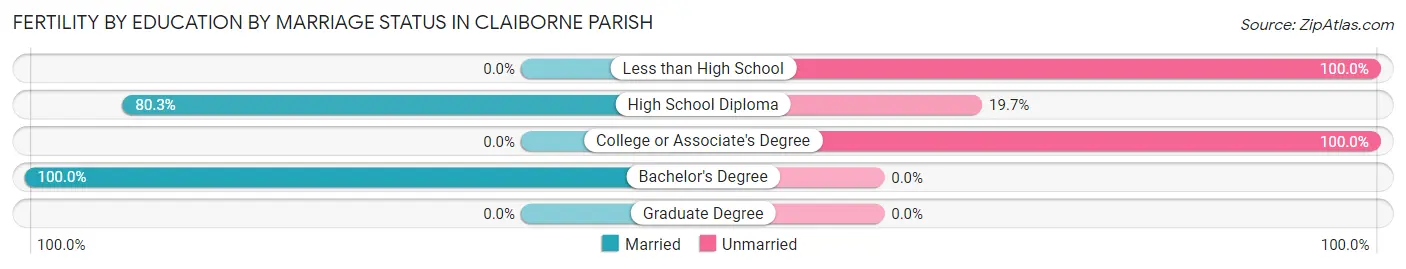
| Educational Attainment | Married | Unmarried |
| Less than High School | 0 (0.0%) | 18 (100.0%) |
| High School Diploma | 114 (80.3%) | 28 (19.7%) |
| College or Associate's Degree | 0 (0.0%) | 9 (100.0%) |
| Bachelor's Degree | 8 (100.0%) | 0 (0.0%) |
| Graduate Degree | 0 (0.0%) | 0 (0.0%) |
| Total | 122 (68.9%) | 55 (31.1%) |
Employment Characteristics in Claiborne Parish
Employment by Class of Employer in Claiborne Parish
Among the 4,112 employed individuals in Claiborne Parish, private company employees (2,677 | 65.1%), local government employees (419 | 10.2%), and state government employees (411 | 10.0%) make up the most common classes of employment.
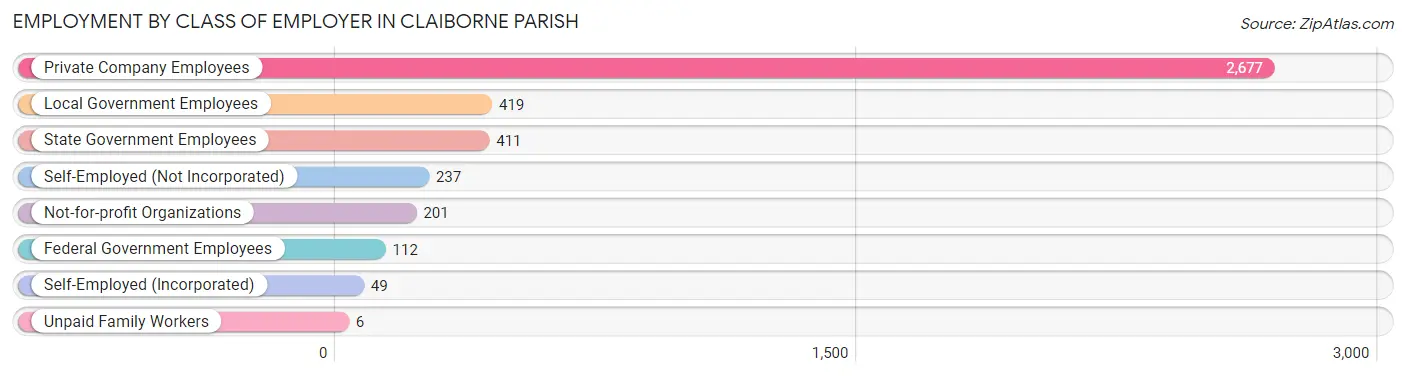
| Employer Class | # Employees | % Employees |
| Private Company Employees | 2,677 | 65.1% |
| Self-Employed (Incorporated) | 49 | 1.2% |
| Self-Employed (Not Incorporated) | 237 | 5.8% |
| Not-for-profit Organizations | 201 | 4.9% |
| Local Government Employees | 419 | 10.2% |
| State Government Employees | 411 | 10.0% |
| Federal Government Employees | 112 | 2.7% |
| Unpaid Family Workers | 6 | 0.2% |
| Total | 4,112 | 100.0% |
Employment Status by Age in Claiborne Parish
According to the labor force statistics for Claiborne Parish, out of the total population over 16 years of age (11,721), 38.4% or 4,501 individuals are in the labor force, with 5.2% or 234 of them unemployed. The age group with the highest labor force participation rate is 25 to 29 years, with 70.9% or 734 individuals in the labor force. Within the labor force, the 30 to 34 years age range has the highest percentage of unemployed individuals, with 34.6% or 65 of them being unemployed.
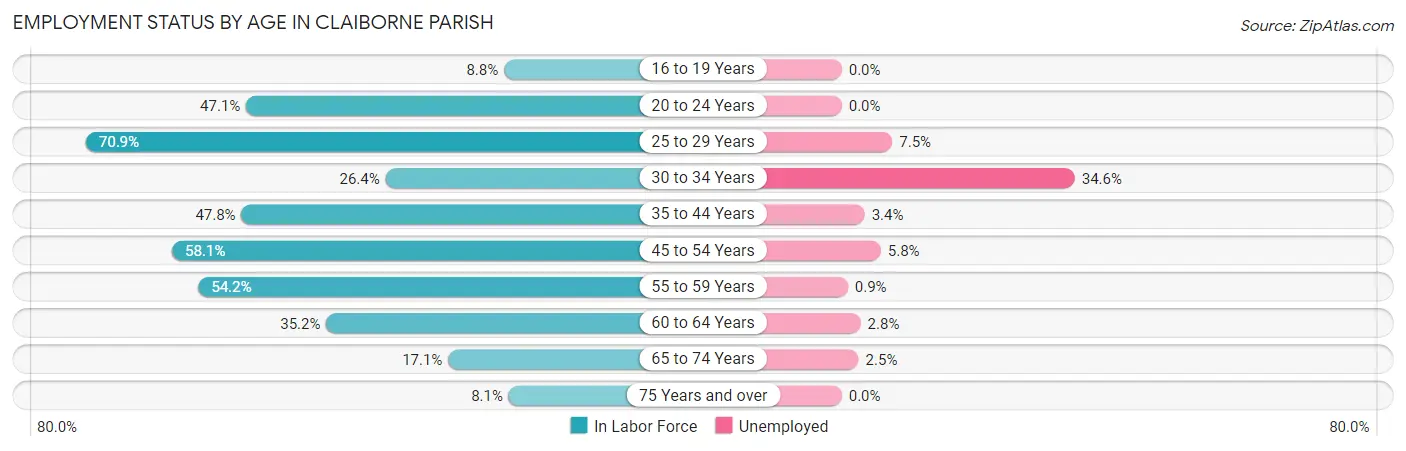
| Age Bracket | In Labor Force | Unemployed |
| 16 to 19 Years | 60 (8.8%) | 0 (0.0%) |
| 20 to 24 Years | 320 (47.1%) | 0 (0.0%) |
| 25 to 29 Years | 734 (70.9%) | 55 (7.5%) |
| 30 to 34 Years | 188 (26.4%) | 65 (34.6%) |
| 35 to 44 Years | 907 (47.8%) | 31 (3.4%) |
| 45 to 54 Years | 1,007 (58.1%) | 58 (5.8%) |
| 55 to 59 Years | 467 (54.2%) | 4 (0.9%) |
| 60 to 64 Years | 400 (35.2%) | 11 (2.8%) |
| 65 to 74 Years | 320 (17.1%) | 8 (2.5%) |
| 75 Years and over | 90 (8.1%) | 0 (0.0%) |
| Total | 4,501 (38.4%) | 234 (5.2%) |
Employment Status by Educational Attainment in Claiborne Parish
According to labor force statistics for Claiborne Parish, 50.2% of individuals (3,704) out of the total population between 25 and 64 years of age (7,378) are in the labor force, with 6.0% or 222 of them being unemployed. The group with the highest labor force participation rate are those with the educational attainment of bachelor's degree or higher, with 79.2% or 572 individuals in the labor force. Within the labor force, individuals with less than high school education have the highest percentage of unemployment, with 31.7% or 53 of them being unemployed.
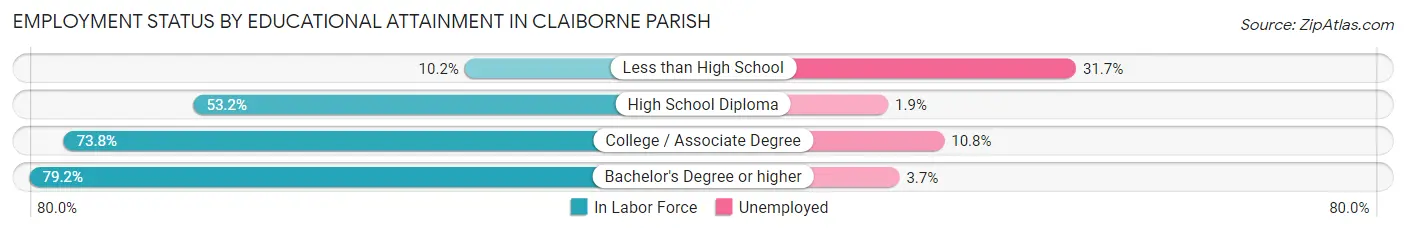
| Educational Attainment | In Labor Force | Unemployed |
| Less than High School | 167 (10.2%) | 520 (31.7%) |
| High School Diploma | 1,900 (53.2%) | 68 (1.9%) |
| College / Associate Degree | 1,066 (73.8%) | 156 (10.8%) |
| Bachelor's Degree or higher | 572 (79.2%) | 27 (3.7%) |
| Total | 3,704 (50.2%) | 443 (6.0%) |
Employment Occupations by Sex in Claiborne Parish
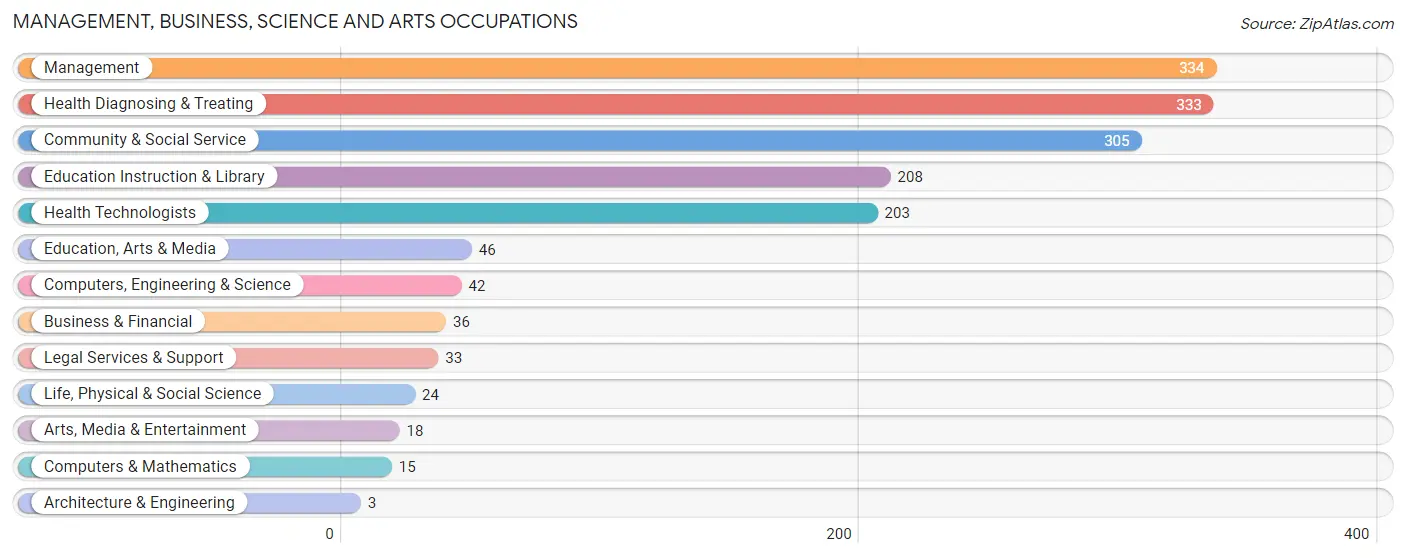
Management, Business, Science and Arts Occupations
The most common Management, Business, Science and Arts occupations in Claiborne Parish are Management (334 | 7.9%), Health Diagnosing & Treating (333 | 7.8%), Community & Social Service (305 | 7.2%), Education Instruction & Library (208 | 4.9%), and Health Technologists (203 | 4.8%).
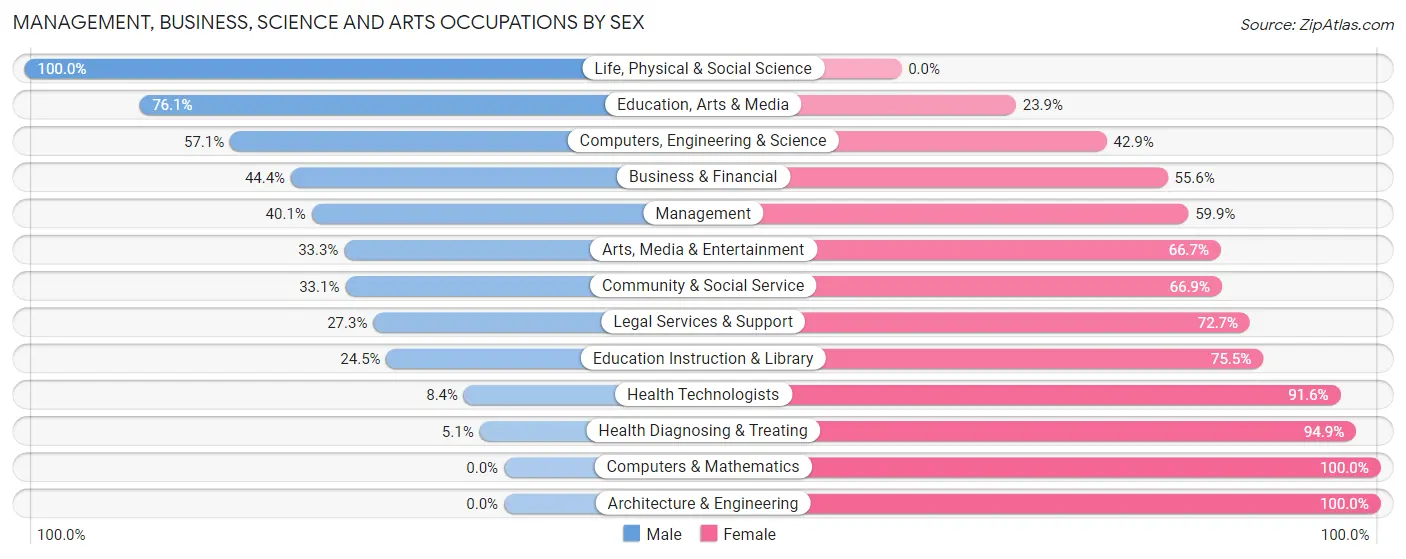
Management, Business, Science and Arts Occupations by Sex
Within the Management, Business, Science and Arts occupations in Claiborne Parish, the most male-oriented occupations are Life, Physical & Social Science (100.0%), Education, Arts & Media (76.1%), and Computers, Engineering & Science (57.1%), while the most female-oriented occupations are Computers & Mathematics (100.0%), Architecture & Engineering (100.0%), and Health Diagnosing & Treating (94.9%).
| Occupation | Male | Female |
| Management | 134 (40.1%) | 200 (59.9%) |
| Business & Financial | 16 (44.4%) | 20 (55.6%) |
| Computers, Engineering & Science | 24 (57.1%) | 18 (42.9%) |
| Computers & Mathematics | 0 (0.0%) | 15 (100.0%) |
| Architecture & Engineering | 0 (0.0%) | 3 (100.0%) |
| Life, Physical & Social Science | 24 (100.0%) | 0 (0.0%) |
| Community & Social Service | 101 (33.1%) | 204 (66.9%) |
| Education, Arts & Media | 35 (76.1%) | 11 (23.9%) |
| Legal Services & Support | 9 (27.3%) | 24 (72.7%) |
| Education Instruction & Library | 51 (24.5%) | 157 (75.5%) |
| Arts, Media & Entertainment | 6 (33.3%) | 12 (66.7%) |
| Health Diagnosing & Treating | 17 (5.1%) | 316 (94.9%) |
| Health Technologists | 17 (8.4%) | 186 (91.6%) |
| Total (Category) | 292 (27.8%) | 758 (72.2%) |
| Total (Overall) | 1,937 (45.6%) | 2,314 (54.4%) |
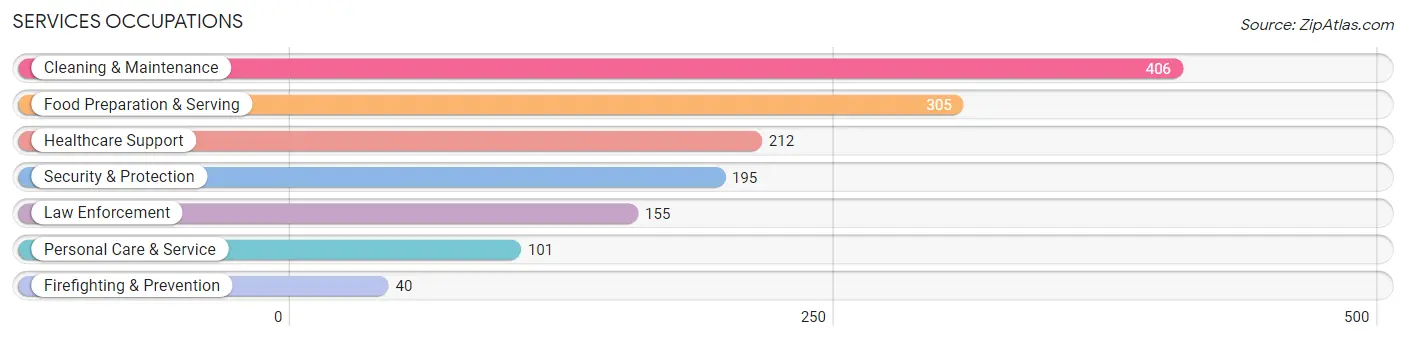
Services Occupations
The most common Services occupations in Claiborne Parish are Cleaning & Maintenance (406 | 9.6%), Food Preparation & Serving (305 | 7.2%), Healthcare Support (212 | 5.0%), Security & Protection (195 | 4.6%), and Law Enforcement (155 | 3.6%).
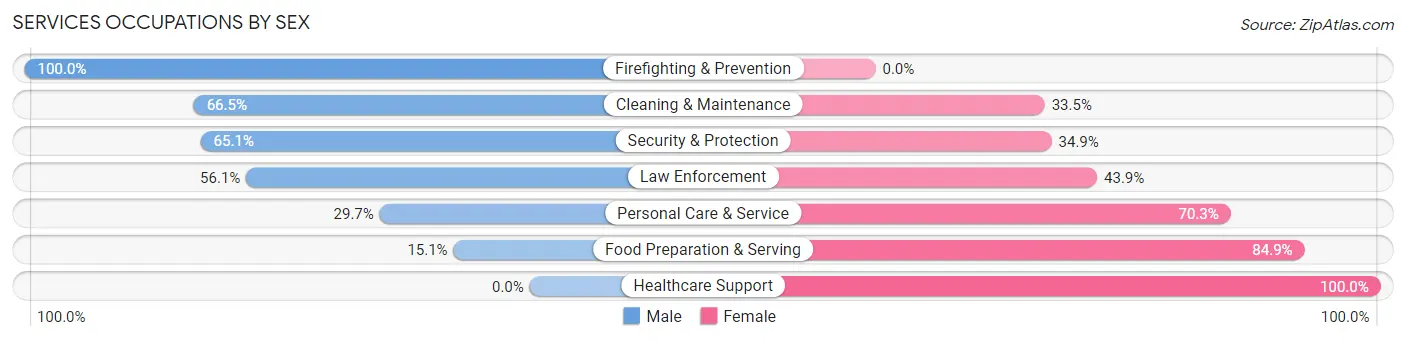
Services Occupations by Sex
Within the Services occupations in Claiborne Parish, the most male-oriented occupations are Firefighting & Prevention (100.0%), Cleaning & Maintenance (66.5%), and Security & Protection (65.1%), while the most female-oriented occupations are Healthcare Support (100.0%), Food Preparation & Serving (84.9%), and Personal Care & Service (70.3%).
| Occupation | Male | Female |
| Healthcare Support | 0 (0.0%) | 212 (100.0%) |
| Security & Protection | 127 (65.1%) | 68 (34.9%) |
| Firefighting & Prevention | 40 (100.0%) | 0 (0.0%) |
| Law Enforcement | 87 (56.1%) | 68 (43.9%) |
| Food Preparation & Serving | 46 (15.1%) | 259 (84.9%) |
| Cleaning & Maintenance | 270 (66.5%) | 136 (33.5%) |
| Personal Care & Service | 30 (29.7%) | 71 (70.3%) |
| Total (Category) | 473 (38.8%) | 746 (61.2%) |
| Total (Overall) | 1,937 (45.6%) | 2,314 (54.4%) |
Sales and Office Occupations
The most common Sales and Office occupations in Claiborne Parish are Office & Administration (575 | 13.5%), and Sales & Related (190 | 4.5%).
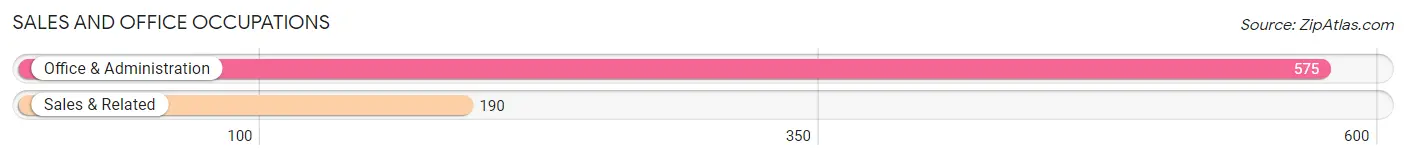
Sales and Office Occupations by Sex
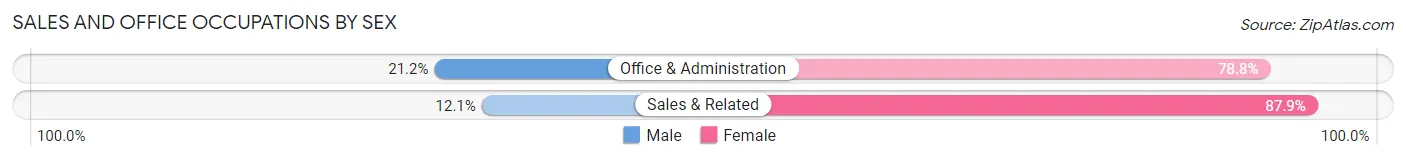
| Occupation | Male | Female |
| Sales & Related | 23 (12.1%) | 167 (87.9%) |
| Office & Administration | 122 (21.2%) | 453 (78.8%) |
| Total (Category) | 145 (19.0%) | 620 (81.0%) |
| Total (Overall) | 1,937 (45.6%) | 2,314 (54.4%) |
Natural Resources, Construction and Maintenance Occupations
The most common Natural Resources, Construction and Maintenance occupations in Claiborne Parish are Construction & Extraction (296 | 7.0%), Installation, Maintenance & Repair (194 | 4.6%), and Farming, Fishing & Forestry (125 | 2.9%).
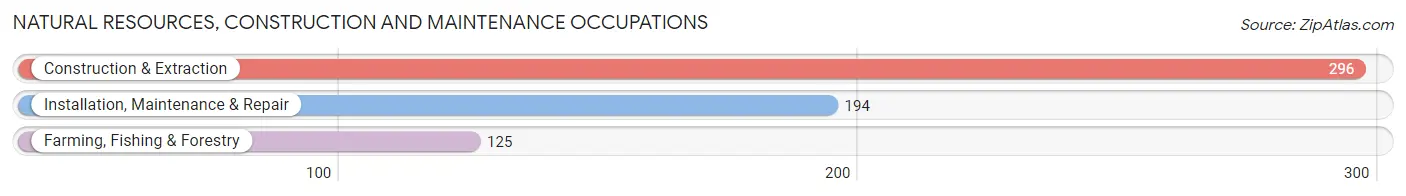
Natural Resources, Construction and Maintenance Occupations by Sex
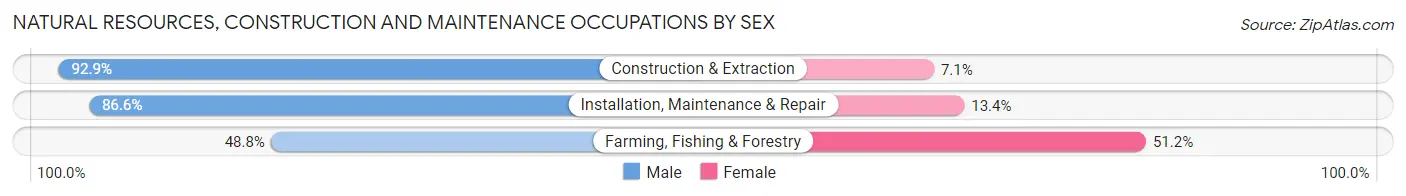
| Occupation | Male | Female |
| Farming, Fishing & Forestry | 61 (48.8%) | 64 (51.2%) |
| Construction & Extraction | 275 (92.9%) | 21 (7.1%) |
| Installation, Maintenance & Repair | 168 (86.6%) | 26 (13.4%) |
| Total (Category) | 504 (82.0%) | 111 (18.0%) |
| Total (Overall) | 1,937 (45.6%) | 2,314 (54.4%) |
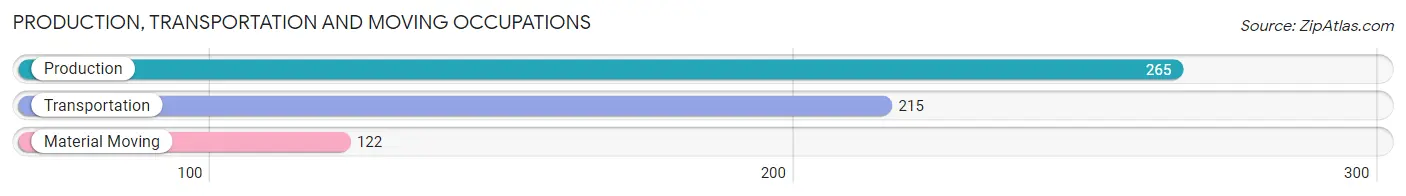
Production, Transportation and Moving Occupations
The most common Production, Transportation and Moving occupations in Claiborne Parish are Production (265 | 6.2%), Transportation (215 | 5.1%), and Material Moving (122 | 2.9%).
Production, Transportation and Moving Occupations by Sex
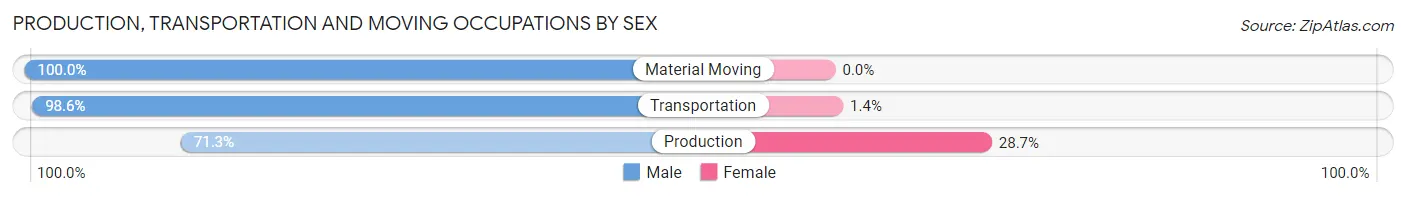
| Occupation | Male | Female |
| Production | 189 (71.3%) | 76 (28.7%) |
| Transportation | 212 (98.6%) | 3 (1.4%) |
| Material Moving | 122 (100.0%) | 0 (0.0%) |
| Total (Category) | 523 (86.9%) | 79 (13.1%) |
| Total (Overall) | 1,937 (45.6%) | 2,314 (54.4%) |
Employment Industries by Sex in Claiborne Parish
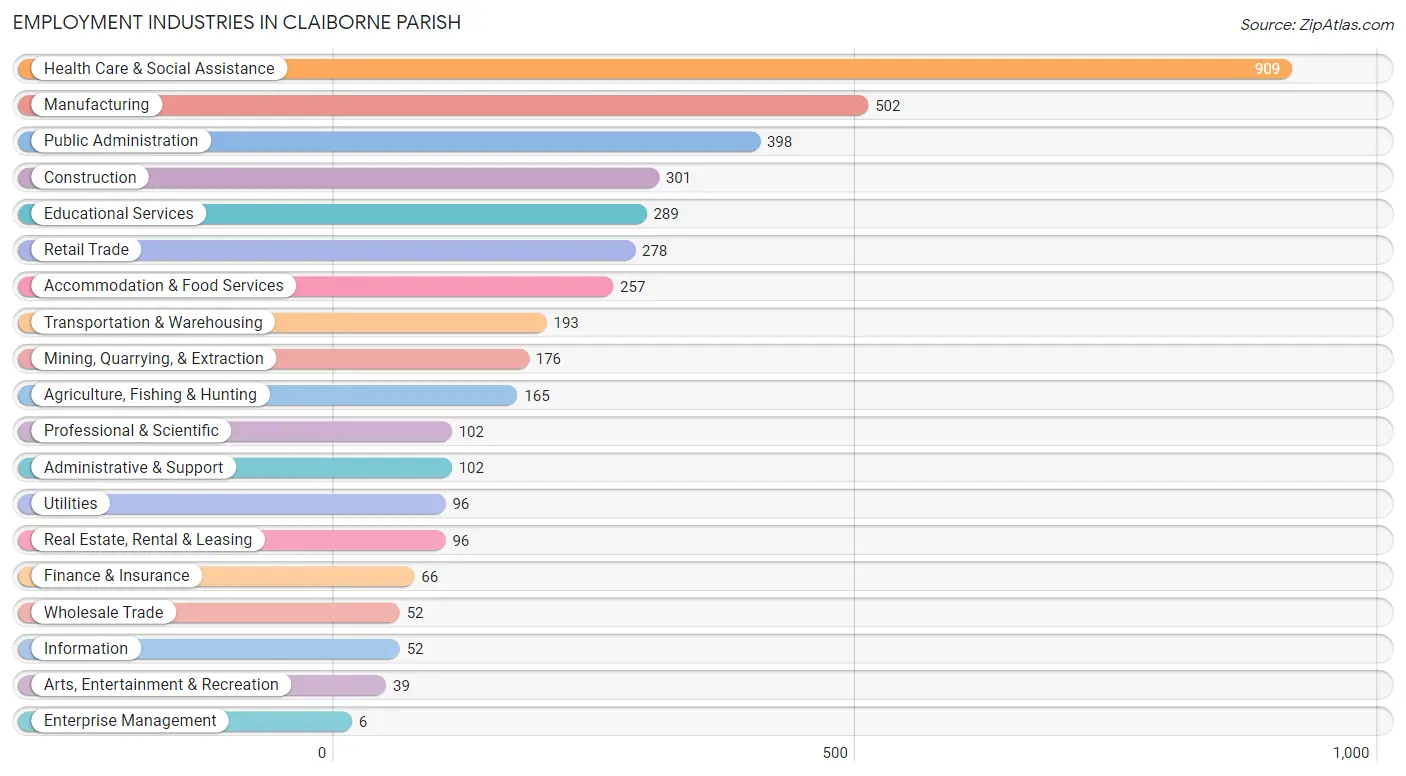
Employment Industries in Claiborne Parish
The major employment industries in Claiborne Parish include Health Care & Social Assistance (909 | 21.4%), Manufacturing (502 | 11.8%), Public Administration (398 | 9.4%), Construction (301 | 7.1%), and Educational Services (289 | 6.8%).
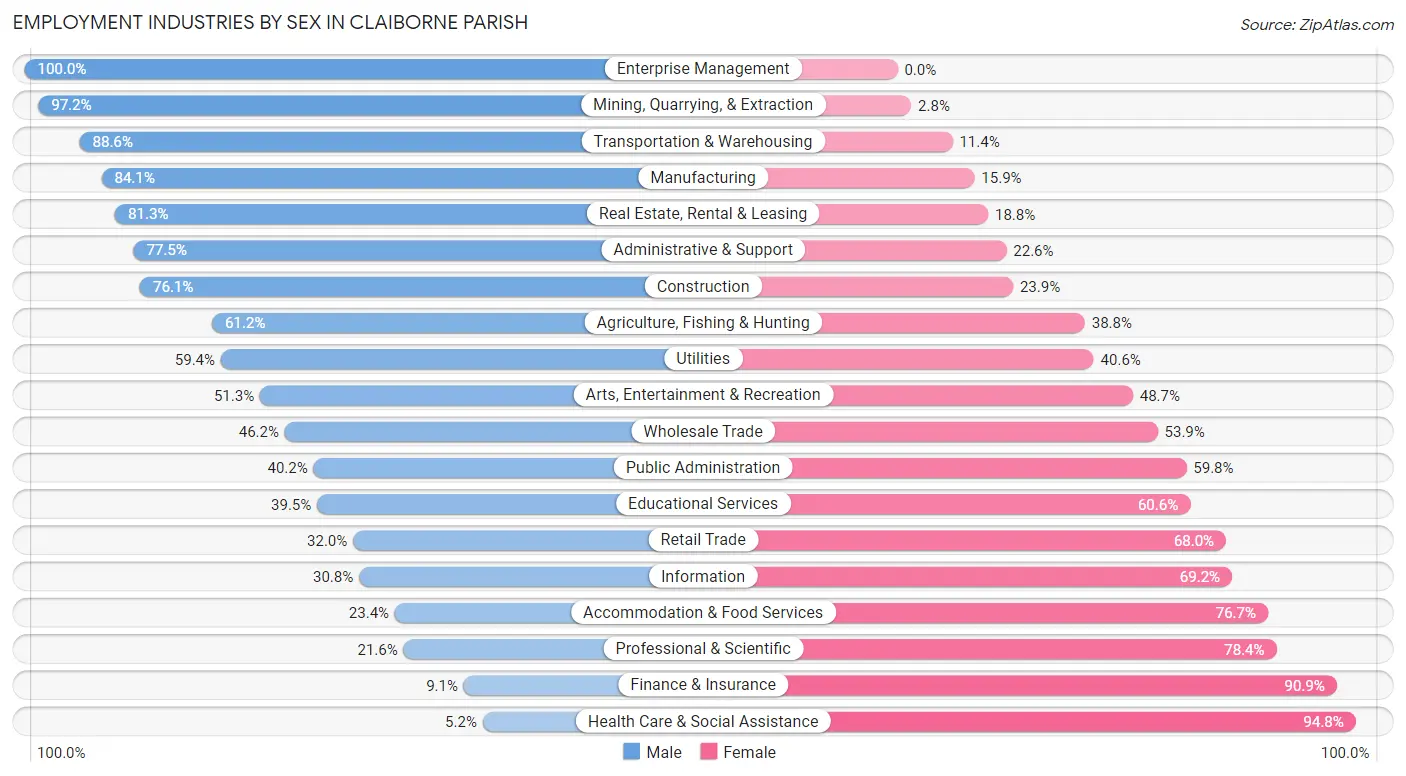
Employment Industries by Sex in Claiborne Parish
The Claiborne Parish industries that see more men than women are Enterprise Management (100.0%), Mining, Quarrying, & Extraction (97.2%), and Transportation & Warehousing (88.6%), whereas the industries that tend to have a higher number of women are Health Care & Social Assistance (94.8%), Finance & Insurance (90.9%), and Professional & Scientific (78.4%).
| Industry | Male | Female |
| Agriculture, Fishing & Hunting | 101 (61.2%) | 64 (38.8%) |
| Mining, Quarrying, & Extraction | 171 (97.2%) | 5 (2.8%) |
| Construction | 229 (76.1%) | 72 (23.9%) |
| Manufacturing | 422 (84.1%) | 80 (15.9%) |
| Wholesale Trade | 24 (46.2%) | 28 (53.8%) |
| Retail Trade | 89 (32.0%) | 189 (68.0%) |
| Transportation & Warehousing | 171 (88.6%) | 22 (11.4%) |
| Utilities | 57 (59.4%) | 39 (40.6%) |
| Information | 16 (30.8%) | 36 (69.2%) |
| Finance & Insurance | 6 (9.1%) | 60 (90.9%) |
| Real Estate, Rental & Leasing | 78 (81.2%) | 18 (18.8%) |
| Professional & Scientific | 22 (21.6%) | 80 (78.4%) |
| Enterprise Management | 6 (100.0%) | 0 (0.0%) |
| Administrative & Support | 79 (77.4%) | 23 (22.6%) |
| Educational Services | 114 (39.5%) | 175 (60.6%) |
| Health Care & Social Assistance | 47 (5.2%) | 862 (94.8%) |
| Arts, Entertainment & Recreation | 20 (51.3%) | 19 (48.7%) |
| Accommodation & Food Services | 60 (23.4%) | 197 (76.6%) |
| Public Administration | 160 (40.2%) | 238 (59.8%) |
| Total | 1,937 (45.6%) | 2,314 (54.4%) |
Education in Claiborne Parish
School Enrollment in Claiborne Parish
The most common levels of schooling among the 2,867 students in Claiborne Parish are high school (709 | 24.7%), middle school (697 | 24.3%), and elementary school (606 | 21.1%).
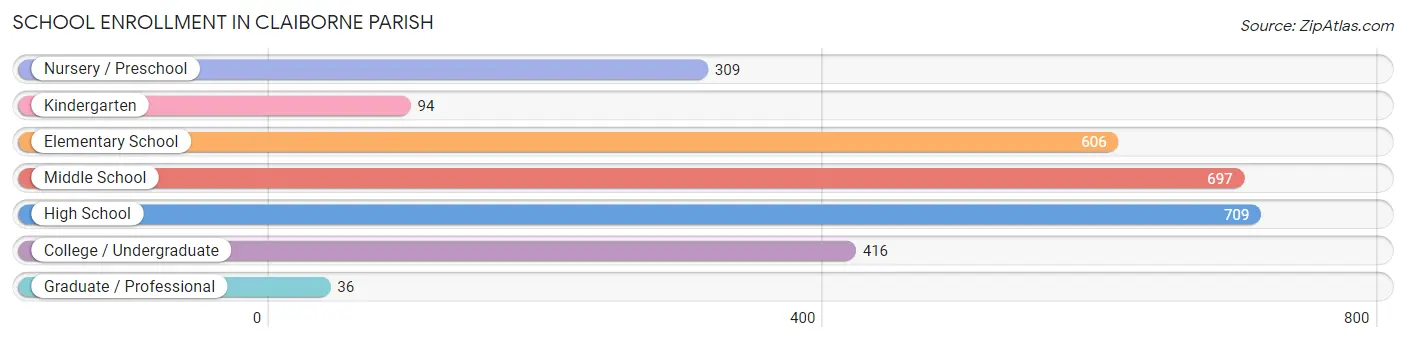
| School Level | # Students | % Students |
| Nursery / Preschool | 309 | 10.8% |
| Kindergarten | 94 | 3.3% |
| Elementary School | 606 | 21.1% |
| Middle School | 697 | 24.3% |
| High School | 709 | 24.7% |
| College / Undergraduate | 416 | 14.5% |
| Graduate / Professional | 36 | 1.3% |
| Total | 2,867 | 100.0% |
School Enrollment by Age by Funding Source in Claiborne Parish
Out of a total of 2,867 students who are enrolled in schools in Claiborne Parish, 264 (9.2%) attend a private institution, while the remaining 2,603 (90.8%) are enrolled in public schools. The age group of 35 years and over has the highest likelihood of being enrolled in private schools, with 60 (48.4% in the age bracket) enrolled. Conversely, the age group of 18 to 19 year olds has the lowest likelihood of being enrolled in a private school, with 164 (99.4% in the age bracket) attending a public institution.
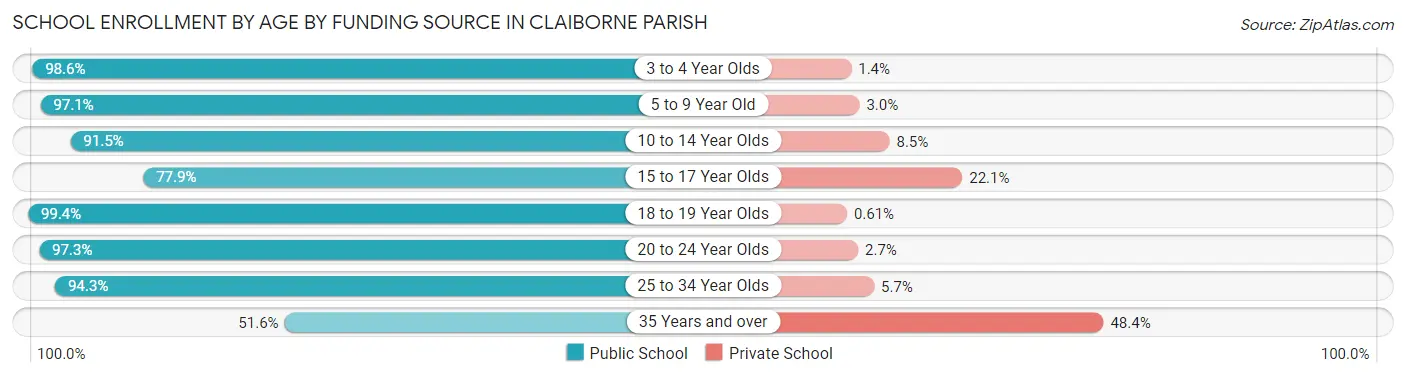
| Age Bracket | Public School | Private School |
| 3 to 4 Year Olds | 278 (98.6%) | 4 (1.4%) |
| 5 to 9 Year Old | 659 (97.1%) | 20 (2.9%) |
| 10 to 14 Year Olds | 696 (91.5%) | 65 (8.5%) |
| 15 to 17 Year Olds | 342 (77.9%) | 97 (22.1%) |
| 18 to 19 Year Olds | 164 (99.4%) | 1 (0.6%) |
| 20 to 24 Year Olds | 217 (97.3%) | 6 (2.7%) |
| 25 to 34 Year Olds | 183 (94.3%) | 11 (5.7%) |
| 35 Years and over | 64 (51.6%) | 60 (48.4%) |
| Total | 2,603 (90.8%) | 264 (9.2%) |
Educational Attainment by Field of Study in Claiborne Parish
Business (337 | 27.2%), education (251 | 20.2%), science & technology (206 | 16.6%), liberal arts & history (89 | 7.2%), and bio, nature & agricultural (72 | 5.8%) are the most common fields of study among 1,240 individuals in Claiborne Parish who have obtained a bachelor's degree or higher.
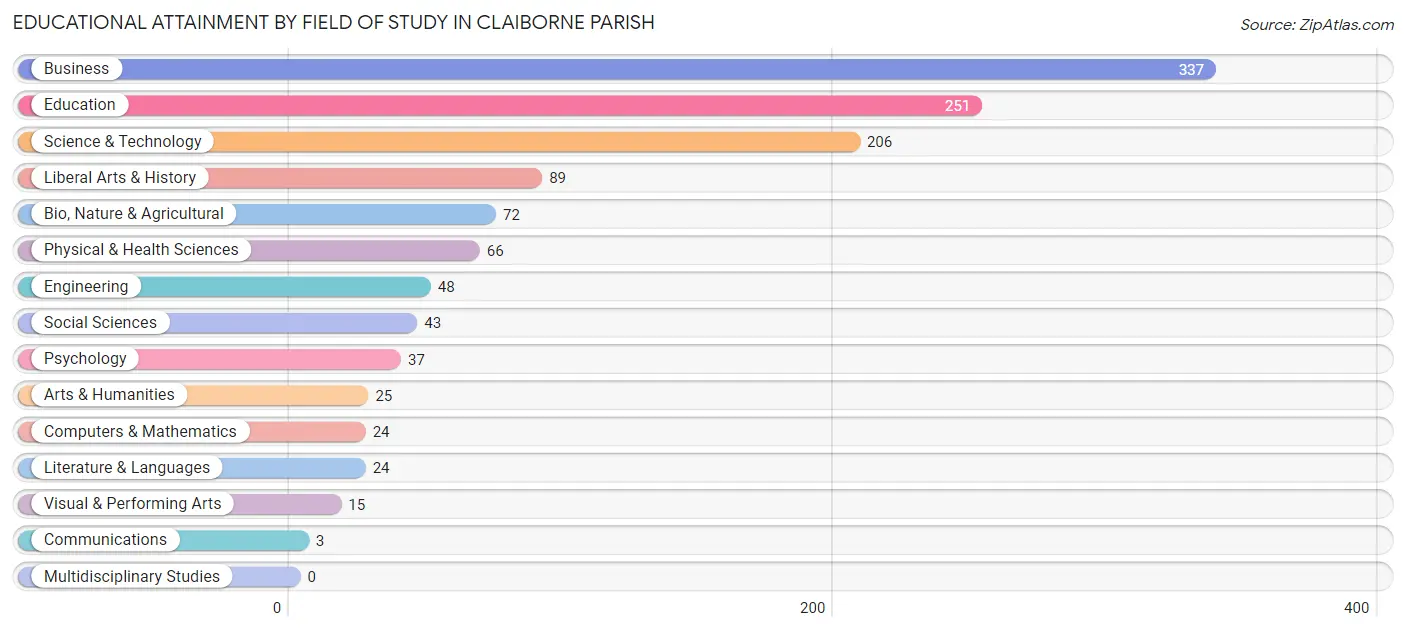
| Field of Study | # Graduates | % Graduates |
| Computers & Mathematics | 24 | 1.9% |
| Bio, Nature & Agricultural | 72 | 5.8% |
| Physical & Health Sciences | 66 | 5.3% |
| Psychology | 37 | 3.0% |
| Social Sciences | 43 | 3.5% |
| Engineering | 48 | 3.9% |
| Multidisciplinary Studies | 0 | 0.0% |
| Science & Technology | 206 | 16.6% |
| Business | 337 | 27.2% |
| Education | 251 | 20.2% |
| Literature & Languages | 24 | 1.9% |
| Liberal Arts & History | 89 | 7.2% |
| Visual & Performing Arts | 15 | 1.2% |
| Communications | 3 | 0.2% |
| Arts & Humanities | 25 | 2.0% |
| Total | 1,240 | 100.0% |
Transportation & Commute in Claiborne Parish
Vehicle Availability by Sex in Claiborne Parish
The most prevalent vehicle ownership categories in Claiborne Parish are males with 2 vehicles (669, accounting for 36.4%) and females with 2 vehicles (908, making up 29.4%).
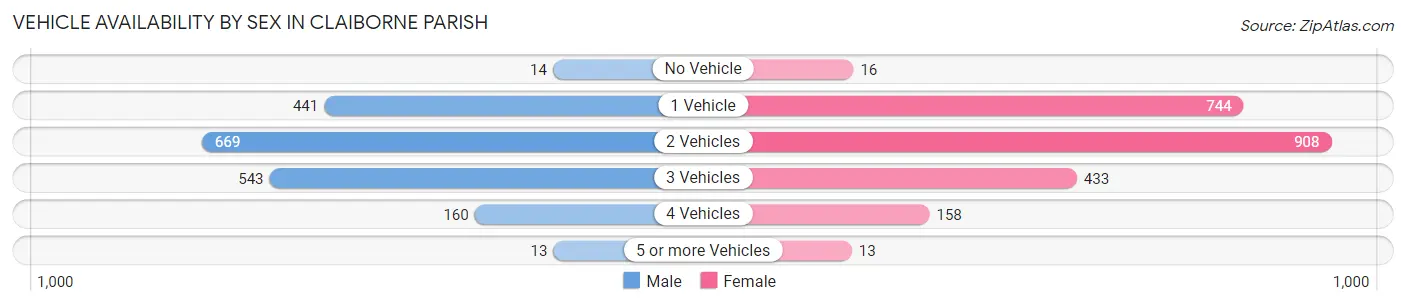
| Vehicles Available | Male | Female |
| No Vehicle | 14 (0.8%) | 16 (0.7%) |
| 1 Vehicle | 441 (24.0%) | 744 (32.8%) |
| 2 Vehicles | 669 (36.4%) | 908 (40.0%) |
| 3 Vehicles | 543 (29.5%) | 433 (19.1%) |
| 4 Vehicles | 160 (8.7%) | 158 (7.0%) |
| 5 or more Vehicles | 13 (0.7%) | 13 (0.6%) |
| Total | 1,840 (100.0%) | 2,272 (100.0%) |
Commute Time in Claiborne Parish
The most frequently occuring commute durations in Claiborne Parish are 15 to 19 minutes (587 commuters, 14.7%), 20 to 24 minutes (531 commuters, 13.3%), and 30 to 34 minutes (503 commuters, 12.6%).
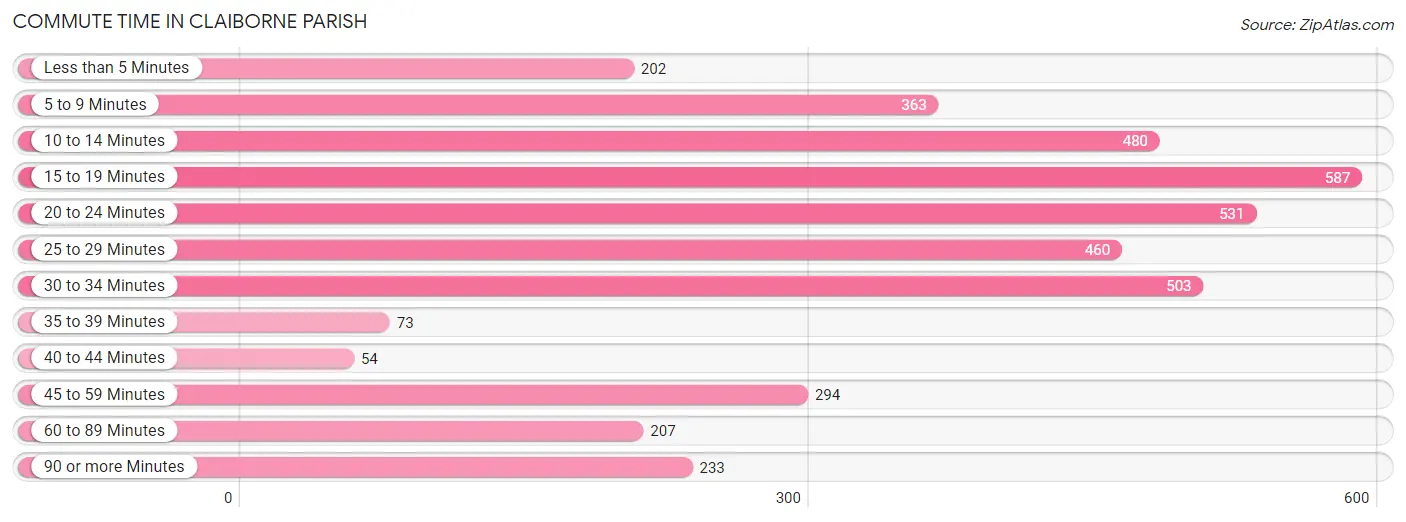
| Commute Time | # Commuters | % Commuters |
| Less than 5 Minutes | 202 | 5.1% |
| 5 to 9 Minutes | 363 | 9.1% |
| 10 to 14 Minutes | 480 | 12.0% |
| 15 to 19 Minutes | 587 | 14.7% |
| 20 to 24 Minutes | 531 | 13.3% |
| 25 to 29 Minutes | 460 | 11.5% |
| 30 to 34 Minutes | 503 | 12.6% |
| 35 to 39 Minutes | 73 | 1.8% |
| 40 to 44 Minutes | 54 | 1.3% |
| 45 to 59 Minutes | 294 | 7.4% |
| 60 to 89 Minutes | 207 | 5.2% |
| 90 or more Minutes | 233 | 5.8% |
Commute Time by Sex in Claiborne Parish
The most common commute times in Claiborne Parish are 10 to 14 minutes (321 commuters, 17.6%) for males and 20 to 24 minutes (362 commuters, 16.7%) for females.
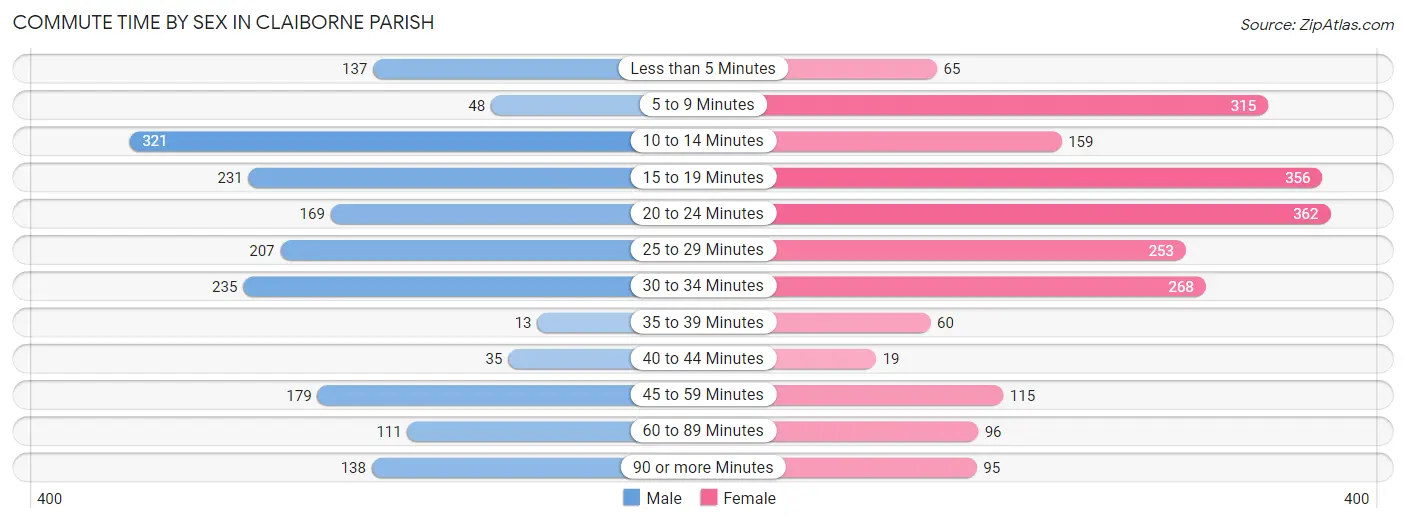
| Commute Time | Male | Female |
| Less than 5 Minutes | 137 (7.5%) | 65 (3.0%) |
| 5 to 9 Minutes | 48 (2.6%) | 315 (14.6%) |
| 10 to 14 Minutes | 321 (17.6%) | 159 (7.3%) |
| 15 to 19 Minutes | 231 (12.7%) | 356 (16.5%) |
| 20 to 24 Minutes | 169 (9.3%) | 362 (16.7%) |
| 25 to 29 Minutes | 207 (11.4%) | 253 (11.7%) |
| 30 to 34 Minutes | 235 (12.9%) | 268 (12.4%) |
| 35 to 39 Minutes | 13 (0.7%) | 60 (2.8%) |
| 40 to 44 Minutes | 35 (1.9%) | 19 (0.9%) |
| 45 to 59 Minutes | 179 (9.8%) | 115 (5.3%) |
| 60 to 89 Minutes | 111 (6.1%) | 96 (4.4%) |
| 90 or more Minutes | 138 (7.6%) | 95 (4.4%) |
Time of Departure to Work by Sex in Claiborne Parish
The most frequent times of departure to work in Claiborne Parish are 7:00 AM to 7:29 AM (312, 17.1%) for males and 7:00 AM to 7:29 AM (403, 18.6%) for females.
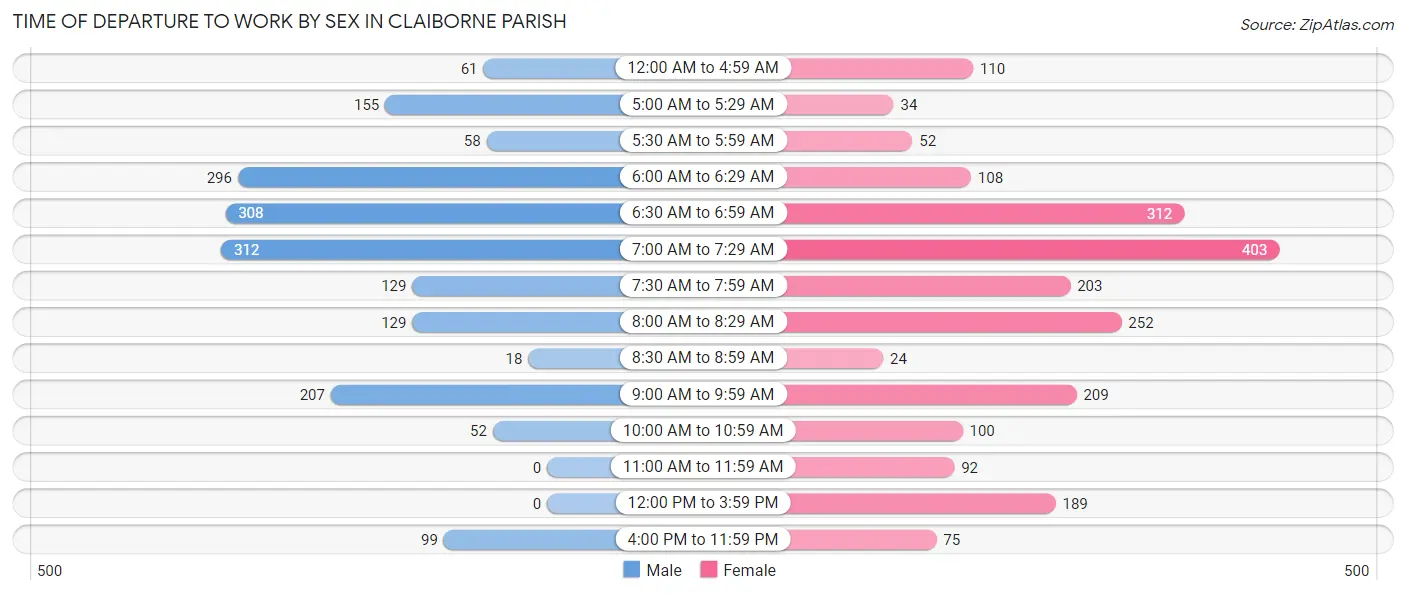
| Time of Departure | Male | Female |
| 12:00 AM to 4:59 AM | 61 (3.3%) | 110 (5.1%) |
| 5:00 AM to 5:29 AM | 155 (8.5%) | 34 (1.6%) |
| 5:30 AM to 5:59 AM | 58 (3.2%) | 52 (2.4%) |
| 6:00 AM to 6:29 AM | 296 (16.2%) | 108 (5.0%) |
| 6:30 AM to 6:59 AM | 308 (16.9%) | 312 (14.4%) |
| 7:00 AM to 7:29 AM | 312 (17.1%) | 403 (18.6%) |
| 7:30 AM to 7:59 AM | 129 (7.1%) | 203 (9.4%) |
| 8:00 AM to 8:29 AM | 129 (7.1%) | 252 (11.7%) |
| 8:30 AM to 8:59 AM | 18 (1.0%) | 24 (1.1%) |
| 9:00 AM to 9:59 AM | 207 (11.4%) | 209 (9.7%) |
| 10:00 AM to 10:59 AM | 52 (2.9%) | 100 (4.6%) |
| 11:00 AM to 11:59 AM | 0 (0.0%) | 92 (4.3%) |
| 12:00 PM to 3:59 PM | 0 (0.0%) | 189 (8.7%) |
| 4:00 PM to 11:59 PM | 99 (5.4%) | 75 (3.5%) |
| Total | 1,824 (100.0%) | 2,163 (100.0%) |
Housing Occupancy in Claiborne Parish
Occupancy by Ownership in Claiborne Parish
Of the total 5,060 dwellings in Claiborne Parish, owner-occupied units account for 3,646 (72.1%), while renter-occupied units make up 1,414 (27.9%).
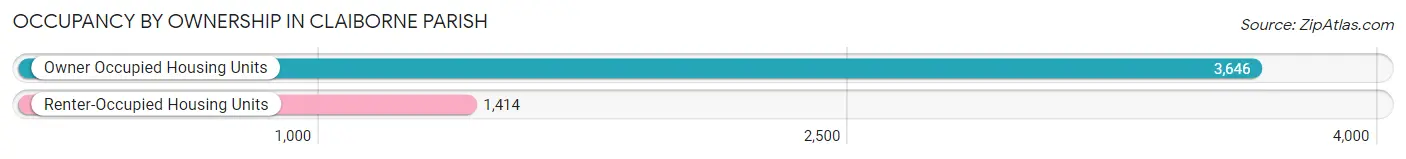
| Occupancy | # Housing Units | % Housing Units |
| Owner Occupied Housing Units | 3,646 | 72.1% |
| Renter-Occupied Housing Units | 1,414 | 27.9% |
| Total Occupied Housing Units | 5,060 | 100.0% |
Occupancy by Household Size in Claiborne Parish
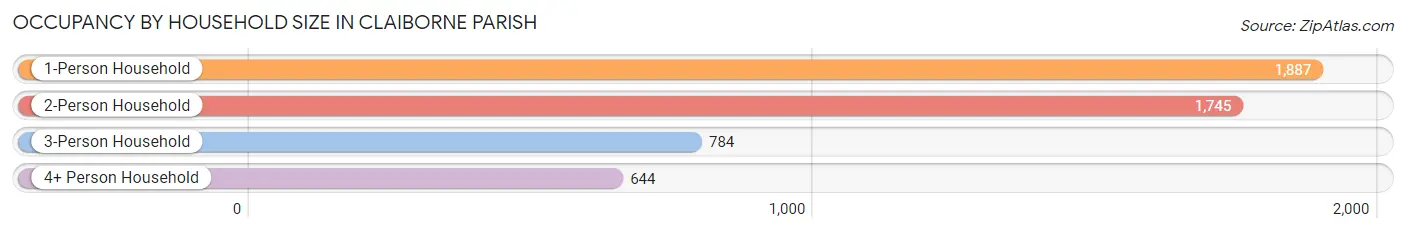
| Household Size | # Housing Units | % Housing Units |
| 1-Person Household | 1,887 | 37.3% |
| 2-Person Household | 1,745 | 34.5% |
| 3-Person Household | 784 | 15.5% |
| 4+ Person Household | 644 | 12.7% |
| Total Housing Units | 5,060 | 100.0% |
Occupancy by Ownership by Household Size in Claiborne Parish
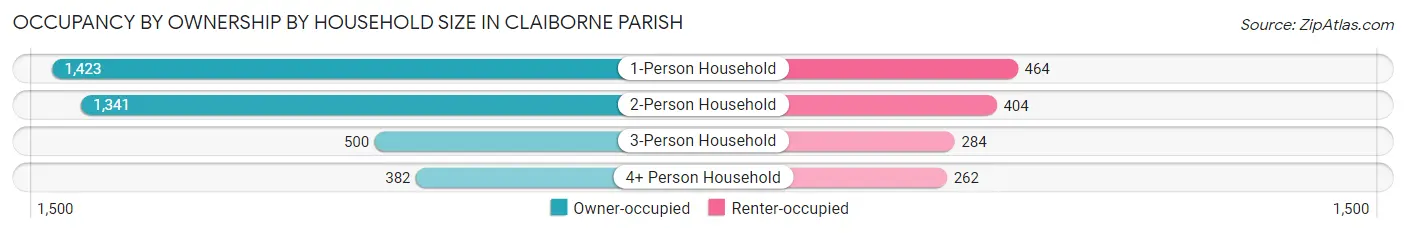
| Household Size | Owner-occupied | Renter-occupied |
| 1-Person Household | 1,423 (75.4%) | 464 (24.6%) |
| 2-Person Household | 1,341 (76.8%) | 404 (23.2%) |
| 3-Person Household | 500 (63.8%) | 284 (36.2%) |
| 4+ Person Household | 382 (59.3%) | 262 (40.7%) |
| Total Housing Units | 3,646 (72.1%) | 1,414 (27.9%) |
Occupancy by Educational Attainment in Claiborne Parish
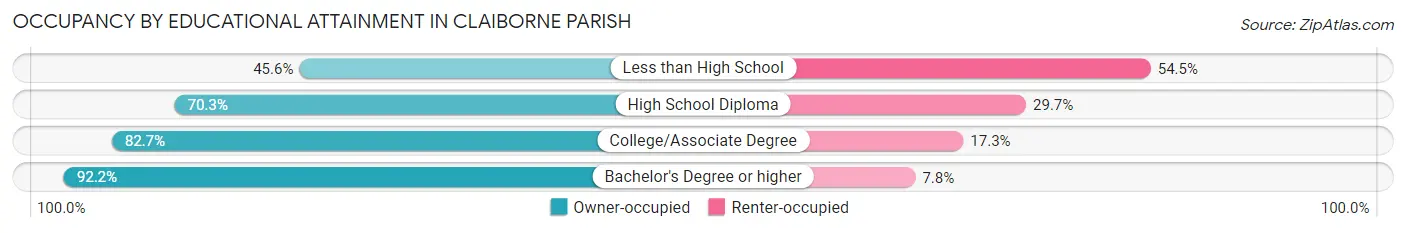
| Household Size | Owner-occupied | Renter-occupied |
| Less than High School | 409 (45.6%) | 489 (54.4%) |
| High School Diploma | 1,539 (70.3%) | 651 (29.7%) |
| College/Associate Degree | 1,047 (82.7%) | 219 (17.3%) |
| Bachelor's Degree or higher | 651 (92.2%) | 55 (7.8%) |
Occupancy by Age of Householder in Claiborne Parish
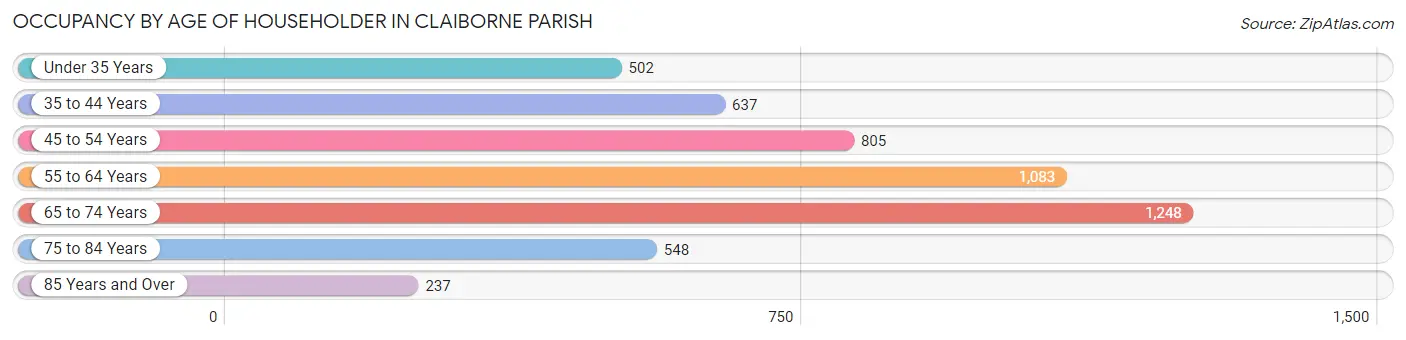
| Age Bracket | # Households | % Households |
| Under 35 Years | 502 | 9.9% |
| 35 to 44 Years | 637 | 12.6% |
| 45 to 54 Years | 805 | 15.9% |
| 55 to 64 Years | 1,083 | 21.4% |
| 65 to 74 Years | 1,248 | 24.7% |
| 75 to 84 Years | 548 | 10.8% |
| 85 Years and Over | 237 | 4.7% |
| Total | 5,060 | 100.0% |
Housing Finances in Claiborne Parish
Median Income by Occupancy in Claiborne Parish
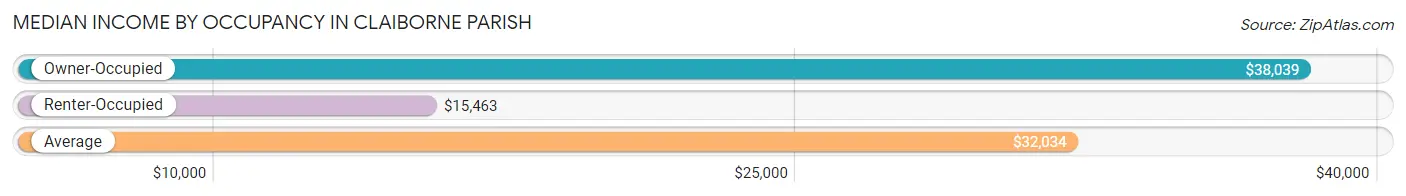
| Occupancy Type | # Households | Median Income |
| Owner-Occupied | 3,646 (72.1%) | $38,039 |
| Renter-Occupied | 1,414 (27.9%) | $15,463 |
| Average | 5,060 (100.0%) | $32,034 |
Occupancy by Householder Income Bracket in Claiborne Parish
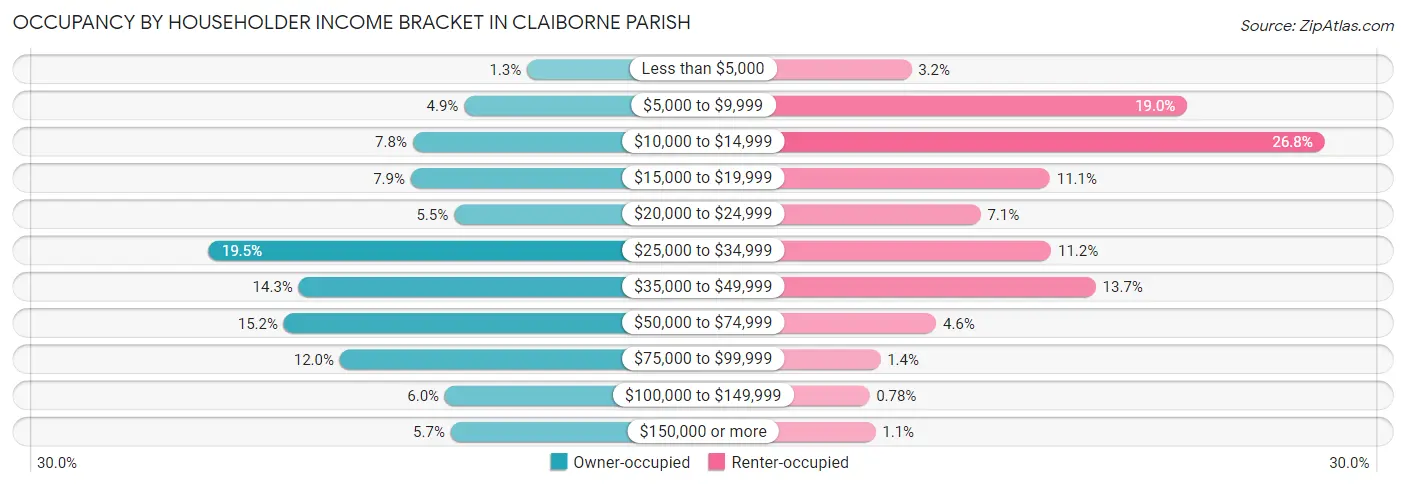
| Income Bracket | Owner-occupied | Renter-occupied |
| Less than $5,000 | 47 (1.3%) | 45 (3.2%) |
| $5,000 to $9,999 | 178 (4.9%) | 268 (19.0%) |
| $10,000 to $14,999 | 285 (7.8%) | 379 (26.8%) |
| $15,000 to $19,999 | 289 (7.9%) | 157 (11.1%) |
| $20,000 to $24,999 | 199 (5.5%) | 101 (7.1%) |
| $25,000 to $34,999 | 710 (19.5%) | 158 (11.2%) |
| $35,000 to $49,999 | 523 (14.3%) | 194 (13.7%) |
| $50,000 to $74,999 | 554 (15.2%) | 65 (4.6%) |
| $75,000 to $99,999 | 437 (12.0%) | 20 (1.4%) |
| $100,000 to $149,999 | 218 (6.0%) | 11 (0.8%) |
| $150,000 or more | 206 (5.7%) | 16 (1.1%) |
| Total | 3,646 (100.0%) | 1,414 (100.0%) |
Monthly Housing Cost Tiers in Claiborne Parish
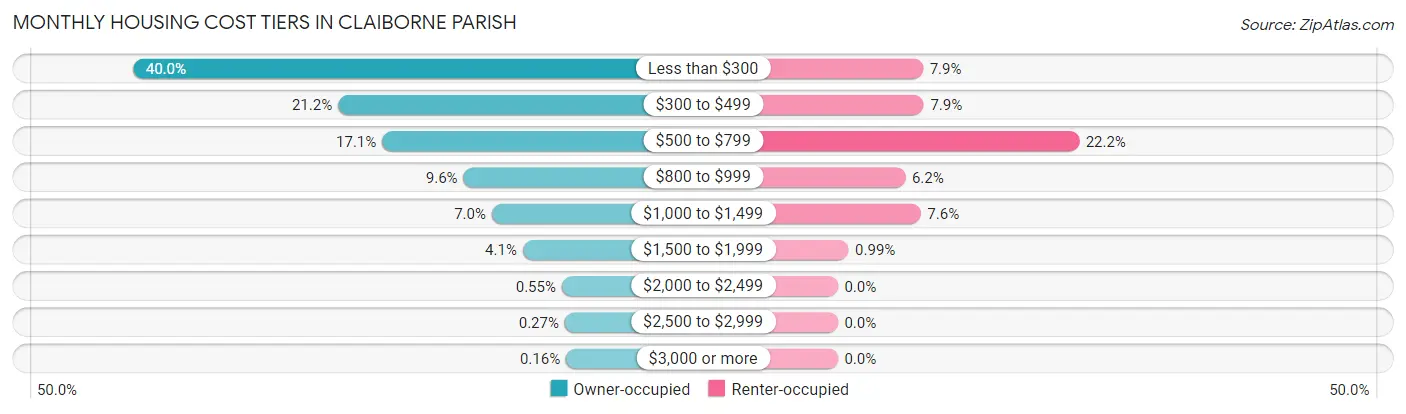
| Monthly Cost | Owner-occupied | Renter-occupied |
| Less than $300 | 1,460 (40.0%) | 111 (7.9%) |
| $300 to $499 | 771 (21.1%) | 112 (7.9%) |
| $500 to $799 | 623 (17.1%) | 314 (22.2%) |
| $800 to $999 | 350 (9.6%) | 88 (6.2%) |
| $1,000 to $1,499 | 255 (7.0%) | 108 (7.6%) |
| $1,500 to $1,999 | 151 (4.1%) | 14 (1.0%) |
| $2,000 to $2,499 | 20 (0.5%) | 0 (0.0%) |
| $2,500 to $2,999 | 10 (0.3%) | 0 (0.0%) |
| $3,000 or more | 6 (0.2%) | 0 (0.0%) |
| Total | 3,646 (100.0%) | 1,414 (100.0%) |
Physical Housing Characteristics in Claiborne Parish
Housing Structures in Claiborne Parish
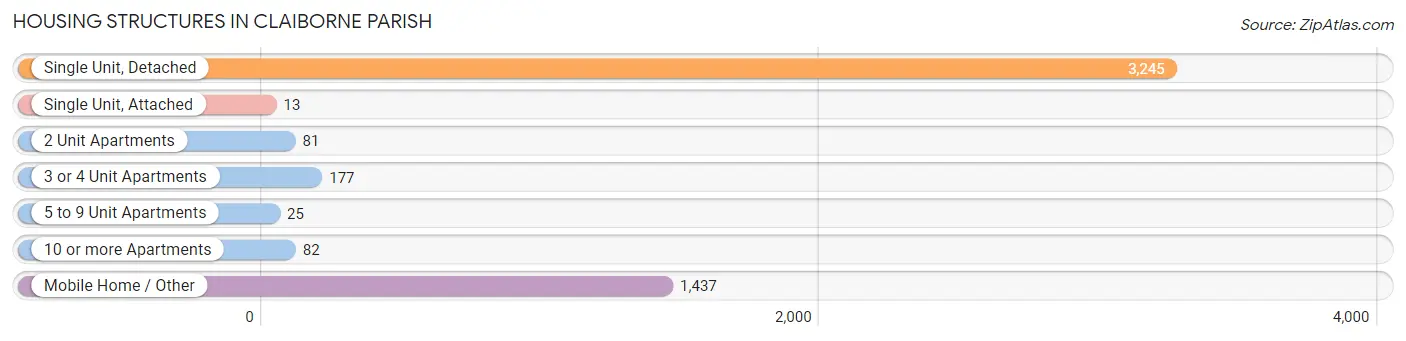
| Structure Type | # Housing Units | % Housing Units |
| Single Unit, Detached | 3,245 | 64.1% |
| Single Unit, Attached | 13 | 0.3% |
| 2 Unit Apartments | 81 | 1.6% |
| 3 or 4 Unit Apartments | 177 | 3.5% |
| 5 to 9 Unit Apartments | 25 | 0.5% |
| 10 or more Apartments | 82 | 1.6% |
| Mobile Home / Other | 1,437 | 28.4% |
| Total | 5,060 | 100.0% |
Housing Structures by Occupancy in Claiborne Parish
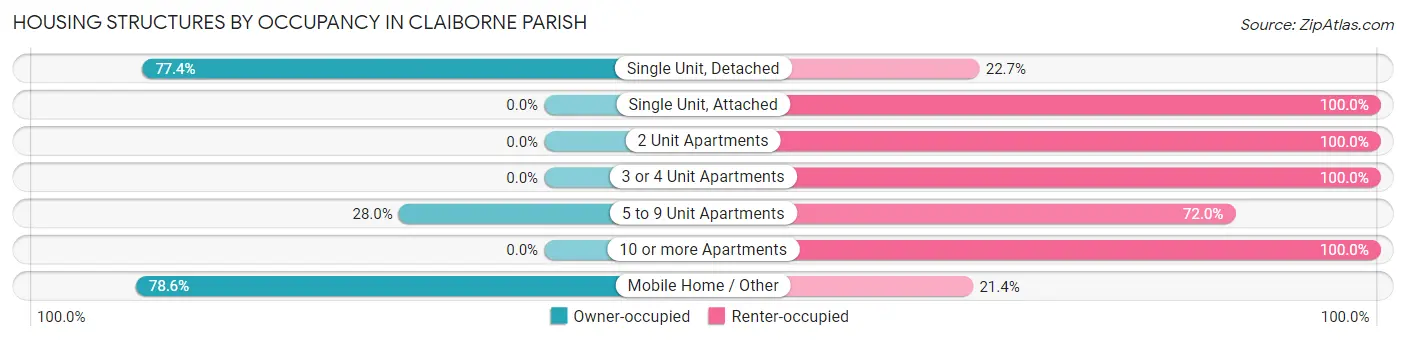
| Structure Type | Owner-occupied | Renter-occupied |
| Single Unit, Detached | 2,510 (77.3%) | 735 (22.7%) |
| Single Unit, Attached | 0 (0.0%) | 13 (100.0%) |
| 2 Unit Apartments | 0 (0.0%) | 81 (100.0%) |
| 3 or 4 Unit Apartments | 0 (0.0%) | 177 (100.0%) |
| 5 to 9 Unit Apartments | 7 (28.0%) | 18 (72.0%) |
| 10 or more Apartments | 0 (0.0%) | 82 (100.0%) |
| Mobile Home / Other | 1,129 (78.6%) | 308 (21.4%) |
| Total | 3,646 (72.1%) | 1,414 (27.9%) |
Housing Structures by Number of Rooms in Claiborne Parish
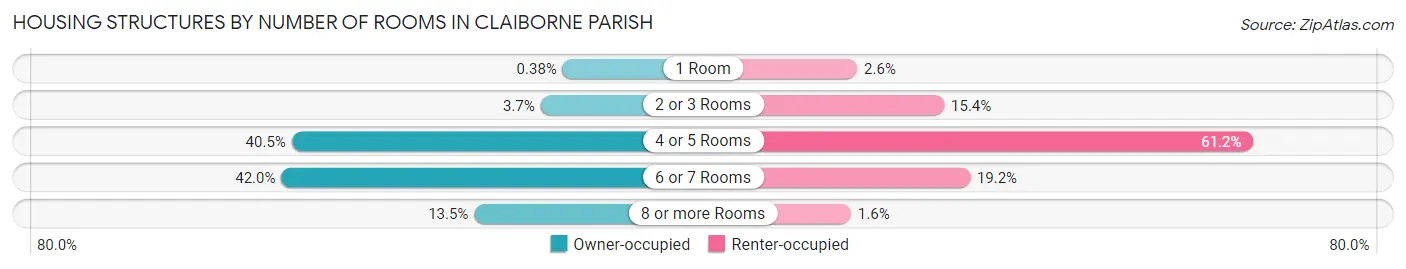
| Number of Rooms | Owner-occupied | Renter-occupied |
| 1 Room | 14 (0.4%) | 36 (2.5%) |
| 2 or 3 Rooms | 133 (3.6%) | 218 (15.4%) |
| 4 or 5 Rooms | 1,476 (40.5%) | 865 (61.2%) |
| 6 or 7 Rooms | 1,532 (42.0%) | 272 (19.2%) |
| 8 or more Rooms | 491 (13.5%) | 23 (1.6%) |
| Total | 3,646 (100.0%) | 1,414 (100.0%) |
Housing Structure by Heating Type in Claiborne Parish
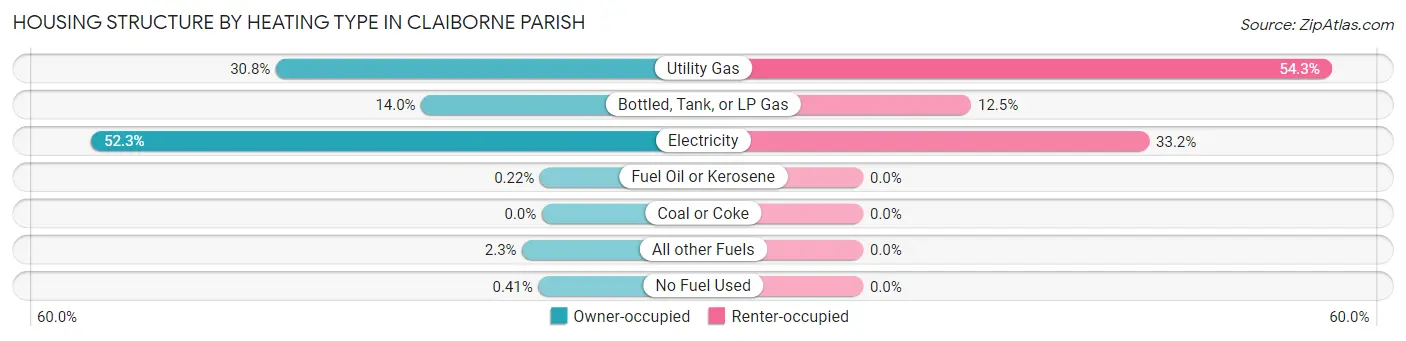
| Heating Type | Owner-occupied | Renter-occupied |
| Utility Gas | 1,124 (30.8%) | 768 (54.3%) |
| Bottled, Tank, or LP Gas | 510 (14.0%) | 177 (12.5%) |
| Electricity | 1,906 (52.3%) | 469 (33.2%) |
| Fuel Oil or Kerosene | 8 (0.2%) | 0 (0.0%) |
| Coal or Coke | 0 (0.0%) | 0 (0.0%) |
| All other Fuels | 83 (2.3%) | 0 (0.0%) |
| No Fuel Used | 15 (0.4%) | 0 (0.0%) |
| Total | 3,646 (100.0%) | 1,414 (100.0%) |
Household Vehicle Usage in Claiborne Parish
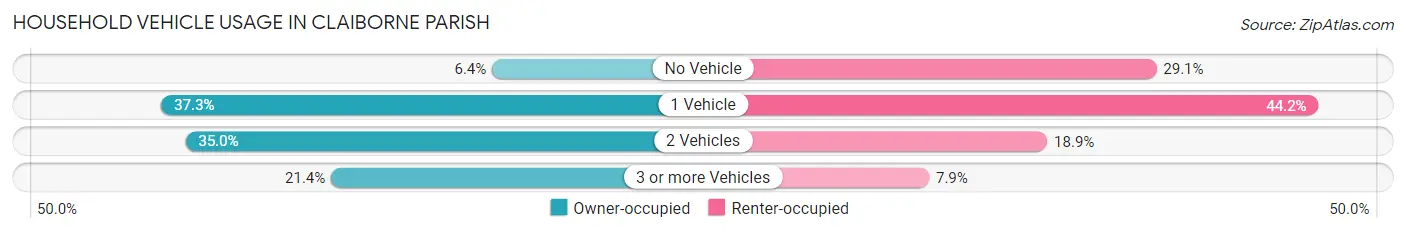
| Vehicles per Household | Owner-occupied | Renter-occupied |
| No Vehicle | 232 (6.4%) | 411 (29.1%) |
| 1 Vehicle | 1,358 (37.2%) | 625 (44.2%) |
| 2 Vehicles | 1,276 (35.0%) | 267 (18.9%) |
| 3 or more Vehicles | 780 (21.4%) | 111 (7.9%) |
| Total | 3,646 (100.0%) | 1,414 (100.0%) |
Real Estate & Mortgages in Claiborne Parish
Real Estate and Mortgage Overview in Claiborne Parish
| Characteristic | Without Mortgage | With Mortgage |
| Housing Units | 2,534 | 1,112 |
| Median Property Value | $73,600 | $87,200 |
| Median Household Income | $33,167 | $112 |
| Monthly Housing Costs | $269 | $6 |
| Real Estate Taxes | $212 | $498 |
Property Value by Mortgage Status in Claiborne Parish
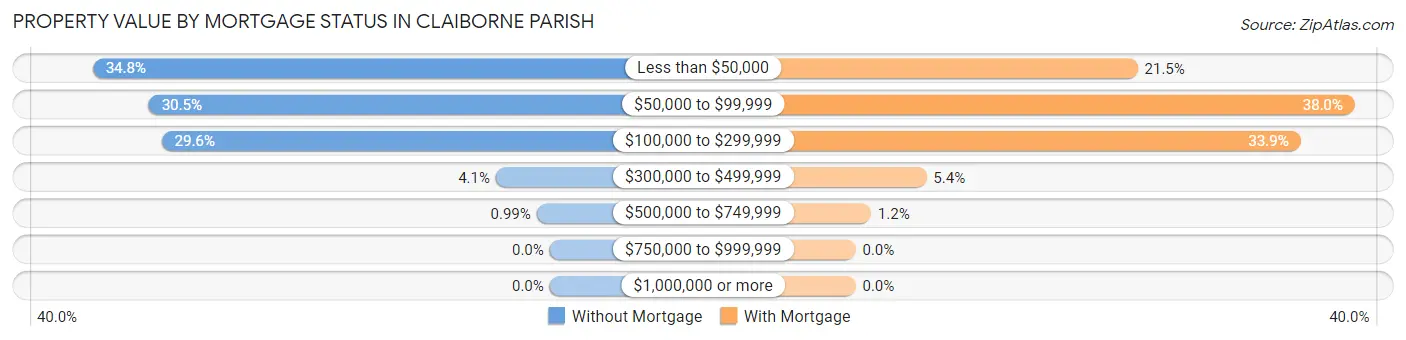
| Property Value | Without Mortgage | With Mortgage |
| Less than $50,000 | 882 (34.8%) | 239 (21.5%) |
| $50,000 to $99,999 | 774 (30.5%) | 423 (38.0%) |
| $100,000 to $299,999 | 749 (29.6%) | 377 (33.9%) |
| $300,000 to $499,999 | 104 (4.1%) | 60 (5.4%) |
| $500,000 to $749,999 | 25 (1.0%) | 13 (1.2%) |
| $750,000 to $999,999 | 0 (0.0%) | 0 (0.0%) |
| $1,000,000 or more | 0 (0.0%) | 0 (0.0%) |
| Total | 2,534 (100.0%) | 1,112 (100.0%) |
Household Income by Mortgage Status in Claiborne Parish
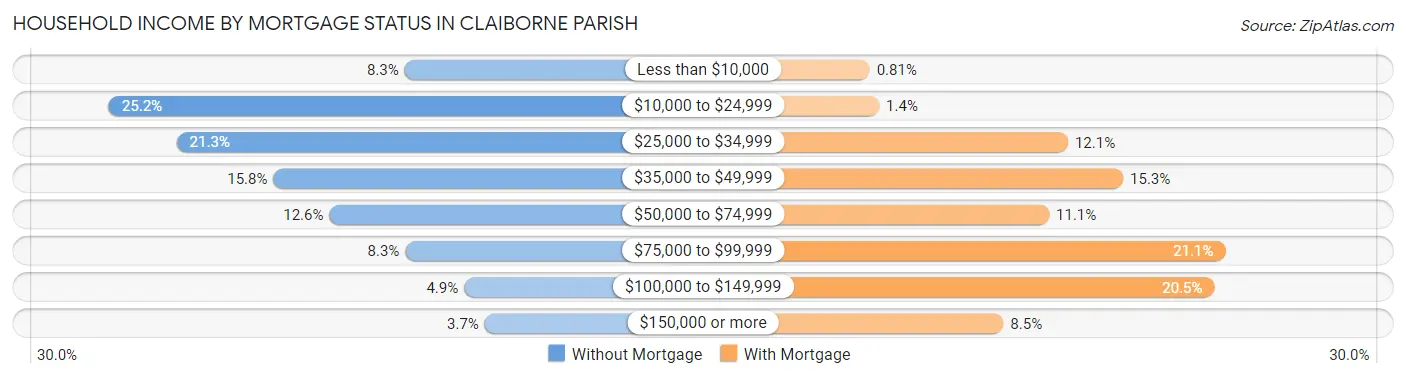
| Household Income | Without Mortgage | With Mortgage |
| Less than $10,000 | 210 (8.3%) | 9 (0.8%) |
| $10,000 to $24,999 | 638 (25.2%) | 15 (1.3%) |
| $25,000 to $34,999 | 540 (21.3%) | 135 (12.1%) |
| $35,000 to $49,999 | 400 (15.8%) | 170 (15.3%) |
| $50,000 to $74,999 | 319 (12.6%) | 123 (11.1%) |
| $75,000 to $99,999 | 209 (8.3%) | 235 (21.1%) |
| $100,000 to $149,999 | 124 (4.9%) | 228 (20.5%) |
| $150,000 or more | 94 (3.7%) | 94 (8.5%) |
| Total | 2,534 (100.0%) | 1,112 (100.0%) |
Property Value to Household Income Ratio in Claiborne Parish
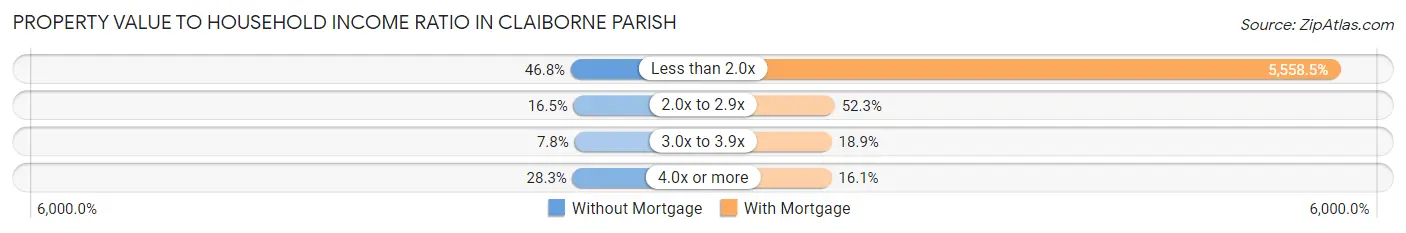
| Value-to-Income Ratio | Without Mortgage | With Mortgage |
| Less than 2.0x | 1,187 (46.8%) | 61,810 (5,558.4%) |
| 2.0x to 2.9x | 419 (16.5%) | 582 (52.3%) |
| 3.0x to 3.9x | 198 (7.8%) | 210 (18.9%) |
| 4.0x or more | 716 (28.3%) | 179 (16.1%) |
| Total | 2,534 (100.0%) | 1,112 (100.0%) |
Real Estate Taxes by Mortgage Status in Claiborne Parish
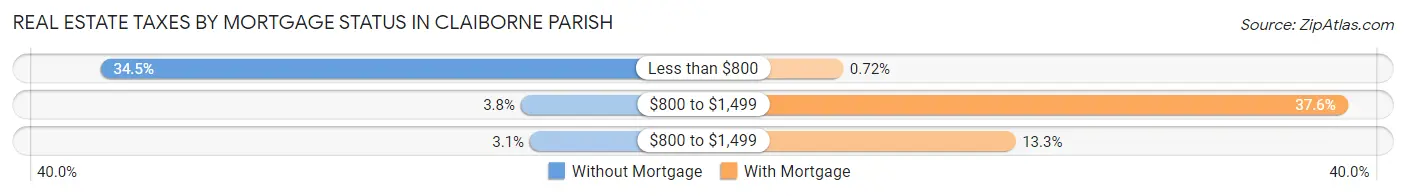
| Property Taxes | Without Mortgage | With Mortgage |
| Less than $800 | 873 (34.4%) | 8 (0.7%) |
| $800 to $1,499 | 95 (3.7%) | 418 (37.6%) |
| $800 to $1,499 | 78 (3.1%) | 148 (13.3%) |
| Total | 2,534 (100.0%) | 1,112 (100.0%) |
Health & Disability in Claiborne Parish
Health Insurance Coverage by Age in Claiborne Parish
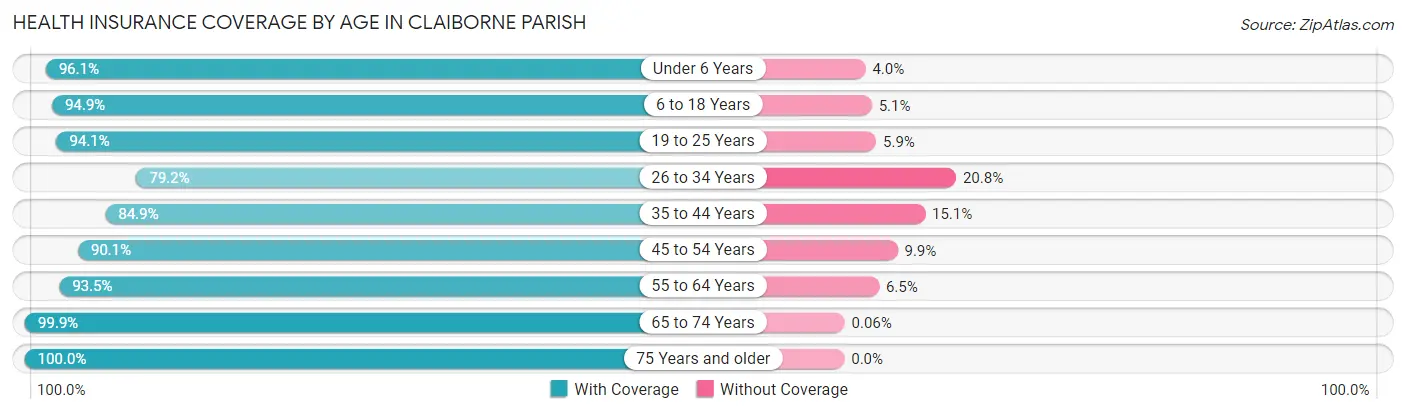
| Age Bracket | With Coverage | Without Coverage |
| Under 6 Years | 803 (96.1%) | 33 (4.0%) |
| 6 to 18 Years | 1,896 (94.9%) | 102 (5.1%) |
| 19 to 25 Years | 1,157 (94.1%) | 73 (5.9%) |
| 26 to 34 Years | 745 (79.2%) | 196 (20.8%) |
| 35 to 44 Years | 1,111 (84.9%) | 197 (15.1%) |
| 45 to 54 Years | 1,270 (90.1%) | 140 (9.9%) |
| 55 to 64 Years | 1,693 (93.5%) | 117 (6.5%) |
| 65 to 74 Years | 1,739 (99.9%) | 1 (0.1%) |
| 75 Years and older | 1,000 (100.0%) | 0 (0.0%) |
| Total | 11,414 (93.0%) | 859 (7.0%) |
Health Insurance Coverage by Citizenship Status in Claiborne Parish
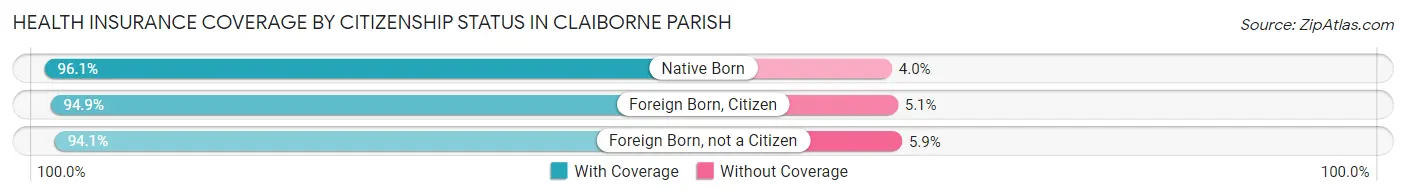
| Citizenship Status | With Coverage | Without Coverage |
| Native Born | 803 (96.1%) | 33 (4.0%) |
| Foreign Born, Citizen | 1,896 (94.9%) | 102 (5.1%) |
| Foreign Born, not a Citizen | 1,157 (94.1%) | 73 (5.9%) |
Health Insurance Coverage by Household Income in Claiborne Parish
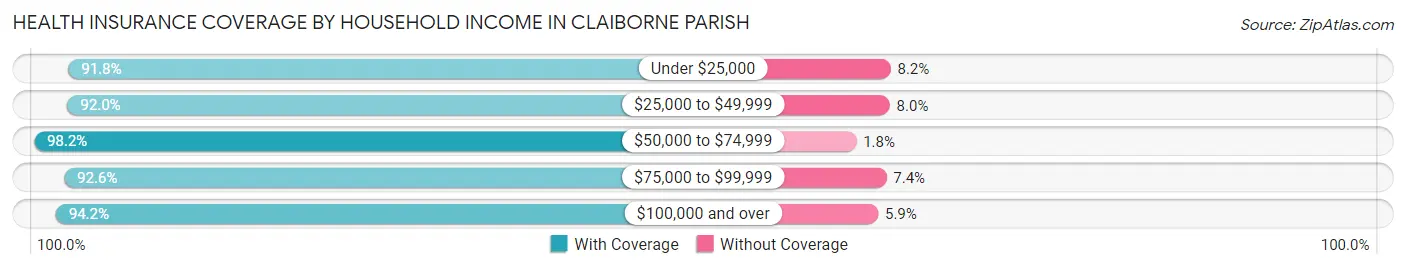
| Household Income | With Coverage | Without Coverage |
| Under $25,000 | 3,443 (91.8%) | 307 (8.2%) |
| $25,000 to $49,999 | 4,054 (92.0%) | 354 (8.0%) |
| $50,000 to $74,999 | 1,507 (98.2%) | 27 (1.8%) |
| $75,000 to $99,999 | 1,200 (92.6%) | 96 (7.4%) |
| $100,000 and over | 1,207 (94.2%) | 75 (5.9%) |
Public vs Private Health Insurance Coverage by Age in Claiborne Parish
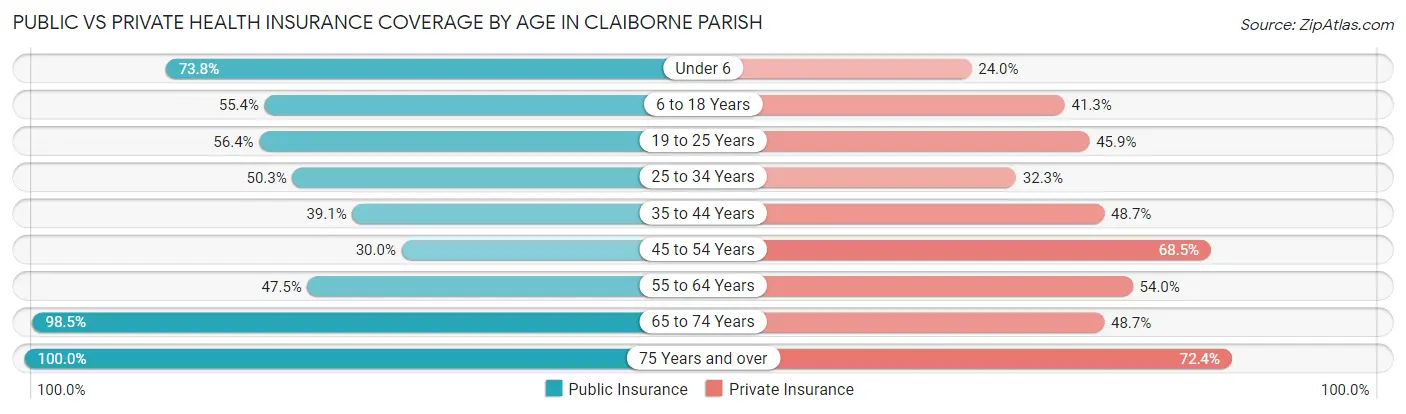
| Age Bracket | Public Insurance | Private Insurance |
| Under 6 | 617 (73.8%) | 201 (24.0%) |
| 6 to 18 Years | 1,107 (55.4%) | 826 (41.3%) |
| 19 to 25 Years | 694 (56.4%) | 565 (45.9%) |
| 25 to 34 Years | 473 (50.3%) | 304 (32.3%) |
| 35 to 44 Years | 512 (39.1%) | 637 (48.7%) |
| 45 to 54 Years | 423 (30.0%) | 966 (68.5%) |
| 55 to 64 Years | 859 (47.5%) | 977 (54.0%) |
| 65 to 74 Years | 1,714 (98.5%) | 847 (48.7%) |
| 75 Years and over | 1,000 (100.0%) | 724 (72.4%) |
| Total | 7,399 (60.3%) | 6,047 (49.3%) |
Disability Status by Sex by Age in Claiborne Parish
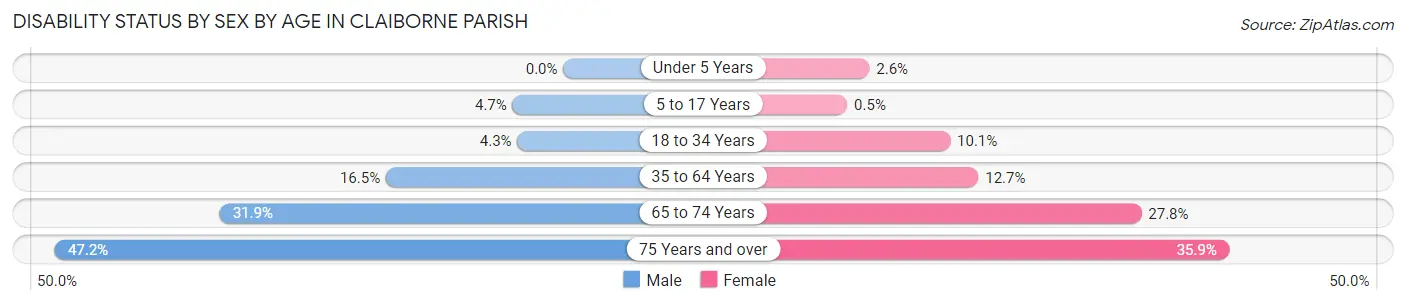
| Age Bracket | Male | Female |
| Under 5 Years | 0 (0.0%) | 10 (2.6%) |
| 5 to 17 Years | 48 (4.7%) | 5 (0.5%) |
| 18 to 34 Years | 54 (4.3%) | 105 (10.1%) |
| 35 to 64 Years | 344 (16.5%) | 309 (12.7%) |
| 65 to 74 Years | 228 (31.9%) | 285 (27.8%) |
| 75 Years and over | 234 (47.2%) | 181 (35.9%) |
Disability Class by Sex by Age in Claiborne Parish
Disability Class: Hearing Difficulty
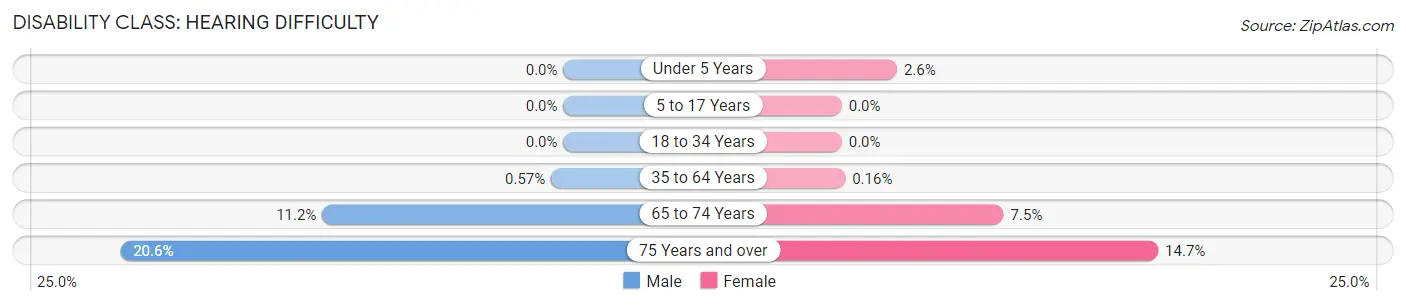
| Age Bracket | Male | Female |
| Under 5 Years | 0 (0.0%) | 10 (2.6%) |
| 5 to 17 Years | 0 (0.0%) | 0 (0.0%) |
| 18 to 34 Years | 0 (0.0%) | 0 (0.0%) |
| 35 to 64 Years | 12 (0.6%) | 4 (0.2%) |
| 65 to 74 Years | 80 (11.2%) | 77 (7.5%) |
| 75 Years and over | 102 (20.6%) | 74 (14.7%) |
Disability Class: Vision Difficulty
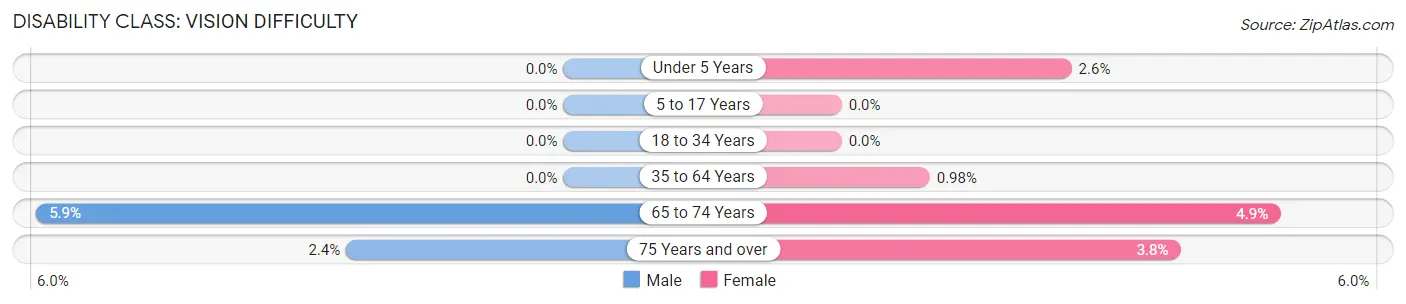
| Age Bracket | Male | Female |
| Under 5 Years | 0 (0.0%) | 10 (2.6%) |
| 5 to 17 Years | 0 (0.0%) | 0 (0.0%) |
| 18 to 34 Years | 0 (0.0%) | 0 (0.0%) |
| 35 to 64 Years | 0 (0.0%) | 24 (1.0%) |
| 65 to 74 Years | 42 (5.9%) | 50 (4.9%) |
| 75 Years and over | 12 (2.4%) | 19 (3.8%) |
Disability Class: Cognitive Difficulty
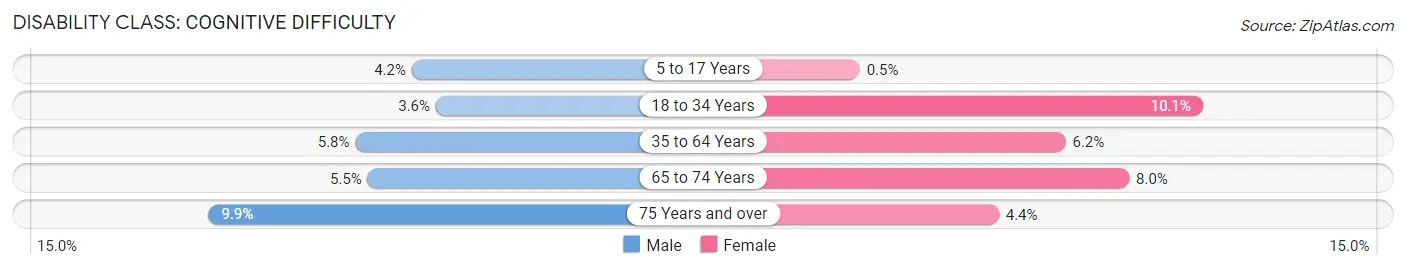
| Age Bracket | Male | Female |
| 5 to 17 Years | 43 (4.2%) | 5 (0.5%) |
| 18 to 34 Years | 45 (3.5%) | 105 (10.1%) |
| 35 to 64 Years | 121 (5.8%) | 152 (6.2%) |
| 65 to 74 Years | 39 (5.4%) | 82 (8.0%) |
| 75 Years and over | 49 (9.9%) | 22 (4.4%) |
Disability Class: Ambulatory Difficulty
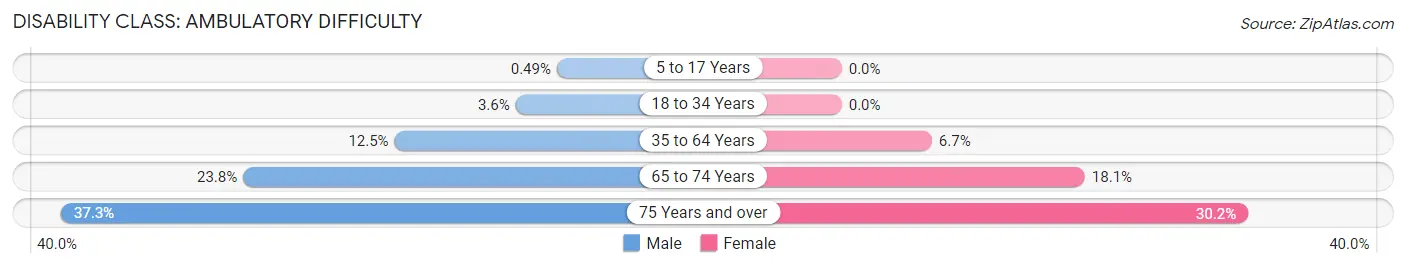
| Age Bracket | Male | Female |
| 5 to 17 Years | 5 (0.5%) | 0 (0.0%) |
| 18 to 34 Years | 45 (3.5%) | 0 (0.0%) |
| 35 to 64 Years | 262 (12.5%) | 163 (6.7%) |
| 65 to 74 Years | 170 (23.8%) | 185 (18.0%) |
| 75 Years and over | 185 (37.3%) | 152 (30.2%) |
Disability Class: Self-Care Difficulty
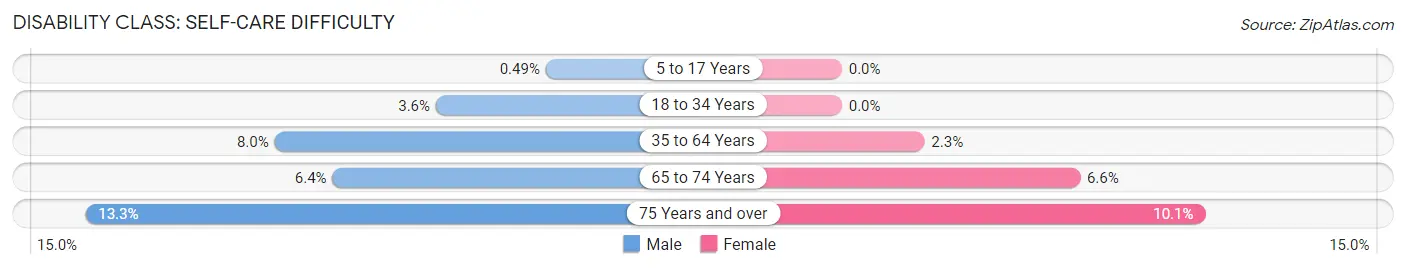
| Age Bracket | Male | Female |
| 5 to 17 Years | 5 (0.5%) | 0 (0.0%) |
| 18 to 34 Years | 45 (3.5%) | 0 (0.0%) |
| 35 to 64 Years | 168 (8.0%) | 56 (2.3%) |
| 65 to 74 Years | 46 (6.4%) | 68 (6.6%) |
| 75 Years and over | 66 (13.3%) | 51 (10.1%) |
Technology Access in Claiborne Parish
Computing Device Access in Claiborne Parish
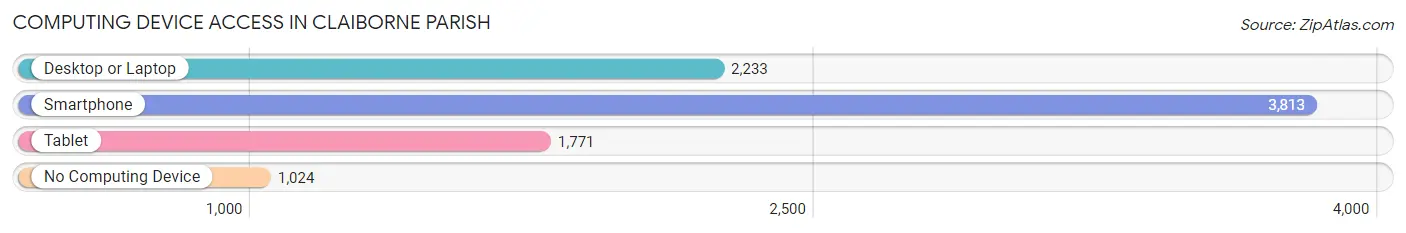
| Device Type | # Households | % Households |
| Desktop or Laptop | 2,233 | 44.1% |
| Smartphone | 3,813 | 75.4% |
| Tablet | 1,771 | 35.0% |
| No Computing Device | 1,024 | 20.2% |
| Total | 5,060 | 100.0% |
Internet Access in Claiborne Parish
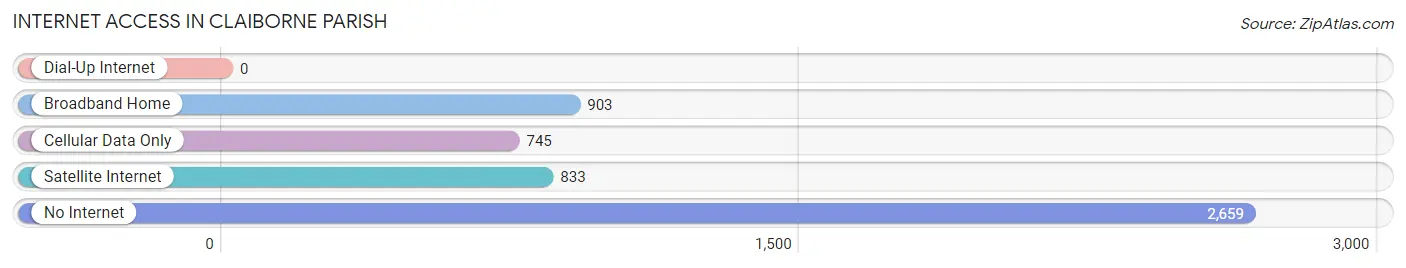
| Internet Type | # Households | % Households |
| Dial-Up Internet | 0 | 0.0% |
| Broadband Home | 903 | 17.8% |
| Cellular Data Only | 745 | 14.7% |
| Satellite Internet | 833 | 16.5% |
| No Internet | 2,659 | 52.5% |
| Total | 5,060 | 100.0% |
Claiborne Parish Summary
Claiborne Parish is located in the northwestern corner of Louisiana, and is bordered by Arkansas to the north, Webster Parish to the east, Bienville Parish to the south, and Red River Parish to the west. The parish seat is Homer, and the largest city is Haynesville. The parish was named for the first Louisiana governor, William C.C. Claiborne.
Geography
Claiborne Parish covers an area of 845 square miles, and is mostly rural. The terrain is mostly flat, with some rolling hills in the northern part of the parish. The parish is drained by the Red River, which forms the western boundary of the parish. The Red River is also the source of the parish's many lakes and bayous, including Lake Claiborne, Lake Bistineau, and Bayou Dorcheat. The parish is also home to the Kisatchie National Forest, which covers over 600,000 acres of land.
Demographics
As of the 2010 census, the population of Claiborne Parish was 17,195. The racial makeup of the parish was 79.3% White, 18.3% African American, 0.5% Native American, 0.3% Asian, 0.2% Pacific Islander, 0.7% from other races, and 1.0% from two or more races. Hispanic or Latino of any race were 2.2% of the population.
The median household income in the parish was $31,945, and the median family income was $39,945. The per capita income was $17,845. About 19.2% of the population was below the poverty line.
Economy
The economy of Claiborne Parish is largely based on agriculture and timber. The parish is home to several large timber companies, including Weyerhaeuser and International Paper. The parish is also home to several large farms, which produce cotton, soybeans, corn, and other crops.
The parish is also home to several oil and gas companies, including Chevron and ExxonMobil. The parish is also home to several manufacturing companies, including a paper mill and a furniture factory.
The parish is also home to several tourist attractions, including the Kisatchie National Forest, Lake Claiborne State Park, and the Claiborne Parish Museum.
History
Claiborne Parish was established in 1828, and was named for the first Louisiana governor, William C.C. Claiborne. The parish was originally part of Natchitoches Parish, but was split off in 1828.
The parish was largely rural until the early 20th century, when oil and gas were discovered in the area. This led to an influx of people and businesses, and the parish's population and economy grew rapidly.
In the 1950s, the parish was the site of a major civil rights struggle, when African Americans in the parish fought for the right to vote. The struggle was successful, and African Americans in the parish were able to register to vote in the 1960s.
Today, Claiborne Parish is a largely rural parish, with a population of 17,195. The parish is home to several large timber and oil and gas companies, as well as several tourist attractions.
Common Questions
What is Per Capita Income in Claiborne Parish?
Per Capita income in Claiborne Parish is $18,721.
What is the Median Family Income in Claiborne Parish?
Median Family Income in Claiborne Parish is $39,791.
What is the Median Household income in Claiborne Parish?
Median Household Income in Claiborne Parish is $32,034.
What is Income or Wage Gap in Claiborne Parish?
Income or Wage Gap in Claiborne Parish is 20.8%.
Women in Claiborne Parish earn 79.2 cents for every dollar earned by a man.
What is Family Income Deficit in Claiborne Parish?
Family Income Deficit in Claiborne Parish is $8,483.
Families that are below poverty line in Claiborne Parish earn $8,483 less on average than the poverty threshold level.
What is Inequality or Gini Index in Claiborne Parish?
Inequality or Gini Index in Claiborne Parish is 0.51.
What is the Total Population of Claiborne Parish?
Total Population of Claiborne Parish is 14,203.
What is the Total Male Population of Claiborne Parish?
Total Male Population of Claiborne Parish is 7,656.
What is the Total Female Population of Claiborne Parish?
Total Female Population of Claiborne Parish is 6,547.
What is the Ratio of Males per 100 Females in Claiborne Parish?
There are 116.94 Males per 100 Females in Claiborne Parish.
What is the Ratio of Females per 100 Males in Claiborne Parish?
There are 85.51 Females per 100 Males in Claiborne Parish.
What is the Median Population Age in Claiborne Parish?
Median Population Age in Claiborne Parish is 42.3 Years.
What is the Average Family Size in Claiborne Parish
Average Family Size in Claiborne Parish is 3.3 People.
What is the Average Household Size in Claiborne Parish
Average Household Size in Claiborne Parish is 2.4 People.
How Large is the Labor Force in Claiborne Parish?
There are 4,501 People in the Labor Forcein in Claiborne Parish.
What is the Percentage of People in the Labor Force in Claiborne Parish?
38.4% of People are in the Labor Force in Claiborne Parish.
What is the Unemployment Rate in Claiborne Parish?
Unemployment Rate in Claiborne Parish is 5.2%.