Beauregard Parish, LA Map & Demographics
Beauregard Parish Overview
$33,582
PER CAPITA INCOME
$82,550
AVG FAMILY INCOME
$68,525
AVG HOUSEHOLD INCOME
60.6%
WAGE / INCOME GAP [ % ]
39.4¢/ $1
WAGE / INCOME GAP [ $ ]
$10,256
FAMILY INCOME DEFICIT
0.42
INEQUALITY / GINI INDEX
36,553
TOTAL POPULATION
18,747
MALE POPULATION
17,806
FEMALE POPULATION
105.28
MALES / 100 FEMALES
94.98
FEMALES / 100 MALES
37.3
MEDIAN AGE
3.1
AVG FAMILY SIZE
2.6
AVG HOUSEHOLD SIZE
16,143
LABOR FORCE [ PEOPLE ]
56.9%
PERCENT IN LABOR FORCE
8.1%
UNEMPLOYMENT RATE
Income in Beauregard Parish
Income Overview in Beauregard Parish
Per Capita Income in Beauregard Parish is $33,582, while median incomes of families and households are $82,550 and $68,525 respectively.
| Characteristic | Number | Measure |
| Per Capita Income | 36,553 | $33,582 |
| Median Family Income | 9,622 | $82,550 |
| Mean Family Income | 9,622 | $96,380 |
| Median Household Income | 13,587 | $68,525 |
| Mean Household Income | 13,587 | $85,994 |
| Income Deficit | 9,622 | $10,256 |
| Wage / Income Gap (%) | 36,553 | 60.61% |
| Wage / Income Gap ($) | 36,553 | 39.39¢ per $1 |
| Gini / Inequality Index | 36,553 | 0.42 |
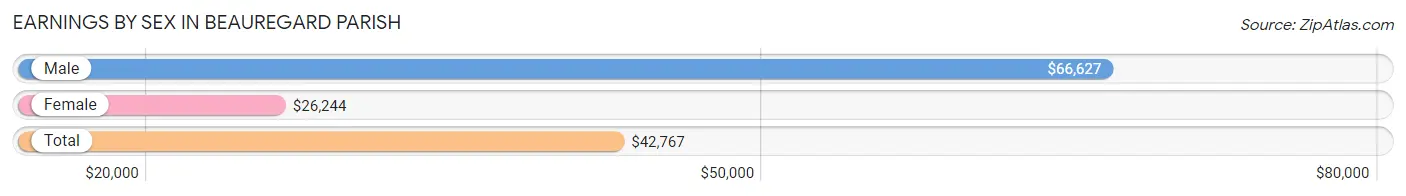
Earnings by Sex in Beauregard Parish
Average Earnings in Beauregard Parish are $42,767, $66,627 for men and $26,244 for women, a difference of 60.6%.
| Sex | Number | Average Earnings |
| Male | 9,772 (58.0%) | $66,627 |
| Female | 7,088 (42.0%) | $26,244 |
| Total | 16,860 (100.0%) | $42,767 |
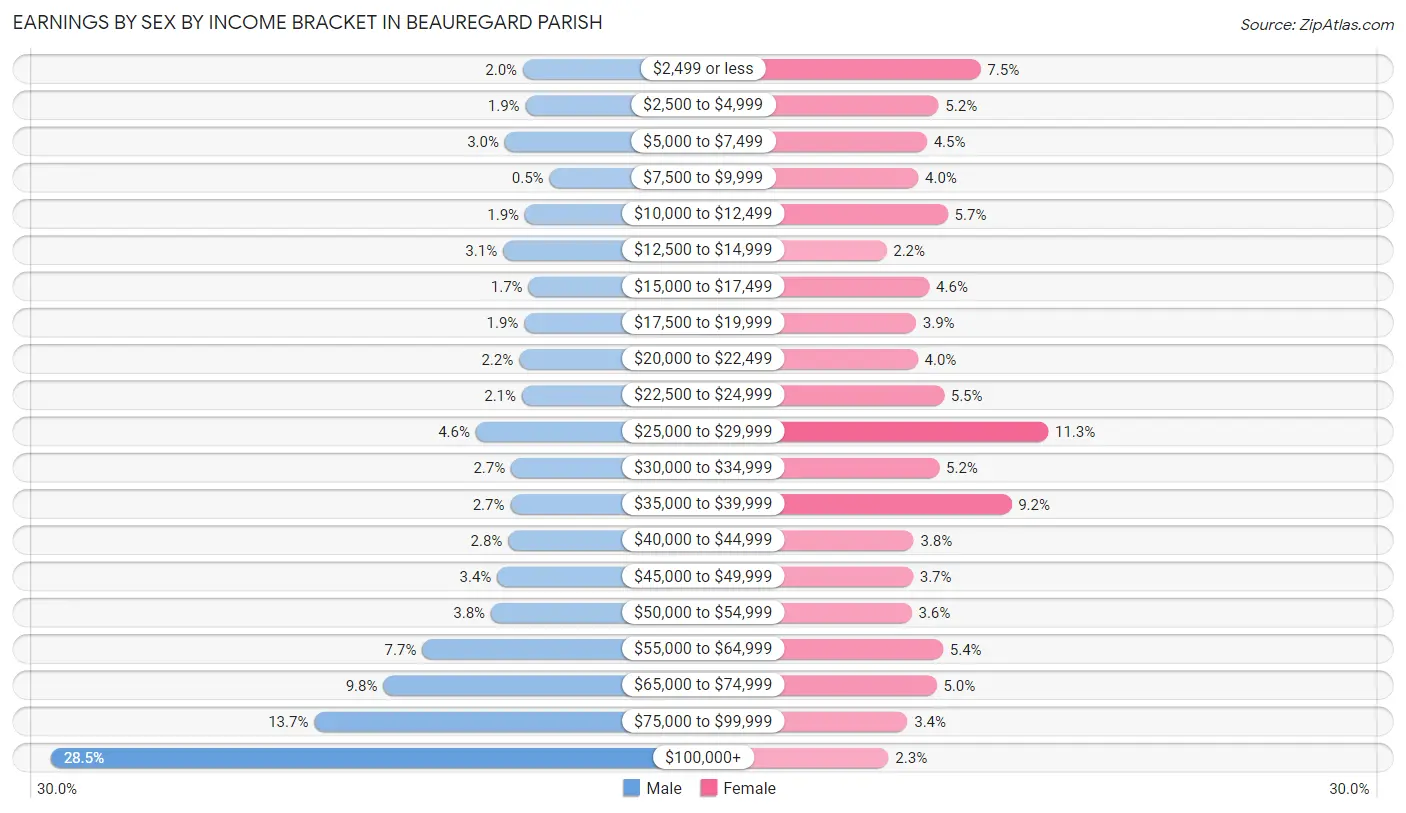
Earnings by Sex by Income Bracket in Beauregard Parish
The most common earnings brackets in Beauregard Parish are $100,000+ for men (2,788 | 28.5%) and $25,000 to $29,999 for women (802 | 11.3%).
| Income | Male | Female |
| $2,499 or less | 194 (2.0%) | 532 (7.5%) |
| $2,500 to $4,999 | 181 (1.8%) | 365 (5.1%) |
| $5,000 to $7,499 | 294 (3.0%) | 318 (4.5%) |
| $7,500 to $9,999 | 49 (0.5%) | 284 (4.0%) |
| $10,000 to $12,499 | 184 (1.9%) | 402 (5.7%) |
| $12,500 to $14,999 | 304 (3.1%) | 157 (2.2%) |
| $15,000 to $17,499 | 164 (1.7%) | 328 (4.6%) |
| $17,500 to $19,999 | 188 (1.9%) | 275 (3.9%) |
| $20,000 to $22,499 | 216 (2.2%) | 282 (4.0%) |
| $22,500 to $24,999 | 200 (2.1%) | 386 (5.4%) |
| $25,000 to $29,999 | 453 (4.6%) | 802 (11.3%) |
| $30,000 to $34,999 | 260 (2.7%) | 368 (5.2%) |
| $35,000 to $39,999 | 264 (2.7%) | 655 (9.2%) |
| $40,000 to $44,999 | 276 (2.8%) | 266 (3.7%) |
| $45,000 to $49,999 | 336 (3.4%) | 263 (3.7%) |
| $50,000 to $54,999 | 370 (3.8%) | 258 (3.6%) |
| $55,000 to $64,999 | 748 (7.6%) | 383 (5.4%) |
| $65,000 to $74,999 | 962 (9.8%) | 357 (5.0%) |
| $75,000 to $99,999 | 1,341 (13.7%) | 241 (3.4%) |
| $100,000+ | 2,788 (28.5%) | 166 (2.3%) |
| Total | 9,772 (100.0%) | 7,088 (100.0%) |
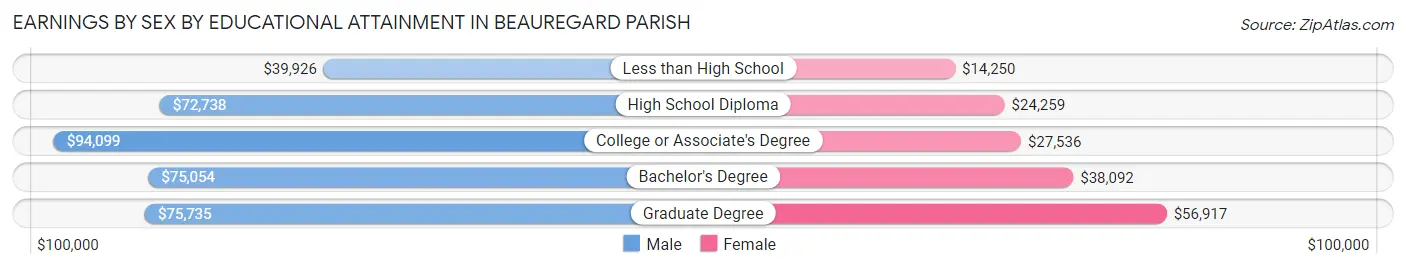
Earnings by Sex by Educational Attainment in Beauregard Parish
Average earnings in Beauregard Parish are $74,190 for men and $28,117 for women, a difference of 62.1%. Men with an educational attainment of college or associate's degree enjoy the highest average annual earnings of $94,099, while those with less than high school education earn the least with $39,926. Women with an educational attainment of graduate degree earn the most with the average annual earnings of $56,917, while those with less than high school education have the smallest earnings of $14,250.
| Educational Attainment | Male Income | Female Income |
| Less than High School | $39,926 | $14,250 |
| High School Diploma | $72,738 | $24,259 |
| College or Associate's Degree | $94,099 | $27,536 |
| Bachelor's Degree | $75,054 | $38,092 |
| Graduate Degree | $75,735 | $56,917 |
| Total | $74,190 | $28,117 |
Family Income in Beauregard Parish
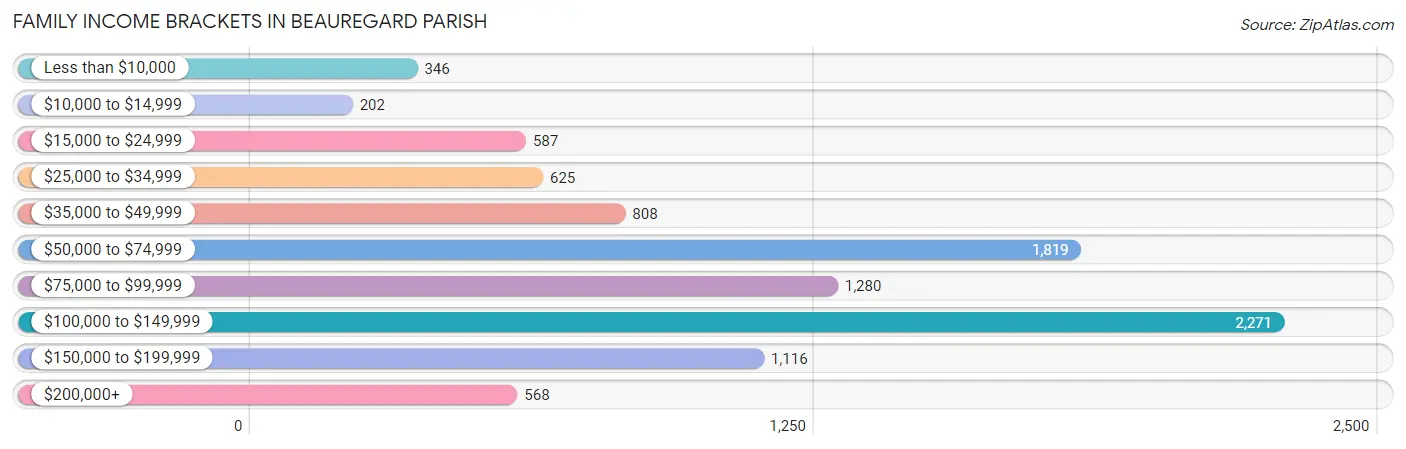
Family Income Brackets in Beauregard Parish
According to the Beauregard Parish family income data, there are 2,271 families falling into the $100,000 to $149,999 income range, which is the most common income bracket and makes up 23.6% of all families. Conversely, the $10,000 to $14,999 income bracket is the least frequent group with only 202 families (2.1%) belonging to this category.
| Income Bracket | # Families | % Families |
| Less than $10,000 | 346 | 3.6% |
| $10,000 to $14,999 | 202 | 2.1% |
| $15,000 to $24,999 | 587 | 6.1% |
| $25,000 to $34,999 | 625 | 6.5% |
| $35,000 to $49,999 | 808 | 8.4% |
| $50,000 to $74,999 | 1,819 | 18.9% |
| $75,000 to $99,999 | 1,280 | 13.3% |
| $100,000 to $149,999 | 2,271 | 23.6% |
| $150,000 to $199,999 | 1,116 | 11.6% |
| $200,000+ | 568 | 5.9% |
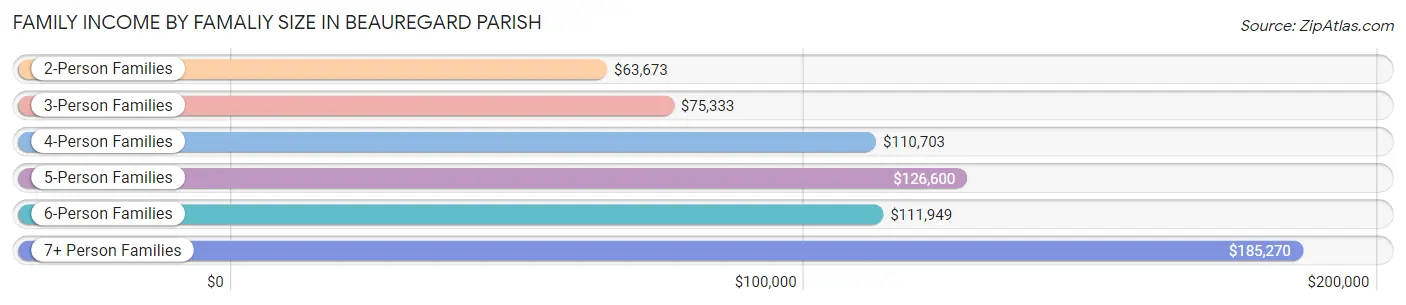
Family Income by Famaliy Size in Beauregard Parish
7+ person families (148 | 1.5%) account for the highest median family income in Beauregard Parish with $185,270 per family, while 2-person families (4,458 | 46.3%) have the highest median income of $31,836 per family member.
| Income Bracket | # Families | Median Income |
| 2-Person Families | 4,458 (46.3%) | $63,673 |
| 3-Person Families | 2,168 (22.5%) | $75,333 |
| 4-Person Families | 1,447 (15.0%) | $110,703 |
| 5-Person Families | 856 (8.9%) | $126,600 |
| 6-Person Families | 545 (5.7%) | $111,949 |
| 7+ Person Families | 148 (1.5%) | $185,270 |
| Total | 9,622 (100.0%) | $82,550 |
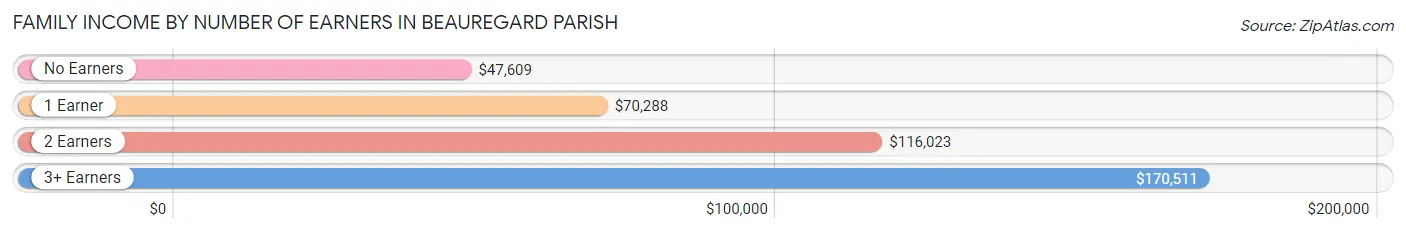
Family Income by Number of Earners in Beauregard Parish
The median family income in Beauregard Parish is $82,550, with families comprising 3+ earners (697) having the highest median family income of $170,511, while families with no earners (1,640) have the lowest median family income of $47,609, accounting for 7.2% and 17.0% of families, respectively.
| Number of Earners | # Families | Median Income |
| No Earners | 1,640 (17.0%) | $47,609 |
| 1 Earner | 4,331 (45.0%) | $70,288 |
| 2 Earners | 2,954 (30.7%) | $116,023 |
| 3+ Earners | 697 (7.2%) | $170,511 |
| Total | 9,622 (100.0%) | $82,550 |
Household Income in Beauregard Parish
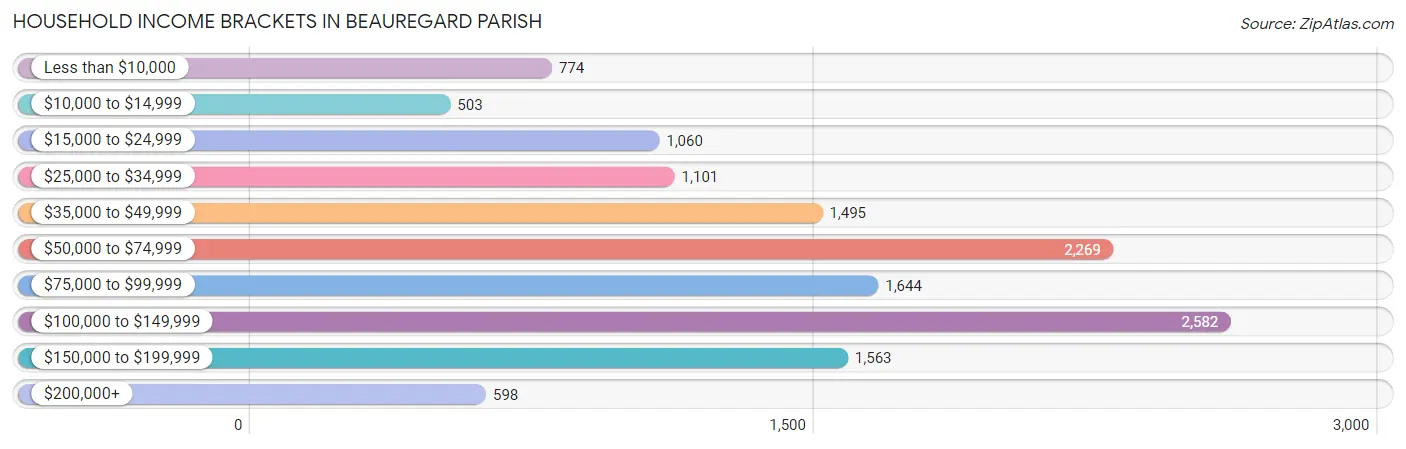
Household Income Brackets in Beauregard Parish
With 2,582 households falling in the category, the $100,000 to $149,999 income range is the most frequent in Beauregard Parish, accounting for 19.0% of all households. In contrast, only 503 households (3.7%) fall into the $10,000 to $14,999 income bracket, making it the least populous group.
| Income Bracket | # Households | % Households |
| Less than $10,000 | 774 | 5.7% |
| $10,000 to $14,999 | 503 | 3.7% |
| $15,000 to $24,999 | 1,060 | 7.8% |
| $25,000 to $34,999 | 1,101 | 8.1% |
| $35,000 to $49,999 | 1,495 | 11.0% |
| $50,000 to $74,999 | 2,269 | 16.7% |
| $75,000 to $99,999 | 1,644 | 12.1% |
| $100,000 to $149,999 | 2,582 | 19.0% |
| $150,000 to $199,999 | 1,563 | 11.5% |
| $200,000+ | 598 | 4.4% |
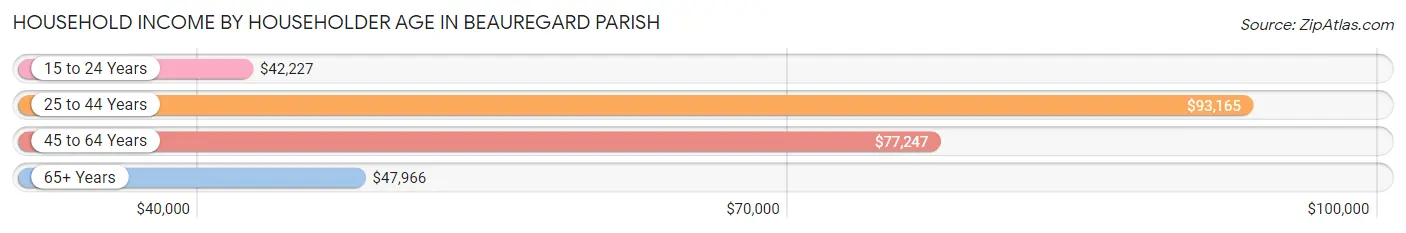
Household Income by Householder Age in Beauregard Parish
The median household income in Beauregard Parish is $68,525, with the highest median household income of $93,165 found in the 25 to 44 years age bracket for the primary householder. A total of 4,338 households (31.9%) fall into this category. Meanwhile, the 15 to 24 years age bracket for the primary householder has the lowest median household income of $42,227, with 471 households (3.5%) in this group.
| Income Bracket | # Households | Median Income |
| 15 to 24 Years | 471 (3.5%) | $42,227 |
| 25 to 44 Years | 4,338 (31.9%) | $93,165 |
| 45 to 64 Years | 5,111 (37.6%) | $77,247 |
| 65+ Years | 3,667 (27.0%) | $47,966 |
| Total | 13,587 (100.0%) | $68,525 |
Poverty in Beauregard Parish
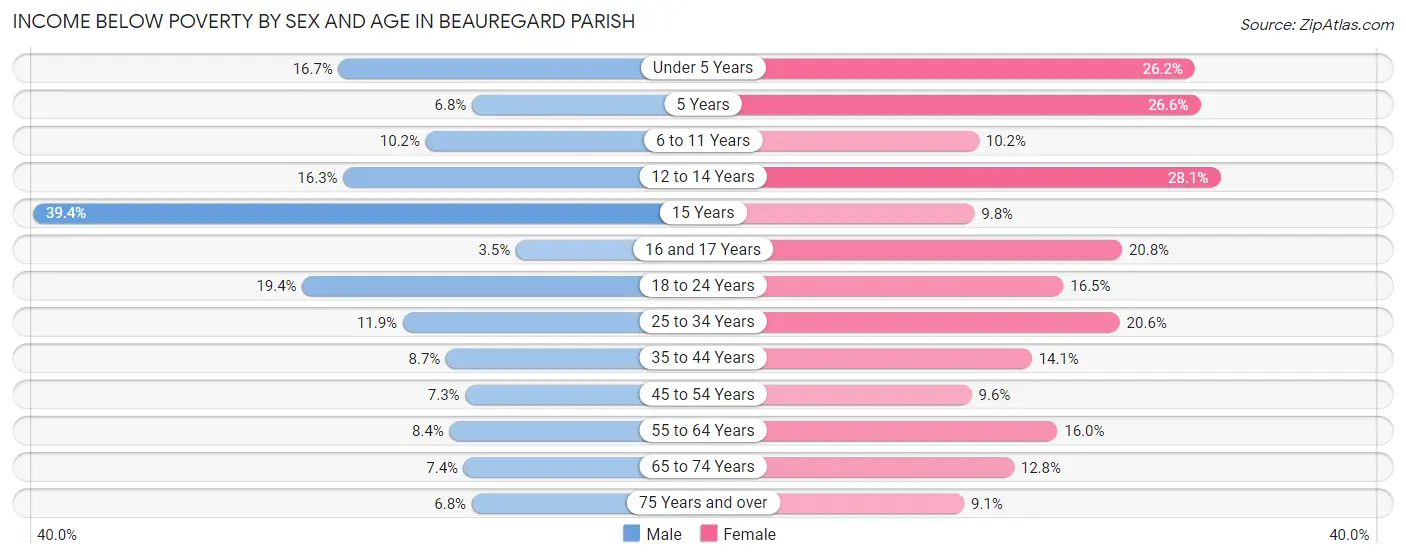
Income Below Poverty by Sex and Age in Beauregard Parish
With 11.1% poverty level for males and 15.6% for females among the residents of Beauregard Parish, 15 year old males and 12 to 14 year old females are the most vulnerable to poverty, with 139 males (39.4%) and 200 females (28.1%) in their respective age groups living below the poverty level.
| Age Bracket | Male | Female |
| Under 5 Years | 208 (16.7%) | 293 (26.2%) |
| 5 Years | 18 (6.8%) | 58 (26.6%) |
| 6 to 11 Years | 174 (10.2%) | 140 (10.2%) |
| 12 to 14 Years | 112 (16.3%) | 200 (28.1%) |
| 15 Years | 139 (39.4%) | 30 (9.8%) |
| 16 and 17 Years | 17 (3.5%) | 99 (20.8%) |
| 18 to 24 Years | 330 (19.4%) | 223 (16.5%) |
| 25 to 34 Years | 305 (11.9%) | 451 (20.6%) |
| 35 to 44 Years | 199 (8.7%) | 309 (14.1%) |
| 45 to 54 Years | 157 (7.3%) | 218 (9.6%) |
| 55 to 64 Years | 188 (8.4%) | 372 (16.0%) |
| 65 to 74 Years | 120 (7.4%) | 235 (12.8%) |
| 75 Years and over | 65 (6.8%) | 105 (9.1%) |
| Total | 2,032 (11.1%) | 2,733 (15.6%) |
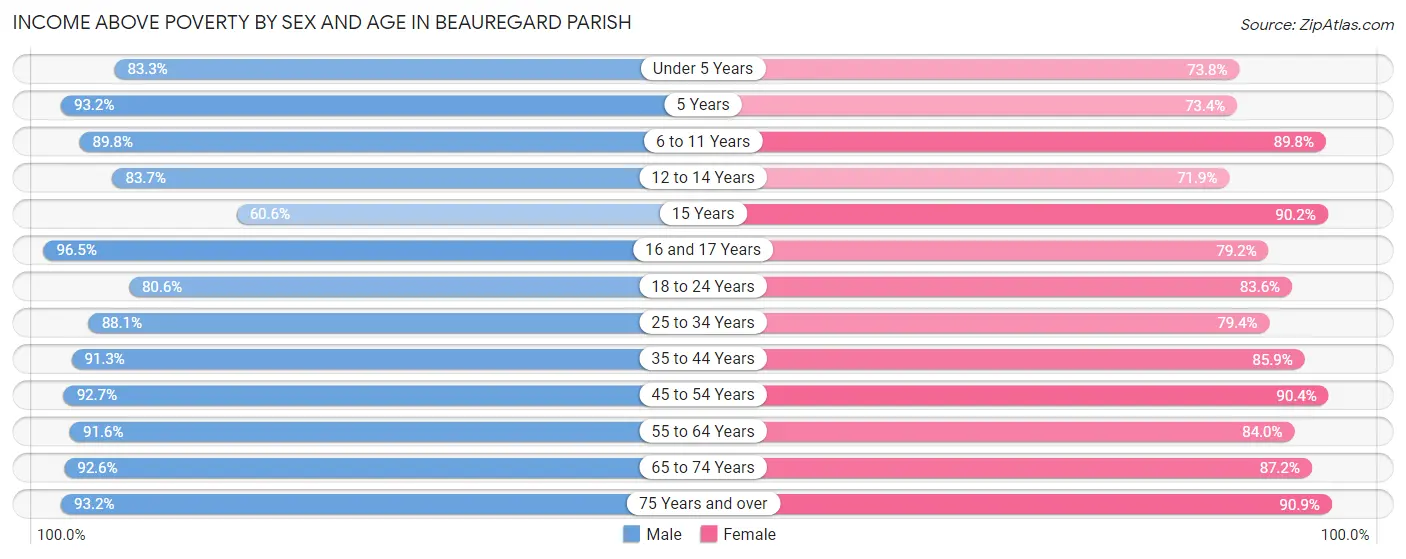
Income Above Poverty by Sex and Age in Beauregard Parish
According to the poverty statistics in Beauregard Parish, males aged 16 and 17 years and females aged 75 years and over are the age groups that are most secure financially, with 96.5% of males and 90.9% of females in these age groups living above the poverty line.
| Age Bracket | Male | Female |
| Under 5 Years | 1,039 (83.3%) | 825 (73.8%) |
| 5 Years | 248 (93.2%) | 160 (73.4%) |
| 6 to 11 Years | 1,530 (89.8%) | 1,236 (89.8%) |
| 12 to 14 Years | 574 (83.7%) | 512 (71.9%) |
| 15 Years | 214 (60.6%) | 275 (90.2%) |
| 16 and 17 Years | 468 (96.5%) | 377 (79.2%) |
| 18 to 24 Years | 1,374 (80.6%) | 1,133 (83.6%) |
| 25 to 34 Years | 2,256 (88.1%) | 1,735 (79.4%) |
| 35 to 44 Years | 2,088 (91.3%) | 1,882 (85.9%) |
| 45 to 54 Years | 2,004 (92.7%) | 2,044 (90.4%) |
| 55 to 64 Years | 2,040 (91.6%) | 1,953 (84.0%) |
| 65 to 74 Years | 1,507 (92.6%) | 1,605 (87.2%) |
| 75 Years and over | 892 (93.2%) | 1,051 (90.9%) |
| Total | 16,234 (88.9%) | 14,788 (84.4%) |
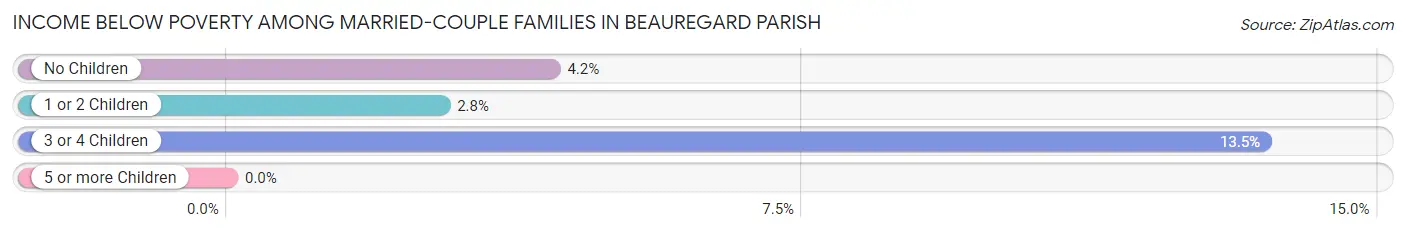
Income Below Poverty Among Married-Couple Families in Beauregard Parish
The poverty statistics for married-couple families in Beauregard Parish show that 4.8% or 342 of the total 7,108 families live below the poverty line. Families with 3 or 4 children have the highest poverty rate of 13.5%, comprising of 113 families. On the other hand, families with 5 or more children have the lowest poverty rate of 0.0%, which includes 0 families.
| Children | Above Poverty | Below Poverty |
| No Children | 3,706 (95.8%) | 163 (4.2%) |
| 1 or 2 Children | 2,313 (97.2%) | 66 (2.8%) |
| 3 or 4 Children | 724 (86.5%) | 113 (13.5%) |
| 5 or more Children | 23 (100.0%) | 0 (0.0%) |
| Total | 6,766 (95.2%) | 342 (4.8%) |
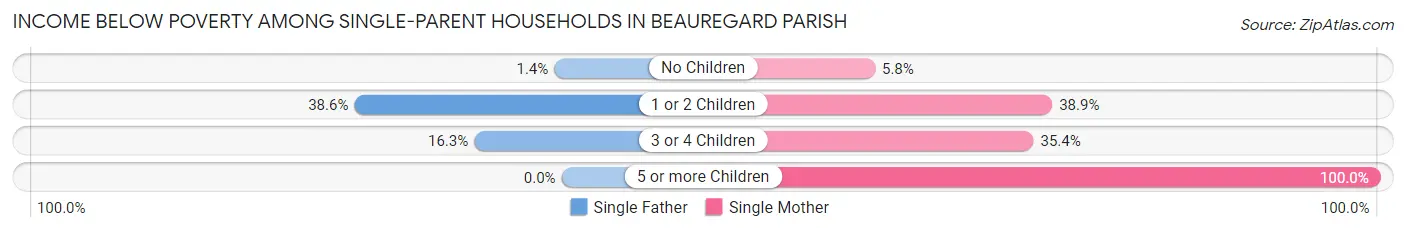
Income Below Poverty Among Single-Parent Households in Beauregard Parish
According to the poverty data in Beauregard Parish, 21.6% or 178 single-father households and 27.6% or 466 single-mother households are living below the poverty line. Among single-father households, those with 1 or 2 children have the highest poverty rate, with 154 households (38.6%) experiencing poverty. Likewise, among single-mother households, those with 5 or more children have the highest poverty rate, with 2 households (100.0%) falling below the poverty line.
| Children | Single Father | Single Mother |
| No Children | 3 (1.4%) | 33 (5.8%) |
| 1 or 2 Children | 154 (38.6%) | 373 (38.9%) |
| 3 or 4 Children | 21 (16.3%) | 58 (35.4%) |
| 5 or more Children | 0 (0.0%) | 2 (100.0%) |
| Total | 178 (21.6%) | 466 (27.6%) |
Income Below Poverty Among Married-Couple vs Single-Parent Households in Beauregard Parish
The poverty data for Beauregard Parish shows that 342 of the married-couple family households (4.8%) and 644 of the single-parent households (25.6%) are living below the poverty level. Within the married-couple family households, those with 3 or 4 children have the highest poverty rate, with 113 households (13.5%) falling below the poverty line. Among the single-parent households, those with 1 or 2 children have the highest poverty rate, with 527 household (38.8%) living below poverty.
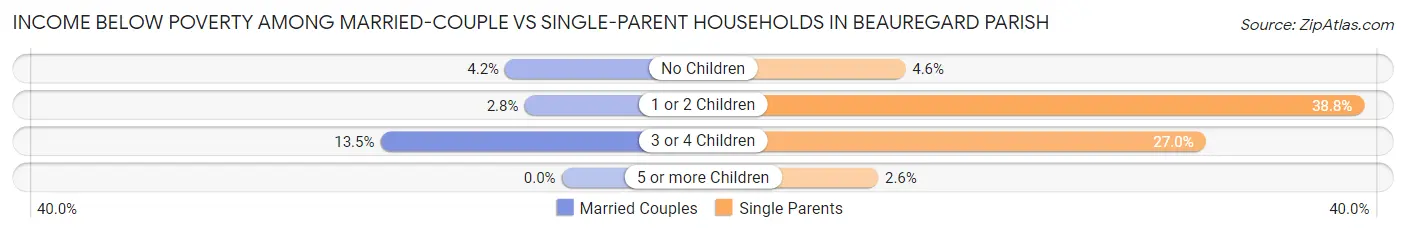
| Children | Married-Couple Families | Single-Parent Households |
| No Children | 163 (4.2%) | 36 (4.6%) |
| 1 or 2 Children | 66 (2.8%) | 527 (38.8%) |
| 3 or 4 Children | 113 (13.5%) | 79 (27.0%) |
| 5 or more Children | 0 (0.0%) | 2 (2.6%) |
| Total | 342 (4.8%) | 644 (25.6%) |
Race in Beauregard Parish
The most populous races in Beauregard Parish are White / Caucasian (29,563 | 80.9%), Black / African American (4,267 | 11.7%), and Two or more Races (1,933 | 5.3%).
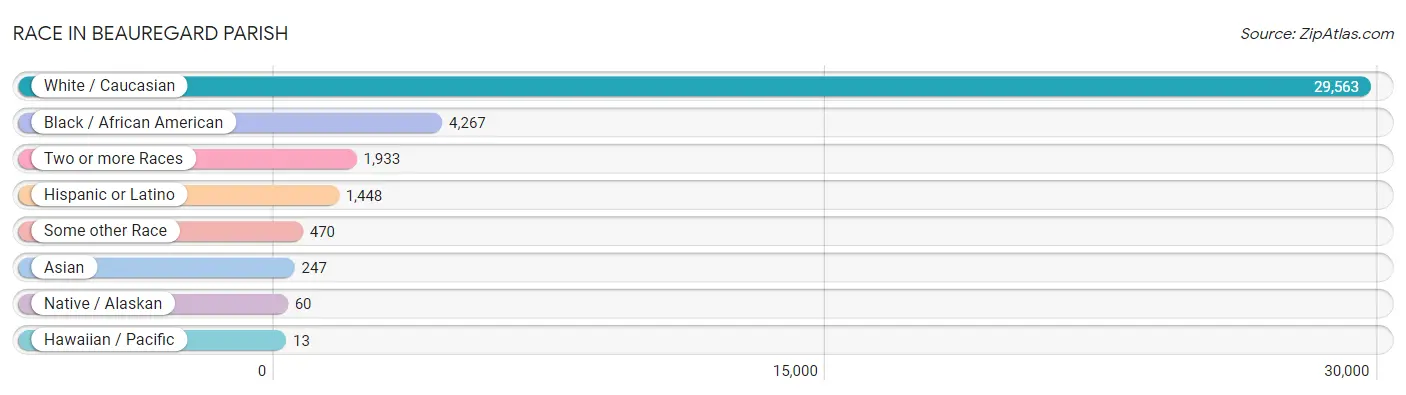
| Race | # Population | % Population |
| Asian | 247 | 0.7% |
| Black / African American | 4,267 | 11.7% |
| Hawaiian / Pacific | 13 | 0.0% |
| Hispanic or Latino | 1,448 | 4.0% |
| Native / Alaskan | 60 | 0.2% |
| White / Caucasian | 29,563 | 80.9% |
| Two or more Races | 1,933 | 5.3% |
| Some other Race | 470 | 1.3% |
| Total | 36,553 | 100.0% |
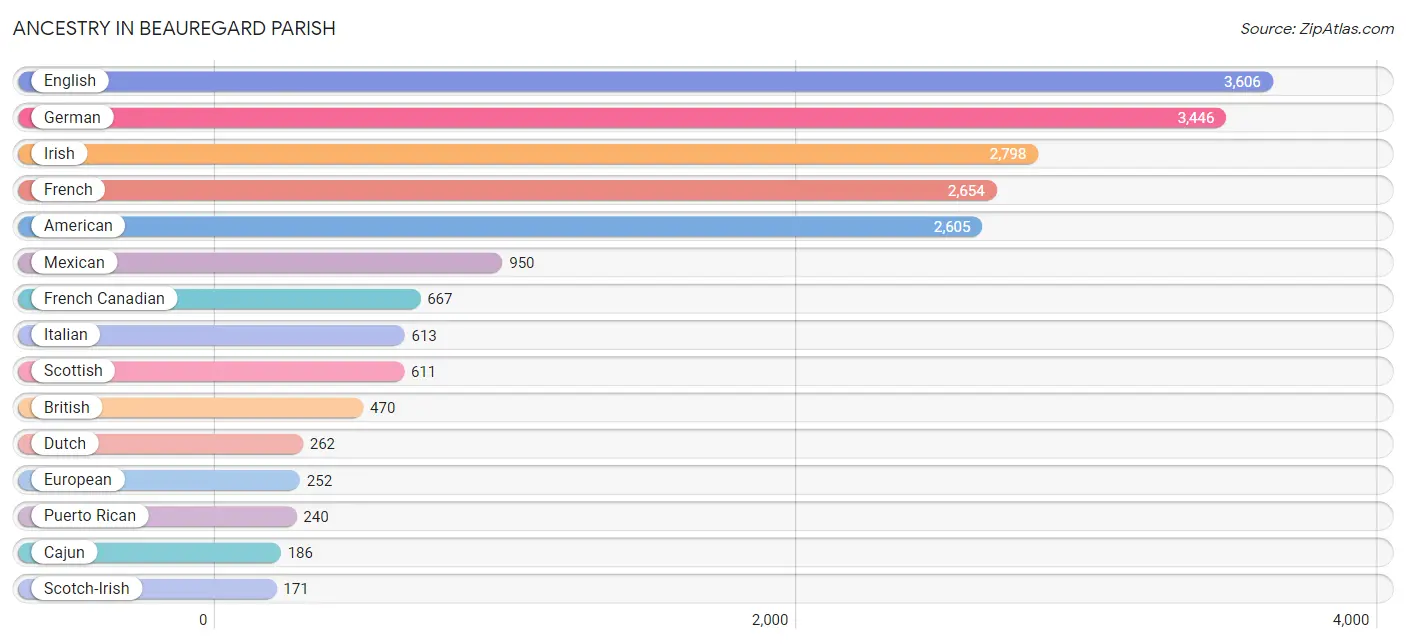
Ancestry in Beauregard Parish
The most populous ancestries reported in Beauregard Parish are English (3,606 | 9.9%), German (3,446 | 9.4%), Irish (2,798 | 7.6%), French (2,654 | 7.3%), and American (2,605 | 7.1%), together accounting for 41.3% of all Beauregard Parish residents.
| Ancestry | # Population | % Population |
| African | 49 | 0.1% |
| American | 2,605 | 7.1% |
| Arab | 24 | 0.1% |
| Austrian | 8 | 0.0% |
| Belgian | 42 | 0.1% |
| Belizean | 1 | 0.0% |
| Bhutanese | 13 | 0.0% |
| Blackfeet | 11 | 0.0% |
| Brazilian | 16 | 0.0% |
| British | 470 | 1.3% |
| Burmese | 34 | 0.1% |
| Cajun | 186 | 0.5% |
| Canadian | 8 | 0.0% |
| Celtic | 5 | 0.0% |
| Central American | 109 | 0.3% |
| Cherokee | 108 | 0.3% |
| Chickasaw | 9 | 0.0% |
| Choctaw | 19 | 0.1% |
| Colombian | 32 | 0.1% |
| Comanche | 1 | 0.0% |
| Creek | 1 | 0.0% |
| Croatian | 15 | 0.0% |
| Crow | 6 | 0.0% |
| Cuban | 3 | 0.0% |
| Czech | 84 | 0.2% |
| Czechoslovakian | 21 | 0.1% |
| Danish | 25 | 0.1% |
| Dutch | 262 | 0.7% |
| Eastern European | 5 | 0.0% |
| English | 3,606 | 9.9% |
| European | 252 | 0.7% |
| Filipino | 3 | 0.0% |
| French | 2,654 | 7.3% |
| French American Indian | 4 | 0.0% |
| French Canadian | 667 | 1.8% |
| German | 3,446 | 9.4% |
| Greek | 163 | 0.4% |
| Guyanese | 10 | 0.0% |
| Haitian | 4 | 0.0% |
| Honduran | 47 | 0.1% |
| Houma | 3 | 0.0% |
| Hungarian | 164 | 0.4% |
| Indian (Asian) | 10 | 0.0% |
| Irish | 2,798 | 7.6% |
| Israeli | 37 | 0.1% |
| Italian | 613 | 1.7% |
| Jamaican | 19 | 0.1% |
| Japanese | 7 | 0.0% |
| Korean | 109 | 0.3% |
| Lebanese | 9 | 0.0% |
| Lumbee | 4 | 0.0% |
| Malaysian | 63 | 0.2% |
| Mexican | 950 | 2.6% |
| Native Hawaiian | 25 | 0.1% |
| Navajo | 9 | 0.0% |
| Nicaraguan | 13 | 0.0% |
| Nigerian | 9 | 0.0% |
| Northern European | 25 | 0.1% |
| Norwegian | 146 | 0.4% |
| Pakistani | 75 | 0.2% |
| Panamanian | 12 | 0.0% |
| Polish | 72 | 0.2% |
| Portuguese | 15 | 0.0% |
| Potawatomi | 19 | 0.1% |
| Puerto Rican | 240 | 0.7% |
| Romanian | 59 | 0.2% |
| Russian | 35 | 0.1% |
| Salvadoran | 37 | 0.1% |
| Scandinavian | 46 | 0.1% |
| Scotch-Irish | 171 | 0.5% |
| Scottish | 611 | 1.7% |
| Seminole | 1 | 0.0% |
| Slavic | 2 | 0.0% |
| Slovak | 48 | 0.1% |
| South African | 3 | 0.0% |
| South American | 32 | 0.1% |
| Spaniard | 23 | 0.1% |
| Spanish | 63 | 0.2% |
| Sri Lankan | 6 | 0.0% |
| Subsaharan African | 61 | 0.2% |
| Swedish | 134 | 0.4% |
| Swiss | 15 | 0.0% |
| Syrian | 15 | 0.0% |
| Thai | 38 | 0.1% |
| Trinidadian and Tobagonian | 9 | 0.0% |
| Ukrainian | 21 | 0.1% |
| Welsh | 108 | 0.3% | View All 87 Rows |
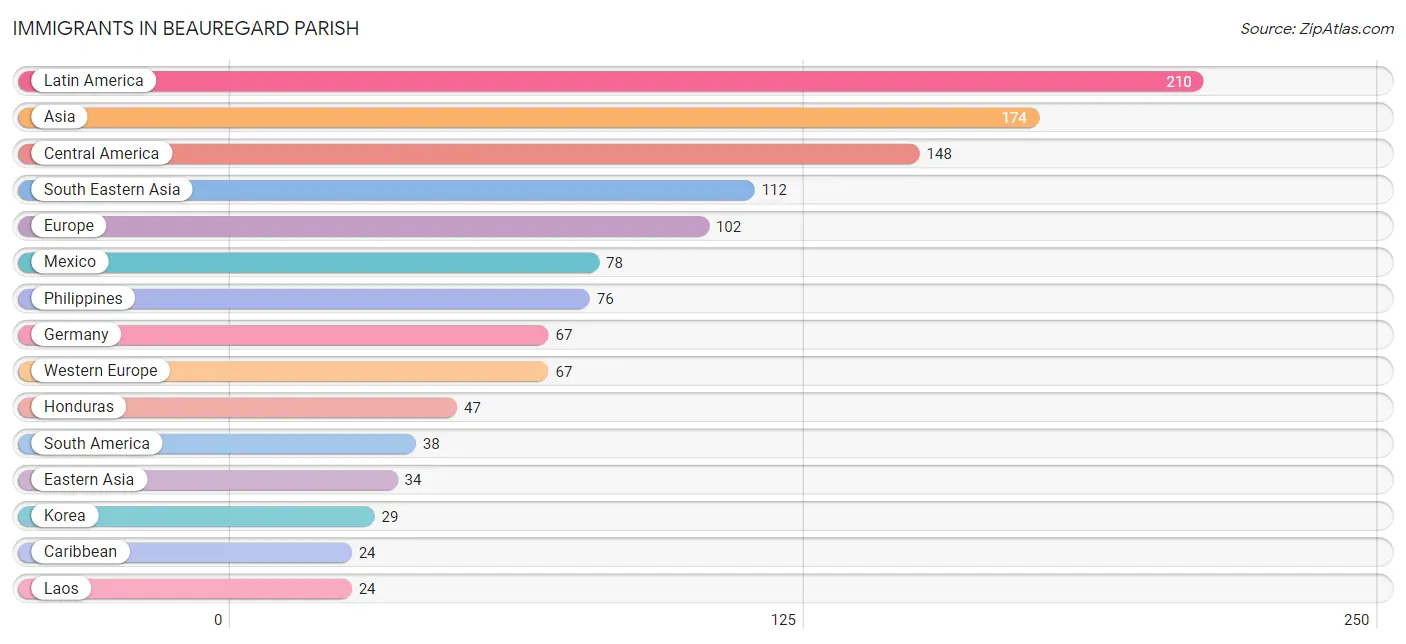
Immigrants in Beauregard Parish
The most numerous immigrant groups reported in Beauregard Parish came from Latin America (210 | 0.6%), Asia (174 | 0.5%), Central America (148 | 0.4%), South Eastern Asia (112 | 0.3%), and Europe (102 | 0.3%), together accounting for 2.0% of all Beauregard Parish residents.
| Immigration Origin | # Population | % Population |
| Africa | 6 | 0.0% |
| Asia | 174 | 0.5% |
| Belize | 1 | 0.0% |
| Brazil | 16 | 0.0% |
| Cambodia | 7 | 0.0% |
| Canada | 14 | 0.0% |
| Caribbean | 24 | 0.1% |
| Central America | 148 | 0.4% |
| China | 5 | 0.0% |
| Colombia | 12 | 0.0% |
| Cuba | 3 | 0.0% |
| Eastern Asia | 34 | 0.1% |
| Eastern Europe | 19 | 0.1% |
| El Salvador | 9 | 0.0% |
| England | 9 | 0.0% |
| Europe | 102 | 0.3% |
| Germany | 67 | 0.2% |
| Guyana | 10 | 0.0% |
| Honduras | 47 | 0.1% |
| India | 11 | 0.0% |
| Italy | 2 | 0.0% |
| Jamaica | 13 | 0.0% |
| Korea | 29 | 0.1% |
| Laos | 24 | 0.1% |
| Latin America | 210 | 0.6% |
| Lebanon | 7 | 0.0% |
| Mexico | 78 | 0.2% |
| Nicaragua | 13 | 0.0% |
| Northern Europe | 13 | 0.0% |
| Pakistan | 10 | 0.0% |
| Philippines | 76 | 0.2% |
| Poland | 2 | 0.0% |
| Scotland | 4 | 0.0% |
| South Africa | 6 | 0.0% |
| South America | 38 | 0.1% |
| South Central Asia | 21 | 0.1% |
| South Eastern Asia | 112 | 0.3% |
| Southern Europe | 3 | 0.0% |
| Spain | 1 | 0.0% |
| Taiwan | 1 | 0.0% |
| Trinidad and Tobago | 8 | 0.0% |
| Ukraine | 17 | 0.1% |
| Vietnam | 5 | 0.0% |
| Western Asia | 7 | 0.0% |
| Western Europe | 67 | 0.2% | View All 45 Rows |
Sex and Age in Beauregard Parish
Sex and Age in Beauregard Parish
The most populous age groups in Beauregard Parish are 10 to 14 Years (1,519 | 8.1%) for men and 55 to 59 Years (1,309 | 7.3%) for women.
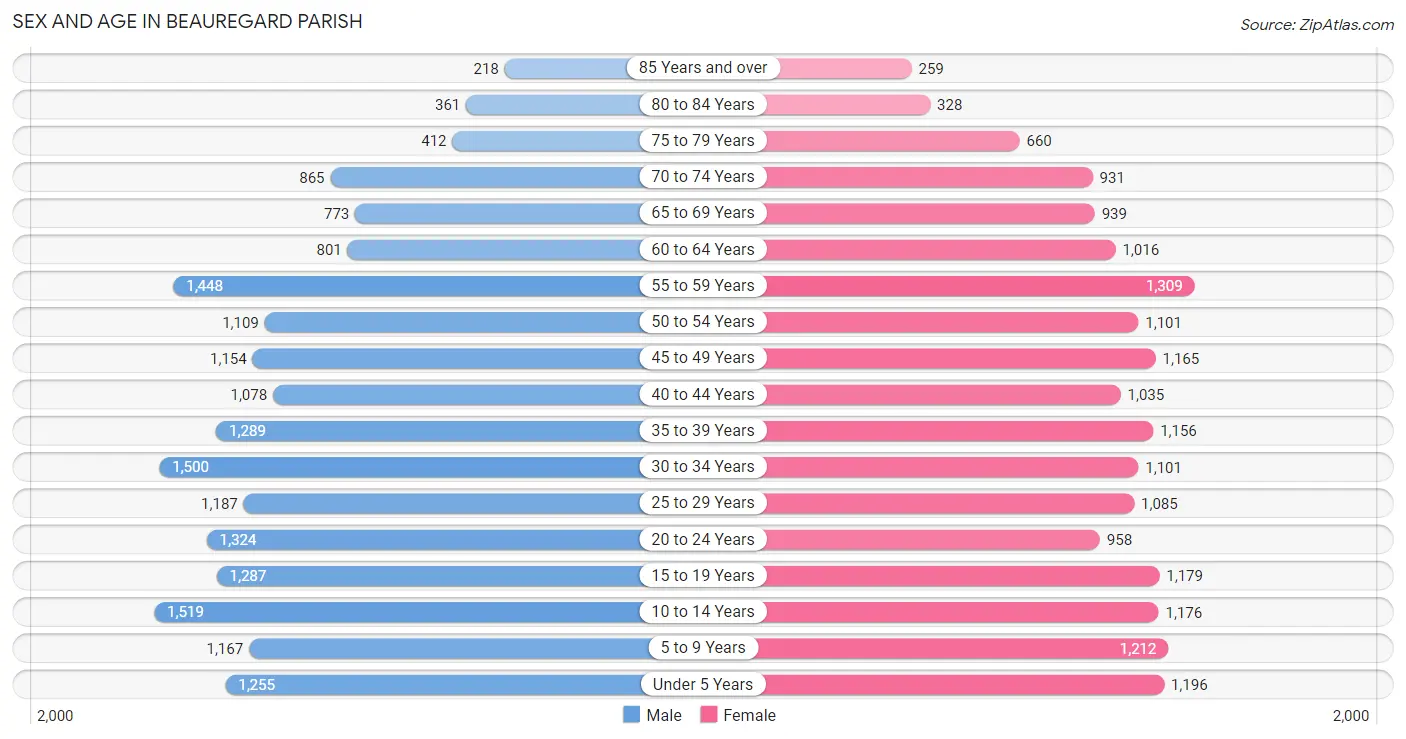
| Age Bracket | Male | Female |
| Under 5 Years | 1,255 (6.7%) | 1,196 (6.7%) |
| 5 to 9 Years | 1,167 (6.2%) | 1,212 (6.8%) |
| 10 to 14 Years | 1,519 (8.1%) | 1,176 (6.6%) |
| 15 to 19 Years | 1,287 (6.9%) | 1,179 (6.6%) |
| 20 to 24 Years | 1,324 (7.1%) | 958 (5.4%) |
| 25 to 29 Years | 1,187 (6.3%) | 1,085 (6.1%) |
| 30 to 34 Years | 1,500 (8.0%) | 1,101 (6.2%) |
| 35 to 39 Years | 1,289 (6.9%) | 1,156 (6.5%) |
| 40 to 44 Years | 1,078 (5.8%) | 1,035 (5.8%) |
| 45 to 49 Years | 1,154 (6.2%) | 1,165 (6.5%) |
| 50 to 54 Years | 1,109 (5.9%) | 1,101 (6.2%) |
| 55 to 59 Years | 1,448 (7.7%) | 1,309 (7.3%) |
| 60 to 64 Years | 801 (4.3%) | 1,016 (5.7%) |
| 65 to 69 Years | 773 (4.1%) | 939 (5.3%) |
| 70 to 74 Years | 865 (4.6%) | 931 (5.2%) |
| 75 to 79 Years | 412 (2.2%) | 660 (3.7%) |
| 80 to 84 Years | 361 (1.9%) | 328 (1.8%) |
| 85 Years and over | 218 (1.2%) | 259 (1.5%) |
| Total | 18,747 (100.0%) | 17,806 (100.0%) |
Families and Households in Beauregard Parish
Median Family Size in Beauregard Parish
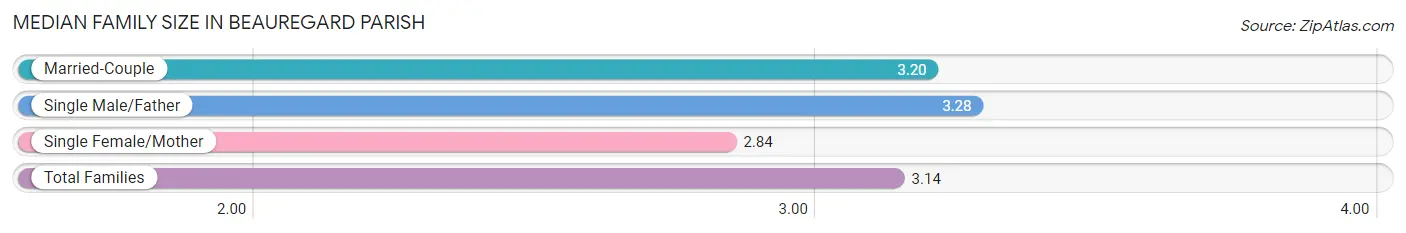
The median family size in Beauregard Parish is 3.14 persons per family, with single male/father families (823 | 8.6%) accounting for the largest median family size of 3.28 persons per family. On the other hand, single female/mother families (1,691 | 17.6%) represent the smallest median family size with 2.84 persons per family.
| Family Type | # Families | Family Size |
| Married-Couple | 7,108 (73.9%) | 3.20 |
| Single Male/Father | 823 (8.6%) | 3.28 |
| Single Female/Mother | 1,691 (17.6%) | 2.84 |
| Total Families | 9,622 (100.0%) | 3.14 |
Median Household Size in Beauregard Parish
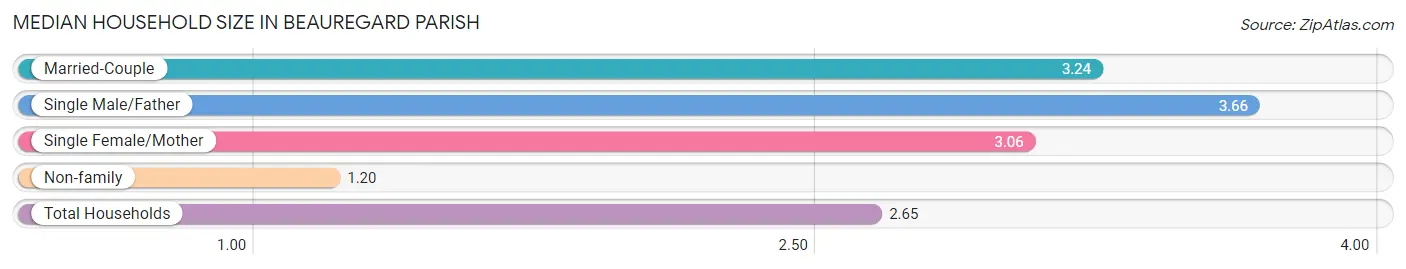
The median household size in Beauregard Parish is 2.65 persons per household, with single male/father households (823 | 6.1%) accounting for the largest median household size of 3.66 persons per household. non-family households (3,965 | 29.2%) represent the smallest median household size with 1.20 persons per household.
| Household Type | # Households | Household Size |
| Married-Couple | 7,108 (52.3%) | 3.24 |
| Single Male/Father | 823 (6.1%) | 3.66 |
| Single Female/Mother | 1,691 (12.4%) | 3.06 |
| Non-family | 3,965 (29.2%) | 1.20 |
| Total Households | 13,587 (100.0%) | 2.65 |
Household Size by Marriage Status in Beauregard Parish
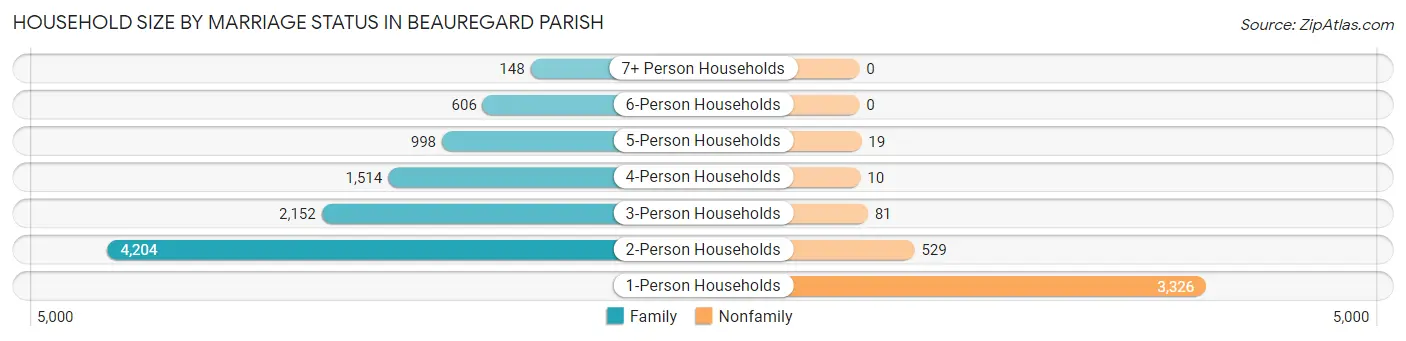
Out of a total of 13,587 households in Beauregard Parish, 9,622 (70.8%) are family households, while 3,965 (29.2%) are nonfamily households. The most numerous type of family households are 2-person households, comprising 4,204, and the most common type of nonfamily households are 1-person households, comprising 3,326.
| Household Size | Family Households | Nonfamily Households |
| 1-Person Households | - | 3,326 (24.5%) |
| 2-Person Households | 4,204 (30.9%) | 529 (3.9%) |
| 3-Person Households | 2,152 (15.8%) | 81 (0.6%) |
| 4-Person Households | 1,514 (11.1%) | 10 (0.1%) |
| 5-Person Households | 998 (7.3%) | 19 (0.1%) |
| 6-Person Households | 606 (4.5%) | 0 (0.0%) |
| 7+ Person Households | 148 (1.1%) | 0 (0.0%) |
| Total | 9,622 (70.8%) | 3,965 (29.2%) |
Female Fertility in Beauregard Parish
Fertility by Age in Beauregard Parish
Average fertility rate in Beauregard Parish is 56.0 births per 1,000 women. Women in the age bracket of 20 to 34 years have the highest fertility rate with 115.0 births per 1,000 women. Women in the age bracket of 20 to 34 years acount for 81.6% of all women with births.
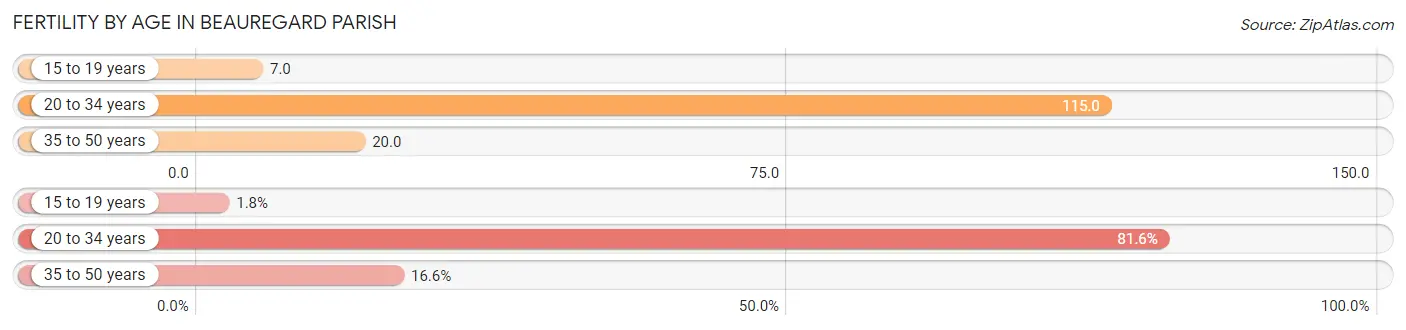
| Age Bracket | Women with Births | Births / 1,000 Women |
| 15 to 19 years | 8 (1.8%) | 7.0 |
| 20 to 34 years | 363 (81.6%) | 115.0 |
| 35 to 50 years | 74 (16.6%) | 20.0 |
| Total | 445 (100.0%) | 56.0 |
Fertility by Age by Marriage Status in Beauregard Parish
60.9% of women with births (445) in Beauregard Parish are married. The highest percentage of unmarried women with births falls into 15 to 19 years age bracket with 100.0% of them unmarried at the time of birth, while the lowest percentage of unmarried women with births belong to 35 to 50 years age bracket with 5.4% of them unmarried.
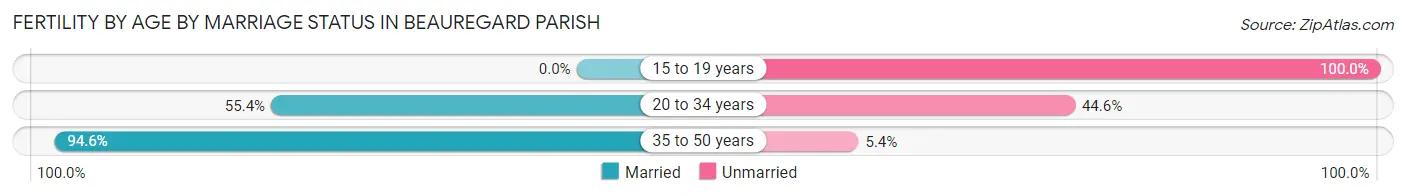
| Age Bracket | Married | Unmarried |
| 15 to 19 years | 0 (0.0%) | 8 (100.0%) |
| 20 to 34 years | 201 (55.4%) | 162 (44.6%) |
| 35 to 50 years | 70 (94.6%) | 4 (5.4%) |
| Total | 271 (60.9%) | 174 (39.1%) |
Fertility by Education in Beauregard Parish
Average fertility rate in Beauregard Parish is 56.0 births per 1,000 women. Women with the education attainment of graduate degree have the highest fertility rate of 139.0 births per 1,000 women, while women with the education attainment of bachelor's degree have the lowest fertility at 26.0 births per 1,000 women. Women with the education attainment of high school diploma represent 50.6% of all women with births.
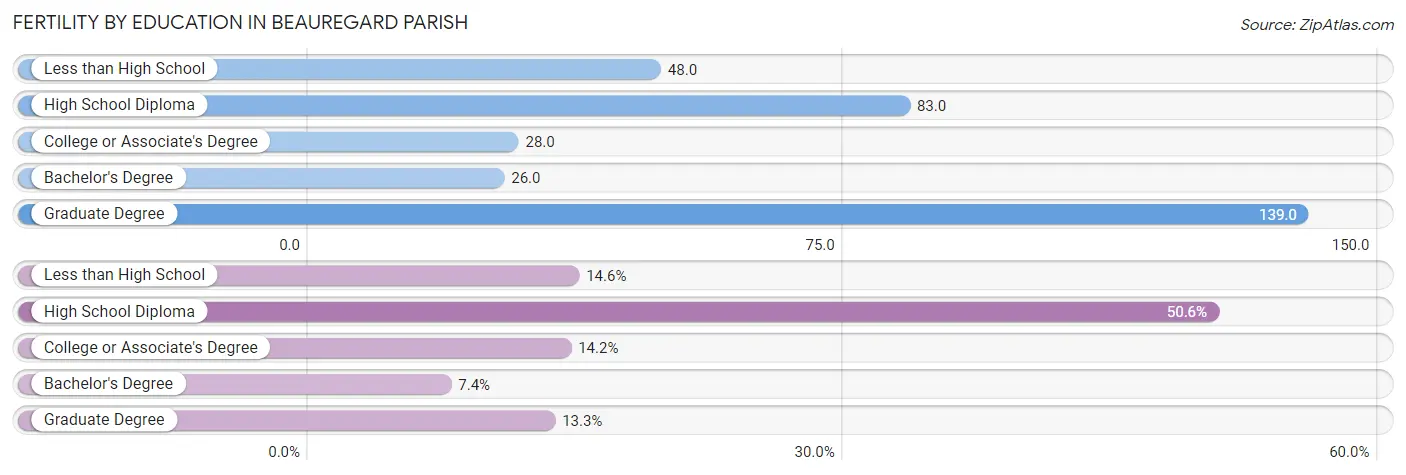
| Educational Attainment | Women with Births | Births / 1,000 Women |
| Less than High School | 65 (14.6%) | 48.0 |
| High School Diploma | 225 (50.6%) | 83.0 |
| College or Associate's Degree | 63 (14.2%) | 28.0 |
| Bachelor's Degree | 33 (7.4%) | 26.0 |
| Graduate Degree | 59 (13.3%) | 139.0 |
| Total | 445 (100.0%) | 56.0 |
Fertility by Education by Marriage Status in Beauregard Parish
39.1% of women with births in Beauregard Parish are unmarried. Women with the educational attainment of bachelor's degree are most likely to be married with 100.0% of them married at childbirth, while women with the educational attainment of high school diploma are least likely to be married with 66.2% of them unmarried at childbirth.
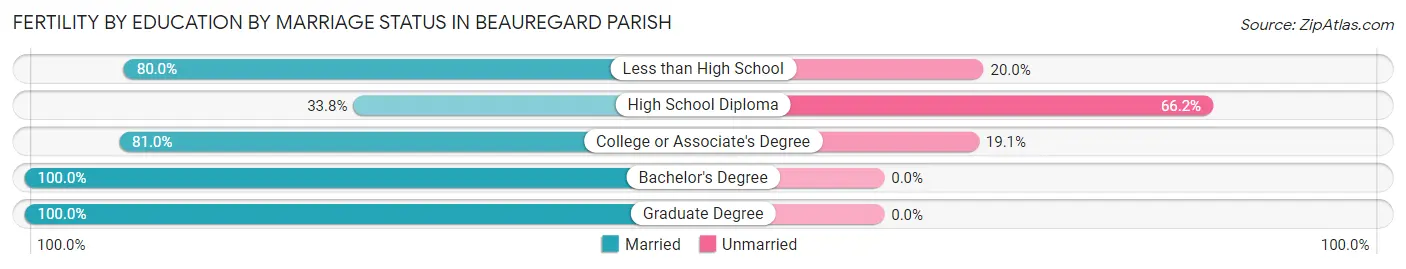
| Educational Attainment | Married | Unmarried |
| Less than High School | 52 (80.0%) | 13 (20.0%) |
| High School Diploma | 76 (33.8%) | 149 (66.2%) |
| College or Associate's Degree | 51 (80.9%) | 12 (19.1%) |
| Bachelor's Degree | 33 (100.0%) | 0 (0.0%) |
| Graduate Degree | 59 (100.0%) | 0 (0.0%) |
| Total | 271 (60.9%) | 174 (39.1%) |
Employment Characteristics in Beauregard Parish
Employment by Class of Employer in Beauregard Parish
Among the 14,499 employed individuals in Beauregard Parish, private company employees (10,025 | 69.1%), local government employees (1,157 | 8.0%), and not-for-profit organizations (946 | 6.5%) make up the most common classes of employment.
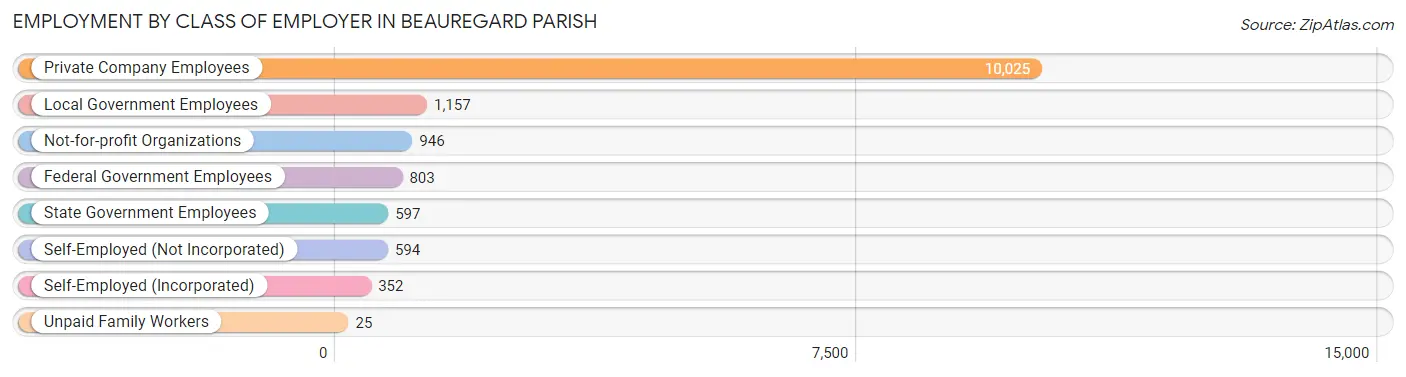
| Employer Class | # Employees | % Employees |
| Private Company Employees | 10,025 | 69.1% |
| Self-Employed (Incorporated) | 352 | 2.4% |
| Self-Employed (Not Incorporated) | 594 | 4.1% |
| Not-for-profit Organizations | 946 | 6.5% |
| Local Government Employees | 1,157 | 8.0% |
| State Government Employees | 597 | 4.1% |
| Federal Government Employees | 803 | 5.5% |
| Unpaid Family Workers | 25 | 0.2% |
| Total | 14,499 | 100.0% |
Employment Status by Age in Beauregard Parish
According to the labor force statistics for Beauregard Parish, out of the total population over 16 years of age (28,370), 56.9% or 16,143 individuals are in the labor force, with 8.1% or 1,308 of them unemployed. The age group with the highest labor force participation rate is 20 to 24 years, with 78.0% or 1,780 individuals in the labor force. Within the labor force, the 16 to 19 years age range has the highest percentage of unemployed individuals, with 31.9% or 134 of them being unemployed.
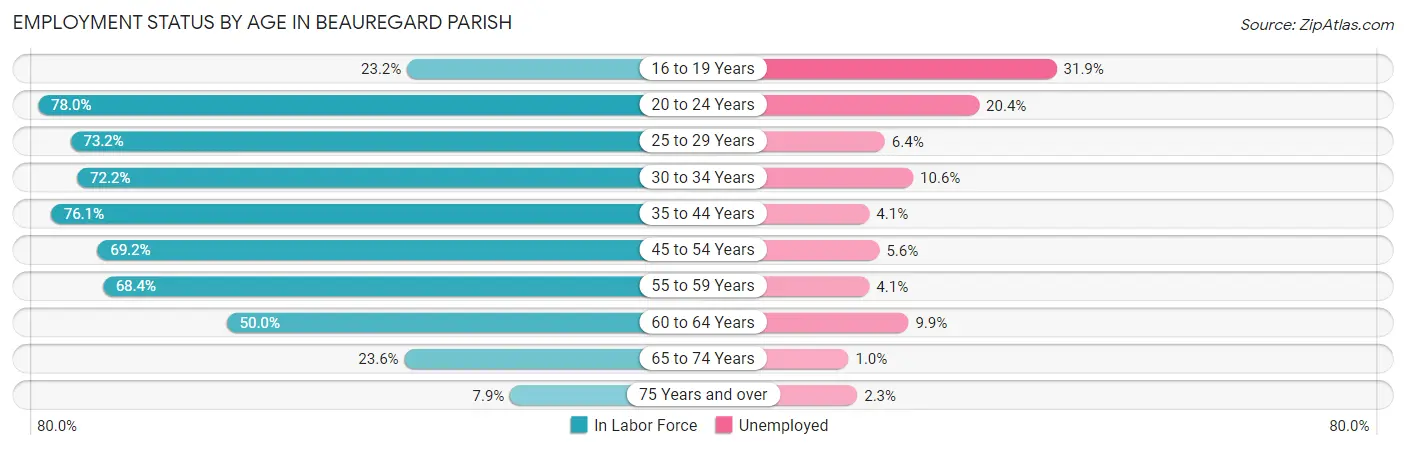
| Age Bracket | In Labor Force | Unemployed |
| 16 to 19 Years | 419 (23.2%) | 134 (31.9%) |
| 20 to 24 Years | 1,780 (78.0%) | 363 (20.4%) |
| 25 to 29 Years | 1,663 (73.2%) | 106 (6.4%) |
| 30 to 34 Years | 1,878 (72.2%) | 199 (10.6%) |
| 35 to 44 Years | 3,469 (76.1%) | 142 (4.1%) |
| 45 to 54 Years | 3,134 (69.2%) | 176 (5.6%) |
| 55 to 59 Years | 1,886 (68.4%) | 77 (4.1%) |
| 60 to 64 Years | 908 (50.0%) | 90 (9.9%) |
| 65 to 74 Years | 828 (23.6%) | 8 (1.0%) |
| 75 Years and over | 177 (7.9%) | 4 (2.3%) |
| Total | 16,143 (56.9%) | 1,308 (8.1%) |
Employment Status by Educational Attainment in Beauregard Parish
According to labor force statistics for Beauregard Parish, 69.8% of individuals (12,937) out of the total population between 25 and 64 years of age (18,534) are in the labor force, with 6.1% or 789 of them being unemployed. The group with the highest labor force participation rate are those with the educational attainment of bachelor's degree or higher, with 79.1% or 2,729 individuals in the labor force. Within the labor force, individuals with less than high school education have the highest percentage of unemployment, with 20.7% or 214 of them being unemployed.
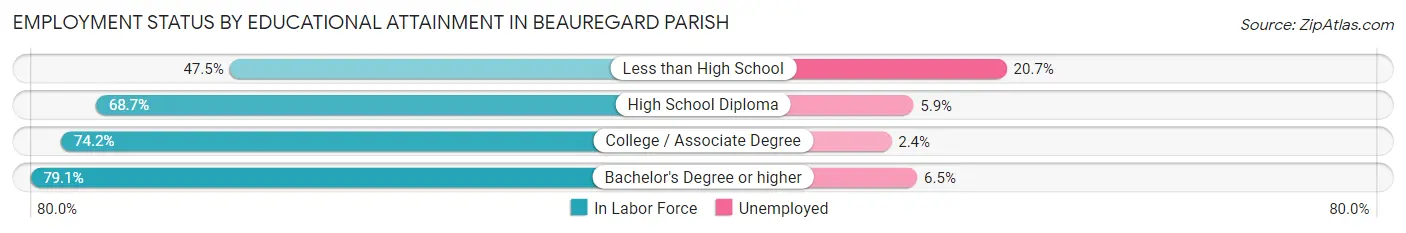
| Educational Attainment | In Labor Force | Unemployed |
| Less than High School | 1,035 (47.5%) | 451 (20.7%) |
| High School Diploma | 5,032 (68.7%) | 432 (5.9%) |
| College / Associate Degree | 4,142 (74.2%) | 134 (2.4%) |
| Bachelor's Degree or higher | 2,729 (79.1%) | 224 (6.5%) |
| Total | 12,937 (69.8%) | 1,131 (6.1%) |
Employment Occupations by Sex in Beauregard Parish
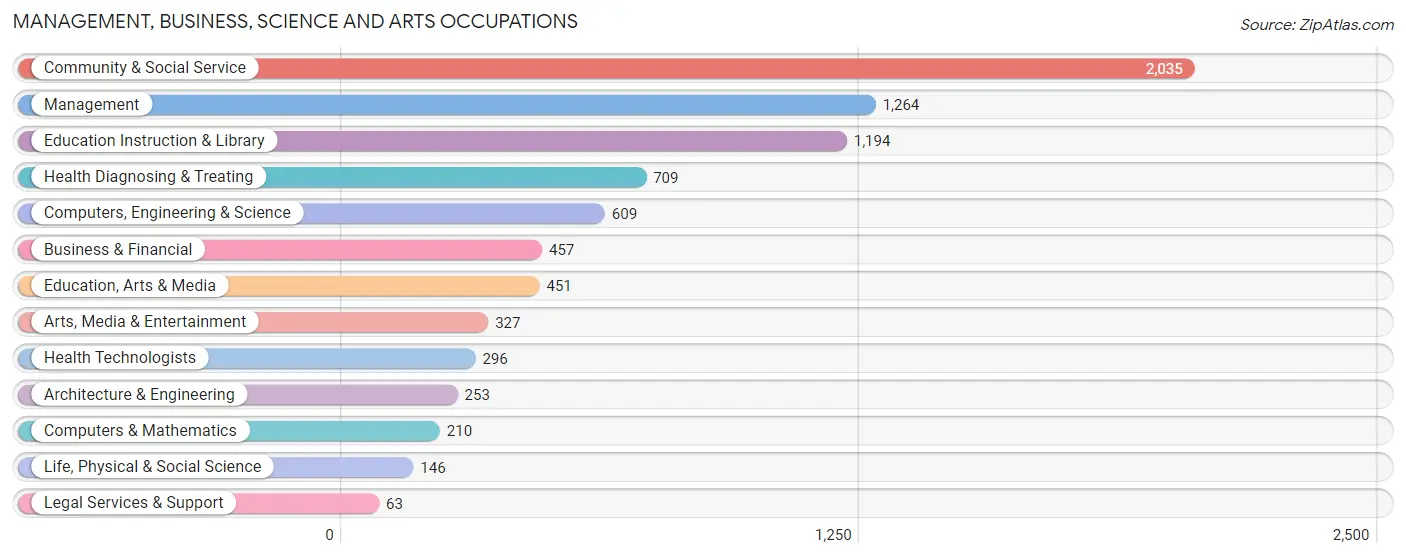
Management, Business, Science and Arts Occupations
The most common Management, Business, Science and Arts occupations in Beauregard Parish are Community & Social Service (2,035 | 14.0%), Management (1,264 | 8.7%), Education Instruction & Library (1,194 | 8.2%), Health Diagnosing & Treating (709 | 4.9%), and Computers, Engineering & Science (609 | 4.2%).
Management, Business, Science and Arts Occupations by Sex
Within the Management, Business, Science and Arts occupations in Beauregard Parish, the most male-oriented occupations are Computers & Mathematics (83.3%), Computers, Engineering & Science (79.1%), and Life, Physical & Social Science (78.8%), while the most female-oriented occupations are Health Technologists (94.6%), Education Instruction & Library (90.4%), and Health Diagnosing & Treating (87.6%).
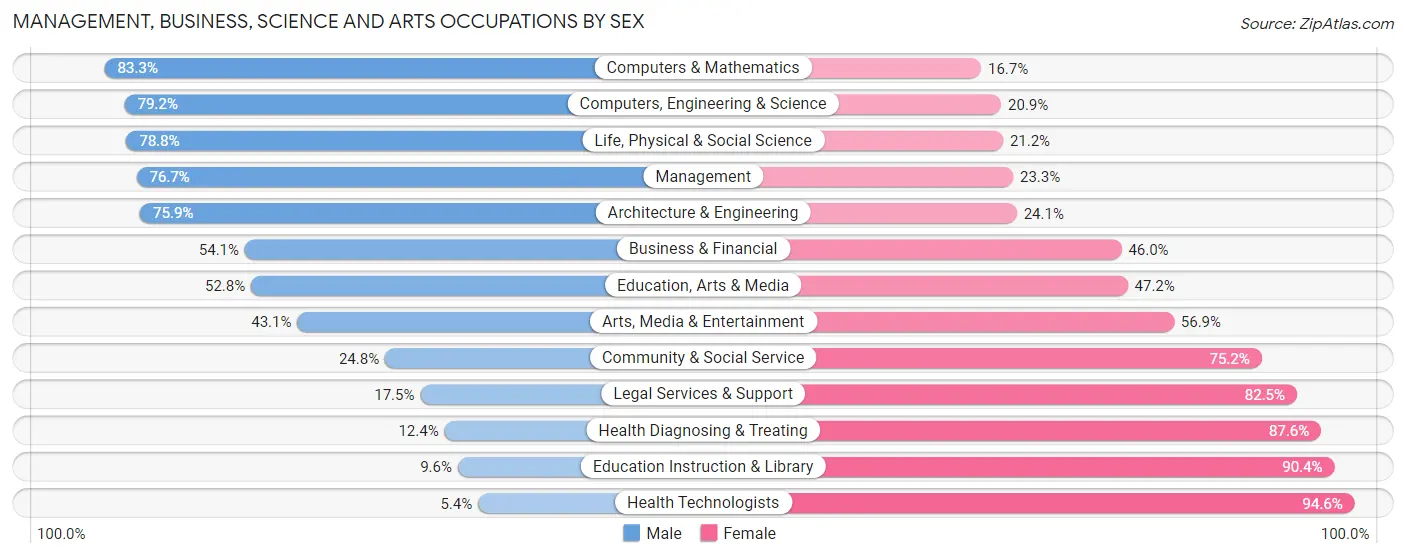
| Occupation | Male | Female |
| Management | 969 (76.7%) | 295 (23.3%) |
| Business & Financial | 247 (54.0%) | 210 (46.0%) |
| Computers, Engineering & Science | 482 (79.1%) | 127 (20.8%) |
| Computers & Mathematics | 175 (83.3%) | 35 (16.7%) |
| Architecture & Engineering | 192 (75.9%) | 61 (24.1%) |
| Life, Physical & Social Science | 115 (78.8%) | 31 (21.2%) |
| Community & Social Service | 505 (24.8%) | 1,530 (75.2%) |
| Education, Arts & Media | 238 (52.8%) | 213 (47.2%) |
| Legal Services & Support | 11 (17.5%) | 52 (82.5%) |
| Education Instruction & Library | 115 (9.6%) | 1,079 (90.4%) |
| Arts, Media & Entertainment | 141 (43.1%) | 186 (56.9%) |
| Health Diagnosing & Treating | 88 (12.4%) | 621 (87.6%) |
| Health Technologists | 16 (5.4%) | 280 (94.6%) |
| Total (Category) | 2,291 (45.2%) | 2,783 (54.8%) |
| Total (Overall) | 8,440 (58.1%) | 6,095 (41.9%) |
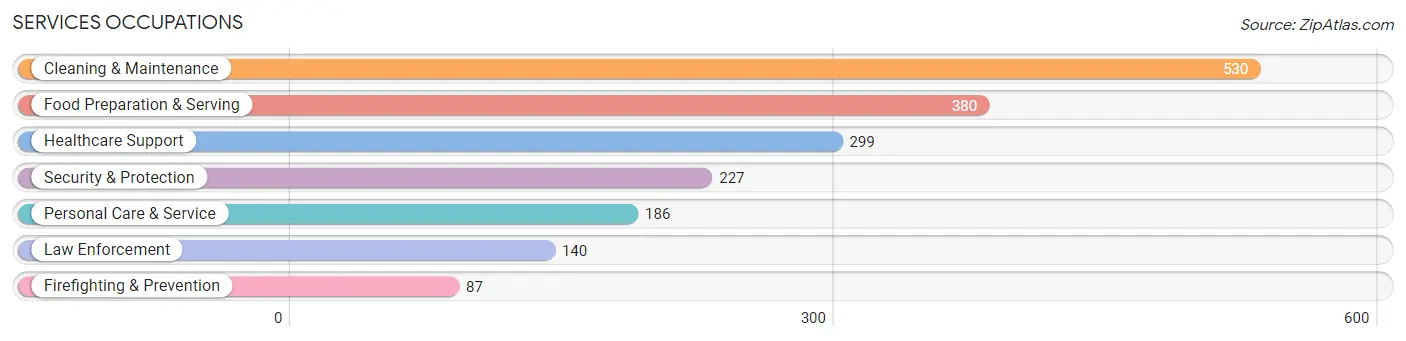
Services Occupations
The most common Services occupations in Beauregard Parish are Cleaning & Maintenance (530 | 3.6%), Food Preparation & Serving (380 | 2.6%), Healthcare Support (299 | 2.1%), Security & Protection (227 | 1.6%), and Personal Care & Service (186 | 1.3%).
Services Occupations by Sex
Within the Services occupations in Beauregard Parish, the most male-oriented occupations are Law Enforcement (92.1%), Security & Protection (77.5%), and Firefighting & Prevention (54.0%), while the most female-oriented occupations are Healthcare Support (88.0%), Personal Care & Service (81.2%), and Food Preparation & Serving (71.3%).
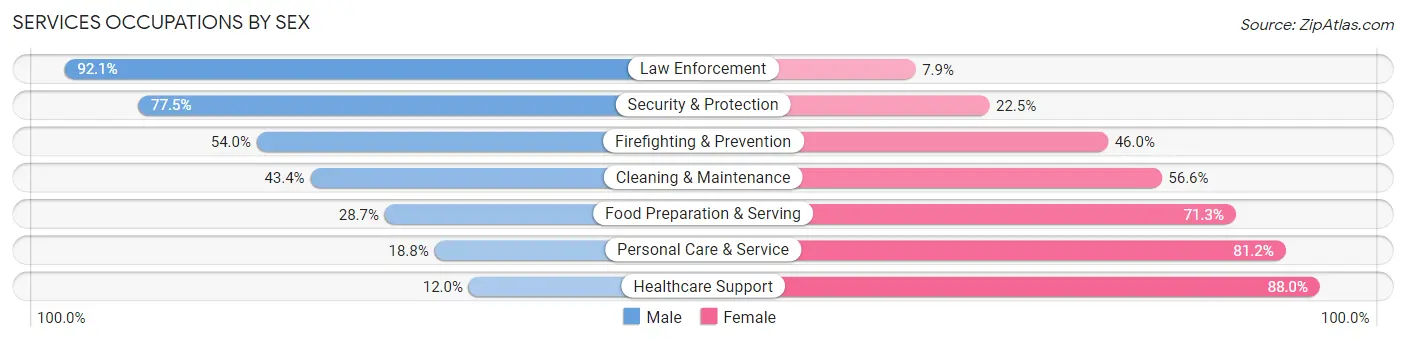
| Occupation | Male | Female |
| Healthcare Support | 36 (12.0%) | 263 (88.0%) |
| Security & Protection | 176 (77.5%) | 51 (22.5%) |
| Firefighting & Prevention | 47 (54.0%) | 40 (46.0%) |
| Law Enforcement | 129 (92.1%) | 11 (7.9%) |
| Food Preparation & Serving | 109 (28.7%) | 271 (71.3%) |
| Cleaning & Maintenance | 230 (43.4%) | 300 (56.6%) |
| Personal Care & Service | 35 (18.8%) | 151 (81.2%) |
| Total (Category) | 586 (36.1%) | 1,036 (63.9%) |
| Total (Overall) | 8,440 (58.1%) | 6,095 (41.9%) |
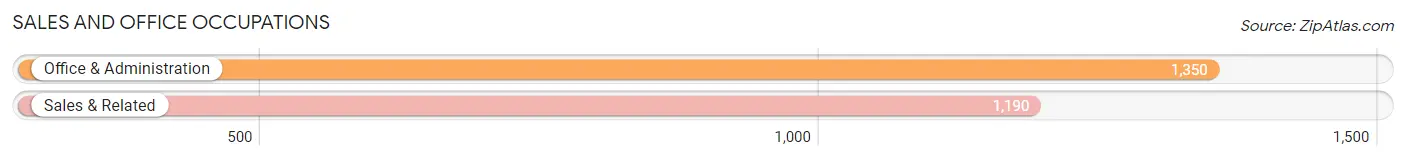
Sales and Office Occupations
The most common Sales and Office occupations in Beauregard Parish are Office & Administration (1,350 | 9.3%), and Sales & Related (1,190 | 8.2%).
Sales and Office Occupations by Sex
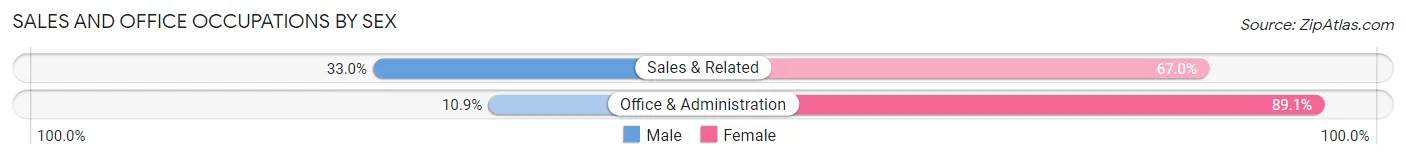
| Occupation | Male | Female |
| Sales & Related | 393 (33.0%) | 797 (67.0%) |
| Office & Administration | 147 (10.9%) | 1,203 (89.1%) |
| Total (Category) | 540 (21.3%) | 2,000 (78.7%) |
| Total (Overall) | 8,440 (58.1%) | 6,095 (41.9%) |
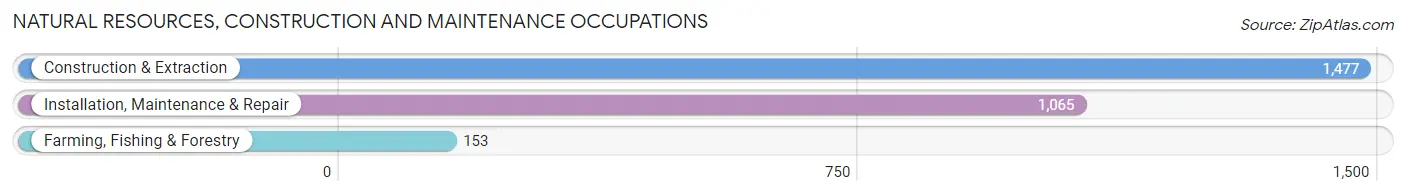
Natural Resources, Construction and Maintenance Occupations
The most common Natural Resources, Construction and Maintenance occupations in Beauregard Parish are Construction & Extraction (1,477 | 10.2%), Installation, Maintenance & Repair (1,065 | 7.3%), and Farming, Fishing & Forestry (153 | 1.1%).
Natural Resources, Construction and Maintenance Occupations by Sex
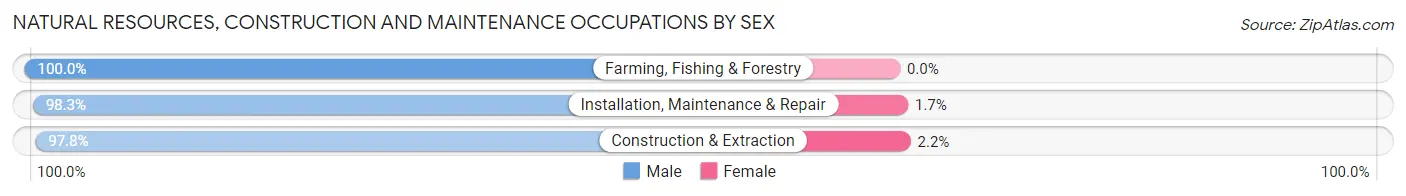
| Occupation | Male | Female |
| Farming, Fishing & Forestry | 153 (100.0%) | 0 (0.0%) |
| Construction & Extraction | 1,444 (97.8%) | 33 (2.2%) |
| Installation, Maintenance & Repair | 1,047 (98.3%) | 18 (1.7%) |
| Total (Category) | 2,644 (98.1%) | 51 (1.9%) |
| Total (Overall) | 8,440 (58.1%) | 6,095 (41.9%) |
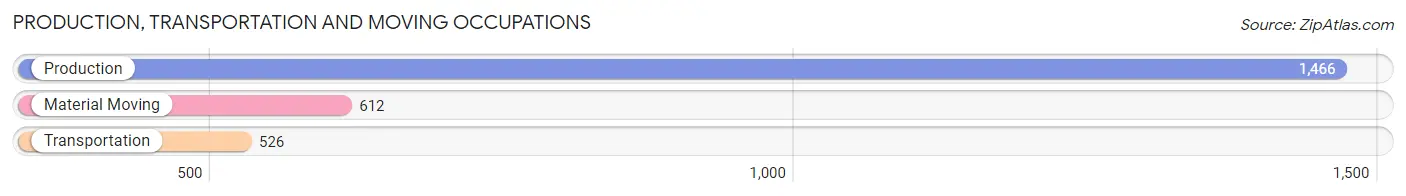
Production, Transportation and Moving Occupations
The most common Production, Transportation and Moving occupations in Beauregard Parish are Production (1,466 | 10.1%), Material Moving (612 | 4.2%), and Transportation (526 | 3.6%).
Production, Transportation and Moving Occupations by Sex
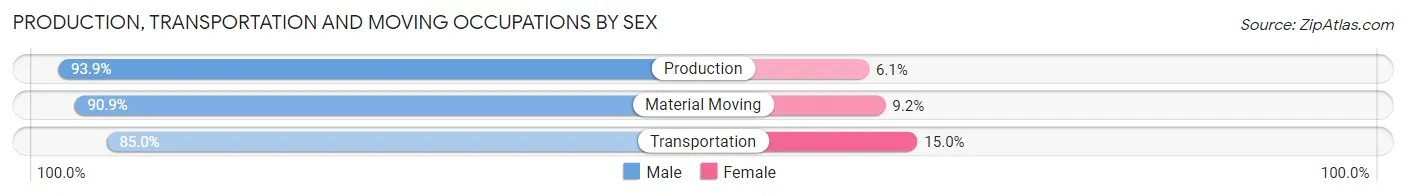
| Occupation | Male | Female |
| Production | 1,376 (93.9%) | 90 (6.1%) |
| Transportation | 447 (85.0%) | 79 (15.0%) |
| Material Moving | 556 (90.8%) | 56 (9.1%) |
| Total (Category) | 2,379 (91.4%) | 225 (8.6%) |
| Total (Overall) | 8,440 (58.1%) | 6,095 (41.9%) |
Employment Industries by Sex in Beauregard Parish
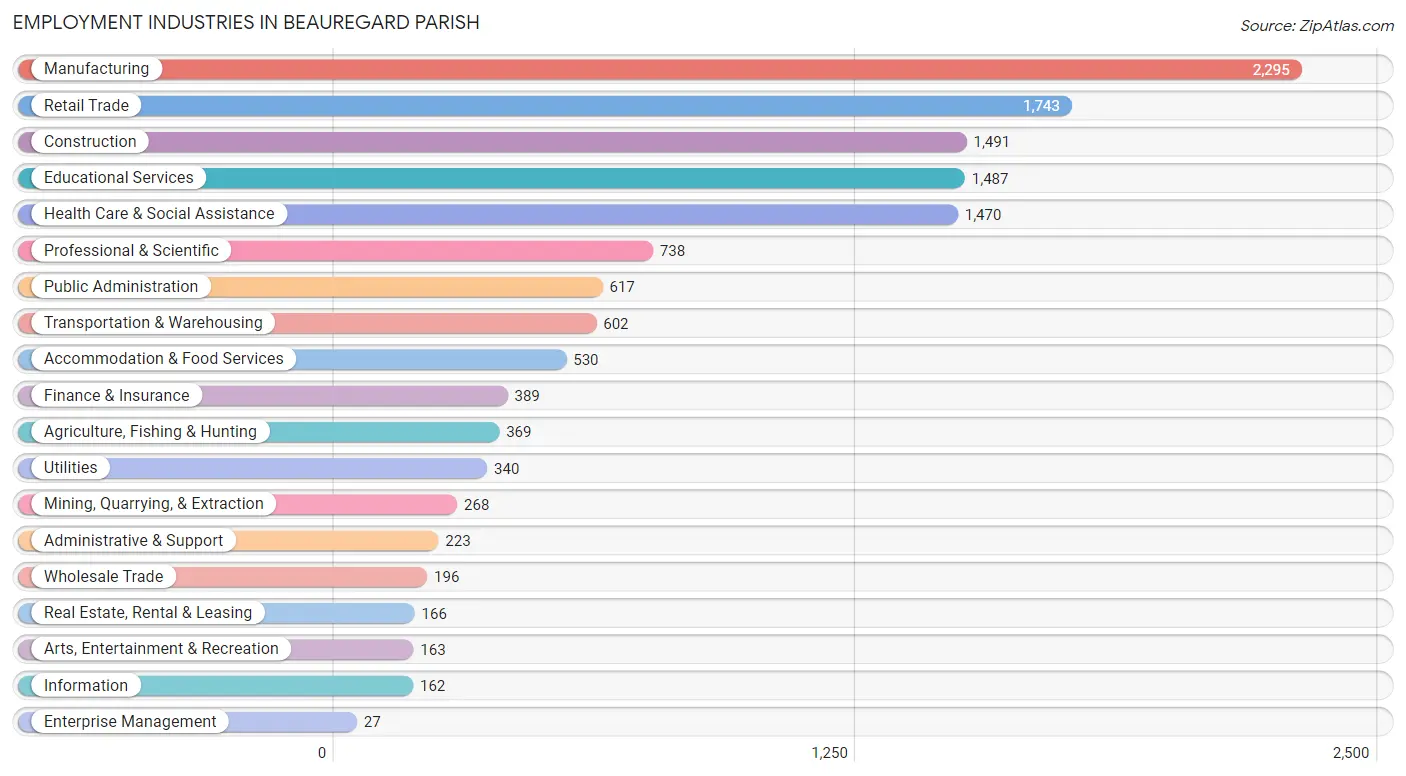
Employment Industries in Beauregard Parish
The major employment industries in Beauregard Parish include Manufacturing (2,295 | 15.8%), Retail Trade (1,743 | 12.0%), Construction (1,491 | 10.3%), Educational Services (1,487 | 10.2%), and Health Care & Social Assistance (1,470 | 10.1%).
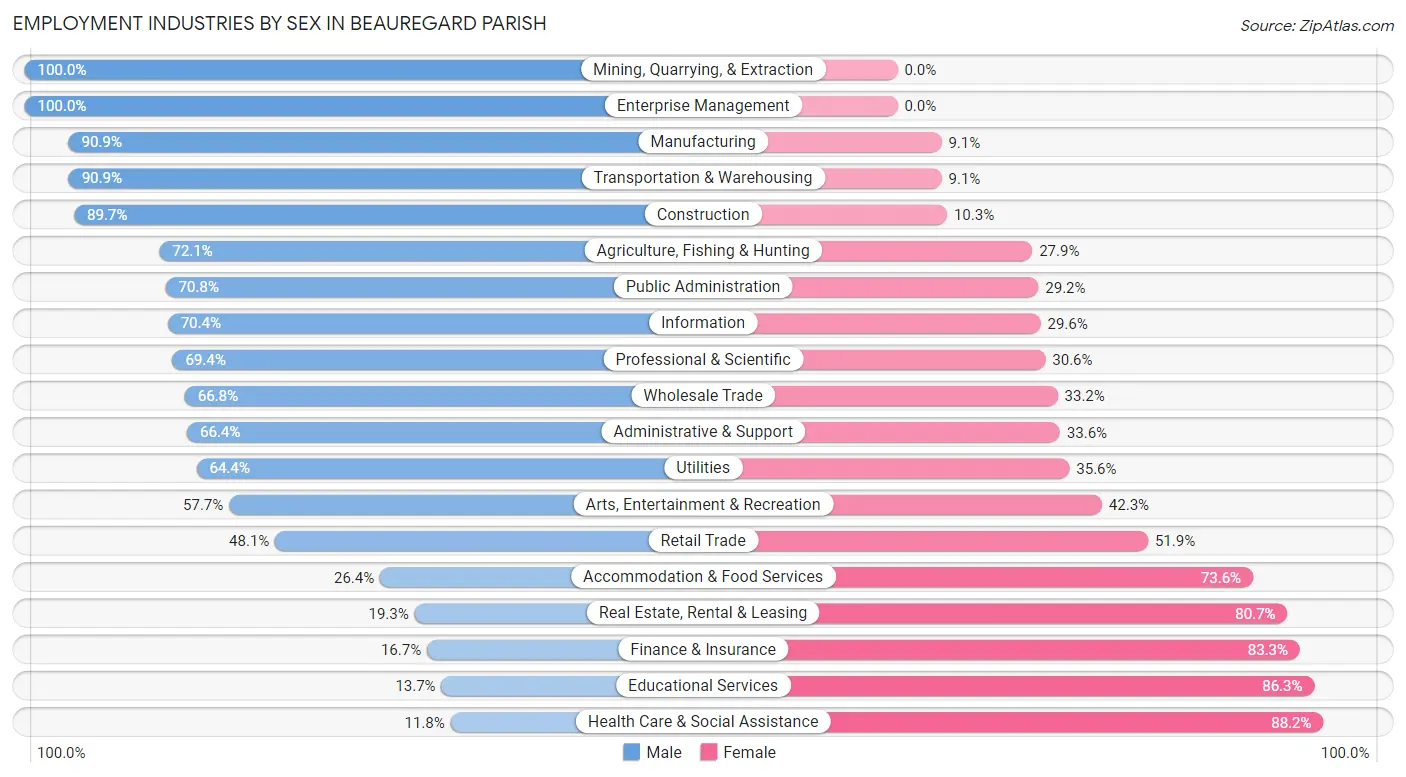
Employment Industries by Sex in Beauregard Parish
The Beauregard Parish industries that see more men than women are Mining, Quarrying, & Extraction (100.0%), Enterprise Management (100.0%), and Manufacturing (90.9%), whereas the industries that tend to have a higher number of women are Health Care & Social Assistance (88.2%), Educational Services (86.3%), and Finance & Insurance (83.3%).
| Industry | Male | Female |
| Agriculture, Fishing & Hunting | 266 (72.1%) | 103 (27.9%) |
| Mining, Quarrying, & Extraction | 268 (100.0%) | 0 (0.0%) |
| Construction | 1,338 (89.7%) | 153 (10.3%) |
| Manufacturing | 2,086 (90.9%) | 209 (9.1%) |
| Wholesale Trade | 131 (66.8%) | 65 (33.2%) |
| Retail Trade | 839 (48.1%) | 904 (51.9%) |
| Transportation & Warehousing | 547 (90.9%) | 55 (9.1%) |
| Utilities | 219 (64.4%) | 121 (35.6%) |
| Information | 114 (70.4%) | 48 (29.6%) |
| Finance & Insurance | 65 (16.7%) | 324 (83.3%) |
| Real Estate, Rental & Leasing | 32 (19.3%) | 134 (80.7%) |
| Professional & Scientific | 512 (69.4%) | 226 (30.6%) |
| Enterprise Management | 27 (100.0%) | 0 (0.0%) |
| Administrative & Support | 148 (66.4%) | 75 (33.6%) |
| Educational Services | 204 (13.7%) | 1,283 (86.3%) |
| Health Care & Social Assistance | 174 (11.8%) | 1,296 (88.2%) |
| Arts, Entertainment & Recreation | 94 (57.7%) | 69 (42.3%) |
| Accommodation & Food Services | 140 (26.4%) | 390 (73.6%) |
| Public Administration | 437 (70.8%) | 180 (29.2%) |
| Total | 8,440 (58.1%) | 6,095 (41.9%) |
Education in Beauregard Parish
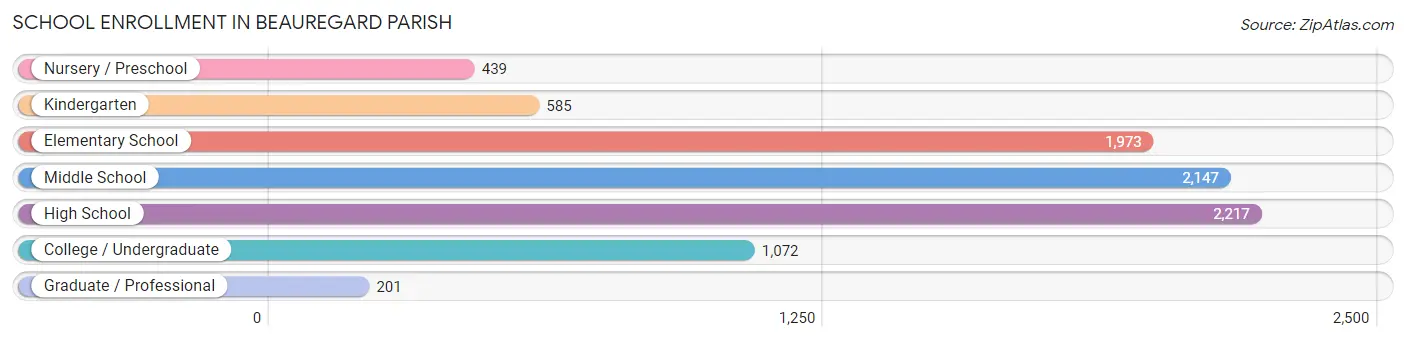
School Enrollment in Beauregard Parish
The most common levels of schooling among the 8,634 students in Beauregard Parish are high school (2,217 | 25.7%), middle school (2,147 | 24.9%), and elementary school (1,973 | 22.9%).
| School Level | # Students | % Students |
| Nursery / Preschool | 439 | 5.1% |
| Kindergarten | 585 | 6.8% |
| Elementary School | 1,973 | 22.9% |
| Middle School | 2,147 | 24.9% |
| High School | 2,217 | 25.7% |
| College / Undergraduate | 1,072 | 12.4% |
| Graduate / Professional | 201 | 2.3% |
| Total | 8,634 | 100.0% |
School Enrollment by Age by Funding Source in Beauregard Parish
Out of a total of 8,634 students who are enrolled in schools in Beauregard Parish, 1,269 (14.7%) attend a private institution, while the remaining 7,365 (85.3%) are enrolled in public schools. The age group of 25 to 34 year olds has the highest likelihood of being enrolled in private schools, with 127 (40.1% in the age bracket) enrolled. Conversely, the age group of 15 to 17 year olds has the lowest likelihood of being enrolled in a private school, with 1,429 (93.7% in the age bracket) attending a public institution.
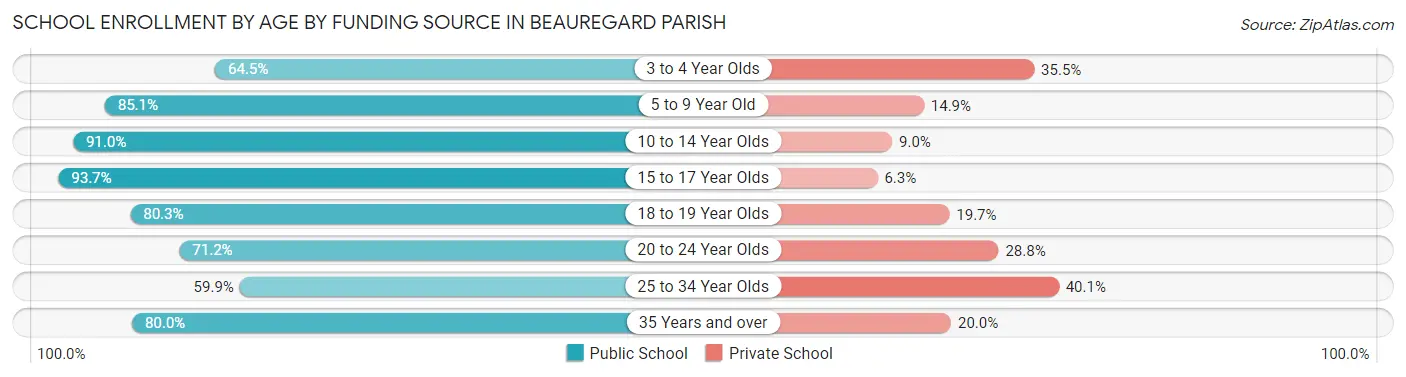
| Age Bracket | Public School | Private School |
| 3 to 4 Year Olds | 220 (64.5%) | 121 (35.5%) |
| 5 to 9 Year Old | 1,970 (85.1%) | 346 (14.9%) |
| 10 to 14 Year Olds | 2,422 (91.0%) | 240 (9.0%) |
| 15 to 17 Year Olds | 1,429 (93.7%) | 96 (6.3%) |
| 18 to 19 Year Olds | 469 (80.3%) | 115 (19.7%) |
| 20 to 24 Year Olds | 380 (71.2%) | 154 (28.8%) |
| 25 to 34 Year Olds | 190 (59.9%) | 127 (40.1%) |
| 35 Years and over | 284 (80.0%) | 71 (20.0%) |
| Total | 7,365 (85.3%) | 1,269 (14.7%) |
Educational Attainment by Field of Study in Beauregard Parish
Education (1,315 | 28.5%), science & technology (676 | 14.6%), business (580 | 12.6%), bio, nature & agricultural (407 | 8.8%), and liberal arts & history (399 | 8.6%) are the most common fields of study among 4,619 individuals in Beauregard Parish who have obtained a bachelor's degree or higher.
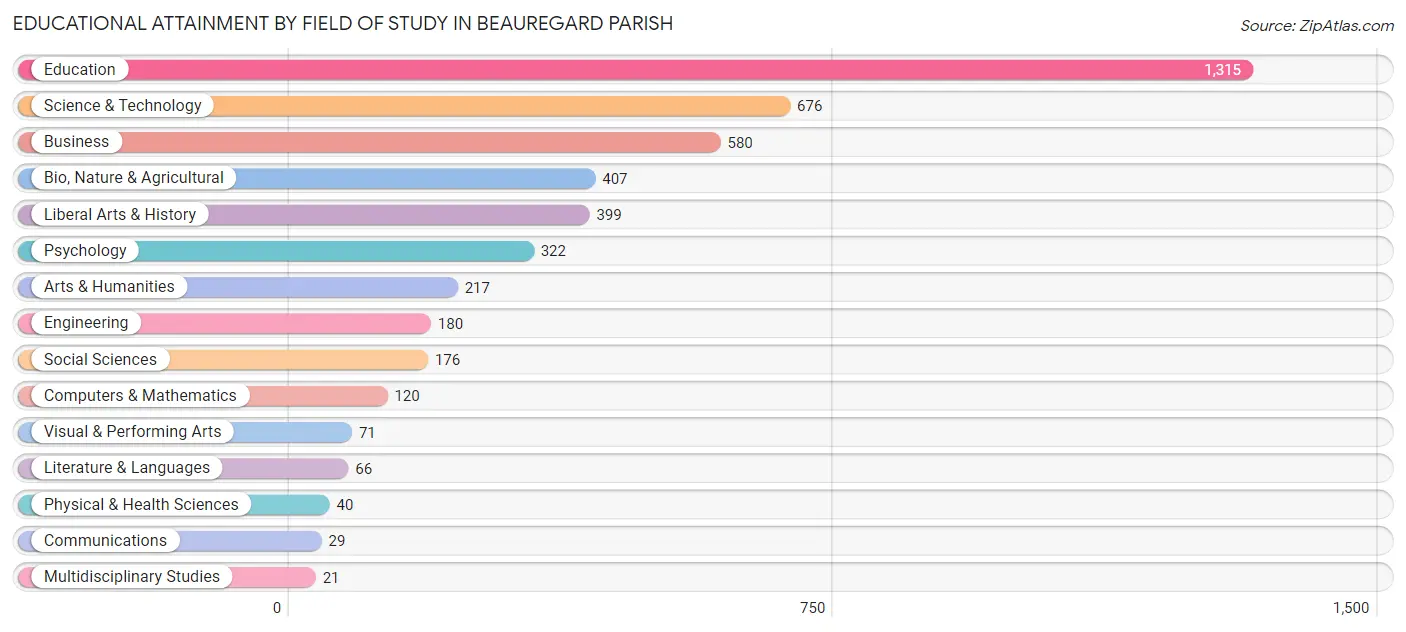
| Field of Study | # Graduates | % Graduates |
| Computers & Mathematics | 120 | 2.6% |
| Bio, Nature & Agricultural | 407 | 8.8% |
| Physical & Health Sciences | 40 | 0.9% |
| Psychology | 322 | 7.0% |
| Social Sciences | 176 | 3.8% |
| Engineering | 180 | 3.9% |
| Multidisciplinary Studies | 21 | 0.4% |
| Science & Technology | 676 | 14.6% |
| Business | 580 | 12.6% |
| Education | 1,315 | 28.5% |
| Literature & Languages | 66 | 1.4% |
| Liberal Arts & History | 399 | 8.6% |
| Visual & Performing Arts | 71 | 1.5% |
| Communications | 29 | 0.6% |
| Arts & Humanities | 217 | 4.7% |
| Total | 4,619 | 100.0% |
Transportation & Commute in Beauregard Parish
Vehicle Availability by Sex in Beauregard Parish
The most prevalent vehicle ownership categories in Beauregard Parish are males with 2 vehicles (3,242, accounting for 38.1%) and females with 2 vehicles (2,317, making up 54.3%).
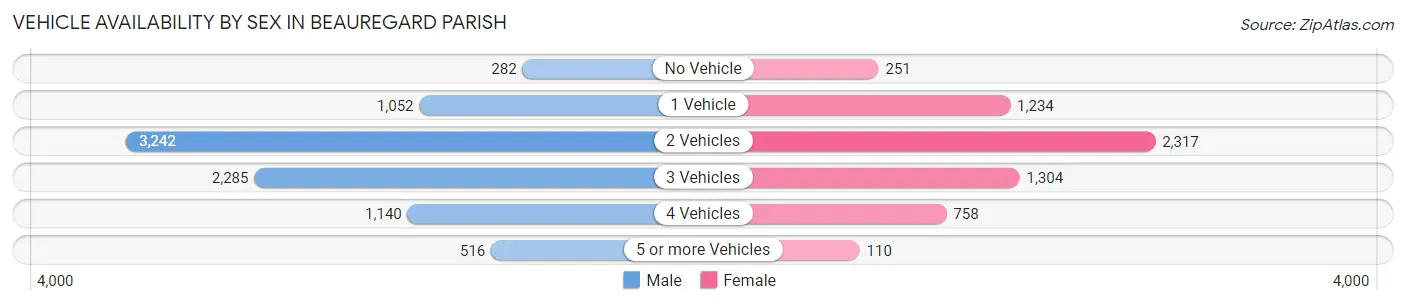
| Vehicles Available | Male | Female |
| No Vehicle | 282 (3.3%) | 251 (4.2%) |
| 1 Vehicle | 1,052 (12.3%) | 1,234 (20.7%) |
| 2 Vehicles | 3,242 (38.1%) | 2,317 (38.8%) |
| 3 Vehicles | 2,285 (26.8%) | 1,304 (21.8%) |
| 4 Vehicles | 1,140 (13.4%) | 758 (12.7%) |
| 5 or more Vehicles | 516 (6.1%) | 110 (1.8%) |
| Total | 8,517 (100.0%) | 5,974 (100.0%) |
Commute Time in Beauregard Parish
The most frequently occuring commute durations in Beauregard Parish are 10 to 14 minutes (1,766 commuters, 12.6%), 20 to 24 minutes (1,694 commuters, 12.1%), and 45 to 59 minutes (1,534 commuters, 10.9%).
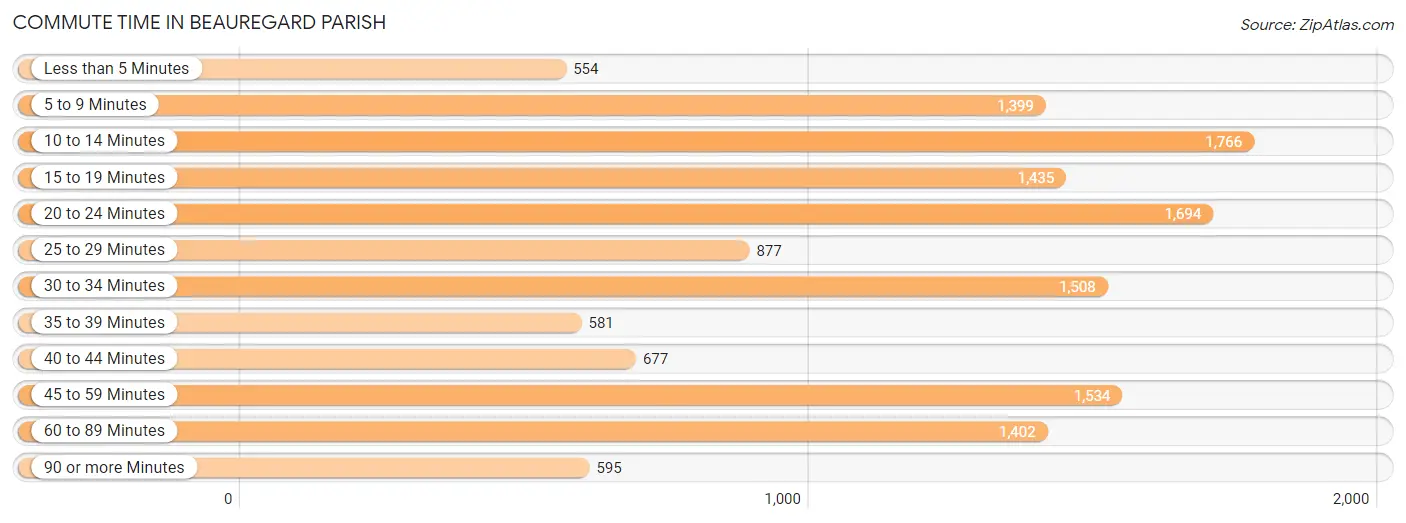
| Commute Time | # Commuters | % Commuters |
| Less than 5 Minutes | 554 | 4.0% |
| 5 to 9 Minutes | 1,399 | 10.0% |
| 10 to 14 Minutes | 1,766 | 12.6% |
| 15 to 19 Minutes | 1,435 | 10.2% |
| 20 to 24 Minutes | 1,694 | 12.1% |
| 25 to 29 Minutes | 877 | 6.2% |
| 30 to 34 Minutes | 1,508 | 10.7% |
| 35 to 39 Minutes | 581 | 4.1% |
| 40 to 44 Minutes | 677 | 4.8% |
| 45 to 59 Minutes | 1,534 | 10.9% |
| 60 to 89 Minutes | 1,402 | 10.0% |
| 90 or more Minutes | 595 | 4.2% |
Commute Time by Sex in Beauregard Parish
The most common commute times in Beauregard Parish are 20 to 24 minutes (1,210 commuters, 14.6%) for males and 10 to 14 minutes (1,107 commuters, 19.2%) for females.
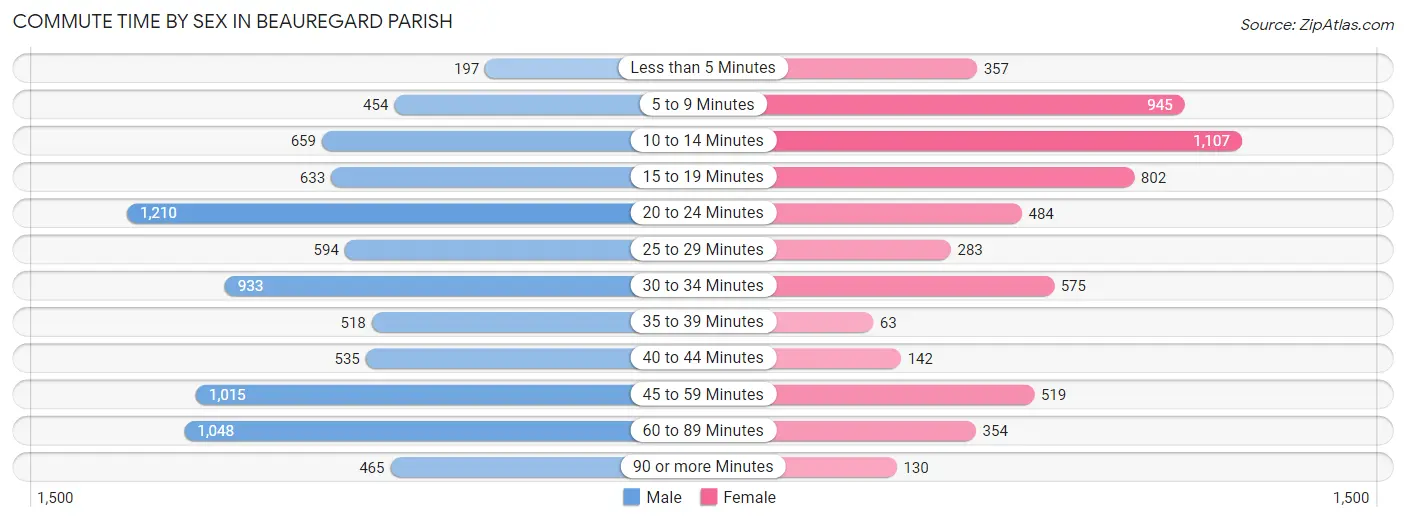
| Commute Time | Male | Female |
| Less than 5 Minutes | 197 (2.4%) | 357 (6.2%) |
| 5 to 9 Minutes | 454 (5.5%) | 945 (16.4%) |
| 10 to 14 Minutes | 659 (8.0%) | 1,107 (19.2%) |
| 15 to 19 Minutes | 633 (7.7%) | 802 (13.9%) |
| 20 to 24 Minutes | 1,210 (14.6%) | 484 (8.4%) |
| 25 to 29 Minutes | 594 (7.2%) | 283 (4.9%) |
| 30 to 34 Minutes | 933 (11.3%) | 575 (10.0%) |
| 35 to 39 Minutes | 518 (6.3%) | 63 (1.1%) |
| 40 to 44 Minutes | 535 (6.5%) | 142 (2.5%) |
| 45 to 59 Minutes | 1,015 (12.3%) | 519 (9.0%) |
| 60 to 89 Minutes | 1,048 (12.7%) | 354 (6.1%) |
| 90 or more Minutes | 465 (5.6%) | 130 (2.3%) |
Time of Departure to Work by Sex in Beauregard Parish
The most frequent times of departure to work in Beauregard Parish are 12:00 AM to 4:59 AM (1,770, 21.4%) for males and 7:00 AM to 7:29 AM (1,308, 22.7%) for females.
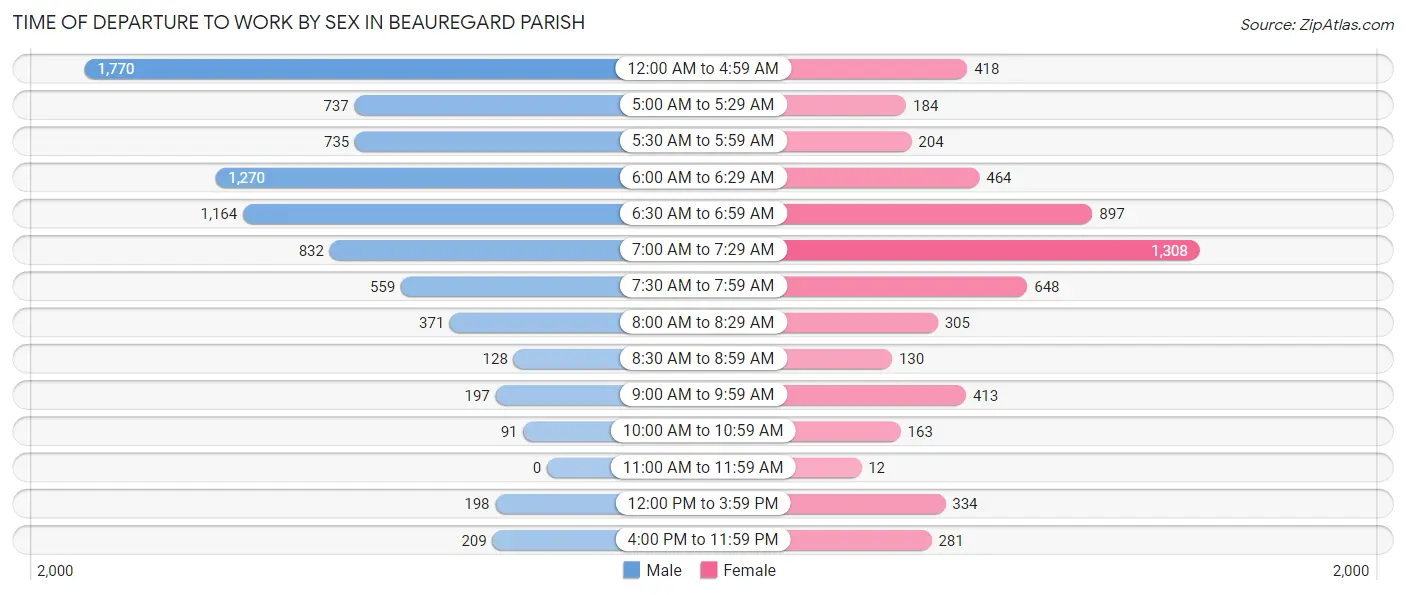
| Time of Departure | Male | Female |
| 12:00 AM to 4:59 AM | 1,770 (21.4%) | 418 (7.3%) |
| 5:00 AM to 5:29 AM | 737 (8.9%) | 184 (3.2%) |
| 5:30 AM to 5:59 AM | 735 (8.9%) | 204 (3.5%) |
| 6:00 AM to 6:29 AM | 1,270 (15.4%) | 464 (8.1%) |
| 6:30 AM to 6:59 AM | 1,164 (14.1%) | 897 (15.6%) |
| 7:00 AM to 7:29 AM | 832 (10.1%) | 1,308 (22.7%) |
| 7:30 AM to 7:59 AM | 559 (6.8%) | 648 (11.3%) |
| 8:00 AM to 8:29 AM | 371 (4.5%) | 305 (5.3%) |
| 8:30 AM to 8:59 AM | 128 (1.5%) | 130 (2.3%) |
| 9:00 AM to 9:59 AM | 197 (2.4%) | 413 (7.2%) |
| 10:00 AM to 10:59 AM | 91 (1.1%) | 163 (2.8%) |
| 11:00 AM to 11:59 AM | 0 (0.0%) | 12 (0.2%) |
| 12:00 PM to 3:59 PM | 198 (2.4%) | 334 (5.8%) |
| 4:00 PM to 11:59 PM | 209 (2.5%) | 281 (4.9%) |
| Total | 8,261 (100.0%) | 5,761 (100.0%) |
Housing Occupancy in Beauregard Parish
Occupancy by Ownership in Beauregard Parish
Of the total 13,587 dwellings in Beauregard Parish, owner-occupied units account for 11,181 (82.3%), while renter-occupied units make up 2,406 (17.7%).
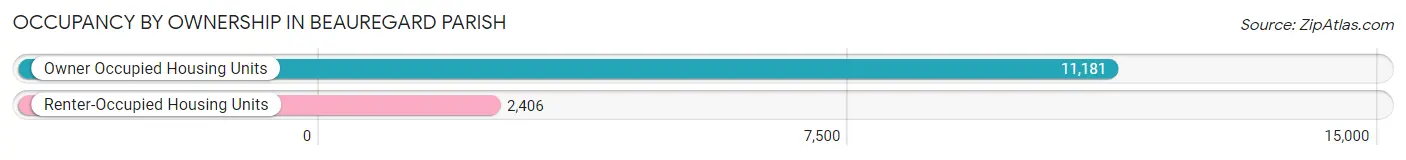
| Occupancy | # Housing Units | % Housing Units |
| Owner Occupied Housing Units | 11,181 | 82.3% |
| Renter-Occupied Housing Units | 2,406 | 17.7% |
| Total Occupied Housing Units | 13,587 | 100.0% |
Occupancy by Household Size in Beauregard Parish
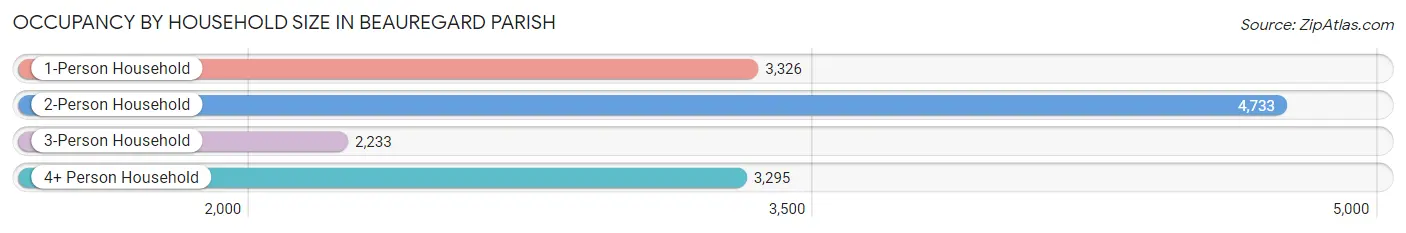
| Household Size | # Housing Units | % Housing Units |
| 1-Person Household | 3,326 | 24.5% |
| 2-Person Household | 4,733 | 34.8% |
| 3-Person Household | 2,233 | 16.4% |
| 4+ Person Household | 3,295 | 24.2% |
| Total Housing Units | 13,587 | 100.0% |
Occupancy by Ownership by Household Size in Beauregard Parish
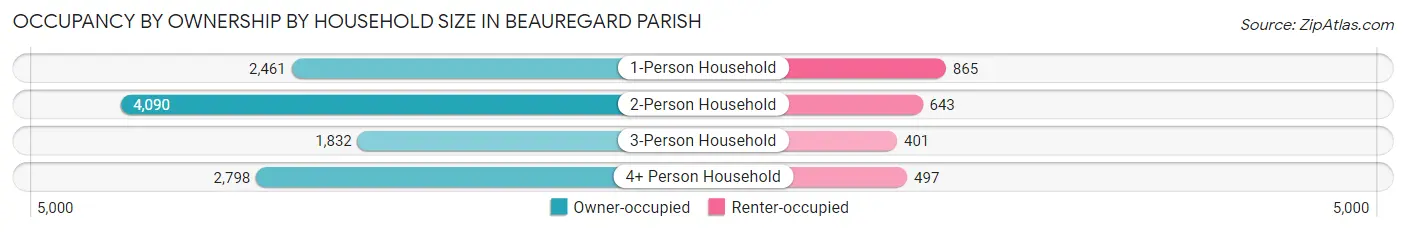
| Household Size | Owner-occupied | Renter-occupied |
| 1-Person Household | 2,461 (74.0%) | 865 (26.0%) |
| 2-Person Household | 4,090 (86.4%) | 643 (13.6%) |
| 3-Person Household | 1,832 (82.0%) | 401 (18.0%) |
| 4+ Person Household | 2,798 (84.9%) | 497 (15.1%) |
| Total Housing Units | 11,181 (82.3%) | 2,406 (17.7%) |
Occupancy by Educational Attainment in Beauregard Parish
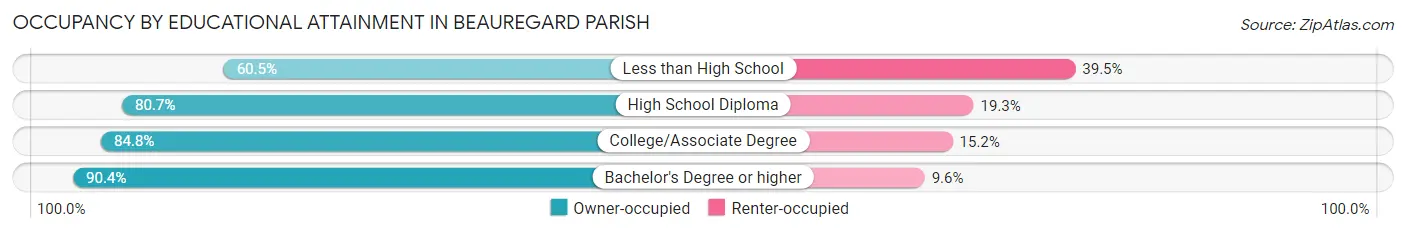
| Household Size | Owner-occupied | Renter-occupied |
| Less than High School | 622 (60.5%) | 406 (39.5%) |
| High School Diploma | 4,509 (80.7%) | 1,080 (19.3%) |
| College/Associate Degree | 3,817 (84.8%) | 682 (15.2%) |
| Bachelor's Degree or higher | 2,233 (90.4%) | 238 (9.6%) |
Occupancy by Age of Householder in Beauregard Parish
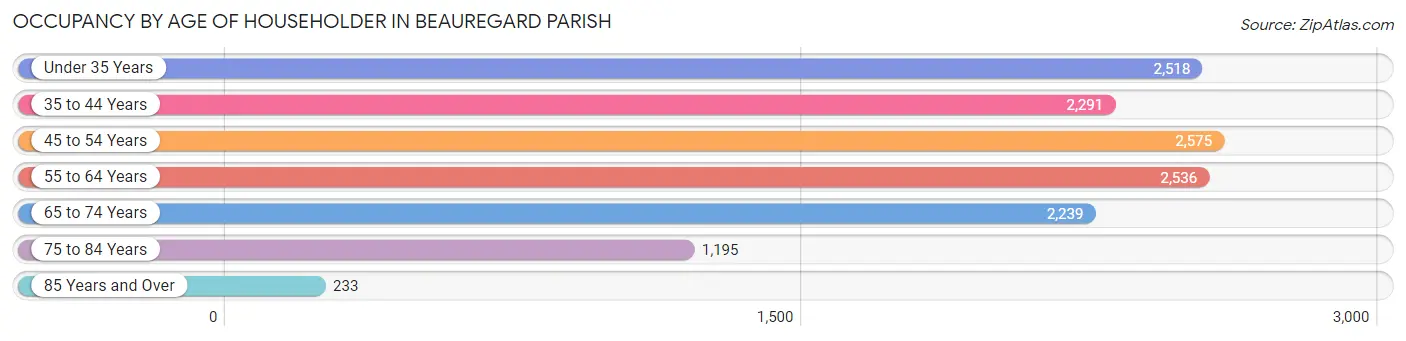
| Age Bracket | # Households | % Households |
| Under 35 Years | 2,518 | 18.5% |
| 35 to 44 Years | 2,291 | 16.9% |
| 45 to 54 Years | 2,575 | 19.0% |
| 55 to 64 Years | 2,536 | 18.7% |
| 65 to 74 Years | 2,239 | 16.5% |
| 75 to 84 Years | 1,195 | 8.8% |
| 85 Years and Over | 233 | 1.7% |
| Total | 13,587 | 100.0% |
Housing Finances in Beauregard Parish
Median Income by Occupancy in Beauregard Parish
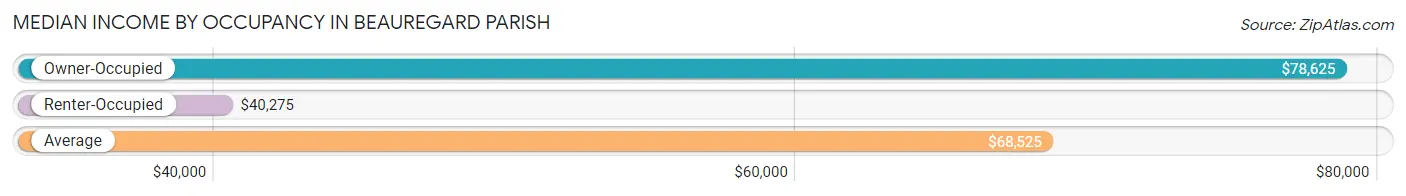
| Occupancy Type | # Households | Median Income |
| Owner-Occupied | 11,181 (82.3%) | $78,625 |
| Renter-Occupied | 2,406 (17.7%) | $40,275 |
| Average | 13,587 (100.0%) | $68,525 |
Occupancy by Householder Income Bracket in Beauregard Parish
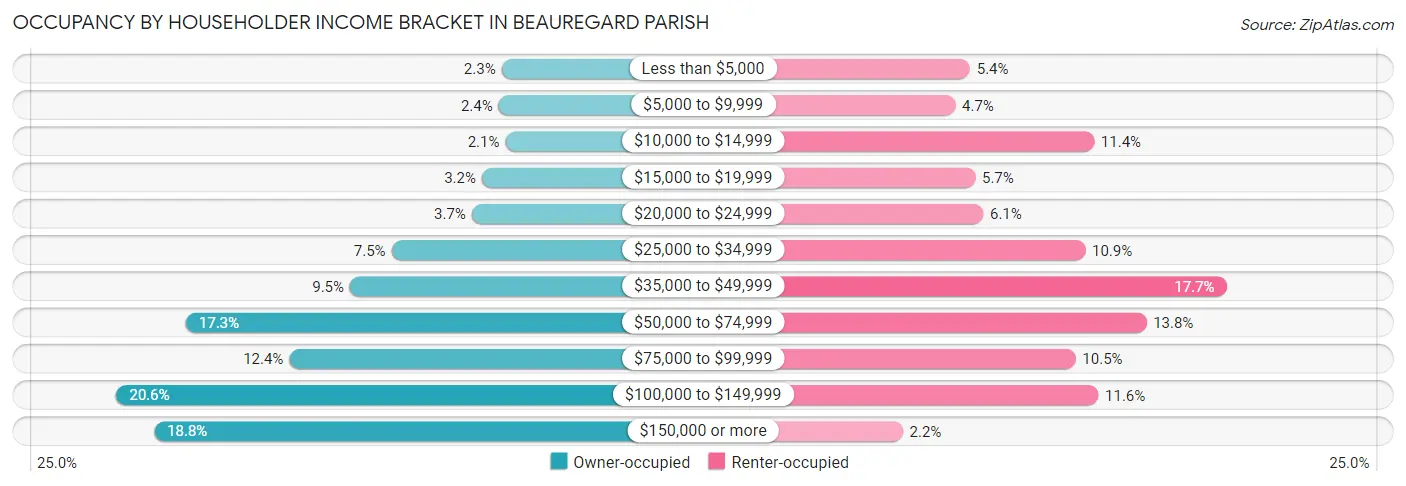
| Income Bracket | Owner-occupied | Renter-occupied |
| Less than $5,000 | 256 (2.3%) | 131 (5.4%) |
| $5,000 to $9,999 | 272 (2.4%) | 114 (4.7%) |
| $10,000 to $14,999 | 236 (2.1%) | 273 (11.4%) |
| $15,000 to $19,999 | 361 (3.2%) | 137 (5.7%) |
| $20,000 to $24,999 | 415 (3.7%) | 146 (6.1%) |
| $25,000 to $34,999 | 842 (7.5%) | 263 (10.9%) |
| $35,000 to $49,999 | 1,063 (9.5%) | 425 (17.7%) |
| $50,000 to $74,999 | 1,937 (17.3%) | 333 (13.8%) |
| $75,000 to $99,999 | 1,386 (12.4%) | 252 (10.5%) |
| $100,000 to $149,999 | 2,307 (20.6%) | 278 (11.6%) |
| $150,000 or more | 2,106 (18.8%) | 54 (2.2%) |
| Total | 11,181 (100.0%) | 2,406 (100.0%) |
Monthly Housing Cost Tiers in Beauregard Parish
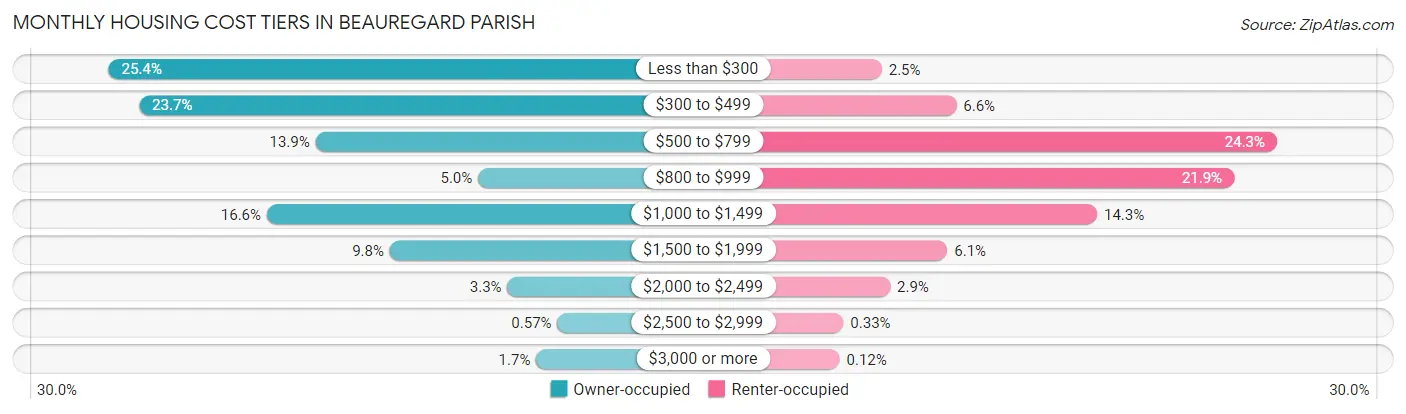
| Monthly Cost | Owner-occupied | Renter-occupied |
| Less than $300 | 2,836 (25.4%) | 59 (2.5%) |
| $300 to $499 | 2,646 (23.7%) | 158 (6.6%) |
| $500 to $799 | 1,558 (13.9%) | 584 (24.3%) |
| $800 to $999 | 554 (5.0%) | 527 (21.9%) |
| $1,000 to $1,499 | 1,858 (16.6%) | 345 (14.3%) |
| $1,500 to $1,999 | 1,099 (9.8%) | 146 (6.1%) |
| $2,000 to $2,499 | 372 (3.3%) | 70 (2.9%) |
| $2,500 to $2,999 | 64 (0.6%) | 8 (0.3%) |
| $3,000 or more | 194 (1.7%) | 3 (0.1%) |
| Total | 11,181 (100.0%) | 2,406 (100.0%) |
Physical Housing Characteristics in Beauregard Parish
Housing Structures in Beauregard Parish
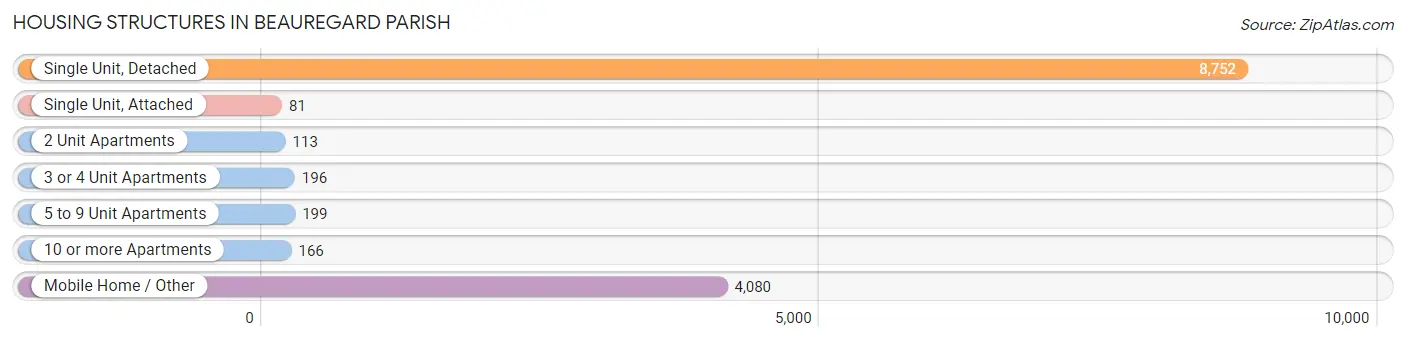
| Structure Type | # Housing Units | % Housing Units |
| Single Unit, Detached | 8,752 | 64.4% |
| Single Unit, Attached | 81 | 0.6% |
| 2 Unit Apartments | 113 | 0.8% |
| 3 or 4 Unit Apartments | 196 | 1.4% |
| 5 to 9 Unit Apartments | 199 | 1.5% |
| 10 or more Apartments | 166 | 1.2% |
| Mobile Home / Other | 4,080 | 30.0% |
| Total | 13,587 | 100.0% |
Housing Structures by Occupancy in Beauregard Parish
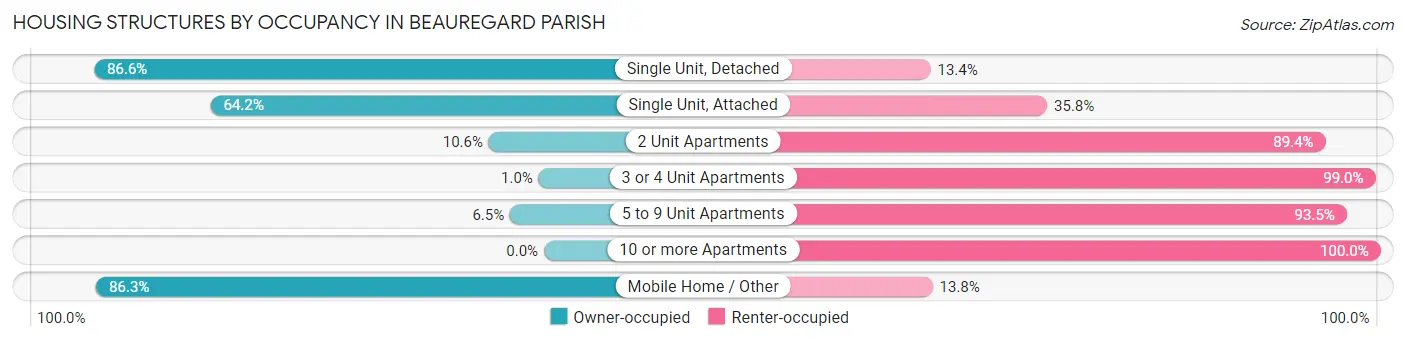
| Structure Type | Owner-occupied | Renter-occupied |
| Single Unit, Detached | 7,583 (86.6%) | 1,169 (13.4%) |
| Single Unit, Attached | 52 (64.2%) | 29 (35.8%) |
| 2 Unit Apartments | 12 (10.6%) | 101 (89.4%) |
| 3 or 4 Unit Apartments | 2 (1.0%) | 194 (99.0%) |
| 5 to 9 Unit Apartments | 13 (6.5%) | 186 (93.5%) |
| 10 or more Apartments | 0 (0.0%) | 166 (100.0%) |
| Mobile Home / Other | 3,519 (86.3%) | 561 (13.8%) |
| Total | 11,181 (82.3%) | 2,406 (17.7%) |
Housing Structures by Number of Rooms in Beauregard Parish
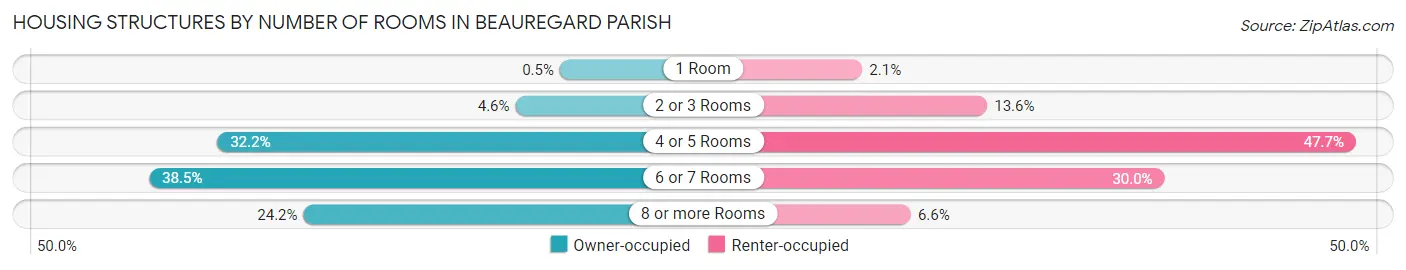
| Number of Rooms | Owner-occupied | Renter-occupied |
| 1 Room | 56 (0.5%) | 50 (2.1%) |
| 2 or 3 Rooms | 515 (4.6%) | 328 (13.6%) |
| 4 or 5 Rooms | 3,598 (32.2%) | 1,148 (47.7%) |
| 6 or 7 Rooms | 4,304 (38.5%) | 722 (30.0%) |
| 8 or more Rooms | 2,708 (24.2%) | 158 (6.6%) |
| Total | 11,181 (100.0%) | 2,406 (100.0%) |
Housing Structure by Heating Type in Beauregard Parish
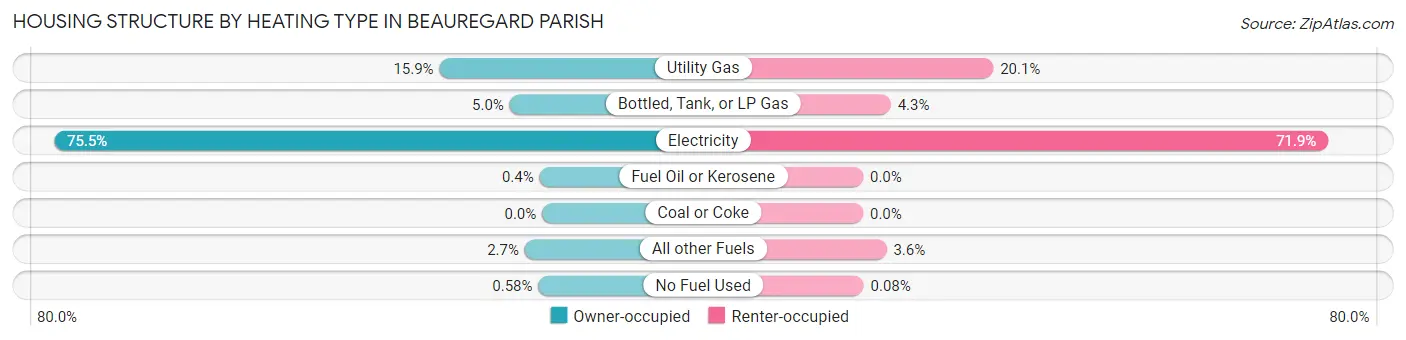
| Heating Type | Owner-occupied | Renter-occupied |
| Utility Gas | 1,774 (15.9%) | 484 (20.1%) |
| Bottled, Tank, or LP Gas | 560 (5.0%) | 103 (4.3%) |
| Electricity | 8,437 (75.5%) | 1,730 (71.9%) |
| Fuel Oil or Kerosene | 45 (0.4%) | 0 (0.0%) |
| Coal or Coke | 0 (0.0%) | 0 (0.0%) |
| All other Fuels | 300 (2.7%) | 87 (3.6%) |
| No Fuel Used | 65 (0.6%) | 2 (0.1%) |
| Total | 11,181 (100.0%) | 2,406 (100.0%) |
Household Vehicle Usage in Beauregard Parish
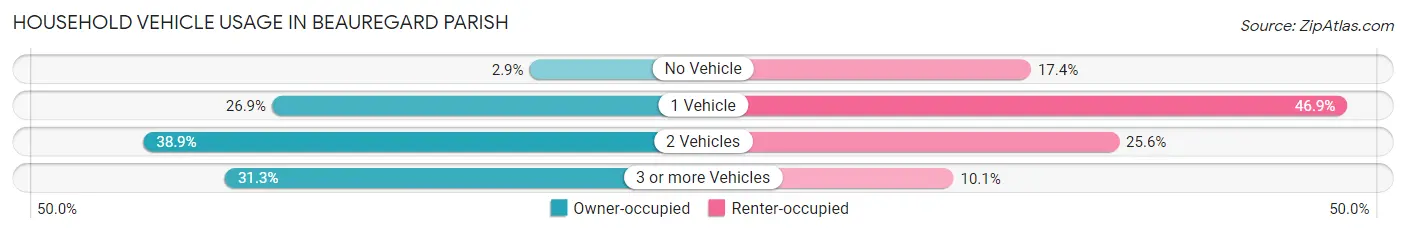
| Vehicles per Household | Owner-occupied | Renter-occupied |
| No Vehicle | 322 (2.9%) | 418 (17.4%) |
| 1 Vehicle | 3,010 (26.9%) | 1,128 (46.9%) |
| 2 Vehicles | 4,350 (38.9%) | 616 (25.6%) |
| 3 or more Vehicles | 3,499 (31.3%) | 244 (10.1%) |
| Total | 11,181 (100.0%) | 2,406 (100.0%) |
Real Estate & Mortgages in Beauregard Parish
Real Estate and Mortgage Overview in Beauregard Parish
| Characteristic | Without Mortgage | With Mortgage |
| Housing Units | 6,480 | 4,701 |
| Median Property Value | $100,700 | $194,800 |
| Median Household Income | $57,065 | $1,082 |
| Monthly Housing Costs | $321 | $194 |
| Real Estate Taxes | $259 | $1,337 |
Property Value by Mortgage Status in Beauregard Parish
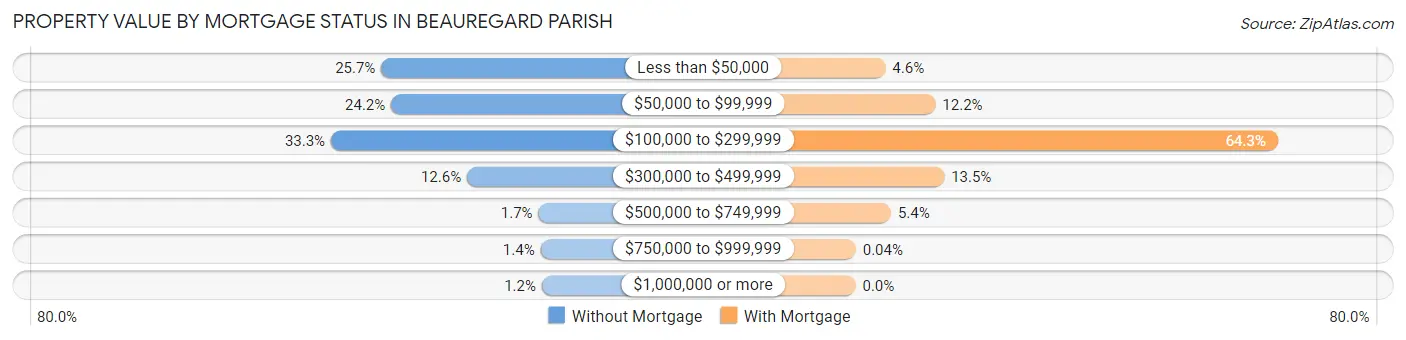
| Property Value | Without Mortgage | With Mortgage |
| Less than $50,000 | 1,663 (25.7%) | 214 (4.5%) |
| $50,000 to $99,999 | 1,565 (24.1%) | 572 (12.2%) |
| $100,000 to $299,999 | 2,159 (33.3%) | 3,024 (64.3%) |
| $300,000 to $499,999 | 816 (12.6%) | 635 (13.5%) |
| $500,000 to $749,999 | 110 (1.7%) | 254 (5.4%) |
| $750,000 to $999,999 | 90 (1.4%) | 2 (0.0%) |
| $1,000,000 or more | 77 (1.2%) | 0 (0.0%) |
| Total | 6,480 (100.0%) | 4,701 (100.0%) |
Household Income by Mortgage Status in Beauregard Parish
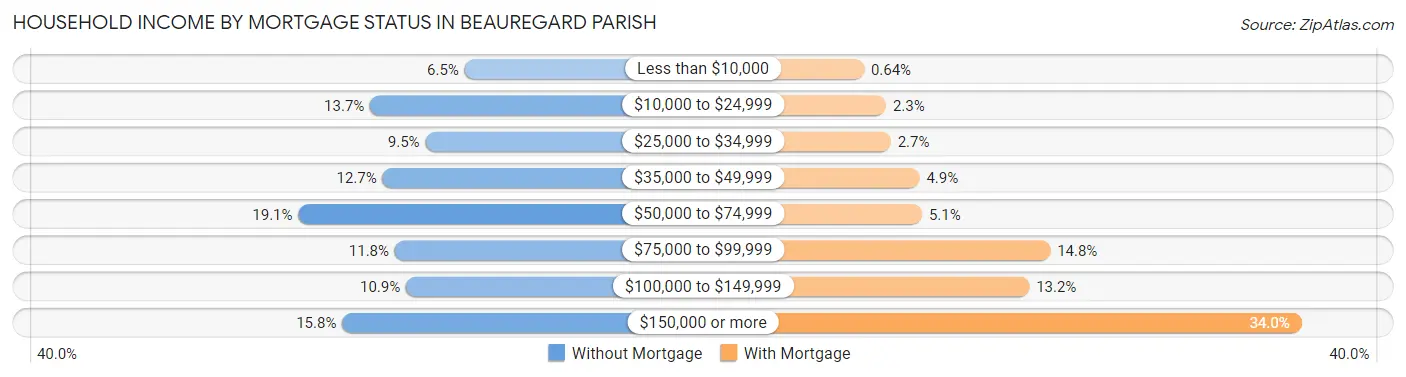
| Household Income | Without Mortgage | With Mortgage |
| Less than $10,000 | 419 (6.5%) | 30 (0.6%) |
| $10,000 to $24,999 | 886 (13.7%) | 109 (2.3%) |
| $25,000 to $34,999 | 613 (9.5%) | 126 (2.7%) |
| $35,000 to $49,999 | 825 (12.7%) | 229 (4.9%) |
| $50,000 to $74,999 | 1,240 (19.1%) | 238 (5.1%) |
| $75,000 to $99,999 | 764 (11.8%) | 697 (14.8%) |
| $100,000 to $149,999 | 709 (10.9%) | 622 (13.2%) |
| $150,000 or more | 1,024 (15.8%) | 1,598 (34.0%) |
| Total | 6,480 (100.0%) | 4,701 (100.0%) |
Property Value to Household Income Ratio in Beauregard Parish
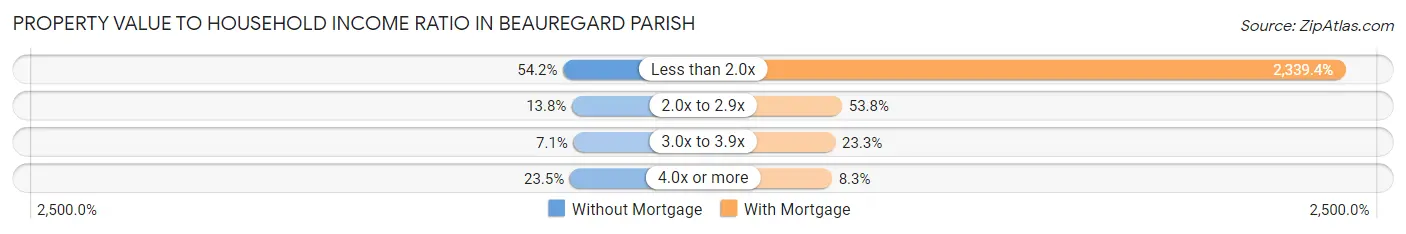
| Value-to-Income Ratio | Without Mortgage | With Mortgage |
| Less than 2.0x | 3,515 (54.2%) | 109,975 (2,339.4%) |
| 2.0x to 2.9x | 895 (13.8%) | 2,527 (53.7%) |
| 3.0x to 3.9x | 457 (7.0%) | 1,097 (23.3%) |
| 4.0x or more | 1,521 (23.5%) | 388 (8.3%) |
| Total | 6,480 (100.0%) | 4,701 (100.0%) |
Real Estate Taxes by Mortgage Status in Beauregard Parish
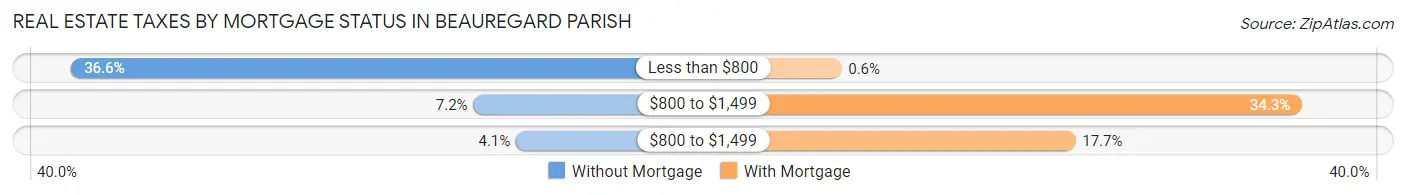
| Property Taxes | Without Mortgage | With Mortgage |
| Less than $800 | 2,371 (36.6%) | 28 (0.6%) |
| $800 to $1,499 | 467 (7.2%) | 1,611 (34.3%) |
| $800 to $1,499 | 265 (4.1%) | 832 (17.7%) |
| Total | 6,480 (100.0%) | 4,701 (100.0%) |
Health & Disability in Beauregard Parish
Health Insurance Coverage by Age in Beauregard Parish
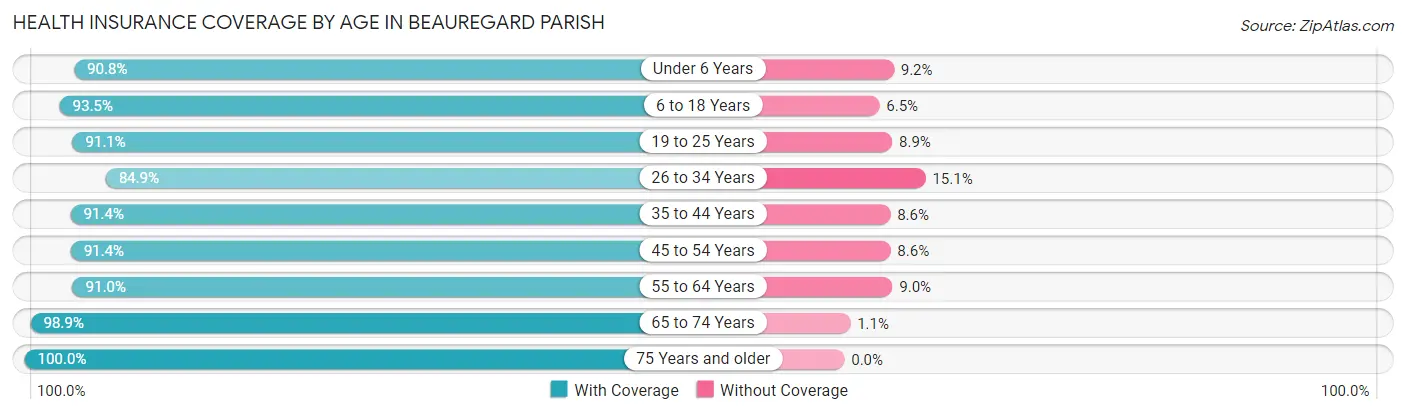
| Age Bracket | With Coverage | Without Coverage |
| Under 6 Years | 2,664 (90.8%) | 271 (9.2%) |
| 6 to 18 Years | 6,318 (93.5%) | 442 (6.5%) |
| 19 to 25 Years | 2,483 (91.1%) | 243 (8.9%) |
| 26 to 34 Years | 3,677 (84.9%) | 656 (15.1%) |
| 35 to 44 Years | 3,982 (91.4%) | 373 (8.6%) |
| 45 to 54 Years | 4,030 (91.4%) | 379 (8.6%) |
| 55 to 64 Years | 4,145 (91.0%) | 408 (9.0%) |
| 65 to 74 Years | 3,429 (98.9%) | 38 (1.1%) |
| 75 Years and older | 2,113 (100.0%) | 0 (0.0%) |
| Total | 32,841 (92.1%) | 2,810 (7.9%) |
Health Insurance Coverage by Citizenship Status in Beauregard Parish
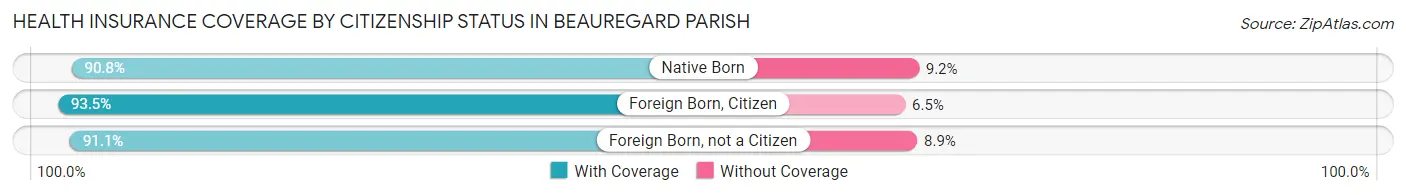
| Citizenship Status | With Coverage | Without Coverage |
| Native Born | 2,664 (90.8%) | 271 (9.2%) |
| Foreign Born, Citizen | 6,318 (93.5%) | 442 (6.5%) |
| Foreign Born, not a Citizen | 2,483 (91.1%) | 243 (8.9%) |
Health Insurance Coverage by Household Income in Beauregard Parish
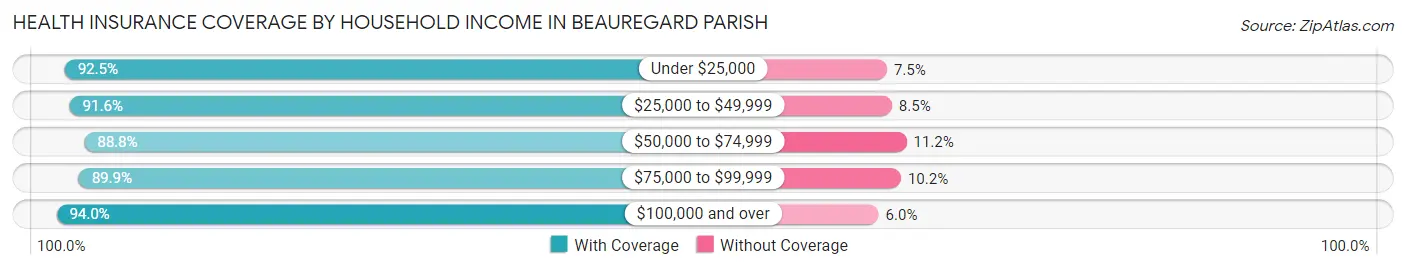
| Household Income | With Coverage | Without Coverage |
| Under $25,000 | 4,039 (92.5%) | 329 (7.5%) |
| $25,000 to $49,999 | 5,106 (91.5%) | 471 (8.5%) |
| $50,000 to $74,999 | 4,621 (88.8%) | 582 (11.2%) |
| $75,000 to $99,999 | 4,426 (89.8%) | 500 (10.2%) |
| $100,000 and over | 14,616 (94.0%) | 928 (6.0%) |
Public vs Private Health Insurance Coverage by Age in Beauregard Parish
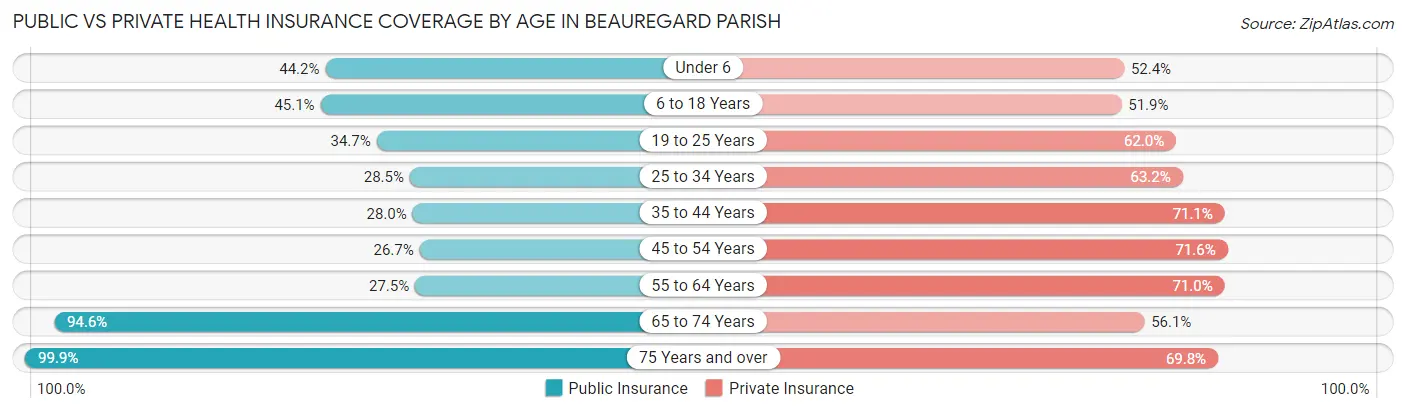
| Age Bracket | Public Insurance | Private Insurance |
| Under 6 | 1,297 (44.2%) | 1,537 (52.4%) |
| 6 to 18 Years | 3,048 (45.1%) | 3,507 (51.9%) |
| 19 to 25 Years | 945 (34.7%) | 1,691 (62.0%) |
| 25 to 34 Years | 1,235 (28.5%) | 2,740 (63.2%) |
| 35 to 44 Years | 1,219 (28.0%) | 3,095 (71.1%) |
| 45 to 54 Years | 1,177 (26.7%) | 3,156 (71.6%) |
| 55 to 64 Years | 1,253 (27.5%) | 3,234 (71.0%) |
| 65 to 74 Years | 3,278 (94.6%) | 1,946 (56.1%) |
| 75 Years and over | 2,111 (99.9%) | 1,475 (69.8%) |
| Total | 15,563 (43.6%) | 22,381 (62.8%) |
Disability Status by Sex by Age in Beauregard Parish
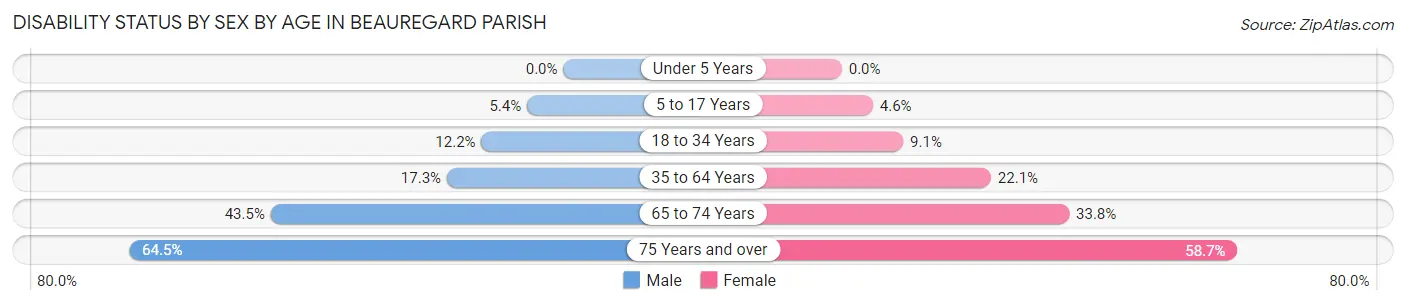
| Age Bracket | Male | Female |
| Under 5 Years | 0 (0.0%) | 0 (0.0%) |
| 5 to 17 Years | 190 (5.4%) | 146 (4.6%) |
| 18 to 34 Years | 496 (12.2%) | 322 (9.1%) |
| 35 to 64 Years | 1,140 (17.3%) | 1,488 (22.1%) |
| 65 to 74 Years | 707 (43.4%) | 621 (33.8%) |
| 75 Years and over | 617 (64.5%) | 679 (58.7%) |
Disability Class by Sex by Age in Beauregard Parish
Disability Class: Hearing Difficulty
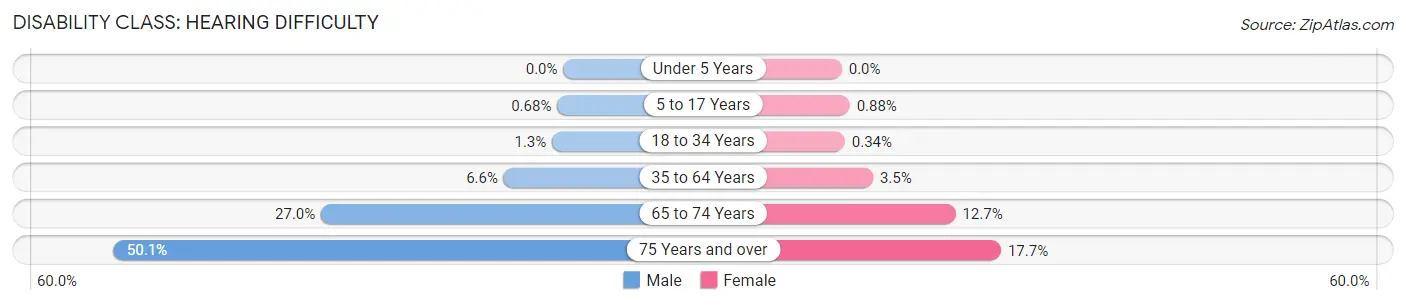
| Age Bracket | Male | Female |
| Under 5 Years | 0 (0.0%) | 0 (0.0%) |
| 5 to 17 Years | 24 (0.7%) | 28 (0.9%) |
| 18 to 34 Years | 51 (1.3%) | 12 (0.3%) |
| 35 to 64 Years | 437 (6.6%) | 233 (3.5%) |
| 65 to 74 Years | 439 (27.0%) | 233 (12.7%) |
| 75 Years and over | 479 (50.0%) | 205 (17.7%) |
Disability Class: Vision Difficulty
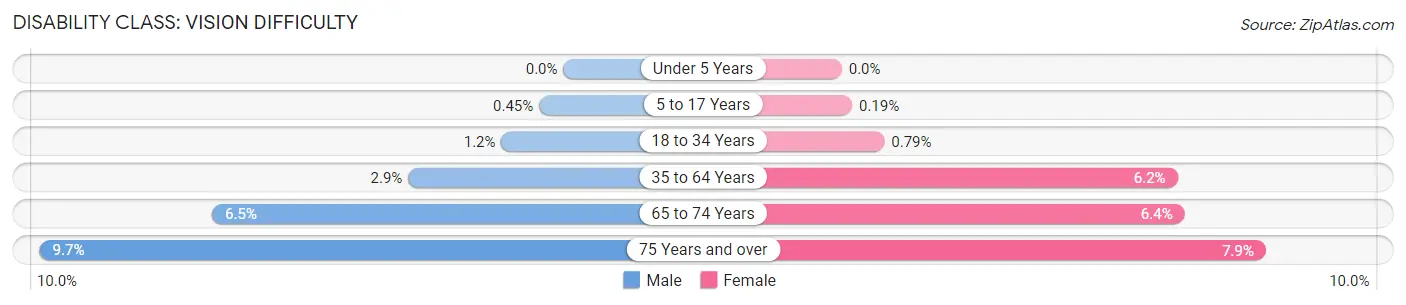
| Age Bracket | Male | Female |
| Under 5 Years | 0 (0.0%) | 0 (0.0%) |
| 5 to 17 Years | 16 (0.4%) | 6 (0.2%) |
| 18 to 34 Years | 47 (1.1%) | 28 (0.8%) |
| 35 to 64 Years | 190 (2.9%) | 419 (6.2%) |
| 65 to 74 Years | 106 (6.5%) | 117 (6.4%) |
| 75 Years and over | 93 (9.7%) | 91 (7.9%) |
Disability Class: Cognitive Difficulty
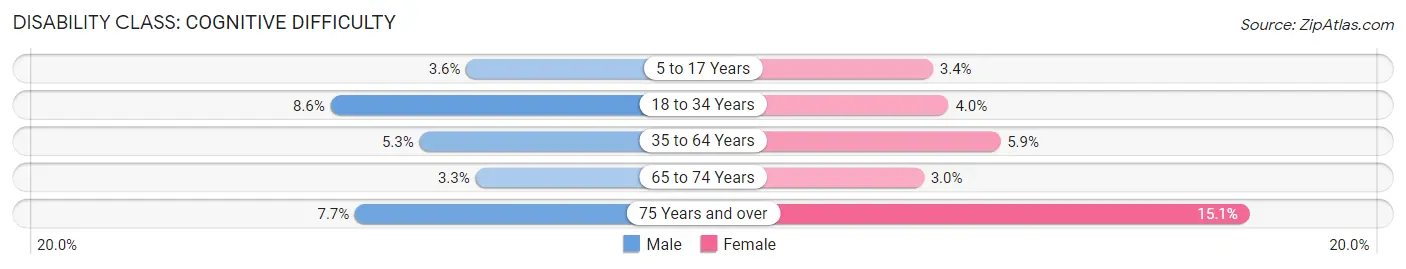
| Age Bracket | Male | Female |
| 5 to 17 Years | 127 (3.6%) | 107 (3.4%) |
| 18 to 34 Years | 352 (8.6%) | 140 (4.0%) |
| 35 to 64 Years | 352 (5.3%) | 395 (5.9%) |
| 65 to 74 Years | 53 (3.3%) | 56 (3.0%) |
| 75 Years and over | 74 (7.7%) | 175 (15.1%) |
Disability Class: Ambulatory Difficulty
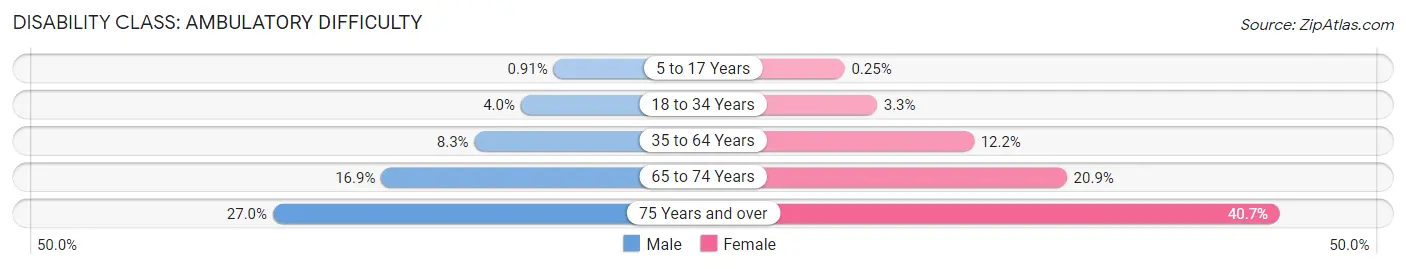
| Age Bracket | Male | Female |
| 5 to 17 Years | 32 (0.9%) | 8 (0.3%) |
| 18 to 34 Years | 161 (4.0%) | 115 (3.3%) |
| 35 to 64 Years | 544 (8.3%) | 823 (12.2%) |
| 65 to 74 Years | 275 (16.9%) | 384 (20.9%) |
| 75 Years and over | 258 (27.0%) | 470 (40.7%) |
Disability Class: Self-Care Difficulty
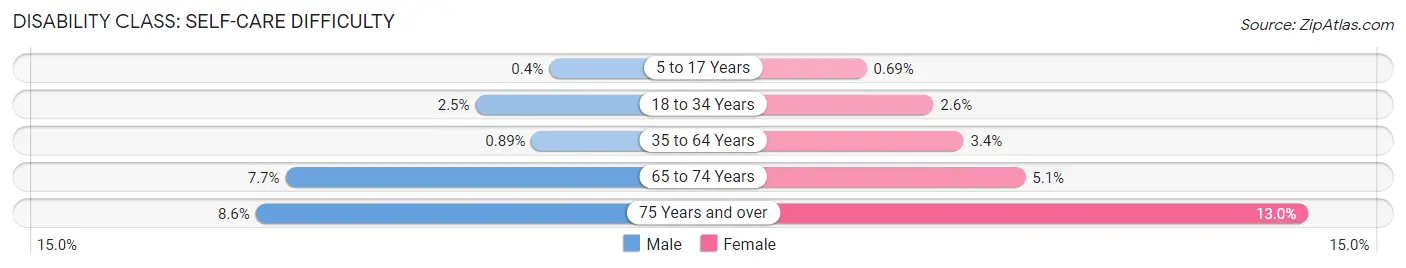
| Age Bracket | Male | Female |
| 5 to 17 Years | 14 (0.4%) | 22 (0.7%) |
| 18 to 34 Years | 100 (2.5%) | 90 (2.5%) |
| 35 to 64 Years | 59 (0.9%) | 228 (3.4%) |
| 65 to 74 Years | 126 (7.7%) | 94 (5.1%) |
| 75 Years and over | 82 (8.6%) | 150 (13.0%) |
Technology Access in Beauregard Parish
Computing Device Access in Beauregard Parish
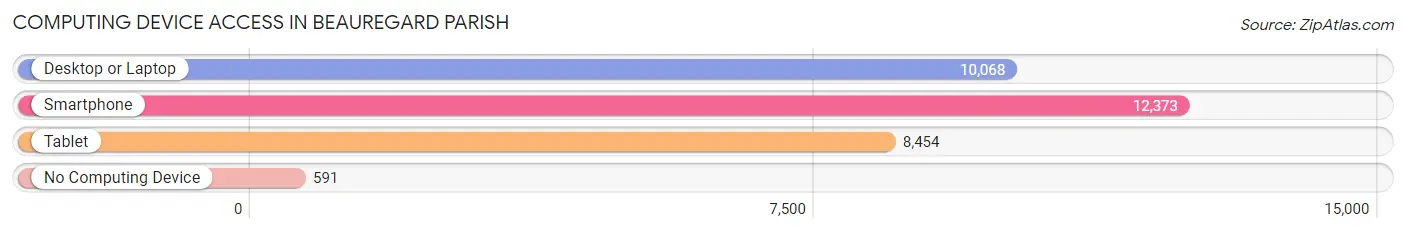
| Device Type | # Households | % Households |
| Desktop or Laptop | 10,068 | 74.1% |
| Smartphone | 12,373 | 91.1% |
| Tablet | 8,454 | 62.2% |
| No Computing Device | 591 | 4.3% |
| Total | 13,587 | 100.0% |
Internet Access in Beauregard Parish
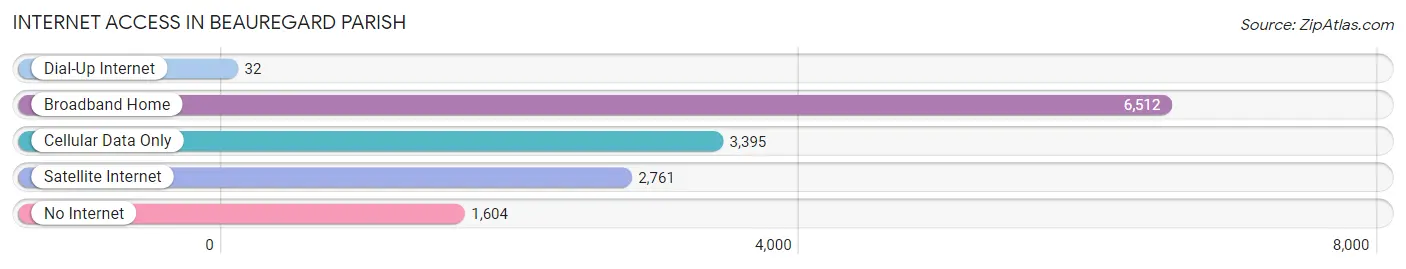
| Internet Type | # Households | % Households |
| Dial-Up Internet | 32 | 0.2% |
| Broadband Home | 6,512 | 47.9% |
| Cellular Data Only | 3,395 | 25.0% |
| Satellite Internet | 2,761 | 20.3% |
| No Internet | 1,604 | 11.8% |
| Total | 13,587 | 100.0% |
Beauregard Parish Summary
Beauregard Parish is located in the southwestern corner of Louisiana, and is part of the Lake Charles Metropolitan Statistical Area. The parish was created in 1912 from parts of Calcasieu and Vernon parishes. It is named for Confederate General P.G.T. Beauregard, who was born in St. Bernard Parish, Louisiana. The parish seat is DeRidder, and the largest city is DeRidder.
Geography
Beauregard Parish is located in the southwestern corner of Louisiana, and is bordered by Vernon Parish to the north, Calcasieu Parish to the east, and Sabine Parish to the south. The parish has a total area of 845 square miles, of which 843 square miles is land and 2 square miles (0.2%) is water. The parish is located in the East Gulf Coastal Plain region of Louisiana, and is mostly flat with some rolling hills. The Sabine River forms the western boundary of the parish.
Demographics
As of the 2010 census, Beauregard Parish had a population of 35,654. The racial makeup of the parish was 79.2% White, 17.3% African American, 0.5% Native American, 0.4% Asian, 0.1% Pacific Islander, 1.2% from other races, and 1.3% from two or more races. Hispanic or Latino of any race were 3.2% of the population.
Economy
Beauregard Parish is a rural parish with a largely agricultural economy. The main crops grown in the parish are cotton, soybeans, corn, and wheat. The parish is also home to several timber companies, and the timber industry is a major employer in the area.
The parish is also home to several oil and gas companies, and the oil and gas industry is a major contributor to the local economy. The parish is also home to several manufacturing companies, including a paper mill and a chemical plant.
The parish is home to several military installations, including Fort Polk, which is the largest military installation in the state. The military is a major employer in the parish, and provides a significant economic boost to the local economy.
History
Beauregard Parish was created in 1912 from parts of Calcasieu and Vernon parishes. The parish was named for Confederate General P.G.T. Beauregard, who was born in St. Bernard Parish, Louisiana.
The parish was largely rural until the 1940s, when the construction of Fort Polk began. The military base brought an influx of people to the area, and the population of the parish began to grow.
In the 1950s, the oil and gas industry began to take off in the parish, and the economy began to diversify. The timber industry also began to grow in the parish, and the timber industry is still a major employer in the area.
In the 1960s, the parish began to experience population growth due to the growth of the oil and gas industry. The population of the parish has continued to grow since then, and the parish is now home to several large cities and towns.
Common Questions
What is Per Capita Income in Beauregard Parish?
Per Capita income in Beauregard Parish is $33,582.
What is the Median Family Income in Beauregard Parish?
Median Family Income in Beauregard Parish is $82,550.
What is the Median Household income in Beauregard Parish?
Median Household Income in Beauregard Parish is $68,525.
What is Income or Wage Gap in Beauregard Parish?
Income or Wage Gap in Beauregard Parish is 60.6%.
Women in Beauregard Parish earn 39.4 cents for every dollar earned by a man.
What is Family Income Deficit in Beauregard Parish?
Family Income Deficit in Beauregard Parish is $10,256.
Families that are below poverty line in Beauregard Parish earn $10,256 less on average than the poverty threshold level.
What is Inequality or Gini Index in Beauregard Parish?
Inequality or Gini Index in Beauregard Parish is 0.42.
What is the Total Population of Beauregard Parish?
Total Population of Beauregard Parish is 36,553.
What is the Total Male Population of Beauregard Parish?
Total Male Population of Beauregard Parish is 18,747.
What is the Total Female Population of Beauregard Parish?
Total Female Population of Beauregard Parish is 17,806.
What is the Ratio of Males per 100 Females in Beauregard Parish?
There are 105.28 Males per 100 Females in Beauregard Parish.
What is the Ratio of Females per 100 Males in Beauregard Parish?
There are 94.98 Females per 100 Males in Beauregard Parish.
What is the Median Population Age in Beauregard Parish?
Median Population Age in Beauregard Parish is 37.3 Years.
What is the Average Family Size in Beauregard Parish
Average Family Size in Beauregard Parish is 3.1 People.
What is the Average Household Size in Beauregard Parish
Average Household Size in Beauregard Parish is 2.6 People.
How Large is the Labor Force in Beauregard Parish?
There are 16,143 People in the Labor Forcein in Beauregard Parish.
What is the Percentage of People in the Labor Force in Beauregard Parish?
56.9% of People are in the Labor Force in Beauregard Parish.
What is the Unemployment Rate in Beauregard Parish?
Unemployment Rate in Beauregard Parish is 8.1%.