Zip Codes with the Highest Percentage of Population with a Degree in Science and Engineering in Lawrence, KS
RELATED REPORTS & OPTIONS
Science and Engineering
Lawrence
Compare Zip Codes
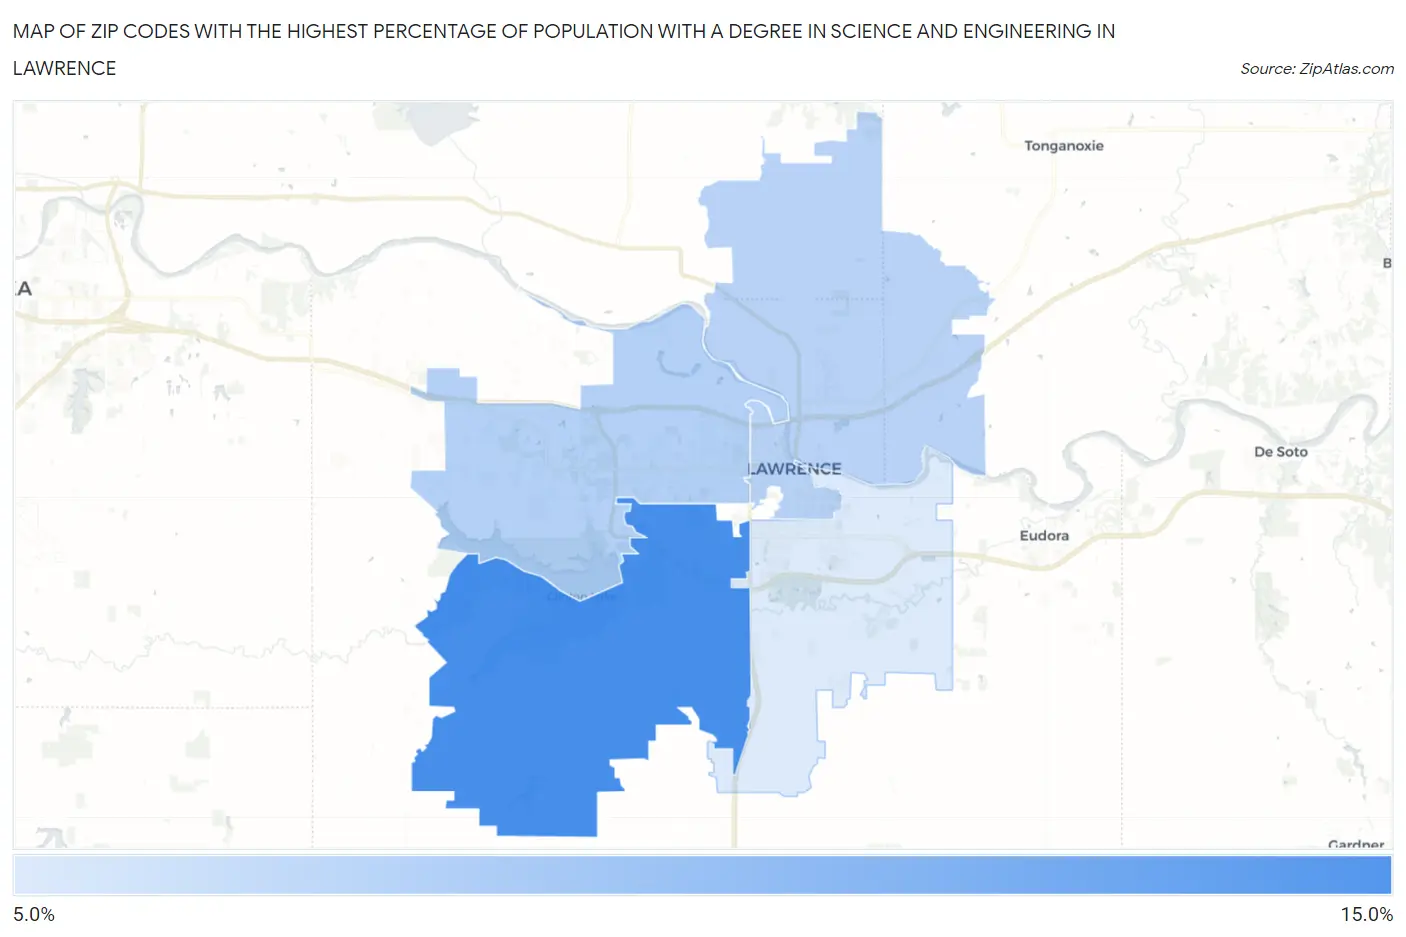
Map of Zip Codes with the Highest Percentage of Population with a Degree in Science and Engineering in Lawrence
5.9%
13.7%
Zip Codes with the Highest Percentage of Population with a Degree in Science and Engineering in Lawrence, KS
| Zip Code | % Graduates | vs State | vs National | |
| 1. | 66047 | 13.7% | 11.1%(+2.62)#215 | 9.8%(+3.97)#8,191 |
| 2. | 66049 | 8.1% | 11.1%(-3.08)#410 | 9.8%(-1.73)#19,515 |
| 3. | 66044 | 7.8% | 11.1%(-3.30)#420 | 9.8%(-1.95)#20,028 |
| 4. | 66046 | 5.9% | 11.1%(-5.20)#472 | 9.8%(-3.85)#23,542 |
1
Common Questions
What are the Top 3 Zip Codes with the Highest Percentage of Population with a Degree in Science and Engineering in Lawrence, KS?
Top 3 Zip Codes with the Highest Percentage of Population with a Degree in Science and Engineering in Lawrence, KS are:
What zip code has the Highest Percentage of Population with a Degree in Science and Engineering in Lawrence, KS?
66047 has the Highest Percentage of Population with a Degree in Science and Engineering in Lawrence, KS with 13.7%.
What is the Percentage of Population with a Degree in Science and Engineering in Lawrence, KS?
Percentage of Population with a Degree in Science and Engineering in Lawrence is 8.9%.
What is the Percentage of Population with a Degree in Science and Engineering in Kansas?
Percentage of Population with a Degree in Science and Engineering in Kansas is 11.1%.
What is the Percentage of Population with a Degree in Science and Engineering in the United States?
Percentage of Population with a Degree in Science and Engineering in the United States is 9.8%.